Countdown to your final Maths exam part 8 (2017) Examiners Report & Markscheme
|
|
|
- Chad Flowers
- 5 years ago
- Views:
Transcription
 Examiners Report &")
1 Countdown to your final Maths exam part 8 (2017) Examiners Report & Markscheme
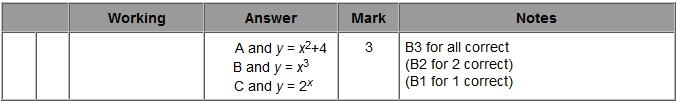
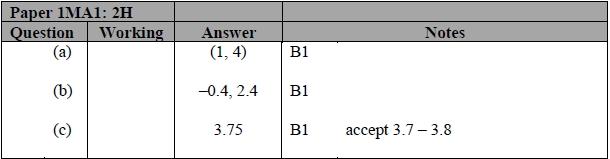
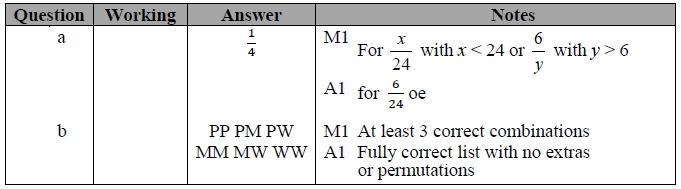
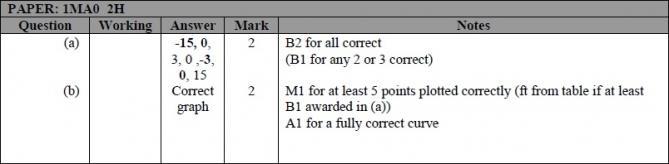
2 Examiner's Report Q1. Most candidates made good attempts at this final question. A small number of candidates scored one mark for getting at least one value in the table correct but then not plotting at least five of their points correctly. The most common error in completing the table was to write 5 instead of 5 for the value of y when x was 3. Most candidates were able to plot their points from the table accurately to gain one mark in part (b). Many went on to draw a correct curve to gain the second mark and in some cases recovered from incorrect values in the table. Around a third of the candidates scored all four marks with many of the candidates who scored three marks either failing to join their correctly plotted points or joining their points with straight lines. Results Plus: Examiner Tip Candidates should know that a quadratic expression gives rise to a parabola. In part (a), many calculated the y-value to be 5 when x was 3. This resulted in a curve that was clearly not a parabola. This should have alerted candidates to realise they had made an incorrect calculation. Q2. Most candidates scored at least one mark for their attempts to complete the table of values in part (a). ( 1. 7) was the most common error but full marks were still available in part (b) for accurate plotting and drawing of a smooth quadratic curve. Unfortunately many failed to secure both marks in part (b), usually through drawing a line segment between the points (2, 3) and (3, 3). Some candidates were very lazy in their curve drawing and many curves did not pass through their plotted points accurately enough. In part (c), many candidates chose not to use their graph and solved the quadratic equation by an alternative method. Although the correct solutions here did gain full marks, many made mistakes in the application of their method. It should be noted that for those candidates whose graph was more of a cubic form, ALL solutions (if not fully correct) were required. Q3. This question was not well answered. The majority of candidates had little idea of the general shapes of the curves detailed in the specification. Curve A, y = x 2 + 4, was the most successful match. Some candidates did not seem to recognise the equation of the exponential curve and wrote y = 2x instead of y = 2 x. Commonly, there were attempts to plot graphs of the given equations, but this approach was not generally successful. Q4. This question on completing a table of values, plotting a quadratic graph and then using the graph to solve a quadratic equation discriminated very well. Almost all students were able to score at least one or two marks, usually for partially completing the table and plotting their values. In part (b) many students drew straight lines to give a flat topped curve which lead to the loss of a mark. Only the most able students were able to give the correct two solutions to the quadratic equation with many giving the solution to 6 x x 2 = 0 rather than 6 x x 2 = 2 Q5. No Examiner's Report available for this question Q6. No Examiner's Report available for this question Q7. Some good answers in this question, with many gaining at least 2 marks. Q8. Many correct answers to this question. The only common error in completing the table was use of 15 instead of 15. Plotting was good, though an opportunity to correct errors in the table were lost due to the failure to anticipate the correct shape of the graph. There were many errors in joining the points, with many using straight line segments or curves which missed joining the points. Q9. No Examiner's Report available for this question Q10. No Examiner's Report available for this question Q11. Over one third of students recognised the transformation as an enlargment and gave the correct scale factor but correct identification of the centre of enlargement was very rare indeed. Many students lost marks
3 through giving multiple transformations as answers, mostly in an attempt to give information about the position of the image in the absence of a centre of enlargment. Typically, a translation was described or vector given. Q12. Many fully correct enlargements were seen and those candidates who didn't get full marks often gained two marks for an enlargement with scale factor 3 but in the wrong position. A substantial number of candidates did not seem to understand the significance of the centre of enlargement. A common wrong answer was to use the centre of enlargement as one of the vertices in the enlarged shape. Candidates using the ray method rather than 'counting squares' sometimes misplaced the vertices through inaccurate line drawing. It was disappointing to see some candidates lose marks through carelessness and be up to half a square out with some of their vertices. Q13. The most common method used that lead to the correct answer was to enlarge the triangle and then find the area of the enlarged triangle. It was, however, disappointing to see many candidates successfully enlarge the triangle and then fail to find its area. Those candidates who started with the area of the given triangle invariably divided by 2 rather than (2) 2 to find the area of the enlarged triangle. It was very rare indeed to see the area scale factor being used. Equally disappointing was the number of candidates who tried and failed to find the correct area of the given triangle. A significant number of students who drew the enlarged triangle did not understand that a scale factor of ½ would result in a smaller triangle.


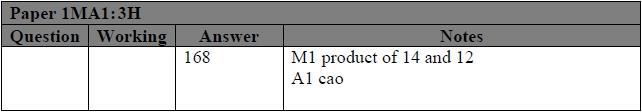
4 Mark Scheme Q1. Q2. Q3. Q4. Q5. Q6.

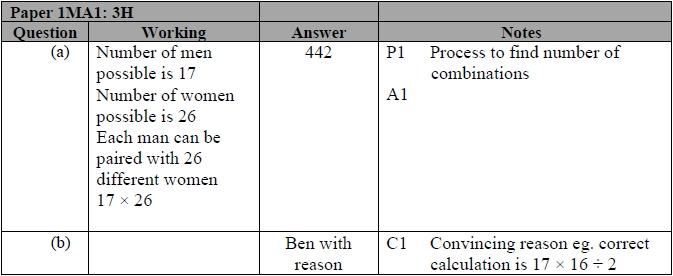
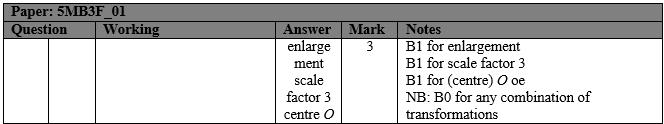
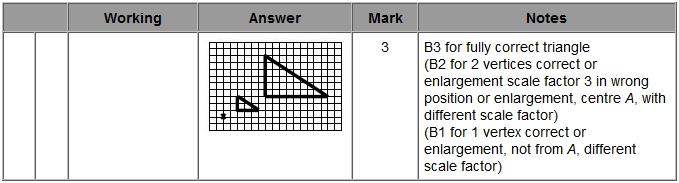
5 Q7. Q8. Q9. Q10. Q11. Q12.
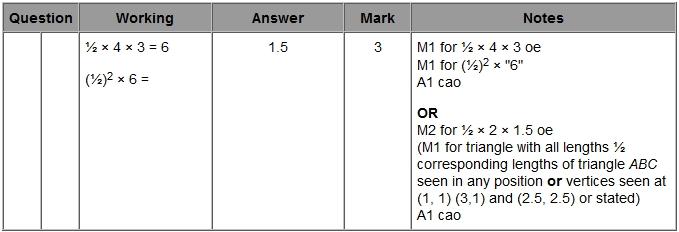
6 Q13.
GRAPHS AND GRAPHICAL SOLUTION OF EQUATIONS
 GRAPHS AND GRAPHICAL SOLUTION OF EQUATIONS 1.1 DIFFERENT TYPES AND SHAPES OF GRAPHS: A graph can be drawn to represent are equation connecting two variables. There are different tpes of equations which
Time: 1 hour 30 minutes
 Paper Reference(s) 666/0 Edecel GCE Core Mathematics C Bronze Level B Time: hour 0 minutes Materials required for eamination Mathematical Formulae (Green) Items included with question papers Nil Candidates
Higher Unit 5a topic test
 Name: Higher Unit 5a topic test Date: Time: 50 minutes Total marks available: 49 Total marks achieved: Questions Q1. (i) Find the size of the angle marked x.... (ii) Give a reason for your answer.... (Total
Chapter 12: Quadratic and Cubic Graphs
 Chapter 12: Quadratic and Cubic Graphs Section 12.1 Quadratic Graphs x 2 + 2 a 2 + 2a - 6 r r 2 x 2 5x + 8 2y 2 + 9y + 2 All the above equations contain a squared number. They are therefore called quadratic
Exemplar for Internal Achievement Standard. Mathematics and Statistics Level 1
 Exemplar for Internal Achievement Standard Mathematics and Statistics Level 1 This exemplar supports assessment against: Achievement Standard (2.2) Apply graphical methods in solving problems An annotated
5.1 Introduction to the Graphs of Polynomials
 Math 3201 5.1 Introduction to the Graphs of Polynomials In Math 1201/2201, we examined three types of polynomial functions: Constant Function - horizontal line such as y = 2 Linear Function - sloped line,
Section 4.4: Parabolas
 Objective: Graph parabolas using the vertex, x-intercepts, and y-intercept. Just as the graph of a linear equation y mx b can be drawn, the graph of a quadratic equation y ax bx c can be drawn. The graph
PhysicsAndMathsTutor.com
 C Differentiation: Tangents & Normals. y A C R P O Q The diagram above shows part of the curve C with equation y = 6 + 8. The curve meets the y-ais at the point A and has a minimum at the point P. (a)
a 2 + 2a - 6 r r 2 To draw quadratic graphs, we shall be using the method we used for drawing the straight line graphs.
 Chapter 12: Section 12.1 Quadratic Graphs x 2 + 2 a 2 + 2a - 6 r r 2 x 2 5x + 8 2 2 + 9 + 2 All the above equations contain a squared number. The are therefore called quadratic expressions or quadratic
Algebra II Quadratic Functions
 1 Algebra II Quadratic Functions 2014-10-14 www.njctl.org 2 Ta b le o f C o n te n t Key Terms click on the topic to go to that section Explain Characteristics of Quadratic Functions Combining Transformations
AP PHYSICS B 2009 SCORING GUIDELINES
 AP PHYSICS B 009 SCORING GUIDELINES General Notes About 009 AP Physics Scoring Guidelines 1. The solutions contain the most common method of solving the free-response questions and the allocation of points
GRAPHING WORKSHOP. A graph of an equation is an illustration of a set of points whose coordinates satisfy the equation.
 GRAPHING WORKSHOP A graph of an equation is an illustration of a set of points whose coordinates satisfy the equation. The figure below shows a straight line drawn through the three points (2, 3), (-3,-2),
Section 18-1: Graphical Representation of Linear Equations and Functions
 Section 18-1: Graphical Representation of Linear Equations and Functions Prepare a table of solutions and locate the solutions on a coordinate system: f(x) = 2x 5 Learning Outcome 2 Write x + 3 = 5 as
Yimin Math Centre. Year 10 Term 2 Homework. 3.1 Graphs in the number plane The minimum and maximum value of a quadratic function...
 Year 10 Term 2 Homework Student Name: Grade: Date: Score: Table of contents 3 Year 10 Term 2 Week 3 Homework 1 3.1 Graphs in the number plane................................. 1 3.1.1 The parabola....................................
Wednesday 18 May 2016 Morning
 Oxford Cambridge and RSA Wednesday 18 May 016 Morning AS GCE MATHEMATICS (MEI) 4751/01 Introduction to Advanced Mathematics (C1) QUESTION PAPER * 6 8 8 5 4 5 4 4 * Candidates answer on the Printed Answer
Worksheet on Line Symmetry & Rotational Symmetry
 Gr. 9 Math 8. - 8.7 Worksheet on Line Smmetr & Rotational Smmetr Multiple Choice Identif the choice that best completes the statement or answers the question.. Which shapes have at least lines of smmetr?
3x 4y 2. 3y 4. Math 65 Weekly Activity 1 (50 points) Name: Simplify the following expressions. Make sure to use the = symbol appropriately.
 Name: Simplify the following expressions. Make sure to use the = symbol appropriately.") Math 65 Weekl Activit 1 (50 points) Name: Simplif the following epressions. Make sure to use the = smbol appropriatel. Due (1) (a) - 4 (b) ( - ) 4 () 8 + 5 6 () 1 5 5 Evaluate the epressions when = - and
Math 65 Weekl Activit 1 (50 points) Name: Simplif the following epressions. Make sure to use the = smbol appropriatel. Due (1) (a) - 4 (b) ( - ) 4 () 8 + 5 6 () 1 5 5 Evaluate the epressions when = - and
Paper 23- Shape- Geometric Reasoning- (26 marks) Question Paper Q1. Diagram NOT accurately drawn
 Question Paper Q1. Diagram NOT accurately drawn") Paper 23- Shape- Geometric Reasoning- (26 marks) Question Paper Q1. ABC and DEF are parallel lines. BEG is a straight line. Angle GEF = 47. Work out the size of the angle marked x. Give reasons for your
Paper 23- Shape- Geometric Reasoning- (26 marks) Question Paper Q1. ABC and DEF are parallel lines. BEG is a straight line. Angle GEF = 47. Work out the size of the angle marked x. Give reasons for your
The exam begins at 2:40pm and ends at 4:00pm. You must turn your exam in when time is announced or risk not having it accepted.
 CS 184: Foundations of Computer Graphics page 1 of 12 Student Name: Student ID: Instructions: Read them carefully! The exam begins at 2:40pm and ends at 4:00pm. You must turn your exam in when time is
Unit 3, Lesson 3.1 Creating and Graphing Equations Using Standard Form
 Unit 3, Lesson 3.1 Creating and Graphing Equations Using Standard Form Imagine the path of a basketball as it leaves a player s hand and swooshes through the net. Or, imagine the path of an Olympic diver
Describe Plane Shapes
 Lesson 12.1 Describe Plane Shapes You can use math words to describe plane shapes. point an exact position or location line endpoints line segment ray a straight path that goes in two directions without
UNIT 3 EXPRESSIONS AND EQUATIONS Lesson 3: Creating Quadratic Equations in Two or More Variables
 Guided Practice Example 1 Find the y-intercept and vertex of the function f(x) = 2x 2 + x + 3. Determine whether the vertex is a minimum or maximum point on the graph. 1. Determine the y-intercept. The
Math 1525: Lab 4 Spring 2002
 Math 1525: Lab 4 Spring 2 Modeling---Best Fit Function: In this lab we will see how to use Excel to find a "best-fit equation" or model for your data. Example: When a new motion picture comes out, some
Unit 1 Day 4 Notes Piecewise Functions
 AFM Unit 1 Day 4 Notes Piecewise Functions Name Date We have seen many graphs that are expressed as single equations and are continuous over a domain of the Real numbers. We have also seen the "discrete"
UNIVERSITY OF MALTA THE MATRICULATION EXAMINATION ADVANCED LEVEL. COMPUTING May 2016 EXAMINERS REPORT
 UNIVERSITY OF MALTA THE MATRICULATION EXAMINATION ADVANCED LEVEL COMPUTING May 2016 EXAMINERS REPORT MATRICULATION AND SECONDARY EDUCATION CERTIFICATE EXAMINATIONS BOARD Computing Advanced Level May 2016
Year 11 Key Performance Indicators Maths (Number)
") Key Performance Indicators Maths (Number) M11.1 N1: Four operations with decimals and using the order of operations correctly. Solve problems using mathematical reasoning. Four rules of negative numbers
Key Performance Indicators Maths (Number) M11.1 N1: Four operations with decimals and using the order of operations correctly. Solve problems using mathematical reasoning. Four rules of negative numbers
Distance. Dollars. Reviewing gradient
 Gradient The gradient of a line is its slope. It is a very important feature of a line because it tells you how fast things are changing. Look at the graphs below to find the meaning of gradient in two
Higher tier unit 6a check in test. Calculator
 Higher tier unit 6a check in test Calculator Q1. The point A has coordinates (2, 3). The point B has coordinates (6, 8). M is the midpoint of the line AB. Find the coordinates of M. Q2. The points A, B
FUNCTIONS AND MODELS
 1 FUNCTIONS AND MODELS FUNCTIONS AND MODELS In this section, we assume that you have access to a graphing calculator or a computer with graphing software. FUNCTIONS AND MODELS 1.4 Graphing Calculators
Level 1 Mathematics and Statistics, 2014
 91031 910310 1SUPERVISOR S Level 1 Mathematics and Statistics, 2014 91031 Apply geometric reasoning in solving problems 9.30 am Tuesday 18 November 2014 Credits: Four Achievement Achievement with Merit
Markscheme May 2017 Mathematical studies Standard level Paper 1
 M17/5/MATSD/SP1/ENG/TZ/XX/M Markscheme May 017 Mathematical studies Standard level Paper 1 3 pages M17/5/MATSD/SP1/ENG/TZ/XX/M This markscheme is the property of the International Baccalaureate and must
Warm-Up Exercises. Find the x-intercept and y-intercept 1. 3x 5y = 15 ANSWER 5; y = 2x + 7 ANSWER ; 7
 Warm-Up Exercises Find the x-intercept and y-intercept 1. 3x 5y = 15 ANSWER 5; 3 2. y = 2x + 7 7 2 ANSWER ; 7 Chapter 1.1 Graph Quadratic Functions in Standard Form A quadratic function is a function that
 Specific Objectives Students will understand that that the family of equation corresponds with the shape of the graph. Students will be able to create a graph of an equation by plotting points. In lesson
Archdiocese of New York Practice Items
 Archdiocese of New York Practice Items Mathematics Grade 6 Teacher Sample Packet Unit 5 NY MATH_TE_G6_U5.indd 1 NY MATH_TE_G6_U5.indd 2 1. Horatio s patio is shaped like an isosceles trapezoid. He wants
2017 Mathematics Paper 1 (Non-calculator) Finalised Marking Instructions
 Finalised Marking Instructions") National Qualifications 017 017 Mathematics Paper 1 (Non-calculator) N5 Finalised Marking Instructions Scottish Qualifications Authority 017 The information in this publication may be reproduced to support
National Qualifications 017 017 Mathematics Paper 1 (Non-calculator) N5 Finalised Marking Instructions Scottish Qualifications Authority 017 The information in this publication may be reproduced to support
Year 10 Term 2 Homework
 Yimin Math Centre Year 10 Term 2 Homework Student Name: Grade: Date: Score: Table of contents 5 Year 10 Term 2 Week 5 Homework 1 5.1 Graphs in the number plane................................ 1 5.1.1 The
Why Use Graphs? Test Grade. Time Sleeping (Hrs) Time Sleeping (Hrs) Test Grade
 Time Sleeping (Hrs) Test Grade") Analyzing Graphs Why Use Graphs? It has once been said that a picture is worth a thousand words. This is very true in science. In science we deal with numbers, some times a great many numbers. These numbers,
Analyzing Graphs Why Use Graphs? It has once been said that a picture is worth a thousand words. This is very true in science. In science we deal with numbers, some times a great many numbers. These numbers,
This is called the vertex form of the quadratic equation. To graph the equation
 Name Period Date: Topic: 7-5 Graphing ( ) Essential Question: What is the vertex of a parabola, and what is its axis of symmetry? Standard: F-IF.7a Objective: Graph linear and quadratic functions and show
Mark Scheme (Results) November Pearson Edexcel GCSE (9 1) In Mathematics (1MA1) Foundation (Calculator) Paper 3F
 November Pearson Edexcel GCSE (9 1) In Mathematics (1MA1) Foundation (Calculator) Paper 3F") Mark Scheme (Results) November 2017 Pearson Edexcel GCSE (9 1) In Mathematics (1MA1) Foundation (Calculator) Paper 3F Edexcel and BTEC Qualifications Edexcel and BTEC qualifications are awarded by Pearson,
Mark Scheme (Results) November 2017 Pearson Edexcel GCSE (9 1) In Mathematics (1MA1) Foundation (Calculator) Paper 3F Edexcel and BTEC Qualifications Edexcel and BTEC qualifications are awarded by Pearson,
BIG IDEAS. A.REI.D.10: Interpret Graphs as Sets of Solutions. Lesson Plan
 A.REI.D.10: Interpret Graphs as Sets of Solutions EQUATIONS AND INEQUALITIES A.REI.D.10: Interpret Graphs as Sets of Solutions D. Represent and solve equations and inequalities graphically. 10. Understand
Chislehurst and Sidcup Grammar School Mathematics Department Year 9 Programme of Study
 Chislehurst and Sidcup Grammar School Mathematics Department Year 9 Programme of Study Timings Topics Autumn Term - 1 st half (7 weeks - 21 lessons) 1. Algebra 1: Expressions, Formulae, Equations and Inequalities
UNIT P1: PURE MATHEMATICS 1 QUADRATICS
 QUADRATICS Candidates should able to: carr out the process of completing the square for a quadratic polnomial, and use this form, e.g. to locate the vertex of the graph of or to sketch the graph; find
Elaborations Example Exam 1 Wiskunde B 2018
 Elaborations Example Exam 1 Wiskunde B 2018 Question 1a 4 points yields ; yields so in point A we have ;, so and This yields Question 1b 4 points ( ) ( ) ( ) Question 1c 4 points ( ). This is the normal
Step 1. Use a ruler or straight-edge to determine a line of best fit. One example is shown below.
 Linear Models Modeling 1 ESSENTIALS Example Draw a straight line through the scatter plot so that the line represents a best fit approximation to the points. Then determine the equation for the line drawn.
4. TANGENTS AND NORMALS
 4. TANGENTS AND NORMALS 4. Equation of the Tangent at a Point Recall that the slope of a curve at a point is the slope of the tangent at that point. The slope of the tangent is the value of the derivative
Lesson 18: There is Only One Line Passing Through a Given Point with a Given
 Lesson 18: There is Only One Line Passing Through a Given Point with a Given Student Outcomes Students graph equations in the form of using information about slope and intercept. Students know that if
0607 CAMBRIDGE INTERNATIONAL MATHEMATICS
 UNIVERSITY OF CAMBRIDGE INTERNATIONAL EXAMINATIONS International General Certificate of Secondary Education MARK SCHEME for the October/November 010 question paper for the guidance of teachers 0607 CAMBRIDGE
Department Curriculum Map (new GCSE)
") Department Curriculum Map 2014-15 (new GCSE) Department Mathematics required in Year 11 Foundation 1. Structure and calculation: N1 to N9 Fractions, decimals and percentages: N10 to N12 Measure and accuracy:
Department Curriculum Map 2014-15 (new GCSE) Department Mathematics required in Year 11 Foundation 1. Structure and calculation: N1 to N9 Fractions, decimals and percentages: N10 to N12 Measure and accuracy:
Is there a different way to get the same result? Did we give enough information? How can we describe the position? CPM Materials modified by Mr.
 Common Core Standard: 8.G.3 Is there a different way to get the same result? Did we give enough information? How can we describe the position? CPM Materials modified by Mr. Deyo Title: IM8 Ch. 6.2.1 What
Student Exploration: Quadratics in Polynomial Form
 Name: Date: Student Exploration: Quadratics in Polynomial Form Vocabulary: axis of symmetry, parabola, quadratic function, vertex of a parabola Prior Knowledge Questions (Do these BEFORE using the Gizmo.)
4. Write sets of directions for how to check for direct variation. How to check for direct variation by analyzing the graph :
 Name Direct Variations There are many relationships that two variables can have. One of these relationships is called a direct variation. Use the description and example of direct variation to help you
round decimals to the nearest decimal place and order negative numbers in context
 6 Numbers and the number system understand and use proportionality use the equivalence of fractions, decimals and percentages to compare proportions use understanding of place value to multiply and divide
Y7 Learning Stage 1. Y7 Learning Stage 2. Y7 Learning Stage 3
 Y7 Learning Stage 1 Y7 Learning Stage 2 Y7 Learning Stage 3 Understand simple algebraic notation. Collect like terms to simplify algebraic expressions. Use coordinates in the first quadrant. Make a comparative
[Note: each line drawn must be a single line segment satisfying x = 3] (b) y = x drawn 1 B1 for y = x drawn
![[Note: each line drawn must be a single line segment satisfying x = 3] (b) y = x drawn 1 B1 for y = x drawn](/thumbs/85/91731873.jpg "[Note: each line drawn must be a single line segment satisfying x = 3] (b) y = x drawn 1 B1 for y = x drawn") 1. (a) x = 3 drawn 1 B1 for x = 3 drawn (b) y = x drawn 1 B1 for y = x drawn [Note: each line drawn must be a single line segment satisfying x = 3] [Note: each line drawn must be a single line segment
1. (a) x = 3 drawn 1 B1 for x = 3 drawn (b) y = x drawn 1 B1 for y = x drawn [Note: each line drawn must be a single line segment satisfying x = 3] [Note: each line drawn must be a single line segment
Year 8 Key Performance Indicators Maths (Number)
") Key Performance Indicators Maths (Number) M8.1 N1: I can solve problems by adding, subtracting, multiplying and dividing decimals. Use correct notation for recurring decimals, know the denominators of
Key Performance Indicators Maths (Number) M8.1 N1: I can solve problems by adding, subtracting, multiplying and dividing decimals. Use correct notation for recurring decimals, know the denominators of
1-1. Calculate the values of the expressions below. Show all steps in your process.
 1-1. Calculate the values of the expressions below. Show all steps in your process. a. 2 (3(5 + 2) 1) b. 6 2(4 + 5) + 6 c. 3 8 2 2 + 1 d. 5 2 3 + 6(3 2 + 1) 1-2. Simplify the expressions below as much
Meeting 1 Introduction to Functions. Part 1 Graphing Points on a Plane (REVIEW) Part 2 What is a function?
 Part 2 What is a function?") Meeting 1 Introduction to Functions Part 1 Graphing Points on a Plane (REVIEW) A plane is a flat, two-dimensional surface. We describe particular locations, or points, on a plane relative to two number
Meeting 1 Introduction to Functions Part 1 Graphing Points on a Plane (REVIEW) A plane is a flat, two-dimensional surface. We describe particular locations, or points, on a plane relative to two number
IB HL Mathematical Exploration
 IB HL Mathematical Exploration Modelling the surface area of a ceramic pot Personal code: glt101 Table of Contents Introduction... 1 Rationale... 1 Aim... 1-2 Exploring the formula for surface area...
This unit will help you to describe and use graphs correctly.
 Get started 6 Graph skills This unit will help you to describe and use graphs correctly. An important part of physics is describing the patterns we see in our observations about the universe. Graphs help
Section 9.3 Graphing Quadratic Functions
 Section 9.3 Graphing Quadratic Functions A Quadratic Function is an equation that can be written in the following Standard Form., where a 0. Every quadratic function has a U-shaped graph called a. If the
T:\Staff Resources\Maths\1 Dept Admin\School website\key Stage 4\GCSE Higher Topic Detail doc 1
 Module (time) Contents Notes Number (8) Recognise triangular, square and cube numbers Recall integer squares and corresponding square roots to 15 x 15 Recall the cubes of 2,3,4,5 and 10 Find multiples,
2012 Mathematics. Intermediate 2 Units 1, 2 and 3, Paper 2. Finalised Marking Instructions
 01 Mathematics Intermediate Units 1, and 3, Paper Finalised Marking Instructions Scottish Qualifications Authority 01 The information in this publication may be reproduced to support SQA qualifications
Unit: Quadratic Functions
 Unit: Quadratic Functions Learning increases when you have a goal to work towards. Use this checklist as guide to track how well you are grasping the material. In the center column, rate your understand
Math 7 Notes - Unit 4 Pattern & Functions
 Math 7 Notes - Unit 4 Pattern & Functions Syllabus Objective: (3.2) The student will create tables, charts, and graphs to extend a pattern in order to describe a linear rule, including integer values.
Quadratic Functions In Standard Form In Factored Form In Vertex Form Transforming Graphs. Math Background
 Graphing In Standard Form In Factored Form In Vertex Form Transforming Graphs Math Background Previousl, ou Identified and graphed linear functions Applied transformations to parent functions Graphed quadratic
Lesson 2.1 Exercises, pages 90 96
 Lesson.1 Eercises, pages 9 96 A. a) Complete the table of values. 1 1 1 1 1. 1 b) For each function in part a, sketch its graph then state its domain and range. For : the domain is ; and the range is.
Characteristics of Exponential Functions
 Math Objectives Students will identify the characteristics of exponential functions of the form f(x) = b x, where b > 1. Students will identify the characteristics of exponential functions of the form
Cambridge International General Certificate of Secondary Education 0478 Computer Science June 2015 Principal Examiner Report for Teachers
 COMPUTER SCIENCE Paper 0478/11 Paper 1 Key Messages This is a new syllabus and the standard of candidates work was mostly very good. There is a continued move to provide questions where candidates have
FOUNDATION HIGHER. F Autumn 1, Yr 9 Autumn 2, Yr 9 Spring 1, Yr 9 Spring 2, Yr 9 Summer 1, Yr 9 Summer 2, Yr 9
 Year: 9 GCSE Mathematics FOUNDATION F Autumn 1, Yr 9 Autumn 2, Yr 9 Spring 1, Yr 9 Spring 2, Yr 9 Summer 1, Yr 9 Summer 2, Yr 9 HIGHER Integers and place value Decimals Indices, powers and roots Factors,multiples
Midterm Exam Fundamentals of Computer Graphics (COMP 557) Thurs. Feb. 19, 2015 Professor Michael Langer
 Thurs. Feb. 19, 2015 Professor Michael Langer") Midterm Exam Fundamentals of Computer Graphics (COMP 557) Thurs. Feb. 19, 2015 Professor Michael Langer The exam consists of 10 questions. There are 2 points per question for a total of 20 points. You
Midterm Exam Fundamentals of Computer Graphics (COMP 557) Thurs. Feb. 19, 2015 Professor Michael Langer The exam consists of 10 questions. There are 2 points per question for a total of 20 points. You
0607 CAMBRIDGE INTERNATIONAL MATHEMATICS
 UNIVERSITY OF CAMBRIDGE INTERNATIONAL EXAMINATIONS International General Certificate of Secondary Education MARK SCHEME for the May/June question paper for the guidance of teachers 7 CAMBRIDGE INTERNATIONAL
Solutions. Algebra II Journal. Module 2: Regression. Exploring Other Function Models
 Solutions Algebra II Journal Module 2: Regression Exploring Other Function Models This journal belongs to: 1 Algebra II Journal: Reflection 1 Before exploring these function families, let s review what
QUADRATIC AND CUBIC GRAPHS
 NAME SCHOOL INDEX NUMBER DATE QUADRATIC AND CUBIC GRAPHS KCSE 1989 2012 Form 3 Mathematics Working Space 1. 1989 Q22 P1 (a) Using the grid provided below draw the graph of y = -2x 2 + x + 8 for values
Cambridge Ordinary Level 2210 Computer Science June 2016 Principal Examiner Report for Teachers
 COMPUTER SCIENCE Paper 2210/11 Paper 1 Key messages This syllabus has now been running for a few sessions and candidate s work continues to improve. There is a continued move to provide questions where
Countdown to your final Maths exam Part 13 (2018)
") Countdown to your final Maths exam Part 13 (2018) Marks Actual Q1. Translations (Clip 67) 2 Q2. Reflections & enlargements (Clips 64 & 63) 5 Q3. Rotations (Clip 65) 3 Q4. Rotations (Clip 65) 2 Q5. Rotations
Countdown to your final Maths exam Part 13 (2018) Marks Actual Q1. Translations (Clip 67) 2 Q2. Reflections & enlargements (Clips 64 & 63) 5 Q3. Rotations (Clip 65) 3 Q4. Rotations (Clip 65) 2 Q5. Rotations
Unit 8, Ongoing Activity, Little Black Book of Algebra II Properties
 Unit 8, Ongoing Activity, Little Black Book of Algebra II Properties Little Black Book of Algebra II Properties Unit 8 Conic Sections 8.1 Circle write the definition, provide examples of both the standard
Graphing with a Graphing Calculator
 APPENDIX C Graphing with a Graphing Calculator A graphing calculator is a powerful tool for graphing equations and functions. In this appendix we give general guidelines to follow and common pitfalls to
Algebra 2 Semester 2 Final Exam Study Outline Semester 2 Final Exam Study Tips and Information
 Algebra 2 Semester 2 Final Exam Study Outline 2013 Semester 2 Final Exam Study Tips and Information The final exam is CUMULATIVE and will include all concepts taught from Chapter 1 through Chapter 13.
Functions and Inverses
 Math Objectives Students will graphically explore functions and their inverses. Students will find the inverse of a given function algebraically. Students will reason abstractly and quantitatively (CCSS
Cambridge International General Certificate of Secondary Education 0478 Computer Science June 2016 Principal Examiner Report for Teachers
 COMPUTER SCIENCE Paper 0478/11 Paper 1 Key messages This syllabus has now been running for a few sessions and candidate s work continues to improve. There is a continued move to provide questions where
Making Graphs from a Table of Values and Understanding the Graphs of Horizontal and Vertical Lines Blue Level Problems
 Making Graphs from a Table of Values and Understanding the Graphs of Horizontal and Vertical Lines Blue Level Problems. Coordinate Triangle? We have a triangle ABC, and it has an area of units^. Point
Mark Scheme (Results) Summer Pearson Edexcel GCSE In Mathematics B (2MB01) Higher (Calculator) Unit 3
 Summer Pearson Edexcel GCSE In Mathematics B (2MB01) Higher (Calculator) Unit 3") Mark Scheme (Results) Summer 015 Pearson Edexcel GCSE In Mathematics B (MB01) Higher (Calculator) Unit 3 Edexcel and BTEC Qualifications Edexcel and BTEC qualifications are awarded by Pearson, the UK s
Mark Scheme (Results) Summer 015 Pearson Edexcel GCSE In Mathematics B (MB01) Higher (Calculator) Unit 3 Edexcel and BTEC Qualifications Edexcel and BTEC qualifications are awarded by Pearson, the UK s
Making Science Graphs and Interpreting Data
 Making Science Graphs and Interpreting Data Scientific Graphs: Most scientific graphs are made as line graphs. There may be times when other types would be appropriate, but they are rare. The lines on
POLYNOMIALS Graphing Polynomial Functions Common Core Standard
 K Polynomials, Lesson 6, Graphing Polynomial Functions (r. 2018) POLYNOMIALS Graphing Polynomial Functions Common Core Standard Next Generation Standard F-BF.3 Identify the effect on the graph of replacing
CS 4620 Midterm, March 21, 2017
 CS 460 Midterm, March 1, 017 This 90-minute exam has 4 questions worth a total of 100 points. Use the back of the pages if you need more space. Academic Integrity is expected of all students of Cornell
Version 1.0. abc. General Certificate of Secondary Education. Mathematics Specification A. Paper 1 Higher. Mark Scheme
 Version 1.0 abc General Certificate of Secondary Education Mathematics 4301 Specification A Paper 1 Higher Mark Scheme 008 examination - June series Mark schemes are prepared by the Principal Examiner
Graphing f ( x) = ax 2
 = ax 2") . Graphing f ( ) = a Essential Question What are some of the characteristics of the graph of a quadratic function of the form f () = a? Graphing Quadratic Functions Work with a partner. Graph each quadratic
. Graphing f ( ) = a Essential Question What are some of the characteristics of the graph of a quadratic function of the form f () = a? Graphing Quadratic Functions Work with a partner. Graph each quadratic
Sketching graphs of polynomials
 Sketching graphs of polynomials We want to draw the graphs of polynomial functions y = f(x). The degree of a polynomial in one variable x is the highest power of x that remains after terms have been collected.
MATH 1075 Final Exam
 Autumn 2018 Form C Name: Signature: OSU name.#: Lecturer: Recitation Instructor: Recitation Time: MATH 1075 Final Exam Instructions: You will have 1 hour and 45 minutes to take the exam. Show ALL work
MARK SCHEME for the October/November 2013 series 0580 MATHEMATICS
 CAMBRIDGE INTERNATIONAL EXAMINATIONS International General Certificate of Secondary Education MARK SCHEME for the October/November 01 series 0580 MATHEMATICS 0580/4 Paper 4 (Extended), maximum raw mark
Direct Variations DIRECT AND INVERSE VARIATIONS 19. Name
 DIRECT AND INVERSE VARIATIONS 19 Direct Variations Name Of the many relationships that two variables can have, one category is called a direct variation. Use the description and example of direct variation
GCSE Maths for Edexcel
 GCSE Maths for Edexcel 4th Edition Foundation Scheme of Work Using Maths Frameworking 3rd edition Pupil Books 1.3, 2.3 and 3.3 and Edexcel GCSE Maths 4th edition Foundation Student Book together will give
3.7. Vertex and tangent
 3.7. Vertex and tangent Example 1. At the right we have drawn the graph of the cubic polynomial f(x) = x 2 (3 x). Notice how the structure of the graph matches the form of the algebraic expression. The
Further Maths Notes. Common Mistakes. Read the bold words in the exam! Always check data entry. Write equations in terms of variables
 Further Maths Notes Common Mistakes Read the bold words in the exam! Always check data entry Remember to interpret data with the multipliers specified (e.g. in thousands) Write equations in terms of variables
0607 CAMBRIDGE INTERNATIONAL MATHEMATICS
 UNIVERSITY OF CAMBRIDGE INTERNATIONAL EXAMINATIONS International General Certificate of Secondary Education MARK SCHEME for the May/June 011 question paper for the guidance of teachers 007 CAMBRIDGE INTERNATIONAL
YEAR 9 SCHEME OF WORK
 YEAR 9 SCHEME OF WORK Week Chapter: Topic 1 2 3.1:1: Percentages 3.2:1: Percentages 3 4 3.1:2: Equations and formulae 3.2:2: Equations and formulae 5 6 3.1:3: Polygons 3.2:3: Polygons 6 7 3.1:4: Using
Examination Duration Date
 Hillel Academy High School Grade 9 Mathematics End of Year Study Guide September2013- June 2014 Examination Duration Date The exam consists of 2 papers: Paper 1: Short Response Calculator Paper 2:Structured
Mark Scheme (Results) November Pearson Edexcel GCSE (9 1) In Mathematics (1MA1) Higher (Calculator) Paper 3H
 November Pearson Edexcel GCSE (9 1) In Mathematics (1MA1) Higher (Calculator) Paper 3H") Mark Scheme (Results) November 2017 Pearson Edexcel GCSE (9 1) In Mathematics (1MA1) Higher (Calculator) Paper 3H Edexcel and BTEC Qualifications Edexcel and BTEC qualifications are awarded by Pearson,
Mark Scheme (Results) November 2017 Pearson Edexcel GCSE (9 1) In Mathematics (1MA1) Higher (Calculator) Paper 3H Edexcel and BTEC Qualifications Edexcel and BTEC qualifications are awarded by Pearson,
Lesson 2.4 Exercises, pages
 Lesson. Eercises, pages 13 10 A 3. Sketch the graph of each function. ( - )( + 1) a) = b) = + 1 ( )( 1) 1 (- + )( - ) - ( )( ) 0 0 The function is undefined when: 1 There is a hole at 1. The function can