SCALASCA parallel performance analyses of SPEC MPI2007 applications
|
|
|
- Erica Mathews
- 6 years ago
- Views:
Transcription

1 Mitglied der Helmholtz-Gemeinschaft SCALASCA parallel performance analyses of SPEC MPI2007 applications Zoltán Szebenyi Jülich Supercomputing Centre, Forschungszentrum Jülich Aachen Institute for Advanced Study in Computational Engineering Science, RWTH Aachen
2 Overview Introduction to JUMP the SPEC MPI 2007 suite SCALASCA overview Measurement methodology Experimental results Slide 2
3 Motivation SPEC MPI 2007 provides a representative set of MPI application kernels 13 applications C/C++/Fortran, often combined Different MPI programming patterns - blocking/nonblocking/persistent communication - with or without extensive collective communication Most of them show iterative behavior suitable for phase instrumentation Slide 3
4 JUMP - IBM SP2 Regatta p690+ system 41 IBM SP2 p690+ frames 16 dual-core 1.7GHz Power4+ processors 128GB of shared main memory Connected via IBM High Performance Switch GPFS filesystem AIX 5.3 IBM XL compiler suites version 7.0/8.0 for C/C++ version 9.1/10.1 for Fortran IBM POE 4.2 MPI Slide 4
5 SPEC MPI 2007 applications overview Code LOC Language Application subject area 104.milc C Lattice quantum chromodynamics 107.leslie3d F77, F90 Combustion dynamics 113.GemsFDTD F90 Computational electrodynamics 115.fds F90, C Computational fluid dynamics 121.pop F90 Oceanography 122.tachyon C Computer graphics: ray tracing 126.lammps 6796 C++ Molecular dynamics 127.wrf F90, C Numerical weather prediction 128.GAPgeofem F77, C Geophysics finite-element methods 129.tera_tf 6468 F90 Eulerian hydrodynamics 130.socorro F90 Quantum chemistry 132.zeusmp C, F90 Astrophysical hydrodynamics 137.lu 5671 F90 Linear algebra SSOR Slide 5
6 SPEC MPI 2007 execution times on JUMP Slide 6
7 The SCALASCA project Overview Started in January 2006 Funded by Helmholtz Initiative & Networking Fund Developed in collaboration with ICL/UT Follow-up to pioneering KOJAK project Automatic pattern-based performance analysis Objective Development of a scalable performance analysis toolset Specifically targeting large-scale applications Slide 7
8 Features Open source Portable BG/L, BG/P, IBM SP & blade clusters, Cray XT3/4, SGI Altix, Sun Fire clusters (SPARC, x86-64),... Supports various languages & parallel programming paradigms Fortran, C, C++ MPI, OpenMP & hybrid MPI/OpenMP Integrated measurement & analysis toolset Runtime summarization (aka profiling) Automatic event trace analysis Slide 8
9 Application instrumentation Automatic/manual code instrumenter Processes program sources Adds instrumentation and measurement library into application executable program sources compiler instrumenter instrumented executable application application+epik + application+epik measurement application+epik lib Measurement library Exploits MPI standard profiling interface (PMPI) Provides measurement infrastructure & instrumentation API Slide 9
10 Runtime summarization Measurement library manages threads & events produced by instrumentation Measurements summarized by thread & call-path during execution Analysis report unified & collated at finalization Presentation of analysis results program sources compiler instrumenter instrumented executable expt config application application+epik + application+epik measurement application+epik lib summary analysis analysis report examiner Slide 10
11 Event tracing & analysis Time-stamped events buffered during measurement for each thread Flushed to files along with unified definitions & mapping tables at finalization program sources compiler instrumenter instrumented executable expt config application application+epik + application+epik measurement application+epik lib unified defs+maps Follow-up analysis replays events and produces extended analysis report trace trace trace 1trace 2.. N parallel trace SCOUT SCOUT SCOUT analyzer Presentation of analysis report trace analysis analysis report examiner Slide 11
12 SCALASCA components Automatic/manual code instrumenter Unified measurement library supporting both runtime summaries trace file generation Parallel, replay-based trace analyzer Common analysis report examiner program sources compiler instrumenter instrumented executable expt config application application+epik + application+epik measurement application+epik lib unified defs+maps trace trace trace 1trace 2.. N parallel trace SCOUT SCOUT SCOUT analyzer summary analysis trace analysis analysis report examiner Slide 12

13 Runtime summary report What kind of performance problem? Where is it in the source code? In what context? How is it distributed across the system? Slide 13

14 132.zeusmp2 point-to-point communication time Summary experiment 12.8% of time spent in MPI point-to-point communication 13.9% of which is on a single callpath to an MPI_Waitall Has a 35.6% standard variation across 512 processes Highest values in 2nd and 7th planes of the Cartesian grid Slide 14


15 Trace analysis report Additional trace-based metrics No hardware counters Slide 15
16 Phase-instrumentation Motivation This is all very good, but I still can't see how things evolve over time Is there a way to analyze time-dependent behavior? Phase-instrumentation Identify the main loop of the application Place markers at the beginning and the end of the loop SCALASCA will now save all the iterations separately Slide 16
17 132.zeusmp2 late sender time Tracing experiment Including manually inserted timestep annotations Neighbors are waiting for a few slower processes in the first timestep Slide 17
18 Measurement & analysis methodology 1. Run uninstrumented version (as reference for validation) Determine available memory from heap usage 2. Run fully-instrumented version collecting runtime summary Determine functions with excessive overheads (distortion and trace buffer cost) Prepare filter file 3. Repeat measurement with filter Verify dilation and trace buffer cost Identify appropriate iterations/timesteps to be annotated 4. Repeat summarization with filter and phases 5. Reconfigure measurement to collect and analyze traces (with phases) Generate graphs and charts of metrics per iteration/timestep Slide 18
19 SPEC MPI way execution characteristics Code 104.milc 107.leslie3d 113.GemsFDTD 115.fds4 121.pop2 122.tachyon 126.lammps 127.wrf2 128.GAPgeofem 129.tera_tf 130.socorro 132.zeusmp2 137.lu Program execution RSS Trace buffer content (MB/proc) Filter steps depth callpaths (MB) total MPI filter residue funcs N/A Slide 19
20 SPEC MPI way execution times for different instrumentation configurations in wallclock seconds Code 104.milc 107.leslie3d 113.GemsFDTD 115.fds4 121.pop2 121.pop2 (2000) 122.tachyon 126.lammps 127.wrf2 128.GAPgeofem 129.tera_tf 130.socorro 132.zeusmp2 137.lu Trace Instrumentation/measurement Tracing None Sum Sum+f Sum+pf Trace flushing analysis size (GB) N/P N/P Slide 20
21 SPEC MPI way execution time overheads for different instrumentation configurations Code 104.milc 107.leslie3d 113.GemsFDTD 115.fds4 121.pop2 121.pop2 (2000) 122.tachyon 126.lammps 127.wrf2 128.GAPgeofem 129.tera_tf 130.socorro 132.zeusmp2 137.lu Trace Instrumentation/measurement Tracing None Sum Sum+f Sum+pf Trace flushing analysis size (GB) % 3.9% 3.5% % 3.8% 7.0% 3.1% % 0.7% 4.1% 3.7% % 1.0% 0.6% 0.8% % 29.0% 24.7% N/P % 29.2% 24.1% 30.2% N/P 197.2% 197.6% % 0.9% 6.3% 4.3% % 6.3% 5.2% 8.4% % 5.5% 6.1% 4.9% % 2.5% -0.4% -0.2% % 15.6% 20.6% 20.7% % 2.7% % 7.9% Slide 21
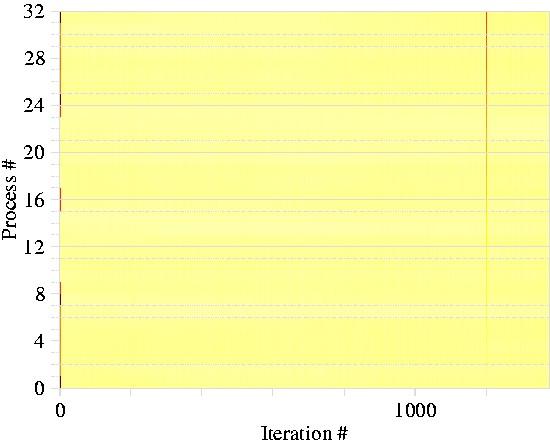
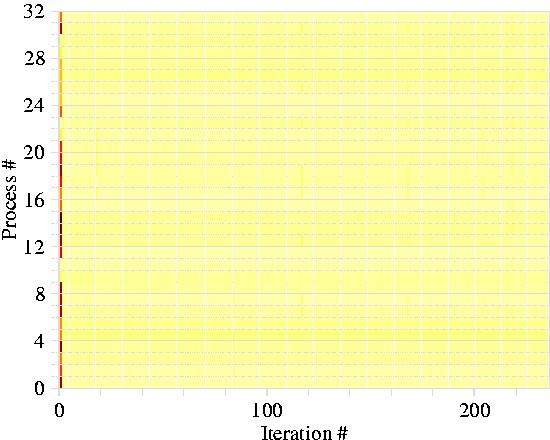
22 Iteration/timestep analysis graphs and charts Minimum/median/maximum value graph over iterations Chart of values per process color coded from yellow-white (min) to dark-red (max) Slide 22
23 132.zeusmp2 execution time First timestep takes longest Progressive increase from 7.9s to 8.8s Transitions at timesteps 41 and 69 A low amount of noise is visible Slide 23
24 132.zeusmp2 point-to-point communication time Transitions at timesteps 41 and 69 clearly visible High variation among processes Progressive increase from 0.4 to 1.2 in the maximum values Some processes, like processes 10 and 13 have low values where others are much higher Slide 24


25 132.zeusmp2 late sender time Around half of the point-to-point time is spent in late sender situations Same kind of transitions and progressive increase present Slide 25

26 132.zeusmp2 collective communication time Graph at same scale as the graphs on the point-to-point slides Peaks visible at iterations 41 and 69, where the transitions happen on the point-to-point graphs Slide 26


27 132.zeusmp2 bytes transferred There is a variation among processes, but There is no variation over time The visit count graphs look exactly the same The progressive increase and the transitions in point-to-point time have to be caused by something else! Slide 27

28 132.zeusmp2 late sender time After identifying the most interesting iterations Back to the SCALASCA GUI Look at the details Find the cause of the performance bottlenecks Slide 28
29 SPEC MPI way execution time graphs 107.leslie3d 113.GemsFDTD 115.fds4 121.pop2 126.leslie3d 127.wrf2 128.GAPgeofem 129.tera_tf 130.socorro 132.zeusmp2 137.lu Slide 29
30 SPEC MPI way execution time charts 107.leslie3d 113.GemsFDTD 115.fds4 121.pop2 126.leslie3d 127.wrf2 128.GAPgeofem 129.tera_tf 130.socorro 132.zeusmp2 137.lu Slide 30


31 SPEC MPI way point-to-point time graphs 107.leslie3d 113.GemsFDTD 115.fds4 121.pop2 126.leslie3d 127.wrf2 128.GAPgeofem 129.tera_tf 130.socorro 132.zeusmp2 137.lu Slide 31


32 SPEC MPI way point-to-point time charts 107.leslie3d 113.GemsFDTD 115.fds4 121.pop2 126.leslie3d 127.wrf2 128.GAPgeofem 129.tera_tf 130.socorro 132.zeusmp2 137.lu Slide 32
33 Conclusion SCALASCA analysis was possible for all the SPEC MPI 2007 applications, up to 1024 processes Phase instrumentation adds a new dimension to the existing SCALASCA analysis Analyzing the SPEC MPI 2007 suite, we have found interesting time-dependent behavioral patterns Slide 33


34 Thank you! For more information visit our website: WRF-NMM weather prediction code on 1600 CPUs Slide 34
35 Creating filters A filter file is a simple list of function names The SCALASCA toolset helps in choosing the right functions to filter flt type ANY MPI USR COM max_tbc time % USR USR USR USR USR USR USR MPI MPI MPI COM region (summary) (summary) (summary) (summary) ALL MPI USR COM tf_projection_nmod_totalisation_advection tf_projection_nmod_interpolation_ordre_4 tf_1d_hydro_nmod_tf_1d_hydro_driver tf_projection_nmod_tf_projection_mono tf_1d_hydro_nmod_schema_de_godunov tf_thermo_nmod_exact_riemann_solver tf_ad_splitting_nmod_tf_apply_boundary_conditions MPI_Send MPI_Irecv MPI_Wait tf_ad_splitting_nmod_tf_communications_plane_init Slide 35
36 Filter generation Example filtering 4 functions of 129.tera_tf: flt + * * * type FLT ANY MPI USR COM max_tbc time % region (summary) (summary) (summary) (summary) (summary) FLT ALL-FLT MPI-FLT USR-FLT COM-FLT % region (summary) (summary) (summary) (summary) (summary) FLT ALL-FLT MPI-FLT USR-FLT COM-FLT Example filtering 6 functions of 129.tera_tf: flt + * * * type FLT ANY MPI USR COM max_tbc time Slide 36
37 107.leslie3d execution time every 5th iteration takes more time caused by an additional MPI collective call around every 43rd iteration takes longer caused by longer point-to-point communication times number of point-to-point calls and bytes transferred are the same possibly caused by flooded communication buffers transition at iteration number 1015 Slide 37
38 113.GemsFDTD execution time some variation among processes visible slight transitions at a number of iterations some noise present Slide 38
39 115.fds4 execution time the 1st iteration takes longer every 3rd iteration spends more time in user functions point-to-point communication only every 100th iteration more point-to-point and collective calls in the first 100 iterations more collective calls every 100th iteration more collective calls every 255th iteration Slide 39
40 121.pop2 execution time 2000 iteration experiment Remainder of 9000 iterations qualitatively similar slight transitions in collective and point-to-point call counts more collective calls every 100th iteration Slide 40
41 126.lammps execution time progressively increasing baseline time more point-to-point calls every 20th iteration collective communication every 100th iteration Slide 41
42 127.wrf2 execution time slightly increasing baseline some periodic behavior, most visible in the peaks 1st and every 1200th iterations extremely long (every simulation day) more time spent in user functions every 4th and 8th iteration collective communication every 300th iteration Slide 42
43 128.GAPgeofem execution time 1st iteration takes longer visible in MPI time, but MPI call count and bytes transferred is the same decreasing visit numbers and execution times Collectives every iteration Considerable amount of noise mostly from collectives Most of collective time spent in Wait at NxN situations Shows load imbalance Slide 43
44 129.tera_tf execution time Strong increase in execution time from 1.2s to 2.9s High amount of noise visit numbers and bytes transferred vary by processes, but constant through iterations Strange, constantly changing behavior on communication time metrics point-to-point and collective times complement each other Slide 44

45 130.socorro execution time low number of iterations very long time spent in each iteration last iteration takes less time Slide 45
46 137.lu execution time Collective communication only in last iteration execution time and communication metrics mostly constant transition around the 19th iteration Variation among processes in communication time and count metrics Slide 46
47 132.zeusmp2 collective communication time 5.6% of total time spent in collective communication of which 59.6% is spent on one callpath in an MPI_Allreduce Shows 47.5% standard variation The processes in the middle spend less time here than the ones on the edges Slide 47

48 132.zeusmp2 wait at NxN time 3.9% of total time spent in wait at NxN situations looking at the MPI_Allreduce call in the 1st iteration shows 35.7% standard variation highest waiting times on the bottom planes and in the first few rows of every plane lowest waiting times in the middle Slide 48
49 location Trace pattern example: Late sender MPI_Send MPI_Send MPI_Irecv MPI_Recv MPI_Wait location time MPI_Isend MPI_Recv MPI_Wait MPI_Isend MPI_Irecv MPI_Wait MPI_Wait time Waiting time caused by a blocking receive operation posted earlier than the corresponding send operation Applies to blocking as well as non-blocking communication Slide 49
Performance analysis of Sweep3D on Blue Gene/P with Scalasca
 Mitglied der Helmholtz-Gemeinschaft Performance analysis of Sweep3D on Blue Gene/P with Scalasca 2010-04-23 Brian J. N. Wylie, David Böhme, Bernd Mohr, Zoltán Szebenyi & Felix Wolf Jülich Supercomputing
Large-scale performance analysis of PFLOTRAN with Scalasca
 Mitglied der Helmholtz-Gemeinschaft Large-scale performance analysis of PFLOTRAN with Scalasca 2011-05-26 Brian J. N. Wylie & Markus Geimer Jülich Supercomputing Centre b.wylie@fz-juelich.de Overview Dagstuhl
Automatic trace analysis with the Scalasca Trace Tools
 Automatic trace analysis with the Scalasca Trace Tools Ilya Zhukov Jülich Supercomputing Centre Property Automatic trace analysis Idea Automatic search for patterns of inefficient behaviour Classification
Scalasca performance properties The metrics tour
 Scalasca performance properties The metrics tour Markus Geimer m.geimer@fz-juelich.de Scalasca analysis result Generic metrics Generic metrics Time Total CPU allocation time Execution Overhead Visits Hardware
Large-scale performance analysis of PFLOTRAN with Scalasca
 Mitglied der Helmholtz-Gemeinschaft Large-scale performance analysis of PFLOTRAN with Scalasca 2011-05-26 Brian J. N. Wylie & Markus Geimer Jülich Supercomputing Centre b.wylie@fz-juelich.de Overview Dagstuhl
Benchmarking Clusters with High Core-Count Nodes
 Benchmarking Clusters with High Core-Count Nodes 9 th LCI International Conference on High- Performance Clustered Computing 29 April, 2008 Tom Elken Manager, Performance Engineering QLogic Corporation
Scalasca support for Intel Xeon Phi. Brian Wylie & Wolfgang Frings Jülich Supercomputing Centre Forschungszentrum Jülich, Germany
 Scalasca support for Intel Xeon Phi Brian Wylie & Wolfgang Frings Jülich Supercomputing Centre Forschungszentrum Jülich, Germany Overview Scalasca performance analysis toolset support for MPI & OpenMP
Architecture of Parallel Computer Systems - Performance Benchmarking -
 Architecture of Parallel Computer Systems - Performance Benchmarking - SoSe 18 L.079.05810 www.uni-paderborn.de/pc2 J. Simon - Architecture of Parallel Computer Systems SoSe 2018 < 1 > Definition of Benchmark
[Scalasca] Tool Integrations
![[Scalasca] Tool Integrations](/thumbs/95/125562042.jpg "[Scalasca] Tool Integrations") Mitglied der Helmholtz-Gemeinschaft [Scalasca] Tool Integrations Aug 2011 Bernd Mohr CScADS Performance Tools Workshop Lake Tahoe Contents Current integration of various direct measurement tools Paraver
Mitglied der Helmholtz-Gemeinschaft [Scalasca] Tool Integrations Aug 2011 Bernd Mohr CScADS Performance Tools Workshop Lake Tahoe Contents Current integration of various direct measurement tools Paraver
Performance properties The metrics tour
 Performance properties The metrics tour Markus Geimer & Brian Wylie Jülich Supercomputing Centre scalasca@fz-juelich.de January 2012 Scalasca analysis result Confused? Generic metrics Generic metrics Time
A configurable binary instrumenter
 Mitglied der Helmholtz-Gemeinschaft A configurable binary instrumenter making use of heuristics to select relevant instrumentation points 12. April 2010 Jan Mussler j.mussler@fz-juelich.de Presentation
Performance properties The metrics tour
 Performance properties The metrics tour Markus Geimer & Brian Wylie Jülich Supercomputing Centre scalasca@fz-juelich.de August 2012 Scalasca analysis result Online description Analysis report explorer
Scalable performance analysis of large-scale parallel applications. Brian Wylie Jülich Supercomputing Centre
 Scalable performance analysis of large-scale parallel applications Brian Wylie Jülich Supercomputing Centre b.wylie@fz-juelich.de June 2009 Performance analysis, tools & techniques Profile analysis Summary
Score-P. SC 14: Hands-on Practical Hybrid Parallel Application Performance Engineering 1
 Score-P SC 14: Hands-on Practical Hybrid Parallel Application Performance Engineering 1 Score-P Functionality Score-P is a joint instrumentation and measurement system for a number of PA tools. Provide
Scalasca performance properties The metrics tour
 Scalasca performance properties The metrics tour Markus Geimer m.geimer@fz-juelich.de Scalasca analysis result Generic metrics Generic metrics Time Total CPU allocation time Execution Overhead Visits Hardware
Scalasca 1.4 User Guide
 Scalasca 1.4 User Guide Scalable Automatic Performance Analysis March 2013 The Scalasca Development Team scalasca@fz-juelich.de Copyright 1998 2013 Forschungszentrum Jülich GmbH, Germany Copyright 2009
Performance properties The metrics tour
 Performance properties The metrics tour Markus Geimer & Brian Wylie Jülich Supercomputing Centre scalasca@fz-juelich.de Scalasca analysis result Online description Analysis report explorer GUI provides
Performance Analysis with Periscope
 Performance Analysis with Periscope M. Gerndt, V. Petkov, Y. Oleynik, S. Benedict Technische Universität München periscope@lrr.in.tum.de October 2010 Outline Motivation Periscope overview Periscope performance
Performance analysis on Blue Gene/Q with
 Performance analysis on Blue Gene/Q with + other tools and debugging Michael Knobloch Jülich Supercomputing Centre scalasca@fz-juelich.de July 2012 Based on slides by Brian Wylie and Markus Geimer Performance
Developing Scalable Applications with Vampir, VampirServer and VampirTrace
 John von Neumann Institute for Computing Developing Scalable Applications with Vampir, VampirServer and VampirTrace Matthias S. Müller, Andreas Knüpfer, Matthias Jurenz, Matthias Lieber, Holger Brunst,
Performance analysis with Periscope
 Performance analysis with Periscope M. Gerndt, V. Petkov, Y. Oleynik, S. Benedict Technische Universität petkovve@in.tum.de March 2010 Outline Motivation Periscope (PSC) Periscope performance analysis
SCALASCA v1.0 Quick Reference
 General SCALASCA is an open-source toolset for scalable performance analysis of large-scale parallel applications. Use the scalasca command with appropriate action flags to instrument application object
Scalasca 1.3 User Guide
 Scalasca 1.3 User Guide Scalable Automatic Performance Analysis March 2011 The Scalasca Development Team scalasca@fz-juelich.de Copyright 1998 2011 Forschungszentrum Jülich GmbH, Germany Copyright 2009
Characterizing Imbalance in Large-Scale Parallel Programs. David Bo hme September 26, 2013
 Characterizing Imbalance in Large-Scale Parallel Programs David o hme September 26, 2013 Need for Performance nalysis Tools mount of parallelism in Supercomputers keeps growing Efficient resource usage
SPEC MPI2007 Benchmarks for HPC Systems
 SPEC MPI2007 Benchmarks for HPC Systems Ron Lieberman Chair, SPEC HPG HP-MPI Performance Hewlett-Packard Company Dr. Tom Elken Manager, Performance Engineering QLogic Corporation Dr William Brantley Manager
Performance Analysis for Large Scale Simulation Codes with Periscope
 Performance Analysis for Large Scale Simulation Codes with Periscope M. Gerndt, Y. Oleynik, C. Pospiech, D. Gudu Technische Universität München IBM Deutschland GmbH May 2011 Outline Motivation Periscope
Checklist for Selecting and Deploying Scalable Clusters with InfiniBand Fabrics
 Checklist for Selecting and Deploying Scalable Clusters with InfiniBand Fabrics Lloyd Dickman, CTO InfiniBand Products Host Solutions Group QLogic Corporation November 13, 2007 @ SC07, Exhibitor Forum
Introduction to Parallel Performance Engineering
 Introduction to Parallel Performance Engineering Markus Geimer, Brian Wylie Jülich Supercomputing Centre (with content used with permission from tutorials by Bernd Mohr/JSC and Luiz DeRose/Cray) Performance:
Quantifying power consumption variations of HPC systems using SPEC MPI benchmarks
 Center for Information Services and High Performance Computing (ZIH) Quantifying power consumption variations of HPC systems using SPEC MPI benchmarks EnA-HPC, Sept 16 th 2010, Robert Schöne, Daniel Molka,
Introduction to Parallel Performance Engineering with Score-P. Marc-André Hermanns Jülich Supercomputing Centre
 Introduction to Parallel Performance Engineering with Score-P Marc-André Hermanns Jülich Supercomputing Centre (with content used with permission from tutorials by Bernd Mohr/JSC and Luiz DeRose/Cray)
Usage of the SCALASCA toolset for scalable performance analysis of large-scale parallel applications
 Usage of the SCALASCA toolset for scalable performance analysis of large-scale parallel applications Felix Wolf 1,2, Erika Ábrahám 1, Daniel Becker 1,2, Wolfgang Frings 1, Karl Fürlinger 3, Markus Geimer
The SCALASCA performance toolset architecture
 The SCALASCA performance toolset architecture Markus Geimer 1, Felix Wolf 1,2, Brian J.N. Wylie 1, Erika Ábrahám 1, Daniel Becker 1,2, Bernd Mohr 1 1 Forschungszentrum Jülich 2 RWTH Aachen University Jülich
An evaluation of the Performance and Scalability of a Yellowstone Test-System in 5 Benchmarks
 An evaluation of the Performance and Scalability of a Yellowstone Test-System in 5 Benchmarks WRF Model NASA Parallel Benchmark Intel MPI Bench My own personal benchmark HPC Challenge Benchmark Abstract
Performance engineering of GemsFDTD computational electromagnetics solver
 Performance engineering of GemsFDTD computational electromagnetics solver Ulf Andersson 1 and Brian J. N. Wylie 2 1 PDC Centre for High Performance Computing, KTH Royal Institute of Technology, Stockholm,
IBM High Performance Computing Toolkit
 IBM High Performance Computing Toolkit Pidad D'Souza (pidsouza@in.ibm.com) IBM, India Software Labs Top 500 : Application areas (November 2011) Systems Performance Source : http://www.top500.org/charts/list/34/apparea
I/O Monitoring at JSC, SIONlib & Resiliency
 Mitglied der Helmholtz-Gemeinschaft I/O Monitoring at JSC, SIONlib & Resiliency Update: I/O Infrastructure @ JSC Update: Monitoring with LLview (I/O, Memory, Load) I/O Workloads on Jureca SIONlib: Task-Local
MPI Optimisation. Advanced Parallel Programming. David Henty, Iain Bethune, Dan Holmes EPCC, University of Edinburgh
 MPI Optimisation Advanced Parallel Programming David Henty, Iain Bethune, Dan Holmes EPCC, University of Edinburgh Overview Can divide overheads up into four main categories: Lack of parallelism Load imbalance
Performance of HPC Applications over InfiniBand, 10 Gb and 1 Gb Ethernet. Swamy N. Kandadai and Xinghong He and
 Performance of HPC Applications over InfiniBand, 10 Gb and 1 Gb Ethernet Swamy N. Kandadai and Xinghong He swamy@us.ibm.com and xinghong@us.ibm.com ABSTRACT: We compare the performance of several applications
General Purpose Timing Library (GPTL)
") General Purpose Timing Library (GPTL) A tool for characterizing parallel and serial application performance Jim Rosinski Outline Existing tools Motivation API and usage examples PAPI interface auto-profiling
General Purpose Timing Library (GPTL) A tool for characterizing parallel and serial application performance Jim Rosinski Outline Existing tools Motivation API and usage examples PAPI interface auto-profiling
I/O at JSC. I/O Infrastructure Workloads, Use Case I/O System Usage and Performance SIONlib: Task-Local I/O. Wolfgang Frings
 Mitglied der Helmholtz-Gemeinschaft I/O at JSC I/O Infrastructure Workloads, Use Case I/O System Usage and Performance SIONlib: Task-Local I/O Wolfgang Frings W.Frings@fz-juelich.de Jülich Supercomputing
Basic Communication Operations (Chapter 4)
") Basic Communication Operations (Chapter 4) Vivek Sarkar Department of Computer Science Rice University vsarkar@cs.rice.edu COMP 422 Lecture 17 13 March 2008 Review of Midterm Exam Outline MPI Example Program:
Basic Communication Operations (Chapter 4) Vivek Sarkar Department of Computer Science Rice University vsarkar@cs.rice.edu COMP 422 Lecture 17 13 March 2008 Review of Midterm Exam Outline MPI Example Program:
UCB CS61C : Machine Structures
 inst.eecs.berkeley.edu/~cs61c UCB CS61C : Machine Structures Lecture 36 Performance 2010-04-23 Lecturer SOE Dan Garcia How fast is your computer? Every 6 months (Nov/June), the fastest supercomputers in
LARGE-SCALE PERFORMANCE ANALYSIS OF SWEEP3D WITH THE SCALASCA TOOLSET
 Parallel Processing Letters Vol. 20, No. 4 (2010) 397 414 c World Scientific Publishing Company LARGE-SCALE PERFORMANCE ANALYSIS OF SWEEP3D WITH THE SCALASCA TOOLSET BRIAN J. N. WYLIE, MARKUS GEIMER, BERND
Stockholm Brain Institute Blue Gene/L
 Stockholm Brain Institute Blue Gene/L 1 Stockholm Brain Institute Blue Gene/L 2 IBM Systems & Technology Group and IBM Research IBM Blue Gene /P - An Overview of a Petaflop Capable System Carl G. Tengwall
Performance Analysis of MPI Programs with Vampir and Vampirtrace Bernd Mohr
 Performance Analysis of MPI Programs with Vampir and Vampirtrace Bernd Mohr Research Centre Juelich (FZJ) John von Neumann Institute of Computing (NIC) Central Institute for Applied Mathematics (ZAM) 52425
Scalable Critical Path Analysis for Hybrid MPI-CUDA Applications
 Center for Information Services and High Performance Computing (ZIH) Scalable Critical Path Analysis for Hybrid MPI-CUDA Applications The Fourth International Workshop on Accelerators and Hybrid Exascale
Performance Analysis and Modeling of the SciDAC MILC Code on Four Large-scale Clusters
 Performance Analysis and Modeling of the SciDAC MILC Code on Four Large-scale Clusters Xingfu Wu and Valerie Taylor Department of Computer Science, Texas A&M University Email: {wuxf, taylor}@cs.tamu.edu
Parallel I/O on JUQUEEN
 Parallel I/O on JUQUEEN 4. Februar 2014, JUQUEEN Porting and Tuning Workshop Mitglied der Helmholtz-Gemeinschaft Wolfgang Frings w.frings@fz-juelich.de Jülich Supercomputing Centre Overview Parallel I/O
Scalability of Trace Analysis Tools. Jesus Labarta Barcelona Supercomputing Center
 Scalability of Trace Analysis Tools Jesus Labarta Barcelona Supercomputing Center What is Scalability? Jesus Labarta, Workshop on Tools for Petascale Computing, Snowbird, Utah,July 2007 2 Index General
Analyzing the Performance of IWAVE on a Cluster using HPCToolkit
 Analyzing the Performance of IWAVE on a Cluster using HPCToolkit John Mellor-Crummey and Laksono Adhianto Department of Computer Science Rice University {johnmc,laksono}@rice.edu TRIP Meeting March 30,
Distributed recovery for senddeterministic. Tatiana V. Martsinkevich, Thomas Ropars, Amina Guermouche, Franck Cappello
 Distributed recovery for senddeterministic HPC applications Tatiana V. Martsinkevich, Thomas Ropars, Amina Guermouche, Franck Cappello 1 Fault-tolerance in HPC applications Number of cores on one CPU and
Visualization and Data Analysis using VisIt - In Situ Visualization -
 Mitglied der Helmholtz-Gemeinschaft Visualization and Data Analysis using VisIt - In Situ Visualization - Jens Henrik Göbbert 1, Herwig Zilken 1 1 Jülich Supercomputing Centre, Forschungszentrum Jülich
Score-P A Joint Performance Measurement Run-Time Infrastructure for Periscope, Scalasca, TAU, and Vampir (continued)
") Score-P A Joint Performance Measurement Run-Time Infrastructure for Periscope, Scalasca, TAU, and Vampir (continued) VI-HPS Team Congratulations!? If you made it this far, you successfully used Score-P
Score-P A Joint Performance Measurement Run-Time Infrastructure for Periscope, Scalasca, TAU, and Vampir (continued) VI-HPS Team Congratulations!? If you made it this far, you successfully used Score-P
A scalable tool architecture for diagnosing wait states in massively parallel applications
 A scalable tool architecture for diagnosing wait states in massively parallel applications Markus Geimer a, Felix Wolf a,b,, Brian J. N. Wylie a, Bernd Mohr a a Jülich Supercomputing Centre, Forschungszentrum
Sami Saarinen Peter Towers. 11th ECMWF Workshop on the Use of HPC in Meteorology Slide 1
 Acknowledgements: Petra Kogel Sami Saarinen Peter Towers 11th ECMWF Workshop on the Use of HPC in Meteorology Slide 1 Motivation Opteron and P690+ clusters MPI communications IFS Forecast Model IFS 4D-Var
Intel VTune Performance Analyzer 9.1 for Windows* In-Depth
 Intel VTune Performance Analyzer 9.1 for Windows* In-Depth Contents Deliver Faster Code...................................... 3 Optimize Multicore Performance...3 Highlights...............................................
MPI Performance Tools
 Physics 244 31 May 2012 Outline 1 Introduction 2 Timing functions: MPI Wtime,etime,gettimeofday 3 Profiling tools time: gprof,tau hardware counters: PAPI,PerfSuite,TAU MPI communication: IPM,TAU 4 MPI
Ateles performance assessment report
 Ateles performance assessment report Document Information Reference Number Author Contributor(s) Date Application Service Level Keywords AR-4, Version 0.1 Jose Gracia (USTUTT-HLRS) Christoph Niethammer,
RDMA Read Based Rendezvous Protocol for MPI over InfiniBand: Design Alternatives and Benefits
 RDMA Read Based Rendezvous Protocol for MPI over InfiniBand: Design Alternatives and Benefits Sayantan Sur Hyun-Wook Jin Lei Chai D. K. Panda Network Based Computing Lab, The Ohio State University Presentation
EZTrace upcoming features
 EZTrace 1.0 + upcoming features François Trahay francois.trahay@telecom-sudparis.eu 2015-01-08 Context Hardware is more and more complex NUMA, hierarchical caches, GPU,... Software is more and more complex
MILC Performance Benchmark and Profiling. April 2013
 MILC Performance Benchmark and Profiling April 2013 Note The following research was performed under the HPC Advisory Council activities Special thanks for: HP, Mellanox For more information on the supporting
Performance analysis basics
 Performance analysis basics Christian Iwainsky Iwainsky@rz.rwth-aachen.de 25.3.2010 1 Overview 1. Motivation 2. Performance analysis basics 3. Measurement Techniques 2 Why bother with performance analysis
Score-P A Joint Performance Measurement Run-Time Infrastructure for Periscope, Scalasca, TAU, and Vampir
 Score-P A Joint Performance Measurement Run-Time Infrastructure for Periscope, Scalasca, TAU, and Vampir VI-HPS Team Congratulations!? If you made it this far, you successfully used Score-P to instrument
UCB CS61C : Machine Structures
 inst.eecs.berkeley.edu/~cs61c UCB CS61C : Machine Structures Lecture 38 Performance 2008-04-30 Lecturer SOE Dan Garcia How fast is your computer? Every 6 months (Nov/June), the fastest supercomputers in
Lawrence Livermore National Laboratory Tools for High Productivity Supercomputing: Extreme-scale Case Studies
 Lawrence Livermore National Laboratory Tools for High Productivity Supercomputing: Extreme-scale Case Studies EuroPar 2013 Martin Schulz Lawrence Livermore National Laboratory Brian Wylie Jülich Supercomputing
LS-DYNA Scalability Analysis on Cray Supercomputers
 13 th International LS-DYNA Users Conference Session: Computing Technology LS-DYNA Scalability Analysis on Cray Supercomputers Ting-Ting Zhu Cray Inc. Jason Wang LSTC Abstract For the automotive industry,
High performance computing and numerical modeling
 High performance computing and numerical modeling Volker Springel Plan for my lectures Lecture 1: Collisional and collisionless N-body dynamics Lecture 2: Gravitational force calculation Lecture 3: Basic
READEX: A Tool Suite for Dynamic Energy Tuning. Michael Gerndt Technische Universität München
 READEX: A Tool Suite for Dynamic Energy Tuning Michael Gerndt Technische Universität München Campus Garching 2 SuperMUC: 3 Petaflops, 3 MW 3 READEX Runtime Exploitation of Application Dynamism for Energy-efficient
Hardware Counter Performance Analysis of Parallel Programs
 Holistic Hardware Counter Performance Analysis of Parallel Programs Brian J. N. Wylie & Bernd Mohr John von Neumann Institute for Computing Forschungszentrum Jülich B.Wylie@fz-juelich.de Outline Hardware
Performance Tools for Technical Computing
 Christian Terboven terboven@rz.rwth-aachen.de Center for Computing and Communication RWTH Aachen University Intel Software Conference 2010 April 13th, Barcelona, Spain Agenda o Motivation and Methodology
Instrumentation. BSC Performance Tools
 Instrumentation BSC Performance Tools Index The instrumentation process A typical MN process Paraver trace format Configuration XML Environment variables Adding references to the source API CEPBA-Tools
CMSC 714 Lecture 6 MPI vs. OpenMP and OpenACC. Guest Lecturer: Sukhyun Song (original slides by Alan Sussman)
") CMSC 714 Lecture 6 MPI vs. OpenMP and OpenACC Guest Lecturer: Sukhyun Song (original slides by Alan Sussman) Parallel Programming with Message Passing and Directives 2 MPI + OpenMP Some applications can
CMSC 714 Lecture 6 MPI vs. OpenMP and OpenACC Guest Lecturer: Sukhyun Song (original slides by Alan Sussman) Parallel Programming with Message Passing and Directives 2 MPI + OpenMP Some applications can
VAMPIR & VAMPIRTRACE INTRODUCTION AND OVERVIEW
 VAMPIR & VAMPIRTRACE INTRODUCTION AND OVERVIEW 8th VI-HPS Tuning Workshop at RWTH Aachen September, 2011 Tobias Hilbrich and Joachim Protze Slides by: Andreas Knüpfer, Jens Doleschal, ZIH, Technische Universität
Analyzing the High Performance Parallel I/O on LRZ HPC systems. Sandra Méndez. HPC Group, LRZ. June 23, 2016
 Analyzing the High Performance Parallel I/O on LRZ HPC systems Sandra Méndez. HPC Group, LRZ. June 23, 2016 Outline SuperMUC supercomputer User Projects Monitoring Tool I/O Software Stack I/O Analysis
A Trace-Scaling Agent for Parallel Application Tracing 1
 A Trace-Scaling Agent for Parallel Application Tracing 1 Felix Freitag, Jordi Caubet, Jesus Labarta Computer Architecture Department (DAC) European Center for Parallelism of Barcelona (CEPBA) Universitat
Shared Memory Parallel Programming. Shared Memory Systems Introduction to OpenMP
 Shared Memory Parallel Programming Shared Memory Systems Introduction to OpenMP Parallel Architectures Distributed Memory Machine (DMP) Shared Memory Machine (SMP) DMP Multicomputer Architecture SMP Multiprocessor
Porting The Spectral Element Community Atmosphere Model (CAM-SE) To Hybrid GPU Platforms
 To Hybrid GPU Platforms") Porting The Spectral Element Community Atmosphere Model (CAM-SE) To Hybrid GPU Platforms http://www.scidacreview.org/0902/images/esg13.jpg Matthew Norman Jeffrey Larkin Richard Archibald Valentine Anantharaj
Porting The Spectral Element Community Atmosphere Model (CAM-SE) To Hybrid GPU Platforms http://www.scidacreview.org/0902/images/esg13.jpg Matthew Norman Jeffrey Larkin Richard Archibald Valentine Anantharaj
Scalable, Automated Parallel Performance Analysis with TAU, PerfDMF and PerfExplorer
 Scalable, Automated Parallel Performance Analysis with TAU, PerfDMF and PerfExplorer Kevin A. Huck, Allen D. Malony, Sameer Shende, Alan Morris khuck, malony, sameer, amorris@cs.uoregon.edu http://www.cs.uoregon.edu/research/tau
Parallel Processing. Parallel Processing. 4 Optimization Techniques WS 2018/19
 Parallel Processing WS 2018/19 Universität Siegen rolanda.dwismuellera@duni-siegena.de Tel.: 0271/740-4050, Büro: H-B 8404 Stand: September 7, 2018 Betriebssysteme / verteilte Systeme Parallel Processing
Performance Comparison between Blocking and Non-Blocking Communications for a Three-Dimensional Poisson Problem
 Performance Comparison between Blocking and Non-Blocking Communications for a Three-Dimensional Poisson Problem Guan Wang and Matthias K. Gobbert Department of Mathematics and Statistics, University of
Review of previous examinations TMA4280 Introduction to Supercomputing
 Review of previous examinations TMA4280 Introduction to Supercomputing NTNU, IMF April 24. 2017 1 Examination The examination is usually comprised of: one problem related to linear algebra operations with
ScalaIOTrace: Scalable I/O Tracing and Analysis
 ScalaIOTrace: Scalable I/O Tracing and Analysis Karthik Vijayakumar 1, Frank Mueller 1, Xiaosong Ma 1,2, Philip C. Roth 2 1 Department of Computer Science, NCSU 2 Computer Science and Mathematics Division,
Optimization of MPI Applications Rolf Rabenseifner
 Optimization of MPI Applications Rolf Rabenseifner University of Stuttgart High-Performance Computing-Center Stuttgart (HLRS) www.hlrs.de Optimization of MPI Applications Slide 1 Optimization and Standardization
Determining Optimal MPI Process Placement for Large- Scale Meteorology Simulations with SGI MPIplace
 Determining Optimal MPI Process Placement for Large- Scale Meteorology Simulations with SGI MPIplace James Southern, Jim Tuccillo SGI 25 October 2016 0 Motivation Trend in HPC continues to be towards more
An Implementation of the POMP Performance Monitoring for OpenMP based on Dynamic Probes
 An Implementation of the POMP Performance Monitoring for OpenMP based on Dynamic Probes Luiz DeRose IBM Research ACTC Yorktown Heights, NY USA laderose@us.ibm.com Bernd Mohr Forschungszentrum Jülich ZAM
Adventures in Load Balancing at Scale: Successes, Fizzles, and Next Steps
 Adventures in Load Balancing at Scale: Successes, Fizzles, and Next Steps Rusty Lusk Mathematics and Computer Science Division Argonne National Laboratory Outline Introduction Two abstract programming
Jülich Supercomputing Centre
 Mitglied der Helmholtz-Gemeinschaft Jülich Supercomputing Centre Norbert Attig Jülich Supercomputing Centre (JSC) Forschungszentrum Jülich (FZJ) Aug 26, 2009 DOAG Regionaltreffen NRW 2 Supercomputing at
Critically Missing Pieces on Accelerators: A Performance Tools Perspective
 Critically Missing Pieces on Accelerators: A Performance Tools Perspective, Karthik Murthy, Mike Fagan, and John Mellor-Crummey Rice University SC 2013 Denver, CO November 20, 2013 What Is Missing in GPUs?
On the scalability of tracing mechanisms 1
 On the scalability of tracing mechanisms 1 Felix Freitag, Jordi Caubet, Jesus Labarta Departament d Arquitectura de Computadors (DAC) European Center for Parallelism of Barcelona (CEPBA) Universitat Politècnica
Algorithm Engineering with PRAM Algorithms
 Algorithm Engineering with PRAM Algorithms Bernard M.E. Moret moret@cs.unm.edu Department of Computer Science University of New Mexico Albuquerque, NM 87131 Rome School on Alg. Eng. p.1/29 Measuring and
Further MPI Programming. Paul Burton April 2015
 Further MPI Programming Paul Burton April 2015 Blocking v Non-blocking communication Blocking communication - Call to MPI sending routine does not return until the send buffer (array) is safe to use again
Parallel I/O using standard data formats in climate and NWP
 Parallel I/O using standard data formats in climate and NWP Project ScalES funded by BMBF Deike Kleberg Luis Kornblueh, Hamburg MAX-PLANCK-GESELLSCHAFT Outline Introduction Proposed Solution Implementation
MPI Runtime Error Detection with MUST
 MPI Runtime Error Detection with MUST At the 27th VI-HPS Tuning Workshop Joachim Protze IT Center RWTH Aachen University April 2018 How many issues can you spot in this tiny example? #include #include
Allinea Unified Environment
 Allinea Unified Environment Allinea s unified tools for debugging and profiling HPC Codes Beau Paisley Allinea Software bpaisley@allinea.com 720.583.0380 Today s Challenge Q: What is the impact of current
Introduction to Performance Engineering
 Introduction to Performance Engineering Markus Geimer Jülich Supercomputing Centre (with content used with permission from tutorials by Bernd Mohr/JSC and Luiz DeRose/Cray) Performance: an old problem
Enzo-P / Cello. Scalable Adaptive Mesh Refinement for Astrophysics and Cosmology. San Diego Supercomputer Center. Department of Physics and Astronomy
 Enzo-P / Cello Scalable Adaptive Mesh Refinement for Astrophysics and Cosmology James Bordner 1 Michael L. Norman 1 Brian O Shea 2 1 University of California, San Diego San Diego Supercomputer Center 2
Tool for Analysing and Checking MPI Applications
 Tool for Analysing and Checking MPI Applications April 30, 2010 1 CONTENTS CONTENTS Contents 1 Introduction 3 1.1 What is Marmot?........................... 3 1.2 Design of Marmot..........................
A Survey on Performance Tools for OpenMP
 A Survey on Performance Tools for OpenMP Mubrak S. Mohsen, Rosni Abdullah, and Yong M. Teo Abstract Advances in processors architecture, such as multicore, increase the size of complexity of parallel computer
Analysis report examination with Cube
 Analysis report examination with Cube Marc-André Hermanns Jülich Supercomputing Centre Cube Parallel program analysis report exploration tools Libraries for XML+binary report reading & writing Algebra
Using Lamport s Logical Clocks
 Fast Classification of MPI Applications Using Lamport s Logical Clocks Zhou Tong, Scott Pakin, Michael Lang, Xin Yuan Florida State University Los Alamos National Laboratory 1 Motivation Conventional trace-based