Buffering in ArcMap tutorial
|
|
|
- Mitchell Lyons
- 5 years ago
- Views:
Transcription

1 Buffering in ArcMap tutorial 1) Open ArcMap 2) Bring in the Wards_2010 and Parks shape files from the city of Ottawa s open data portal. (NOTE: for the purposes of this tutorial, you could also bring in the play structures to see if any discarded syringes or needles are located within a short walking distance.) 3) Download the discarded syringe file. 4) Import the discarded syringe file into ArcMap.
 In order to ensure that the locations appear on the parks and ward layers, we will have to specify the")
2 5) Right-click on the discarded syringe layer and choose the Display XY Data option from the menu. 6) In order to ensure that the locations appear on the parks and ward layers, we will have to specify the coordinate system.
 Choose the Select tab to find the appropriate coordinate system ( NOTE:")
3 7) Go to the Edit button. 8) Choose the Select tab to find the appropriate coordinate system ( NOTE: Our textbook, Computer-Assisted Reporting, discuss


4 geographic coordinate systems on page 206 and 215). 9) Select the Geographic Coordinate Systems folder.

5 10) Choose the North America Folder, and NAD 1983.prj

6

7 11) Select the Apply and OK tabs.
 Ignore the warning because ArcMap will")

8 12) Select the OK tab. 13) Ignore the warning because ArcMap will create an Object-ID field when we save this layer as a shape file. So select the OK tab to place the points on the layers.
9 14) Now are layers are in line. We can to see how many of these discarded needles or syringes fall within, say, 50 metres of parks, which is roughly walking distance for moms or dads with small children. As we noted above, you could also pull in play structures. But let s stick with parks for the purposes of this tutorial. 15) Right click on the syringe layer and save it as a shape file. 16) Select the Syringe layer, and then go to the Selection tab at the menu across the top to obtain the Select By Location option. 17) Select Parks. Our Source layer is the syringe file. And let s choose a 50 metre search distance or buffer and be sure to specify that discarded items are to be found within a distance of

10 the source layer feature. Your dialog box should look like this: 18) Select the Apply tab. And Open the layer s attribute table to see how many discarded items were located within 50 metres
 Right click on the layer and select Export Data, which will produce a dialog box that allows you to export the selected features.")
11 of parks. 19) Close the attribute table. 20) Right click on the layer and select Export Data, which will produce a dialog box that allows you to export the selected features. (NOTE: In Qgis, you have to specify that you want to export the selected features once you get the export dialog box. )
 Once the new layer is added to the map, turn off the layer with the full complement of discarded items.")
12 21) Name the shape file with a recognizable label, something like Syringes50MfromParks, and save the file in the same folder as the other layers. 22) Once the new layer is added to the map, turn off the layer with the full complement of discarded items. 23) So far, we ve done enough analysis to produce the kinds of stories the Toronto Star and CBC have done. You can also export this layer as a csv file. 24) Now that we know the number of discarded syringes close to parks, let s see how many of these items are located in particular wards. 25) To do this, we will count the number of discarded items in wards, by joining the two layers. (IN Qgis, this is function is called Points in Polygons. )
 Since we re doing a spatial join, using the geographic coordinates from the two files, we will change the option under the What do you want to join to this layer")
13 26) Right-click on the wards layer, and select Joins. 27) Since we re doing a spatial join, using the geographic coordinates from the two files, we will change the option under the What do you want to join to this layer section at the top of the dialog box. 28) The layer we want to join is the one selected, the Syringes50MfromParks.
 Let s save the new layer in the same folder with the other files, making sure to give it a name that clearly")
14 29) And we want to SUM the number of discarded syringes within each ward. 30) Let s save the new layer in the same folder with the other files, making sure to give it a name that clearly distinguishes it from the other layers.
 The new layer is one colour.")

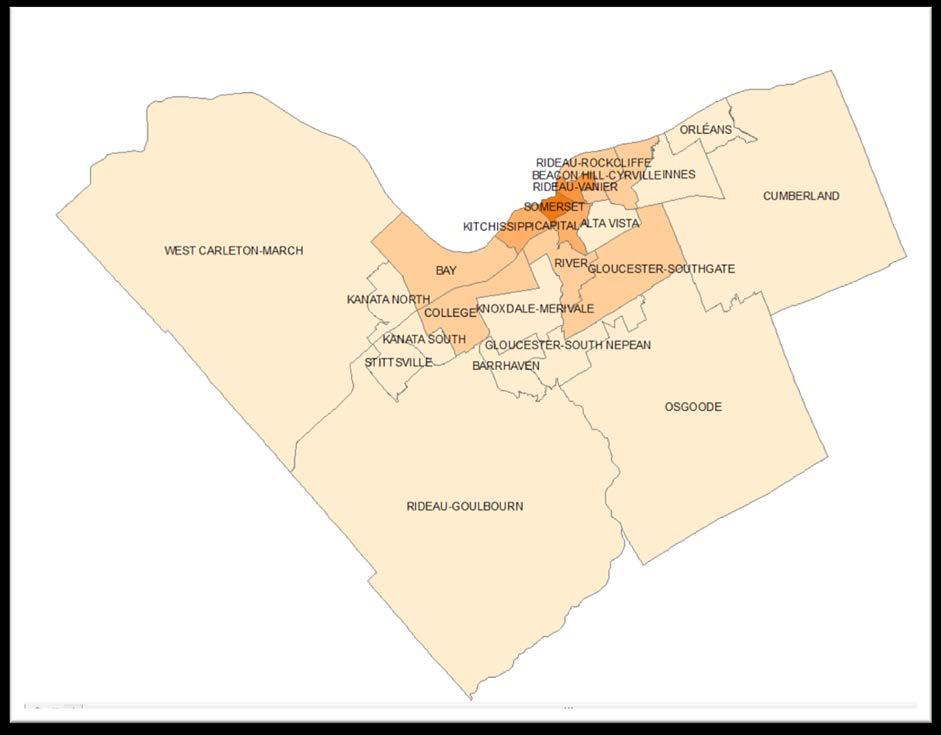
15 31) Let s call it Syringes50MfromParksInWards. 32) The new layer is one colour. But if we open the attribute table, we can see that ArcMap has counted the discarded syringes nearest parks in each ward.
 Select Symbology, Quantities, Count in Values, and select a range.")
16 33) Close the attribute table, right click on the new layer to obtain the Properties dialog box. 34) Select Symbology, Quantities, Count in Values, and select a range. 35) Let s stick with the five classes and this colour ramp.

17 36) Select the Apply and OK tabs.
 Select the Apply and OK tabs.")
18 37) Return to the Properties dialog box to select the ward labels. 38) Select the Apply and OK tabs.
19 39)
Chapter 7. Buffering in QGIS Desktop
 Chapter 7 Buffering in QGIS Desktop Summary: How far away is that? How many are too close? These are some of the most compelling mapping questions journalists can ask. A buffer is one of the most useful
Selecting Attributes and Location in QGIS Desktop
 Chapter 7 Selecting Attributes and Location in QGIS Desktop Summary: This tutorial covers selecting features in QGIS. If you are unfamiliar with the basics of the QGIS user interface, please read the tutorial
Mapping discarded needles in Fusion Tables Tutorial
 Mapping discarded needles in Fusion Tables Tutorial In the previous tutorials, we ve learned how to turn pivot tables into heat maps and place colour code geographic points using markers that Fusion Tables
The Data Journalist Chapter 7 tutorial Geocoding in ArcGIS Desktop
 The Data Journalist Chapter 7 tutorial Geocoding in ArcGIS Desktop Summary: In many cases, online geocoding services are all you will need to convert addresses and other location data into geographic data.
v SMS 12.1 Tutorial GIS Requirements GIS Module Map Module ArcGis (Optional) Time minutes Prerequisites None Objectives
 Time minutes Prerequisites None Objectives") v. 12.1 SMS 12.1 Tutorial Objectives This tutorial demonstrates how to read in data, visualize it, and convert it into SMS coverage data that could be used to build a numeric model. This tutorial will
v. 12.1 SMS 12.1 Tutorial Objectives This tutorial demonstrates how to read in data, visualize it, and convert it into SMS coverage data that could be used to build a numeric model. This tutorial will
v SMS 11.1 Tutorial GIS Requirements GIS Module Map Module ArcGis (Optional) Time minutes Prerequisites None Objectives
 Time minutes Prerequisites None Objectives") v. 11.1 SMS 11.1 Tutorial GIS Objectives This tutorial demonstrates how you can read in GIS data, visualize it, and convert it into SMS coverage data that could be used to build a numeric model. We will
v. 11.1 SMS 11.1 Tutorial GIS Objectives This tutorial demonstrates how you can read in GIS data, visualize it, and convert it into SMS coverage data that could be used to build a numeric model. We will
Table of Contents. Krista White GIS Support Specialist x 3926 Office HS 104 T, Th 8:00AM-12:00PM, 1:00PM-4:00PM F 8:00-11:30AM
 1 Create Visually Stunning Maps with the Cartograms Tool Cartograms are a method of displaying geospatial data as totals, wherein data are displayed with both color and area as a function of their values.
This will display various panes in a window.
 Map Map projections in ArcMap can be a bit confusing, because the program often automatically reprojects data for display, and there are a ways to permanently project data to new data sets. This describes
GGR 375 QGIS Tutorial
 GGR 375 QGIS Tutorial With text taken from: Sherman, Gary E. Shuffling Quantum GIS into the Open Source GIS Stack. Free and Open Source Software for Geospatial (FOSS4G) Conference. 2007. Available online
Getting Started with GIS using ArcGIS 10.6 What is GIS? and - Module 1 Creating a map document
 Getting Started with GIS using ArcGIS 10.6 What is GIS? and - Module 1 Creating a map document Marcel Fortin Map & Data Library mdl@library.utoronto.ca 2018 http://mdl.library.utoronto.ca This workshop
Software Tutorial for the Installation of Quantum GIS 1.8
 Software Tutorial for the Installation of Quantum GIS 1.8 JOU1526 - COMPUTER-ASSISTED REPORTING Algonquin College Fall Semester 2013 Professor : David McKie GIS Assistant: Matt Pulleyblank 1 Installation
Chapter 6. Building Maps with ArcGIS Online
 Chapter 6 Building Maps with ArcGIS Online Summary: ArcGIS Online is an on-line mapping software that allows you to upload tables with latitude and longitude geographic coordinates to create map layers
GIS Virtual Workshop: Buffering
 This workshop will teach the different methods of buffering data. They will include: Basic buffering of data Merging buffering zones Clipping the buffer Concentric rings around the object You will find
1.3 Editing the Legend
 Introduction to ArcGIS 10 Editing the Legend 1.3.1 1.3 Editing the Legend As you make maps, you will want to change the color of the map layers themselves, or change the shape, size, or color of the symbols.
Exercise Producing Thematic Maps for Dissemination
 Exercise Producing Thematic Maps for Dissemination 2007 In this exercise you will work with an existing file geodatabase which contains administrative boundaries (named wards) feature class and population
1. Open the New American FactFinder using this link:
 Exercises for Mapping and Using US Census Data MIT GIS Services, IAP 2012 More information, including a comparison of tools available through the MIT Libraries, can be found at: http://libraries.mit.edu/guides/types/census/tools-overview.html
Step by Step GIS. Section 1
 Step by Step GIS Section 1 Contact the web page given below for the data required to do the exercises (http://www.pasda.psu.edu/default.asp) Before beginning the tutorials please visit the Preparation
Downloading 2010 Census Data
 Downloading 2010 Census Data These instructions cover downloading the Census Tract polygons and the separate attribute data. After that, the attribute data will need additional formatting in Excel before
INTRODUCTION TO GIS WORKSHOP EXERCISE
 111 Mulford Hall, College of Natural Resources, UC Berkeley (510) 643-4539 INTRODUCTION TO GIS WORKSHOP EXERCISE This exercise is a survey of some GIS and spatial analysis tools for ecological and natural
v SMS 12.2 Tutorial GIS Requirements GIS Module Map Module ArcGis (Optional) Time minutes Prerequisites None Objectives
 Time minutes Prerequisites None Objectives") v. 12.2 SMS 12.2 Tutorial Objectives This tutorial demonstrates how to read in data, visualize it, and convert it into SMS coverage data that could be used to build a numeric model. This tutorial will
v. 12.2 SMS 12.2 Tutorial Objectives This tutorial demonstrates how to read in data, visualize it, and convert it into SMS coverage data that could be used to build a numeric model. This tutorial will
Project 2 CIVL 3161 Advanced Editing
 Project 2 CIVL 3161 Advanced Editing Introduction This project will involve more advanced editing/manipulation of data within ArcGIS. You will use the map that you create in this project as a starting
Census tutorial using the city of Ottawa s wards
 Census tutorial using the city of Ottawa s wards Every five years, Statistics Canada uses the Census Program to collect vital data about Canadians that paints a portrait of who we are. Traditionally, the
Tutorial for mapping Toronto s 2013 fire hydrant parking ticket data
 Tutorial for mapping Toronto s 2013 fire hydrant parking ticket data Toronto, like cities including Vancouver, Edmonton, Ottawa and Halifax, has an open data site with lots of great data to download. The
Lesson 8 : How to Create a Distance from a Water Layer
 Created By: Lane Carter Advisor: Paul Evangelista Date: July 2011 Software: ArcGIS 10 Lesson 8 : How to Create a Distance from a Water Layer Background This tutorial will cover the basic processes involved
v SMS 13.0 Tutorial GIS P Prerequisites Time Requirements Objectives
 v. 13.0 SMS 13.0 Tutorial Objectives This tutorial demonstrates how to import data, visualize it, and convert it into SMS coverage data that could be used to build a numeric model. This tutorial will instruct
Section 2: Downloading and Processing Data
 Downloading and Processing Data Joining Data Tables 2.1.1 Section 2: Downloading and Processing Data 2.1 Joining Data Tables Many times you will find a table of data that you want to map, perhaps as an
GIS Basics for Urban Studies
 GIS Basics for Urban Studies Date: March 21, 2018 Contacts: Mehdi Aminipouri, Graduate Peer GIS Faciliator, SFU Library (maminipo@sfu.ca) Keshav Mukunda, GIS & Map Librarian Librarian for Geography (kmukunda@sfu.ca)
Combine Yield Data From Combine to Contour Map Ag Leader
 Combine Yield Data From Combine to Contour Map Ag Leader Exporting the Yield Data Using SMS Program 1. Data format On Hard Drive. 2. Start program SMS Basic. a. In the File menu choose Open. b. Click on
Introduction to GIS & Mapping: ArcGIS Desktop
 Introduction to GIS & Mapping: ArcGIS Desktop Your task in this exercise is to determine the best place to build a mixed use facility in Hudson County, NJ. In order to revitalize the community and take
An Introduction to Geographic Information Systems (GIS) using ArcGIS 9.2
 using ArcGIS 9.2") An Introduction to Geographic Information Systems (GIS) using ArcGIS 9.2 by Marcel Fortin, GIS and Map Librarian, University of Toronto Libraries, 2009 gis.maps@utoronto.ca http://www.library.utoronto.ca/maplib/
An Introduction to Geographic Information Systems (GIS) using ArcGIS 9.2 by Marcel Fortin, GIS and Map Librarian, University of Toronto Libraries, 2009 gis.maps@utoronto.ca http://www.library.utoronto.ca/maplib/
GPS to GIS Tutorial Exploration of Native Plants
 Grossmont College Introduction to GIScience NAME: Instructors: Curran & Goodman 1 GPS to GIS Tutorial Exploration of Native Plants 1. Create a folder on your USB drive titled: GPS1 2. Using your GPS receiver,
Chapter 7. Joining Maps to Other Datasets in QGIS
 Chapter 7 Joining Maps to Other Datasets in QGIS Skills you will learn: How to join a map layer to a non-map layer in preparation for analysis, based on a common joining field shared by the two tables.
Workshop #1 - Introduction to ESRI ARCGIS. Exercise # 1 - Creating a Simple Map in ArcMap
 Workshop #1 - Introduction to ESRI ARCGIS Exercise # 1 - Creating a Simple Map in ArcMap In this exercise you are introduced to the ArcMap interface and some of the basic skills necessary to create simple
Geocoding Address Data
 Preparing for the tutorial Geocoding Address Data First, you need to download the dataset for this exercise from out web server at http://www.library.yale.edu/mapcoll/files/data/geocode_data.zip. Create
Using Spatial Data in a Desktop GIS; QGIS 2.8 Practical 2
 Using Spatial Data in a Desktop GIS; QGIS 2.8 Practical 2 Practical 2 Learning objectives: To work with a vector base map within a GIS and overlay point data. To practise using Ordnance Survey mapping
Choropleth Mapping with GIS
 Choropleth Mapping with GIS In this lab you will be making 4 choropleth maps of the data you downloaded and processed last week. You will make your maps in ArcGIS using three different methods of classing
Introduction to Geospatial Technology Lab Series. Lab: Basic Geospatial Analysis Techniques
 Introduction to Geospatial Technology Lab Series Lab: Basic Geospatial Analysis Techniques Document Version: 2012-08-24 Lab Author: Richard Smith Organization: Copyright 2003-2012 Center for Systems Security
LAB EXERCISE #1 (25pts)
") Grossmont College Introduction to Geographic Information Science Name: Instructors: Judd Curran & Mark Goodman 1 LAB EXERCISE #1 (25pts) ArcGIS Map Projection on the Fly: Working with: U.S. Map illustrating
Grossmont College Introduction to Geographic Information Science Name: Instructors: Judd Curran & Mark Goodman 1 LAB EXERCISE #1 (25pts) ArcGIS Map Projection on the Fly: Working with: U.S. Map illustrating
Calculate a Distance Matrix of Locations along River Network
 Calculate a Distance Matrix of Locations along River Network These instructions enable you to measure the length of line segments between points, which is much more useful than simple straight-line distances
Basic Tasks in ArcGIS 10.3.x
 Basic Tasks in ArcGIS 10.3.x This guide provides instructions for performing a few basic tasks in ArcGIS 10.3.1, such as adding data to a map document, viewing and changing coordinate system information,
Downloading Census Data from American Factfinder for use in ArcGIS
 Downloading Census Data from American Factfinder for use in ArcGIS Written by Barbara Parmenter, revised September 24 2013 OBTAINING DATA FROM AMERICAN FACTFINDER (AFF)... 1 PREPARING AMERICAN FACTFINDER
Making Yield Contour Maps Using John Deere Data
 Making Yield Contour Maps Using John Deere Data Exporting the Yield Data Using JDOffice 1. Data Format On Hard Drive 2. Start program JD Office. a. From the PC Card menu on the left of the screen choose
Basic Mapping: Livelihood Zones In Haiti
 Basic Mapping: Livelihood Zones In Haiti - 2009 Barbara Parmenter, revised by Carolyn Talmadge 9/10/2017 for ArcMap 10.5.1 DATA SOURCES... 1 MAPPING NETWORK DRIVES OUTSIDE THE DATA LAB... 2 SETTING UP
Basic Mapping: Livelihood Zones In Haiti
 Basic Mapping: Livelihood Zones In Haiti - 2009 Barbara Parmenter, revised by Carolyn Talmadge 9/10/2016 DATA SOURCES... 1 MAPPING NETWORK DRIVES OUTSIDE THE DATA LAB... 2 SETTING UP YOUR ARCMAP SESSION...
Basic Queries Exercise - Haiti
 Basic Queries Exercise - Haiti Written by Barbara Parmenter, revised by Carolyn Talmadge on September 18, 2016 SETTING UP... 1 WHERE ARE THE HOSPITALS THAT ARE STILL OPERATING? (SELECT BY ATTRIBUTE )...
Selecting by Attributes and Location in ArcGIS Pro
 Chapter 7 Selecting by Attributes and Location in ArcGIS Pro Skills you will learn: This tutorial covers selecting features in ArcGIS Pro. If you are unfamiliar with the basics of the ArcGIS Pro user interface,
Lab 7: Tables Operations in ArcMap
 Lab 7: Tables Operations in ArcMap What You ll Learn: This Lab provides more practice with tabular data management in ArcMap. In this Lab, we will view, select, re-order, and update tabular data. You should
Map Making Tutorial Jennifer Ailshire June 25, Adding Data to the Map and Saving the Map
 Map Making Tutorial Jennifer Ailshire June 25, 2008 Adding Data to the Map and Saving the Map Click on the Add Data button, browse to the appropriate directory and select the desired file(s). After you
Geocoding Address Data
 Geocoding Address Data First, you need to download the dataset for this exercise from out web server at http://www.library.yale.edu/mapcoll/beta/files/data/geocode_data.zip. Create a folder (use your initials
GPS TO GIS EXERCISE (30 PTS)
") GPS TO GIS EXERCISE (30 PTS) This exercise will allow you to demonstrate your cumulative knowledge of using a GPS receiver to collect data with locational information, downloading this data to a desktop
GPS TO GIS EXERCISE (30 PTS) This exercise will allow you to demonstrate your cumulative knowledge of using a GPS receiver to collect data with locational information, downloading this data to a desktop
Geography 104 Instructors: Judd Curran & Mark Goodman. LAB EXERCISE #3 Data Analysis - Buffering (25pts)
") Instructors: Judd Curran & Mark Goodman Name: LAB EXERCISE #3 Data Analysis - Buffering (25pts) Transformations in GIS are methods that transform GIS objects and databases into more useful products using
Instructors: Judd Curran & Mark Goodman Name: LAB EXERCISE #3 Data Analysis - Buffering (25pts) Transformations in GIS are methods that transform GIS objects and databases into more useful products using
Section 1: Introduction to Arc GIS 10
 Introduction to ArcGIS 10 Getting Started 1.1.1 Section 1: Introduction to Arc GIS 10 A main component of ArcGIS 10 software is ArcMap. It can be used to create and edit maps and analyze spatial data.
Working with International Census Data in GIS
 Working with International Census Data in GIS Updated February 23, 2015 Table of Contents SETTING UP... 1 DATA SOURCES... 1 TABULAR CENSUS DATA... 2 2001 Tabular Census Data... 5 GEOGRAPHIC DATA... 5 JOINING
Creating a Smaller Data Set from a Larger Data Set Vector Data
 Creating a Smaller Data Set from a Larger Data Set Vector Data Written by Barbara Parmenter, revised by Carolyn Talmadge January 16, 2015 USING THE SELECTION METHOD QUICK METHOD BY CREATING A LAYER FILE...
Historical GIS Workshop
 Historical GIS Workshop University of Toronto Libraries Toronto, ON July 24 and 25, 2008 Copyright 2008 Sponsored by NiCHE Network in Canadian History & Environment / Nouvelle initiative canadienne en
How to calculate population and jobs within ½ mile radius of site
 How to calculate population and jobs within ½ mile radius of site Caltrans Project P359, Trip Generation Rates for Transportation Impact Analyses of Smart Growth Land Use Projects SECTION PAGE Population
1. Start ArcMap by going to the Start menu > All Programs > ArcGIS > ArcMap.
 Learning ArcGIS: Introduction to ArcMap 10.1 The Map Document Feature Manipulation Navigating ArcMap Map Documents, Layers, and Features Shapes, Location, and Attribute Data Symbology Zoom, Pan and Map
Tutorial for mapping Census 2016 data in Qgis by census tracts
 Tutorial for mapping Census 2016 data in Qgis by census tracts Skills you will learn: How to join a Census 2016 map layer to a Census 2016 non-map layer, based on a common joining field shared by the two
Step by Step How to Manual
 www.quintewestmaps.com Step by Step How to Manual Click on to accept the disclaimer and go to the web GIS Step by Step Web Based GIS Interface Layout of Web Based GIS Save your Favorite Map Views Link
CE 549 Lab 1 - Linking Streamflow Data to a Gauging Station
 CE 549 Lab 1 - Linking Streamflow Data to a Gauging Station Prepared by Venkatesh Merwade Lyles School of Civil Engineering, Purdue University vmerwade@purdue.edu January 2018 Objective The objective of
START>PROGRAMS>ARCGIS>
 Department of Urban Studies and Planning Spring 2006 Department of Architecture Site and Urban Systems Planning 11.304J / 4.255J GIS EXERCISE 2 Objectives: To generate the following maps using ArcGIS Software:
v SMS 12.3 Tutorial GIS P Prerequisites Time Requirements Objectives
 v. 12.3 SMS 12.3 Tutorial Objectives This tutorial demonstrates how to import data, visualize it, and convert it into SMS coverage data that could be used to build a numeric model. This tutorial will instruct
Map Preparation. Using QGIS
 Map Preparation Using QGIS Tutorial ID: IGET_GIS_006 This tutorial has been developed by BVIEER as part of the IGET web portal intended to provide easy access to geospatial education. This tutorial is
Geography 281 Map Making with GIS Project Three: Viewing Data Spatially
 Geography 281 Map Making with GIS Project Three: Viewing Data Spatially This activity introduces three of the most common thematic maps: Choropleth maps Dot density maps Graduated symbol maps You will
This document explains how to connect to a SQL Server database using ESRI ArcCatalog in order to extract data containing spatial coordinates.
 Arctic Network Arctic Network Data Management Standard Operating Procedure Inventory & Monitoring Program U.S. Department of the Interior Data Management Standard Operating Procedure NPS/ARCN/DMSOP-2009-07
ArcGIS Online (AGOL) Quick Start Guide Fall 2018
 Quick Start Guide Fall 2018") ArcGIS Online (AGOL) Quick Start Guide Fall 2018 ArcGIS Online (AGOL) is a web mapping tool available to UC Merced faculty, students and staff. The Spatial Analysis and Research Center (SpARC) provides
ArcGIS Online (AGOL) Quick Start Guide Fall 2018 ArcGIS Online (AGOL) is a web mapping tool available to UC Merced faculty, students and staff. The Spatial Analysis and Research Center (SpARC) provides
A Practical Guide to Using QGIS
 A Practical Guide to Using QGIS 1.1 INTRODUCTION Quantum GIS (QGIS) is a useful mapping software that enables the compilation and displaying of spatial data in the form of a map. Gaining experience in
The ArcMap Interface and Using Basic ArcMap Analysis Tools to Create a Map
 The ArcMap Interface and Using Basic ArcMap Analysis Tools to Create a Map *You will need a computer with ESRI ArcGIS Desktop version 9.3 or higher installed* Data Download 1. Save the zipped folder with
_Tutorials. Arcmap. Linking additional files outside from Geodata
 _Tutorials Arcmap Linking additional files outside from Geodata 2017 Sourcing the Data (Option 1): Extracting Data from Auckland Council GIS P1 First you want to get onto the Auckland Council GIS website
Downloading Census Data from American Factfinder2 for use in ArcGIS
 Downloading Census Data from American Factfinder2 for use in ArcGIS Written by Barbara Parmenter, revised November 18, 2011 OBTAINING DATA FROM AMERICAN FACTFINDER2... 1 PREPARING AMERICAN FACTFINDER DATA
v Google Earth Files SMS 13.0 Tutorial Prerequisites None Requirements Mesh Module Google Earth Time minutes
 v. 13.0 SMS 13.0 Tutorial Objectives Learn how to save SMS data to a KMZ file format. KMZ files are Google Earth files and will allow viewing SMS data in Google Earth. SMS can save any georeferenced data
Guide to using QGIS. QGIS is a free and open source Geographical Information System programme which can be downloaded at
 Guide to using QGIS QGIS is a free and open source Geographical Information System programme which can be downloaded at http://www.qgis.org/en/site/ It is a great programme for displaying data which can
ArcGIS Basics: Mapping the US
 ArcGIS Basics: Mapping the US Revised February 15, 2010 Tufts University Author: Barbara Parmenter Introduction...1 Part 1 - Opening ArcMap and adding data layers...1 Part 2 Moving around the Map...4 Part
Geographical Information Systems Institute. Center for Geographic Analysis, Harvard University. LAB EXERCISE 1: Basic Mapping in ArcMap
 Harvard University Introduction to ArcMap Geographical Information Systems Institute Center for Geographic Analysis, Harvard University LAB EXERCISE 1: Basic Mapping in ArcMap Individual files (lab instructions,
Geography 222 Quantitative Color for GIS Mike Pesses, Antelope Valley College
 Geography 222 Quantitative Color for GIS Mike Pesses, Antelope Valley College Introduction Building off of the previous color theory work, a cartographer must also understand how to tell a story with data
Chapter 7. A Quick Tour of ArcGIS Pro
 Chapter 7 A Quick Tour of ArcGIS Pro Skills you will learn: This tutorial is intended to get you going using ArcGIS Pro, a new desktop application that is part of ArcGIS Desktop. A separate tutorial gives
QGIS Workshop Su Zhang and Laura Gleasner 11/10/2016. QGIS Workshop
 1. Introduction to Quantum GIS (QGIS) QGIS Workshop QGIS is a free and open source Geographic Information System (GIS). QGIS can help you create, edit, visualize, and publish geospatial information on
New Media in Landscape Architecture: Advanced GIS
 New Media in Landscape Architecture: Advanced GIS - Projections and Transformations - Version 10.2, English ANHALT UNIVERSITY OF APPLIED SCIENCES Hochschule Anhalt Author: Dr. Matthias Pietsch Tutorial-Version:
Mapping Tabular Data Display XY points from csv
 Mapping Tabular Data Display XY points from csv Materials needed: AussiePublicToilets.csv. [1] Open and examine the data: Open ArcMap and use the Add Data button to add the table AussiePublicToilets.csv
Exercise 1: An Overview of ArcMap and ArcCatalog
 Exercise 1: An Overview of ArcMap and ArcCatalog Introduction: ArcGIS is an integrated collection of GIS software products for building a complete GIS. ArcGIS enables users to deploy GIS functionality
GIS LAB 1. Basic GIS Operations with ArcGIS. Calculating Stream Lengths and Watershed Areas.
 GIS LAB 1 Basic GIS Operations with ArcGIS. Calculating Stream Lengths and Watershed Areas. ArcGIS offers some advantages for novice users. The graphical user interface is similar to many Windows packages
Working with 2000 Census Data in ArcGIS: Using the US Census Bureau Web Site for SF1 and SF3 Data
 Tufts University GIS Tutorial Working with 2000 Census Data in ArcGIS: Using the US Census Bureau Web Site for SF1 and SF3 Data Revised October 14, 2010 Note: we highly recommend Mozilla Firefox for this
Select the Parks within Forest Acres
 Select the Parks within Forest Acres TASKS RESULT 1. Add the county boundary, municipalities and parks (pts.) layers to your map 2. Save your map (.mxd) to your desktop Your map should look something like
GPlates Tutorial. Preparing Data in ArcGIS for GPlates
 GPlates Tutorial Preparing Data in ArcGIS for GPlates Sabin Zahirovic 1 1 EarthByte Research Group, School of Geosciences, University of Sydney, Australia www.gplates.org The vast majority of users that
From Non-Spatial Data to Spatial Data. Geocoding & Georeferencing in ArcGIS
 03-Geocoding & Georeferencing In Arcgis.Doc Page 1 of 10 From Non-Spatial Data to Spatial Data. Geocoding & Georeferencing in ArcGIS Objectives Upon completion of this tutorial, you should be able to perform
Using GIS to Site Minimal Excavation Helicopter Landings
 Using GIS to Site Minimal Excavation Helicopter Landings The objective of this analysis is to develop a suitability map for aid in locating helicopter landings in mountainous terrain. The tutorial uses
Mapping Census data in QGIS
 Mapping Census data in QGIS Contents Contents 1. Introduction...3 1.1. Census data...3 1.2. Boundary data...3 1.3. Mapping software...3 2. Obtain your census data...4 Step 1: Geography...4 Step 2: Topics...5
1. Download Federal Electoral Districts and add to map document
 1. Download Federal Electoral Districts and add to map document Federal Electoral Districts (FEDs) are the geographic areas for which one Member of Parliament is elected. It is downloaded as a shapefile
Data Assembling Topics:
 Topics: 1. GPX to Shape file 2. Data conversion with FME 3. Create a polygon feature 4. Merging /Appending data into a new dataset 5. Reproject data from one coordinate system to another 6. Data clipping
Tutorial 1: Finding and Displaying Spatial Data Using ArcGIS
 Tutorial 1: Finding and Displaying Spatial Data Using ArcGIS This tutorial will introduce you to the following: Websites where you may browse to find geospatial information Identifying spatial data, usable
Tutorial 4: Query and Select Spatial Data
 Tutorial 4: Query and Select Spatial Data This tutorial will introduce you to the following: Identifying Attribute Data Sources (Review) Toxic Release Inventory (TRI) facilities and NJ County boundaries
Outline Vertices Editor for Polygonal Pours and Regions
 Outline Vertices Editor for Polygonal Pours and Regions Old Content - visit altium.com/documentation Modified by on 13-Sep-2017 Related Videos Outline Vertices Editor for Polygon Pours and Regions Offering
button in the lower-left corner of the panel if you have further questions throughout this tutorial.
 Mosaic Tutorial: Simple Workflow This tutorial demonstrates how to use the Seamless Mosaic tool to mosaic six overlapping digital aerial scenes. You will learn about displaying footprints and image data
Geocoding vs. Add XY Data using Reference USA data in ArcMap
 Geocoding vs. Add XY Data using Reference USA data in ArcMap 10.4.1 Written by Barbara Parmenter. Revised by Carolyn Talmadge 2/27/2017 GETTING BUSINESS DATA FROM REFERENCE USA BY NAICS AND CITY... 2 MODIFY
Geographical Information Systems Institute. Center for Geographic Analysis, Harvard University
 Geographical Information Systems Institute Center for Geographic Analysis, Harvard University LAB EXERCISE 5: Queries, Joins: Spatial and Non-spatial 1.0 Getting Census data 1. Go to the American Factfinder
USING 2001 CENSUS DATA IN ArcMap 8.2
 USING 2001 CENSUS DATA IN ArcMap 8.2 This is a guide to mapping 2001 Census data in ArcMap using age and sex profile data for Toronto at the census tract level. Importing boundary files, importing census
Geocoding Reference USA data in ArcMap 9.3
 Tufts GIS Tip Sheet Geocoding Reference USA data in ArcMap 9.3 Written by Barbara Parmenter Revised 3/1/2011 In this exercise, you will map businesses or services for a town in the Boston metropolitan
GIS LAB 8. Raster Data Applications Watershed Delineation
 GIS LAB 8 Raster Data Applications Watershed Delineation This lab will require you to further your familiarity with raster data structures and the Spatial Analyst. The data for this lab are drawn from
QGIS Tutorials Documentation
 QGIS Tutorials Documentation Release 0.1 Nathaniel Roth November 30, 2016 Contents 1 Installation 3 1.1 Basic Installation............................................. 3 1.2 Advanced Installation..........................................
Appendix 2: Random Plots Workbook: Unstratified Sample
 Appendix 2: Random Plots Workbook: Unstratified Sample These instructions will help users of all skill levels create a random sample of i-tree Eco plot centers, plot areas, and the associated i-tree Eco-required