Description/History Objects/Language Description Commonly Used Basic Functions. More Specific Functionality Further Resources
|
|
|
- Randolph Wilkinson
- 6 years ago
- Views:
Transcription
1 R
2 Outline Description/History Objects/Language Description Commonly Used Basic Functions Basic Stats and distributions I/O Plotting Programming More Specific Functionality Further Resources
3
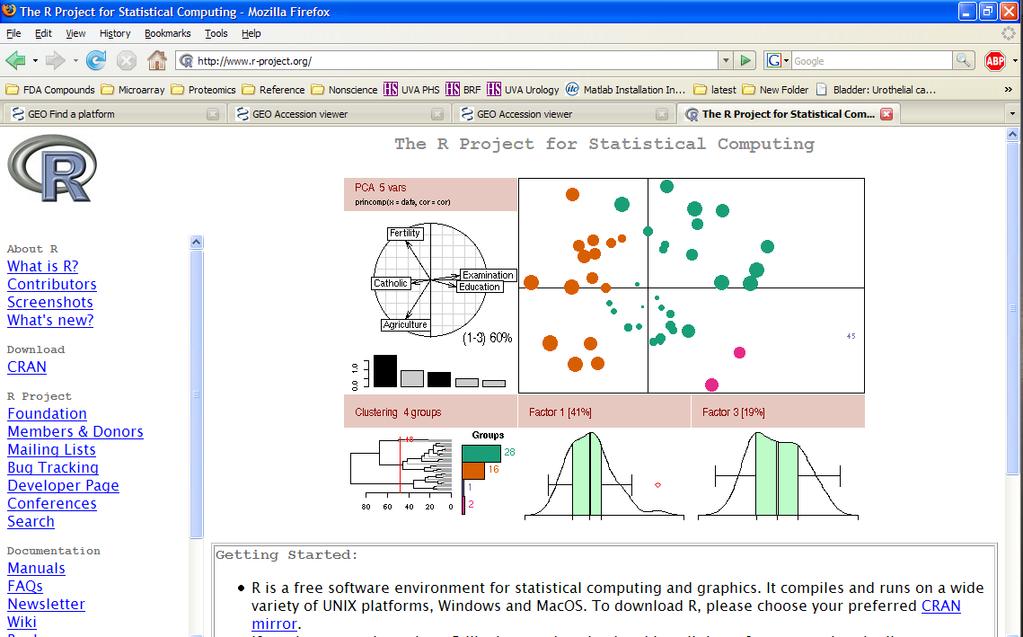
4 What is R? Free (speech/beer), open source implementation of S S is a statistical programming language developed by Bell Labs in the late 70s Cross-platform: can run anywhere Extensible: lots of libraries CRAN & Bioconductor
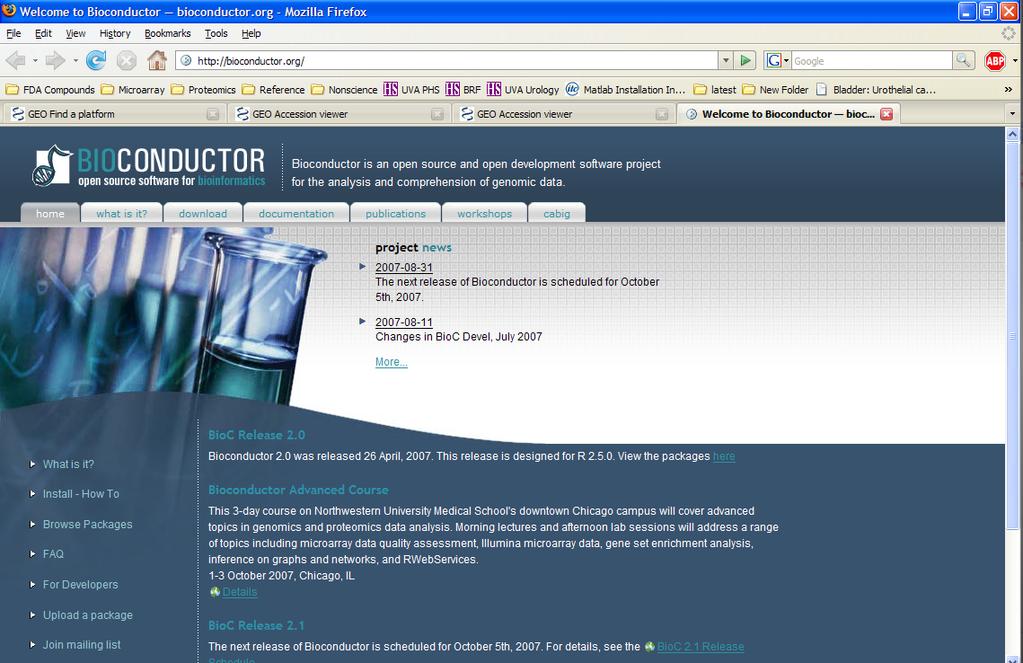
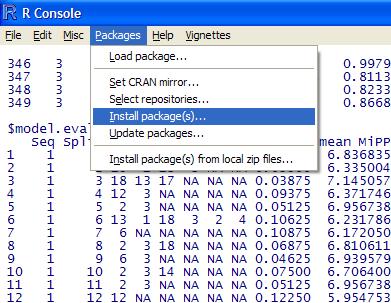
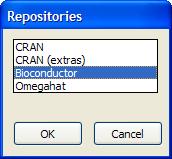
5 Bioconductor.org
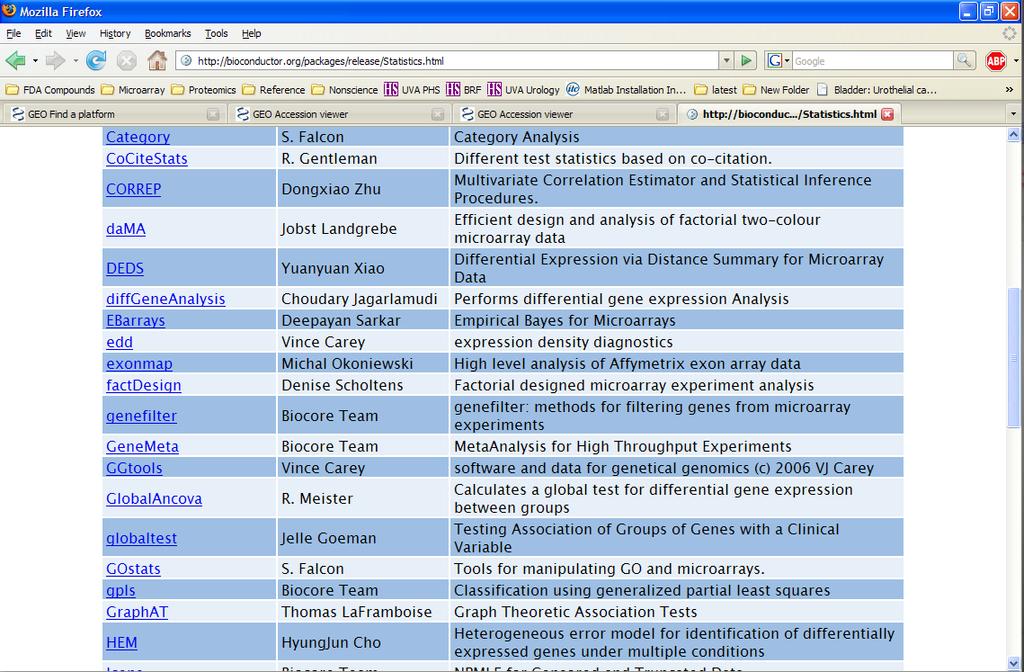
6 Packages
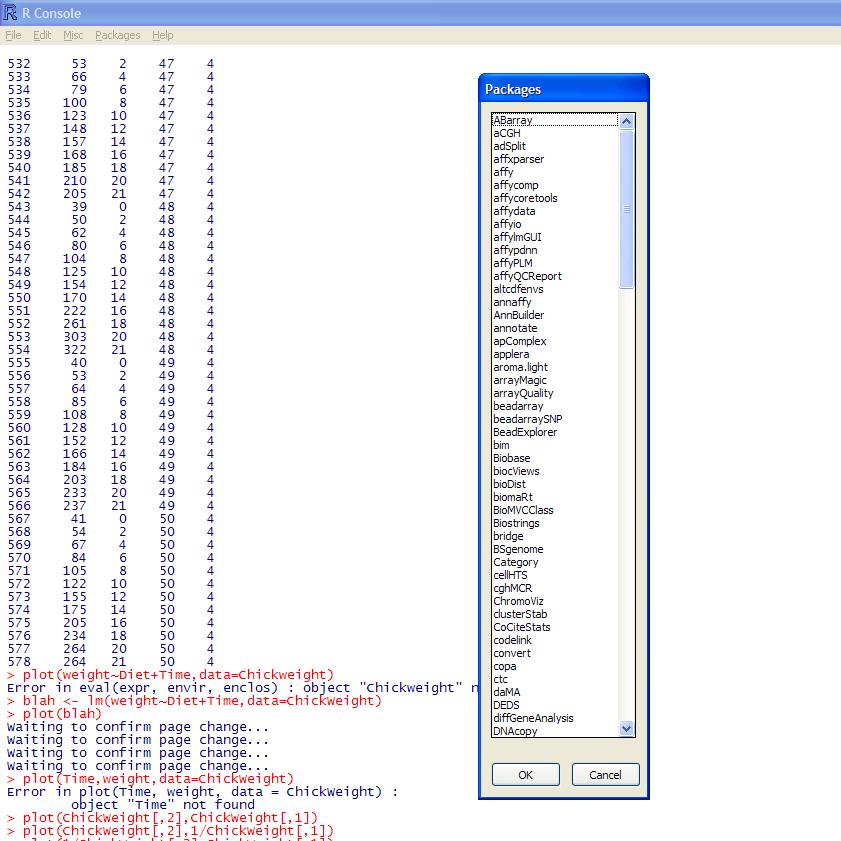
7
8 Everything in R is an Object All objects have a mode and a length Modes: null NULL logical TRUE, FALSE numeric 37.22, -1.5, 6.022e23 complex i character 'stage',"grade","can't", 'She said, "What?".' list list(3,false,c(2,5,6),'hi there') function c, ls, mean, q Length is fairly straightforward length(null)=0
9 Data classes Atomic vector 1-dimensional matrix 2-dimensional array multiple dimensions time-series vector w/associated time data factor categorical data Non-atomic / Recursive list 1-dimensional data.frame
10 Generating lists c() function : operator : has precedence over other operators seq() function seq(1,10,by=0.1) rep() function Using random number generators E.g., rnorm()
11 vectors Generate by using c() test <- c(30,15,22) Generate empty vector using vector(mode,length) temp <- vector( logical,30) Vector elements can have names mydata <- c(2,1,6,6,0) names(mydata) <-c("a","b","c","d","e") > mydata a b c d e > names(mydata) [1] "a" "b" "c" "d" "e"
12 Vectors (continued) Access vectors Numerically (start counting from 1) > mydata[1] a 2 > mydata[1:3] a b c Negative indices invert selection > mydata[-c(1,5,3)] b d 1 6 By Name (if available) > mydata['b'] b 1 Logically > mydata[mydata<6] a b e > mydata a b c d e > mydata[c(1,5,3,1)] a e c a > mydata[6] <NA> NA > mydata[0] named numeric(0) > mydata[] a b c d e > mydata['f'] <NA> NA
13 Adding new element to an array arr[length(arr)+1] <- newelement
14 Matrices and Arrays Like vectors, but more dimensions > a <- matrix(1:6,nrow=2,ncol=3) [,1] [,2] [,3] [1,] [2,] Similar accession, just more commas > a[1,2] [1] 3 Functions > a[1,] [1] > a[,2] [1] 3 4 > a[,2:3] [,1] [,2] [1,] 3 5 [2,] 4 6 Dimensions dim(), nrow(), ncol() Names colnames(), rownames() Matrix algebra t(), diag()
15 Lists Like vectors, but can have many data types Recursive: lists can contain lists can contain lists etc. a <- list(3,false,c(2,5,6),greeting='hi there',list(3,4,5)) Accession is different: Numerically Single brackets give a sublist Double-brackets give the actual contents of list > a[1] [[1]] [1] 3 > a[[1]] [1] 3 > a[1:3] [[1]] [1] 3 [[2]] [1] FALSE [[3]] [1] > a[[1:3]] Error
16 Lists (continued) a <- list(3,false,c(2,5,6),greeting='hi there',list(3,4,5)) Accession is different: By name, if available Again, distinction between single and double brackets Object$subname construct > a['greeting'] $greeting [1] "hi there" > a[['greeting']] [1] "hi there" > a$greeting [1] "hi there" unlist() converts to regular vectors > unlist(a) greeting "3" "FALSE" "2" "5" "6" "hi there" "3" "4" "5" > unlist(list(3,4,5)) [1] 3 4 5
17 Lists Adding new elements lista <- c(lista, newelement)
18 data.frames Look like a matrix, act like a list Each row represents a particular item Columns represent different characteristics Different columns can have different modes Columns are treated as elements in a list Tabular data implicitly loaded as data.frame matrix and data.frame differences > a <- matrix(1:12,nrow=3) [,1] [,2] [,3] [,4] [1,] [2,] [3,] > mean(a) [1] 6.5 > b <- data.frame(1:3,4:6,7:9,10:12) X1.3 X4.6 X7.9 X > mean(b) X1.3 X4.6 X7.9 X Must use apply() or unlist()
19 Categorical Data Factors: distinct character string values representing a particular category e.g. species name or treatment type > iris[1,5] [1] setosa Levels: setosa versicolor virginica Can be ordered Small, medium, large > drink.size[1] [1] medium Levels: small < medium < large For more help:?factor
20 Naming Your Objects Allowed characters: A-Z, a-z, 0-9,., _ Names cannot begin with number,., or _ Valid names include: test36, tumor.stage, TEMP Invalid names:.temp, 2z R is case-sensitive Num.samples num.samples Reserved names FALSE, Inf, NA, NaN, NULL, TRUE break, else, for, function, if, in, next, repeat, return, while
21 Type casting as.character() as.integer() etc.
22 Basic Functions Information ls(), ls.str(), dir(), getwd(), setwd(), args(),? or help(), apropos() Arithmetic + - / ^ %/% (integer divide) %% (modulo) % % (matrix multiply) Logical! & && < > <= >= ==!= Use & and for logical vector comparison is.na(), is.nan(), is.null()
23 Vector arithmetic Different then real vector arithmetic You can add vectors of different sizes The smaller vector is recycled, i.e., repeated For example, you can add a scalar to a vector The scalar will be added to all the elements of the vector one by one.
24 Basic Functions, continued Sums and products sum(), prod() Use na.rm=true if data contain NAs Trig, logarithms, and other math functions abs(), sign(), sqrt() sin(), cos(), tan(), asin(), acos(), atan(), sinh(), cosh(), tanh() exp(), log() (base e), log10(), log2(), logb(x,base=b) Rounding round(), signif(), ceiling(), floor(), trunc()
25 Still more basic functions Sorting and ordering sort(), rank(), order(); rev() Sequence generation seq(), rep() Location which(), match(), unique(), duplicated()
26 Stats Descriptive statistics (na.rm = TRUE) mean(), median(), var(), sd(), cor(), cov(), quantile(), summary() Extrema (na.rm = TRUE) min(), max(), range(), cummin(), cummax() Generating distributions Functions are of type xnorm() If x is r, generates random numbers If x is p, gives cumulative probability If x is d, gives probability If x is q, translates quantiles to numbers
27
28 Distributions, Continued Discrete Continuous Poisson Binomial Negative binomial rpois() rbinom() rnbinom() Uniform runif() Normal rnorm() Log-Normal rlnorm() Beta rbeta() Gamma rgamma() Weibull rweibull() Cauchy rcauchy() Student's t rt() (not rstudent()) F rf() 2 rchisq() Exponential rexp()
29 I/O read.table() readlines() save() load() source() sink()
30 LOGICAL if(condition) expression Control Flow if(condition) expression else alternate expression switch(expr, alt1=result1, alt2=result2,, default) LOOPING for( x in sequence ) expression while( condition ) expression repeat expression break next exits from loop skips rest of code for current iteration moves on to next iteration
31 Grouping expressions Expressions are grouped using { }
32 Plotting plot boxplot stripchart pairs hist image contour 2-d plotting Graphical Summarization More detailed Correlation analysis Histogram 2-d rep. of 3-d data. Contour plot
33 Plot
34 boxplot(count~spray,data=insectsprays)
35 Stripchart
36 Pairs
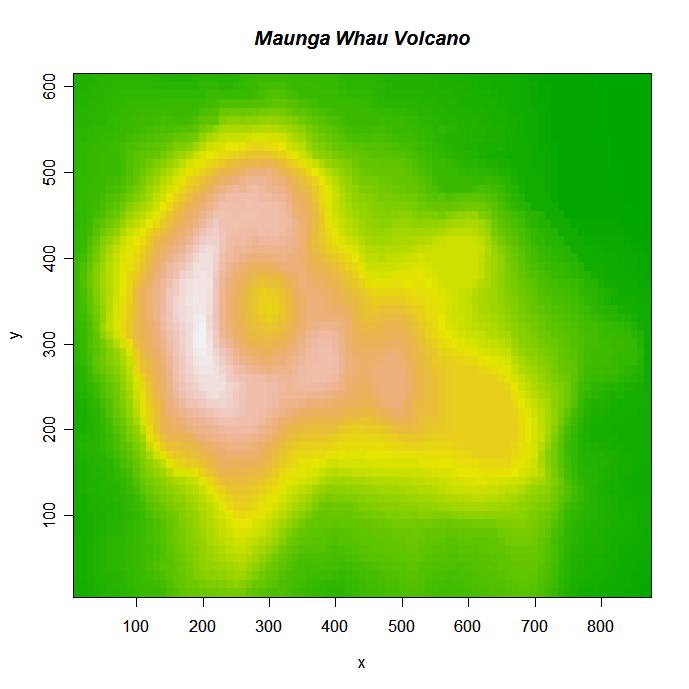
37 Image
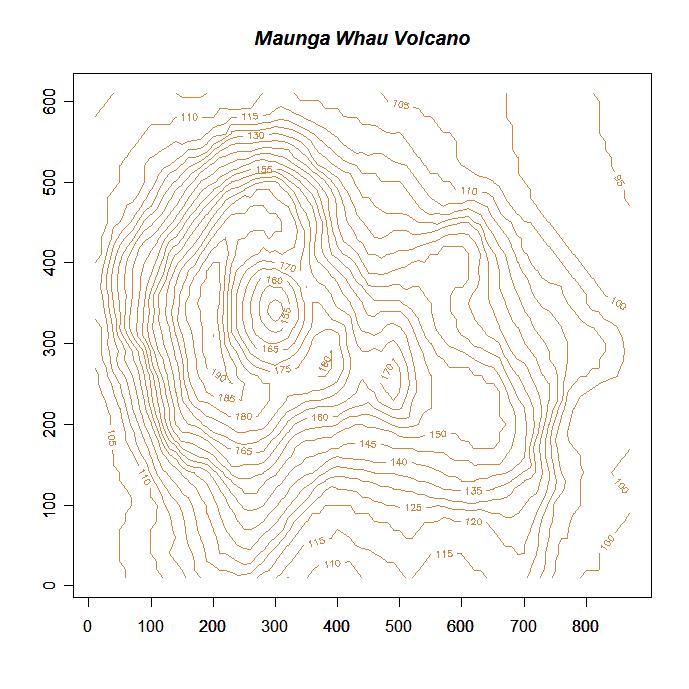
38 Contour
39 Further Resources help.start(), help menu r-project.org documentation section Lists useful books
Numeric Vectors STAT 133. Gaston Sanchez. Department of Statistics, UC Berkeley
 Numeric Vectors STAT 133 Gaston Sanchez Department of Statistics, UC Berkeley gastonsanchez.com github.com/gastonstat/stat133 Course web: gastonsanchez.com/stat133 Data Types and Structures To make the
Introduction to R Benedikt Brors Dept. Intelligent Bioinformatics Systems German Cancer Research Center
 Introduction to R Benedikt Brors Dept. Intelligent Bioinformatics Systems German Cancer Research Center What is R? R is a statistical computing environment with graphics capabilites It is fully scriptable
Mails : ; Document version: 14/09/12
 Mails : leslie.regad@univ-paris-diderot.fr ; gaelle.lelandais@univ-paris-diderot.fr Document version: 14/09/12 A freely available language and environment Statistical computing Graphics Supplementary
STAT 540 Computing in Statistics
 STAT 540 Computing in Statistics Introduces programming skills in two important statistical computer languages/packages. 30-40% R and 60-70% SAS Examples of Programming Skills: 1. Importing Data from External
An introduction to R WS 2013/2014
 An introduction to R WS 2013/2014 Dr. Noémie Becker (AG Metzler) Dr. Sonja Grath (AG Parsch) Special thanks to: Dr. Martin Hutzenthaler (previously AG Metzler, now University of Frankfurt) course development,
Computational statistics Jamie Griffin. Semester B 2018 Lecture 1
 Computational statistics Jamie Griffin Semester B 2018 Lecture 1 Course overview This course is not: Statistical computing Programming This course is: Computational statistics Statistical methods that
An introduction to R 1 / 29
 An introduction to R 1 / 29 What is R? R is an integrated suite of software facilities for data manipulation, calculation and graphical display. Among other things it has: an effective data handling and
Package Brobdingnag. R topics documented: March 19, 2018
 Type Package Title Very Large Numbers in R Version 1.2-5 Date 2018-03-19 Author Depends R (>= 2.13.0), methods Package Brobdingnag March 19, 2018 Maintainer Handles very large
Built-in Types of Data
 Built-in Types of Data Types A data type is set of values and a set of operations defined on those values Python supports several built-in data types: int (for integers), float (for floating-point numbers),
Getting started with simulating data in R: some helpful functions and how to use them Ariel Muldoon August 28, 2018
 Getting started with simulating data in R: some helpful functions and how to use them Ariel Muldoon August 28, 2018 Contents Overview 2 Generating random numbers 2 rnorm() to generate random numbers from
Introduction to MATLAB. Arturo Donate
 Introduction to MATLAB Arturo Donate Introduction What is MATLAB? Environment MATLAB Basics Toolboxes Comparison Conclusion Programming What is MATLAB? Matrix laboratory programming environment high-performance
Introduction to R. Nishant Gopalakrishnan, Martin Morgan January, Fred Hutchinson Cancer Research Center
 Introduction to R Nishant Gopalakrishnan, Martin Morgan Fred Hutchinson Cancer Research Center 19-21 January, 2011 Getting Started Atomic Data structures Creating vectors Subsetting vectors Factors Matrices
R package
 R package www.r-project.org Download choose the R version for your OS install R for the first time Download R 3 run R MAGDA MIELCZAREK 2 help help( nameofthefunction )? nameofthefunction args(nameofthefunction)
Advanced Econometric Methods EMET3011/8014
 Advanced Econometric Methods EMET3011/8014 Lecture 2 John Stachurski Semester 1, 2011 Announcements Missed first lecture? See www.johnstachurski.net/emet Weekly download of course notes First computer
Arithmetic and Logic Blocks
 Arithmetic and Logic Blocks The Addition Block The block performs addition and subtractions on its inputs. This block can add or subtract scalar, vector, or matrix inputs. We can specify the operation
Fathom Dynamic Data TM Version 2 Specifications
 Data Sources Fathom Dynamic Data TM Version 2 Specifications Use data from one of the many sample documents that come with Fathom. Enter your own data by typing into a case table. Paste data from other
Computer Science 121. Scientific Computing Winter 2016 Chapter 3 Simple Types: Numbers, Text, Booleans
 Computer Science 121 Scientific Computing Winter 2016 Chapter 3 Simple Types: Numbers, Text, Booleans 3.1 The Organization of Computer Memory Computers store information as bits : sequences of zeros and
A Brief Introduction to R
 A Brief Introduction to R Babak Shahbaba Department of Statistics, University of California, Irvine, USA Chapter 1 Introduction to R 1.1 Installing R To install R, follow these steps: 1. Go to http://www.r-project.org/.
Matlab and Psychophysics Toolbox Seminar Part 1. Introduction to Matlab
 Keith Schneider, 20 July 2006 Matlab and Psychophysics Toolbox Seminar Part 1. Introduction to Matlab Variables Scalars >> 1 1 Row vector >> [1 2 3 4 5 6] 1 2 3 4 5 6 >> [1,2,3,4,5,6] Column vector 1 2
Some elements for Matlab programming
 Some elements for Matlab programming Nathalie Thomas 2018 2019 Matlab, which stands for the abbreviation of MATrix LABoratory, is one of the most popular language for scientic computation. The classical
SF1901 Probability Theory and Statistics: Autumn 2016 Lab 0 for TCOMK
 Mathematical Statistics SF1901 Probability Theory and Statistics: Autumn 2016 Lab 0 for TCOMK 1 Preparation This computer exercise is a bit different from the other two, and has some overlap with computer
R Short Course Session 1
 R Short Course Session 1 Daniel Zhao, PhD Sixia Chen, PhD Department of Biostatistics and Epidemiology College of Public Health, OUHSC 10/23/2015 Outline Overview of the 5 sessions Pre-requisite requirements
R Introduction 1. J.M. Ponciano. August 17, Objects in Splus language include, and. x<-list(ncolors=2,colors=c("red","blue"))
)") R Introduction 1 J.M. Ponciano August 17, 2007 1 Objects and types Location, definition of, and permanence of data Objects in Splus language include, and. Objects are created by assignment statements:
R Introduction 1 J.M. Ponciano August 17, 2007 1 Objects and types Location, definition of, and permanence of data Objects in Splus language include, and. Objects are created by assignment statements:
R basics workshop Sohee Kang
 R basics workshop Sohee Kang Math and Stats Learning Centre Department of Computer and Mathematical Sciences Objective To teach the basic knowledge necessary to use R independently, thus helping participants
The Very Basics of the R Interpreter
 Chapter 2 The Very Basics of the R Interpreter OK, the computer is fired up. We have R installed. It is time to get started. 1. Start R by double-clicking on the R desktop icon. 2. Alternatively, open
Reading and wri+ng data
 An introduc+on to Reading and wri+ng data Noémie Becker & Benedikt Holtmann Winter Semester 16/17 Course outline Day 4 Course outline Review Data types and structures Reading data How should data look
An introduction to R WS 2013/2014
 An introduction to R WS 2013/2014 Dr. Noémie Becker (AG Metzler) Dr. Sonja Grath (AG Parsch) Special thanks to: Dr. Martin Hutzenthaler (previously AG Metzler, now University of Frankfurt) course development,
MBV4410/9410 Fall Bioinformatics for Molecular Biology. Introduction to R
 MBV4410/9410 Fall 2018 Bioinformatics for Molecular Biology Introduction to R Outline Introduce R Basic operations RStudio Bioconductor? Goal of the lecture Introduce you to R Show how to run R, basic
LAB #2: SAMPLING, SAMPLING DISTRIBUTIONS, AND THE CLT
 NAVAL POSTGRADUATE SCHOOL LAB #2: SAMPLING, SAMPLING DISTRIBUTIONS, AND THE CLT Statistics (OA3102) Lab #2: Sampling, Sampling Distributions, and the Central Limit Theorem Goal: Use R to demonstrate sampling
Introduction to R. Course in Practical Analysis of Microarray Data Computational Exercises
 Introduction to R Course in Practical Analysis of Microarray Data Computational Exercises 2010 March 22-26, Technischen Universität München Amin Moghaddasi, Kurt Fellenberg 1. Installing R. Check whether
Computing Fundamentals
 Computing Fundamentals Salvatore Filippone salvatore.filippone@uniroma2.it 2012 2013 (salvatore.filippone@uniroma2.it) Computing Fundamentals 2012 2013 1 / 18 Octave basics Octave/Matlab: f p r i n t f
1 Matrices and Vectors and Lists
 University of Wollongong School of Mathematics and Applied Statistics STAT231 Probability and Random Variables 2014 Second Lab - Week 4 If you can t finish the log-book questions in lab, proceed at home.
Data types and structures
 An introduc+on to Data types and structures Noémie Becker & Benedikt Holtmann Winter Semester 16/17 Course outline Day 3 Review GeFng started with R Crea+ng Objects Data types in R Data structures in R
Statistical Computing (36-350)
") Statistical Computing (36-350) Lecture 1: Introduction to the course; Data Cosma Shalizi and Vincent Vu 29 August 2011 Why good statisticians learn how to program Independence: otherwise, you rely on someone
Statistical Computing (36-350) Lecture 1: Introduction to the course; Data Cosma Shalizi and Vincent Vu 29 August 2011 Why good statisticians learn how to program Independence: otherwise, you rely on someone
MATH 5520 Basics of MATLAB
 MATH 5520 Basics of MATLAB Dmitriy Leykekhman Spring 2011 Topics Sources. Entering Matrices. Basic Operations with Matrices. Build in Matrices. Build in Scalar and Matrix Functions. if, while, for m-files
MATH 3511 Basics of MATLAB
 MATH 3511 Basics of MATLAB Dmitriy Leykekhman Spring 2012 Topics Sources. Entering Matrices. Basic Operations with Matrices. Build in Matrices. Build in Scalar and Matrix Functions. if, while, for m-files
1 Pencil and Paper stuff
 Spring 2008 - Stat C141/ Bioeng C141 - Statistics for Bioinformatics Course Website: http://www.stat.berkeley.edu/users/hhuang/141c-2008.html Section Website: http://www.stat.berkeley.edu/users/mgoldman
Constraint-based Metabolic Reconstructions & Analysis H. Scott Hinton. Matlab Tutorial. Lesson: Matlab Tutorial
 1 Matlab Tutorial 2 Lecture Learning Objectives Each student should be able to: Describe the Matlab desktop Explain the basic use of Matlab variables Explain the basic use of Matlab scripts Explain the
Single row numeric functions
 Single row numeric functions Oracle provides a lot of standard numeric functions for single rows. Here is a list of all the single row numeric functions (in version 10.2). Function Description ABS(n) ABS
A Guide to Using Some Basic MATLAB Functions
 A Guide to Using Some Basic MATLAB Functions UNC Charlotte Robert W. Cox This document provides a brief overview of some of the essential MATLAB functionality. More thorough descriptions are available
A brief introduction to R
 A brief introduction to R Cavan Reilly September 29, 2017 Table of contents Background R objects Operations on objects Factors Input and Output Figures Missing Data Random Numbers Control structures Background
Introduction to R. UCLA Statistical Consulting Center R Bootcamp. Irina Kukuyeva September 20, 2010
 UCLA Statistical Consulting Center R Bootcamp Irina Kukuyeva ikukuyeva@stat.ucla.edu September 20, 2010 Outline 1 Introduction 2 Preliminaries 3 Working with Vectors and Matrices 4 Data Sets in R 5 Overview
R (and S, and S-Plus, another program based on S) is an interactive, interpretive, function language.
 is an interactive, interpretive, function language.") R R (and S, and S-Plus, another program based on S) is an interactive, interpretive, function language. Available on Linux, Unix, Mac, and MS Windows systems. Documentation exists in several volumes, and
R R (and S, and S-Plus, another program based on S) is an interactive, interpretive, function language. Available on Linux, Unix, Mac, and MS Windows systems. Documentation exists in several volumes, and
Introduction to scientific programming in R
 Introduction to scientific programming in R John M. Drake & Pejman Rohani 1 Introduction This course will use the R language programming environment for computer modeling. The purpose of this exercise
the R environment The R language is an integrated suite of software facilities for:
 the R environment The R language is an integrated suite of software facilities for: Data Handling and storage Matrix Math: Manipulating matrices, vectors, and arrays Statistics: A large, integrated set
Matlab Tutorial, CDS
 29 September 2006 Arrays Built-in variables Outline Operations Linear algebra Polynomials Scripts and data management Help: command window Elisa (see Franco next slide), Matlab Tutorial, i.e. >> CDS110-101
MATLAB Programming for Numerical Computation Dr. Niket Kaisare Department Of Chemical Engineering Indian Institute of Technology, Madras
 MATLAB Programming for Numerical Computation Dr. Niket Kaisare Department Of Chemical Engineering Indian Institute of Technology, Madras Module No. #01 Lecture No. #1.1 Introduction to MATLAB programming
Data Structures STAT 133. Gaston Sanchez. Department of Statistics, UC Berkeley
 Data Structures STAT 133 Gaston Sanchez Department of Statistics, UC Berkeley gastonsanchez.com github.com/gastonstat/stat133 Course web: gastonsanchez.com/stat133 Data Types and Structures To make the
R is a programming language of a higher-level Constantly increasing amount of packages (new research) Free of charge Website:
 Free of charge Website:") Introduction to R R R is a programming language of a higher-level Constantly increasing amount of packages (new research) Free of charge Website: http://www.r-project.org/ Code Editor: http://rstudio.org/
Introduction to R R R is a programming language of a higher-level Constantly increasing amount of packages (new research) Free of charge Website: http://www.r-project.org/ Code Editor: http://rstudio.org/
Business Statistics: R tutorials
 Business Statistics: R tutorials Jingyu He September 29, 2017 Install R and RStudio R is a free software environment for statistical computing and graphics. Download free R and RStudio for Windows/Mac:
IST 3108 Data Analysis and Graphics Using R. Summarizing Data Data Import-Export
 IST 3108 Data Analysis and Graphics Using R Summarizing Data Data Import-Export Engin YILDIZTEPE, PhD Working with Vectors and Logical Subscripts >xsum(x) how many of the values were less than
Programming with R. Bjørn-Helge Mevik. RIS Course Week spring Research Infrastructure Services Group, USIT, UiO
 Programming with R Bjørn-Helge Mevik Research Infrastructure Services Group, USIT, UiO RIS Course Week spring 2014 Bjørn-Helge Mevik (RIS) Programming with R Course Week spring 2014 1 / 27 Introduction
Session 26 TS, Predictive Analytics: Moving Out of Square One. Moderator: Jean-Marc Fix, FSA, MAAA
 Session 26 TS, Predictive Analytics: Moving Out of Square One Moderator: Jean-Marc Fix, FSA, MAAA Presenters: Jean-Marc Fix, FSA, MAAA Jeffery Robert Huddleston, ASA, CERA, MAAA Predictive Modeling: Getting
Introduction to R: Using R for statistics and data analysis
 Why use R? Introduction to R: Using R for statistics and data analysis George W Bell, Ph.D. BaRC Hot Topics November 2014 Bioinformatics and Research Computing Whitehead Institute http://barc.wi.mit.edu/hot_topics/
Stat 290: Lab 2. Introduction to R/S-Plus
 Stat 290: Lab 2 Introduction to R/S-Plus Lab Objectives 1. To introduce basic R/S commands 2. Exploratory Data Tools Assignment Work through the example on your own and fill in numerical answers and graphs.
Statistical Data Analysis: Python Tutorial
 1 October 4, 2017 Statistical Data Analysis: Python Tutorial Dr A. J. Bevan, Contents 1 Getting started 1 2 Basic calculations 2 3 More advanced calculations 4 4 Data sets 5 4.1 CSV file input.............................................
ENGR Fall Exam 1
 ENGR 13100 Fall 2012 Exam 1 INSTRUCTIONS: Duration: 60 minutes Keep your eyes on your own work! Keep your work covered at all times! 1. Each student is responsible for following directions. Read carefully.
Package slam. February 15, 2013
 Package slam February 15, 2013 Version 0.1-28 Title Sparse Lightweight Arrays and Matrices Data structures and algorithms for sparse arrays and matrices, based on inde arrays and simple triplet representations,
No Name What it does? 1 attach Attach your data frame to your working environment. 2 boxplot Creates a boxplot.
 No Name What it does? 1 attach Attach your data frame to your working environment. 2 boxplot Creates a boxplot. 3 confint A metafor package function that gives you the confidence intervals of effect sizes.
EPIB Four Lecture Overview of R
 EPIB-613 - Four Lecture Overview of R R is a package with enormous capacity for complex statistical analysis. We will see only a small proportion of what it can do. The R component of EPIB-613 is divided
Dr Richard Greenaway
 SCHOOL OF PHYSICS, ASTRONOMY & MATHEMATICS 4PAM1008 MATLAB 2 Basic MATLAB Operation Dr Richard Greenaway 2 Basic MATLAB Operation 2.1 Overview 2.1.1 The Command Line In this Workshop you will learn how
Introduction to Matlab. High-Level Computer Vision Summer Semester 2015
 Introduction to Matlab High-Level Computer Vision Summer Semester 2015 Informations TAs: Siyu Tang, email: tang@mpi-inf.mpg.de Wei-Chen Chiu, email: walon@mpi-inf.mpg.de Subscribe to the mailing list:
Why use R? Getting started. Why not use R? Introduction to R: It s hard to use at first. To perform inferential statistics (e.g., use a statistical
 Why use R? Introduction to R: Using R for statistics ti ti and data analysis BaRC Hot Topics November 2013 George W. Bell, Ph.D. http://jura.wi.mit.edu/bio/education/hot_topics/ To perform inferential
ACHIEVEMENTS FROM TRAINING
 LEARN WELL TECHNOCRAFT DATA SCIENCE/ MACHINE LEARNING SYLLABUS 8TH YEAR OF ACCOMPLISHMENTS AUTHORIZED GLOBAL CERTIFICATION CENTER FOR MICROSOFT, ORACLE, IBM, AWS AND MANY MORE. 8411002339/7709292162 WWW.DW-LEARNWELL.COM
Introduction to Statistics using R/Rstudio
 Introduction to Statistics using R/Rstudio R and Rstudio Getting Started Assume that R for Windows and Macs already installed on your laptop. (Instructions for installations sent) R on Windows R on MACs
Introduction to R: Using R for statistics and data analysis
 Why use R? Introduction to R: Using R for statistics and data analysis George W Bell, Ph.D. BaRC Hot Topics November 2015 Bioinformatics and Research Computing Whitehead Institute http://barc.wi.mit.edu/hot_topics/
Extremely short introduction to R Jean-Yves Sgro Feb 20, 2018
 Extremely short introduction to R Jean-Yves Sgro Feb 20, 2018 Contents 1 Suggested ahead activities 1 2 Introduction to R 2 2.1 Learning Objectives......................................... 2 3 Starting
Stat 579: Objects in R Vectors
 Stat 579: Objects in R Vectors Ranjan Maitra 2220 Snedecor Hall Department of Statistics Iowa State University. Phone: 515-294-7757 maitra@iastate.edu, 1/23 Logical Vectors I R allows manipulation of logical
An Introduction to R- Programming
 An Introduction to R- Programming Hadeel Alkofide, Msc, PhD NOT a biostatistician or R expert just simply an R user Some slides were adapted from lectures by Angie Mae Rodday MSc, PhD at Tufts University
Why use R? Getting started. Why not use R? Introduction to R: Log into tak. Start R R or. It s hard to use at first
 Why use R? Introduction to R: Using R for statistics ti ti and data analysis BaRC Hot Topics October 2011 George Bell, Ph.D. http://iona.wi.mit.edu/bio/education/r2011/ To perform inferential statistics
Introduction to R. Stat Statistical Computing - Summer Dr. Junvie Pailden. July 5, Southern Illinois University Edwardsville
 Introduction to R Stat 575 - Statistical Computing - Summer 2016 Dr. Junvie Pailden Southern Illinois University Edwardsville July 5, 2016 Why R R offers a powerful and appealing interactive environment
Introduction to the R Language
 Introduction to the R Language Data Types and Basic Operations Starting Up Windows: Double-click on R Mac OS X: Click on R Unix: Type R Objects R has five basic or atomic classes of objects: character
Package slam. December 1, 2016
 Version 0.1-40 Title Sparse Lightweight Arrays and Matrices Package slam December 1, 2016 Data structures and algorithms for sparse arrays and matrices, based on inde arrays and simple triplet representations,
PIV Programming. Today s Contents: 1. Matlab Programming 2. An example of PIV in Matlab code 3. EDPIV 4. PIV plugin for ImageJ 5.
 PIV Programming Last Class: 1. Introduction of μpiv 2. Considerations of Microscopy in μpiv 3. Depth of Correlation 4. Physics of Particles in Micro PIV 5. Measurement Errors 6. Special Processing Methods
Assignments. Math 338 Lab 1: Introduction to R. Atoms, Vectors and Matrices
 Assignments Math 338 Lab 1: Introduction to R. Generally speaking, there are three basic forms of assigning data. Case one is the single atom or a single number. Assigning a number to an object in this
Using R for statistics and data analysis
 Introduction ti to R: Using R for statistics and data analysis BaRC Hot Topics October 2011 George Bell, Ph.D. http://iona.wi.mit.edu/bio/education/r2011/ Why use R? To perform inferential statistics (e.g.,
(5) ifit/math: «One Class to do some Math» God damn it! Just compute it! ifit workshop NBI Jan 2012 Math - 1
 ifit/math: «One Class to do some Math» God damn it! Just compute it! ifit workshop NBI Jan 2012 Math - 1") (5) ifit/math: «One Class to do some Math» God damn it! Just compute it! ifit workshop NBI Jan 2012 Math - 1 Math: perform mathematical operations seamlessly As we have seen there is a unique,
(5) ifit/math: «One Class to do some Math» God damn it! Just compute it! ifit workshop NBI Jan 2012 Math - 1 Math: perform mathematical operations seamlessly As we have seen there is a unique,
This document is designed to get you started with using R
 An Introduction to R This document is designed to get you started with using R We will learn about what R is and its advantages over other statistics packages the basics of R plotting data and graphs What
Introduction to MATLAB Programming
 Introduction to MATLAB Programming Arun A. Balakrishnan Asst. Professor Dept. of AE&I, RSET Overview 1 Overview 2 Introduction 3 Getting Started 4 Basics of Programming Overview 1 Overview 2 Introduction
Introduction to R statistical environment
 Introduction to R statistical environment R Nano Course Series Aishwarya Gogate Computational Biologist I Green Center for Reproductive Biology Sciences History of R R is a free software environment for
Programming with R. Educational Materials 2006 S. Falcon, R. Ihaka, and R. Gentleman
 Programming with R Educational Materials 2006 S. Falcon, R. Ihaka, and R. Gentleman 1 Data Structures ˆ R has a rich set of self-describing data structures. > class(z) [1] "character" > class(x) [1] "data.frame"
MATLAB Tutorial. Digital Signal Processing. Course Details. Topics. MATLAB Environment. Introduction. Digital Signal Processing (DSP)
") Digital Signal Processing Prof. Nizamettin AYDIN naydin@yildiz.edu.tr naydin@ieee.org http://www.yildiz.edu.tr/~naydin Course Details Course Code : 0113620 Course Name: Digital Signal Processing (Sayısal
Digital Signal Processing Prof. Nizamettin AYDIN naydin@yildiz.edu.tr naydin@ieee.org http://www.yildiz.edu.tr/~naydin Course Details Course Code : 0113620 Course Name: Digital Signal Processing (Sayısal
Basic R Part 1 BTI Plant Bioinformatics Course
 Basic R Part 1 BTI Plant Bioinformatics Course Spring 2013 Sol Genomics Network Boyce Thompson Institute for Plant Research by Jeremy D. Edwards What is R? Statistical programming language Derived from
Short Introduction to R
 Short Introduction to R Paulino Pérez 1 José Crossa 2 1 ColPos-México 2 CIMMyT-México June, 2015. CIMMYT, México-SAGPDB Short Introduction to R 1/51 Contents 1 Introduction 2 Simple objects 3 User defined
Lecturer: Keyvan Dehmamy
 MATLAB Tutorial Lecturer: Keyvan Dehmamy 1 Topics Introduction Running MATLAB and MATLAB Environment Getting help Variables Vectors, Matrices, and linear Algebra Mathematical Functions and Applications
A. Matrix-wise and element-wise operations
 USC GSBME MATLAB CLASS Reviewing previous session Second session A. Matrix-wise and element-wise operations A.1. Matrix-wise operations So far we learned how to define variables and how to extract data
Programming for Engineers in Python. Recitation 2
 Programming for Engineers in Python Recitation 2 Plan Range For loop While loop Lists Modules Operations Arithmetic Operations: + plus - minus * multiply / divide (int / float) % modulo (remainder) **
Programming with R. Educational Materials 2006 S. Falcon, R. Ihaka, and R. Gentleman
 Programming with R Educational Materials 2006 S. Falcon, R. Ihaka, and R. Gentleman 1 Data Structures ˆ R has a rich set of self-describing data structures. > class(z) [1] "character" > class(x) [1] "data.frame"
Finding, Starting and Using Matlab
 Variables and Arrays Finding, Starting and Using Matlab CSC March 6 &, 9 Array: A collection of data values organized into rows and columns, and known by a single name. arr(,) Row Row Row Row 4 Col Col
Part V Appendices c Copyright, Todd Young and Martin Mohlenkamp, Department of Mathematics, Ohio University, 2017
 Part V Appendices c Copyright, Todd Young and Martin Mohlenkamp, Department of Mathematics, Ohio University, 2017 Appendix A Glossary of Matlab Commands Mathematical Operations + Addition. Type help plus
Getting started with MATLAB
 Sapienza University of Rome Department of economics and law Advanced Monetary Theory and Policy EPOS 2013/14 Getting started with MATLAB Giovanni Di Bartolomeo giovanni.dibartolomeo@uniroma1.it Outline
Computer lab 2 Course: Introduction to R for Biologists
 Computer lab 2 Course: Introduction to R for Biologists April 23, 2012 1 Scripting As you have seen, you often want to run a sequence of commands several times, perhaps with small changes. An efficient
Package cgraph. March 11, 2019
 Type Package Title Computational Graphs Version 4.0.1 Author Maintainer URL https://cgraph.org/ Package cgraph March 11, 2019 BugReports https://github.com/triepels/cgraph/issues Allows
MATLAB: The Basics. Dmitry Adamskiy 9 November 2011
 MATLAB: The Basics Dmitry Adamskiy adamskiy@cs.rhul.ac.uk 9 November 2011 1 Starting Up MATLAB Windows users: Start up MATLAB by double clicking on the MATLAB icon. Unix/Linux users: Start up by typing
Introduction to Scientific and Engineering Computing, BIL108E. Karaman
 USING MATLAB INTRODUCTION TO SCIENTIFIC & ENGINEERING COMPUTING BIL 108E, CRN24023 To start from Windows, Double click the Matlab icon. To start from UNIX, Dr. S. Gökhan type matlab at the shell prompt.
A VERY BRIEF INTRODUCTION TO R
 CS 432/532 INTRODUCTION TO WEB SCIENCE A VERY BRIEF INTRODUCTION TO R SCOTT G. AINSWORTH OLD DOMINION UNIVERSITY WHO AM I? Scott G. Ainsworth Former sailor Worked for several consulting firms Computer
ENGR Fall Exam 1
 ENGR 1300 Fall 01 Exam 1 INSTRUCTIONS: Duration: 60 minutes Keep your eyes on your own work! Keep your work covered at all times! 1. Each student is responsible for following directions. Read carefully..
Basics of R. > x=2 (or x<-2) > y=x+3 (or y<-x+3)
 > y=x+3 (or y<-x+3)") Basics of R 1. Arithmetic Operators > 2+2 > sqrt(2) # (2) >2^2 > sin(pi) # sin(π) >(1-2)*3 > exp(1) # e 1 >1-2*3 > log(10) # This is a short form of the full command, log(10, base=e). (Note) For log 10
Basics of R 1. Arithmetic Operators > 2+2 > sqrt(2) # (2) >2^2 > sin(pi) # sin(π) >(1-2)*3 > exp(1) # e 1 >1-2*3 > log(10) # This is a short form of the full command, log(10, base=e). (Note) For log 10
STAT 571A Advanced Statistical Regression Analysis. Introduction to R NOTES
 STAT 571A Advanced Statistical Regression Analysis Introduction to R NOTES 2015 University of Arizona Statistics GIDP. All rights reserved, except where previous rights exist. No part of this material
Introduction to R and R-Studio Toy Program #1 R Essentials. This illustration Assumes that You Have Installed R and R-Studio
 Introduction to R and R-Studio 2018-19 Toy Program #1 R Essentials This illustration Assumes that You Have Installed R and R-Studio If you have not already installed R and RStudio, please see: Windows