Binghamton University. CS-220 Spring C Debugging Basics. No relevant text
|
|
|
- Louisa Charles
- 6 years ago
- Views:
Transcription

1 C Debugging Basics No relevant text


2 First Computer Bug 2
3 The printf debugger Insert printf statements to print debug information Build/Run Modify to print new information Advantages Simple Complete Available anywhere Disadvantages Time consuming TMI Side effects change bug Forgetting to remove debug
4 Assert Method to check specific assertions An assertion is any logical expression, evaluated to true or false Expression passed as an argument to the assert function If the expression is true, assert does nothing. If the expression is false, assert writes an error message to stderr which contains function name, assertion, and line number aborts the C program (including a core dump if enabled) Assertion evaluation can be turned off once program is debugged #define NDEBUG 4
 { int j; for(j=0;j!")
5 Assertion example #inclue <assert.h> #include <stdio.h> int main() { int j; for(j=0;j!=100;j++) { assert(j<100); j=factorial(j); } } 5
6 GDB A Source Level Debugger! Compiling with -g option causes compiler/linker to track: C file names C instructions/line numbers Variable names and types Function names and line numbers and stack frame layout Compiling with g required for GDB Compiling with g limits optimization and increases executable size
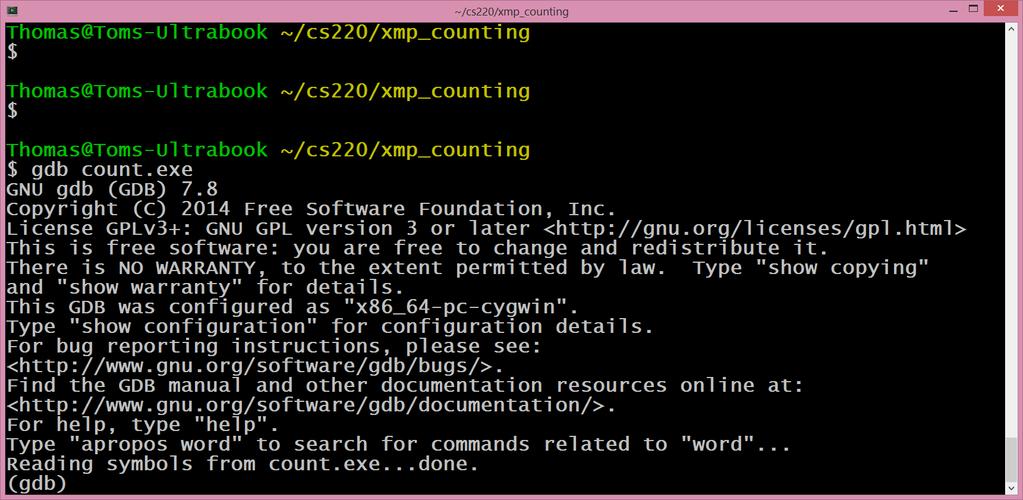
7 Command Line Mentality Start w/ gdb command, specifying executable file as argument gdb prints boilerplate info gdb loads the executable, but does NOT transfer control gdb opens a gdb prompt $ gdb count.exe GNU gdb (GDB) 7.8 Copyright (C) 2014 Free Software Foundation, Inc. License GPLv3+: GNU GPL version 3 or later < This is free software: you are free to change and redistribute it. There is NO WARRANTY, to the extent permitted by law. Type "show copying" and "show warranty" for details. This GDB was configured as "x86_64-pc-cygwin". Type "show configuration" for configuration details. For bug reporting instructions, please see: < Find the GDB manual and other documentation resources online at: < For help, type "help". Type "apropos word" to search for commands related to "word"... Reading symbols from count.exe...done. (gdb)

8 Hint: Open Editor/Code window first
9 GDB Context Current source file Current instruction: Line number and instruction about to execute Call stack: List of function calls, starting at main that got you to the current instruction Each entry is a frame main s frame is on top Current frame is a pointer into the call stack, typically bottom frame GDB Variable scope is scope of the current frame Breakpoint list: List of files/lines/functions where gdb should interrupt execution and open command line prompt
10 Initial GDB prompt Executable is loaded, but gdb is still in control Current GDB context Current file: C file which contains main function Current instruction: None No breakpoints set No function stack Need a (gdb) run <cmd_args> command to transfer execution Parses <cmd_args> into arguments to main Transfers execution to main WARNING: program will run to completion if no breakpoints are set!
11 GDB Command Line Processing (gdb) <enter> - Repeat previous command (gdb) <command> <arguments> <command> can be the shortest non-ambiguous gdb command prefix e.g. (gdb) n for next e.g. (gdb) where for where (gdb) w Ambiguous command "w": watch, wh, whatis, where, while, while-stepping, winheight, ws. Up/Down arrow to scroll through command history Left/Right arrow to edit command (gdb) help <cmd>
12 Managing Breakpoints Setting breakpoints: (gdb) b <location> if <condition> Location: <##> - break before instruction at line number <##> in current file <file>:<##> - break before instruction at line number <##> in file <file> <function_name> - break before first instruction in <function_name> function No location break before next instruction in current frame of call stack Condition: Any valid C expression like (*stringptr)!=0x00 Listing breakpoints: (gdb) info breakpoints Commands at breakpoints: (gdb) commands Removing breakpoints: (gdb) clear <location>
13 Single Stepping Code (gdb) s[tep] Run next C instruction If there is a function call, step into function (includes library functions) If function in a file not compiled w/ -g, stop after function Leaky abstractions: implicit returns and macros (gdb) n[ext] Run next C instruction If there is a function call, execute the function, but do not break inside the function (gdb) c[ontinue] Continue execution to next breakpoint
14 Dealing w/ Data (gdb) p[rint] <expression> Uses expression type to format result <expression> may be most valid C expressions <expression> may contain any variable visible in the current call stack frame scope (gdb) set <variable> = <expression>
15 Where Are You? 1 int fnb(int x, int y); 2 int fnc(int x, int y); 3 4 int main(int argc,char **argv) { 5 int i=fnb(3,4); 6 int j=fnb(3,6); 7 int k=fnb(3,1); 8 return 0; 9 } 10 int fnb(int x,int y) { 11 int m=fnc(x,1); 12 int n=fnc(1,y); 13 return m+n; 14 } 15 int fnc(int x, int y) { 16 return x%y; 17 } (gdb) b 16 (gdb) run Breakpoint 1, fnc (x=3, y=1) at xmp_where.c:16 16 return x%y; (gdb) You are here, but how did you get here? see xmp_where
16 Where Are You? 1 int fnb(int x, int y); 2 int fnc(int x, int y); 3 4 int main(int argc,char **argv) { 5 int i=fnb(3,4); 6 int j=fnb(3,6); 7 int k=fnb(3,1); 8 return 0; 9 } 10 int fnb(int x,int y) { 11 int m=fnc(x,1); 12 int n=fnc(1,y); 13 return m+n; 14 } 15 int fnc(int x, int y) { 16 return x%y; 17 } (gdb) b 16 (gdb) run Breakpoint 1, fnc (x=3, y=1) at xmp_where.c:16 16 return x%y; (gdb) where #0 fnc (x=3, y=1) at xmp_where.c:16 #1 0x in fnb (x=3, y=4) at xmp_where.c:11 #2 0x in main (argc=1, argv=0x23cb20) at xmp_where.c:5 (gdb)
17 Managing the call stack (gdb) where prints the call stack Each frame: [#]<nn> <function> (<args>) at <file>:<line> (gdb) up / (gdb) down Move the current frame up or down in the stack list (gdb) frame More gory details about current stack frame
18 Where Are You? 1 int fnb(int x, int y); 2 int fnc(int x, int y); 3 4 int main(int argc,char **argv) { 5 int i=fnb(3,4); 6 int j=fnb(3,6); 7 int k=fnb(3,1); 8 return 0; 9 } 10 int fnb(int x,int y) { 11 int m=fnc(x,1); 12 int n=fnc(1,y); 13 return m+n; 14 } 15 int fnc(int x, int y) { 16 return x%y; 17 } (gdb) b 16 (gdb) run Breakpoint 1, fnc (x=3, y=1) at xmp_where.c:16 16 return x%y; (gdb) where #0 fnc (x=3, y=1) at xmp_where.c:16 #1 0x in fnb (x=3, y=4) at xmp_where.c:11 #2 0x in main (argc=1, argv=0x23cb20) at xmp_where.c:5 (gdb) print y $1 = 1 (gdb) up #1 0x in fnb (x=3, y=4) at xmp_where.c:11 11 int m=fnc(x,1); (gdb) where #0 fnc (x=3, y=1) at xmp_where.c:16 #1 0x in fnb (x=3, y=4) at xmp_where.c:11 #2 0x in main (argc=1, argv=0x23cb20) at xmp_where.c:5 (gdb) print y $2 = 4
CMPSC 311- Introduction to Systems Programming Module: Debugging
 CMPSC 311- Introduction to Systems Programming Module: Debugging Professor Patrick McDaniel Fall 2016 Debugging Often the most complicated and time-consuming part of developing a program is debugging.
CMPSC 311- Introduction to Systems Programming Module: Debugging
 CMPSC 311- Introduction to Systems Programming Module: Debugging Professor Patrick McDaniel Fall 2014 Debugging Often the most complicated and time-consuming part of developing a program is debugging.
CSE 410: Systems Programming
 CSE 410: Systems Programming Recitation 4: Introduction to gdb Introduction The GNU Debugger, or gdb, is a powerful symbolic debugger. Symbolic debuggers are available for many languages and platforms,
Programming Tips for CS758/858
 Programming Tips for CS758/858 January 28, 2016 1 Introduction The programming assignments for CS758/858 will all be done in C. If you are not very familiar with the C programming language we recommend
ECE/ME/EMA/CS 759 High Performance Computing for Engineering Applications
 ECE/ME/EMA/CS 759 High Performance Computing for Engineering Applications Elements of Program Debugging Dan Negrut, 2017 ECE/ME/EMA/CS 759 UW-Madison Debugging on Euler [with gdb] Slides on gdb include
12. Debugging. Overview. COMP1917: Computing 1. Developing Programs. The Programming Cycle. Programming cycle. Do-it-yourself debugging
 COMP1917 12s2 Debugging 1 COMP1917: Computing 1 12. Debugging Overview Programming cycle Do-it-yourself debugging Debugging withgdb Nastier bugs Memory leaks COMP1917 12s2 Debugging 2 Developing Programs
Understanding the Program Run
 0/45 Understanding the Program Run Andreas Zeller Lehrstuhl Softwaretechnik Universität des Saarlandes, Saarbrücken Isolating Failure Causes 1/45 So far, we have seen how to isolate causes in the environment
CS/COE 0449 term 2174 Lab 5: gdb
 CS/COE 0449 term 2174 Lab 5: gdb What is a debugger? A debugger is a program that helps you find logical mistakes in your programs by running them in a controlled way. Undoubtedly by this point in your
CSCI0330 Intro Computer Systems Doeppner. Lab 02 - Tools Lab. Due: Sunday, September 23, 2018 at 6:00 PM. 1 Introduction 0.
 CSCI0330 Intro Computer Systems Doeppner Lab 02 - Tools Lab Due: Sunday, September 23, 2018 at 6:00 PM 1 Introduction 0 2 Assignment 0 3 gdb 1 3.1 Setting a Breakpoint 2 3.2 Setting a Watchpoint on Local
Scientific Programming in C IX. Debugging
 Scientific Programming in C IX. Debugging Susi Lehtola 13 November 2012 Debugging Quite often you spend an hour to write a code, and then two hours debugging why it doesn t work properly. Scientific Programming
High-performance computing and programming Intro to C on Unix/Linux. Uppsala universitet
 High-performance computing and programming Intro to C on Unix/Linux IT Uppsala universitet What is C? An old imperative language that remains rooted close to the hardware C is relatively small and easy
PROGRAMMAZIONE I A.A. 2017/2018
 PROGRAMMAZIONE I A.A. 2017/2018 STEPS OF GCC STEPS file.c Preprocessor Compiler file1.o file2.o Assembler Linker executable file PREPROCESSOR PREPROCESSOR The C preprocessor is a macro processor that is
Debugging and Debugger. Terminology. GNU gcc and gdb. Debugging C programs in Unix and Windows Environments - Part One
 Debugging C programs in Unix and Windows Environments - Part One ICT106 Fundamentals of Computer Systems Eric Li Debugging and Debugger The process of finding bugs in code called Debugging; A must-have
Intermediate Programming, Spring 2017*
 600.120 Intermediate Programming, Spring 2017* Misha Kazhdan *Much of the code in these examples is not commented because it would otherwise not fit on the slides. This is bad coding practice in general
Computer Labs: Debugging
 Computer Labs: Debugging 2 o MIEIC Pedro F. Souto (pfs@fe.up.pt) November 23, 2010 Bugs and Debugging Problem To err is human This is specially true when the human is a programmer :( Solution There is
Performance Metrics (I)
") COSC 6374 Parallel Computation Parallel Metrics and Debugging MPI application Edgar Gabriel Fall 2014 Performance Metrics (I) Strong Scaling: how much faster does a problem run on p processors compared
COSC 6374 Parallel Computation Parallel Metrics and Debugging MPI application Edgar Gabriel Fall 2014 Performance Metrics (I) Strong Scaling: how much faster does a problem run on p processors compared
Software Development With Emacs: The Edit-Compile-Debug Cycle
 Software Development With Emacs: The Edit-Compile-Debug Cycle Luis Fernandes Department of Electrical and Computer Engineering Ryerson Polytechnic University August 8, 2017 The Emacs editor permits the
Review of Scientific Programming in C and Fortran. Michael McLennan Software Architect HUBzero Platform for Scientific Collaboration
 Review of Scientific Programming in C and Fortran Michael McLennan Software Architect HUBzero Platform for Scientific Collaboration Monte Carlo Simulator Simulate by randomly generating thousands of tracks?
DEBUGGING: OBSERVING AND TRACKING
 DEBUGGING: OBSERVING AND TRACKING WS 2017/2018 Martina Seidl Institute for Formal Models and Verification Observing a Program deduction tells what might happen observation tells what is actually happening
Exercise Session 6 Computer Architecture and Systems Programming
 Systems Group Department of Computer Science ETH Zürich Exercise Session 6 Computer Architecture and Systems Programming Herbstsemester 2016 Agenda GDB Outlook on assignment 6 GDB The GNU Debugger 3 Debugging..
CS 270 Systems Programming. Debugging Tools. CS 270: Systems Programming. Instructor: Raphael Finkel
 Debugging Tools CS 270: Systems Programming Instructor: Raphael Finkel Gdb: The Gnu debugger It runs on most computers and operating systems. It allows you to examine a running executable program. It does
Blue Gene/Q User Workshop. Debugging
 Blue Gene/Q User Workshop Debugging Topics GDB Core Files Coreprocessor 2 GNU Debugger (GDB) The GNU Debugger (GDB) The Blue Gene/Q system includes support for running GDB with applications that run on
CSE 351. GDB Introduction
 CSE 351 GDB Introduction Lab 2 Out either tonight or tomorrow Due April 27 th (you have ~12 days) Reading and understanding x86_64 assembly Debugging and disassembling programs Today: General debugging
Problem Set 1: Unix Commands 1
 Problem Set 1: Unix Commands 1 WARNING: IF YOU DO NOT FIND THIS PROBLEM SET TRIVIAL, I WOULD NOT RECOMMEND YOU TAKE THIS OFFERING OF 300 AS YOU DO NOT POSSESS THE REQUISITE BACKGROUND TO PASS THE COURSE.
Computer Labs: Debugging
 Computer Labs: Debugging 2 o MIEIC Pedro F. Souto (pfs@fe.up.pt) October 29, 2012 Bugs and Debugging Problem To err is human This is specially true when the human is a programmer :( Solution There is none.
CptS 360 (System Programming) Unit 4: Debugging
 Unit 4: Debugging") CptS 360 (System Programming) Unit 4: Debugging Bob Lewis School of Engineering and Applied Sciences Washington State University Spring, 2018 Motivation You re probably going to spend most of your code
CptS 360 (System Programming) Unit 4: Debugging Bob Lewis School of Engineering and Applied Sciences Washington State University Spring, 2018 Motivation You re probably going to spend most of your code
COSC 6374 Parallel Computation. Analytical Modeling of Parallel Programs (I) Edgar Gabriel Fall Execution Time
 Edgar Gabriel Fall Execution Time") COSC 6374 Parallel Computation Analytical Modeling of Parallel Programs (I) Edgar Gabriel Fall 2015 Execution Time Serial runtime T s : time elapsed between beginning and the end of the execution of a
COSC 6374 Parallel Computation Analytical Modeling of Parallel Programs (I) Edgar Gabriel Fall 2015 Execution Time Serial runtime T s : time elapsed between beginning and the end of the execution of a
Testing and Debugging C Programming and Software Tools. N.C. State Department of Computer Science
 Testing and Debugging C Programming and Software Tools N.C. State Department of Computer Science Introduction Majority of software development is testing, debugging, and bug fixing The best software developers
Outline. Computer programming. Debugging. What is it. Debugging. Hints. Debugging
 Outline Computer programming Debugging Hints Gathering evidence Common C errors "Education is a progressive discovery of our own ignorance." Will Durant T.U. Cluj-Napoca - Computer Programming - lecture
CSci 4061 Introduction to Operating Systems. Programs in C/Unix
 CSci 4061 Introduction to Operating Systems Programs in C/Unix Today Basic C programming Follow on to recitation Structure of a C program A C program consists of a collection of C functions, structs, arrays,
mp2 Warmup Instructions (Updated 1/25/2016 by Ron Cheung for using VMs)
") mp2 Warmup Instructions (Updated 1/25/2016 by Ron Cheung for using VMs) Study the lecture notes on the tools and instruction set. Then follow along with this document. Make sure everything works for you
mp2 Warmup Instructions (Updated 1/25/2016 by Ron Cheung for using VMs) Study the lecture notes on the tools and instruction set. Then follow along with this document. Make sure everything works for you
Lab 10: Introduction to x86 Assembly
 CS342 Computer Security Handout # 8 Prof. Lyn Turbak Wednesday, Nov. 07, 2012 Wellesley College Revised Nov. 09, 2012 Lab 10: Introduction to x86 Assembly Revisions: Nov. 9 The sos O3.s file on p. 10 was
CS201 Lecture 2 GDB, The C Library
 CS201 Lecture 2 GDB, The C Library RAOUL RIVAS PORTLAND STATE UNIVERSITY Announcements 2 Multidimensional Dynamically Allocated Arrays Direct access support. Same as Multidimensional Static Arrays No direct
GDB Linux GNU Linux Distribution. gdb gcc g++ -g gdb EB_01.cpp
 B Linux GDB GDB Linux GNU GPL Linux Distribution Linux E-B.1 gcc g++ -g EB_01.cpp EB_01.cpp E/EB/EB_01.cpp 1 2 3 4 5 6 7 8 9 10 11 12 13 14 15 16 17 18 19 /**** :EB_01.cpp : *****/ #include
SU 2017 May 18/23 LAB 3 Bitwise operations, Program structures, Functions (pass-by-value), local vs. global variables. Debuggers
, local vs. global variables. Debuggers") SU 2017 May 18/23 LAB 3 Bitwise operations, Program structures, Functions (pass-by-value), local vs. global variables. Debuggers 1. Problem A Pass-by-value, and trace a program with debugger 1.1 Specification
SU 2017 May 18/23 LAB 3 Bitwise operations, Program structures, Functions (pass-by-value), local vs. global variables. Debuggers 1. Problem A Pass-by-value, and trace a program with debugger 1.1 Specification
CS2: Debugging in Java
 CS2: Debugging in Java 1. General Advice Jon Cook (LFCS) April 2003 Debugging is not always easy. Some bugs can take a long time to find. Debugging concurrent code can be particularly difficult and time
COSC 6374 Parallel Computation. Debugging MPI applications. Edgar Gabriel. Spring 2008
 COSC 6374 Parallel Computation Debugging MPI applications Spring 2008 How to use a cluster A cluster usually consists of a front-end node and compute nodes Name of the front-end node: shark.cs.uh.edu You
Lab 8. Follow along with your TA as they demo GDB. Make sure you understand all of the commands, how and when to use them.
 Lab 8 Each lab will begin with a recap of last lab and a brief demonstration by the TAs for the core concepts examined in this lab. As such, this document will not serve to tell you everything the TAs
Programs. Function main. C Refresher. CSCI 4061 Introduction to Operating Systems
 Programs CSCI 4061 Introduction to Operating Systems C Program Structure Libraries and header files Compiling and building programs Executing and debugging Instructor: Abhishek Chandra Assume familiarity
Using gdb to find the point of failure
 gdb gdb is the GNU debugger on our CS machines. gdb is most effective when it is debugging a program that has debugging symbols linked in to it. With gcc and g++, this is accomplished using the -g option,
Lab6 GDB debugging. Conventions. Department of Computer Science and Information Engineering National Taiwan University
 Lab6 GDB debugging 1 / 15 Learn how to perform source-level debugging with GDB. 2 / 15 Host Machine OS: Windows Target Machine Raspberry Pi (2 or 3) Build Machine A computer with a SD card slot OS: Ubuntu
GDB cheatsheet - page 1
 Running # gdb [core dump] Start GDB (with optional core dump). # gdb --args Start GDB and pass arguments # gdb --pid Start GDB and attach to process. set args
Princeton University COS 217: Introduction to Programming Systems GDB Tutorial and Reference
 Princeton University COS 217: Introduction to Programming Systems GDB Tutorial and Reference Part 1: Tutorial This tutorial describes how to use a minimal subset of the gdb debugger. For more information
CS 392/681 Lab 6 Experiencing Buffer Overflows and Format String Vulnerabilities
 CS 392/681 Lab 6 Experiencing Buffer Overflows and Format String Vulnerabilities Given: November 13, 2003 Due: November 20, 2003 1 Motivation Buffer overflows and format string vulnerabilities are widespread
CS354 gdb Tutorial Written by Chris Feilbach
 CS354 gdb Tutorial Written by Chris Feilbach Purpose This tutorial aims to show you the basics of using gdb to debug C programs. gdb is the GNU debugger, and is provided on systems that
Source level debugging. October 18, 2016
 Source level debugging October 18, 2016 Source level debugging Source debugging is a nice tool for debugging execution problems; it can be particularly useful when working with crashed programs that leave
Computer Science II Lab 3 Testing and Debugging
 Computer Science II Lab 3 Testing and Debugging Introduction Testing and debugging are important steps in programming. Loosely, you can think of testing as verifying that your program works and debugging
PetaLinux SDK User Guide. Application Development Guide
 PetaLinux SDK User Guide Notice of Disclaimer The information disclosed to you hereunder (the "Materials") is provided solely for the selection and use of Xilinx products. To the maximum extent permitted
GDB Tutorial. A Walkthrough with Examples. CMSC Spring Last modified March 22, GDB Tutorial
 A Walkthrough with Examples CMSC 212 - Spring 2009 Last modified March 22, 2009 What is gdb? GNU Debugger A debugger for several languages, including C and C++ It allows you to inspect what the program
1 A Brief Introduction To GDB
 1 A Brief Introduction To GDB GDB, the GNU Project debugger, allows you to see what is going on inside another program while it executes or what another program was doing at the moment it crashed. GDB
Your code must have been compiled with the -g compiler option. Example:
 ddd Tips This provides some helpful information about the Unix ddd debugger. with more detailed information: There are other resources available gnu ddd manual matloff ddd information Contents Prerequisites...
Program Design: Using the Debugger
 rogram Design, February 2, 2004 1 Program Design: Using the Debugger A debugger is an alternative to putting print (printf in C) statements in your program, recompiling and trying to find out what values
CSE 374 Programming Concepts & Tools
 CSE 374 Programming Concepts & Tools Hal Perkins Fall 2017 Lecture 11 gdb and Debugging 1 Administrivia HW4 out now, due next Thursday, Oct. 26, 11 pm: C code and libraries. Some tools: gdb (debugger)
Model Viva Questions for Programming in C lab
 Model Viva Questions for Programming in C lab Title of the Practical: Assignment to prepare general algorithms and flow chart. Q1: What is a flowchart? A1: A flowchart is a diagram that shows a continuous
F28HS2 Hardware-Software Interface. Lecture 1: Programming in C 1
 F28HS2 Hardware-Software Interface Lecture 1: Programming in C 1 Introduction in this half of the course we will study: system level programming in C assembly language programming for the ARM processor
Laboratory 1 Semester 1 11/12
 CS2106 National University of Singapore School of Computing Laboratory 1 Semester 1 11/12 MATRICULATION NUMBER: In this lab exercise, you will get familiarize with some basic UNIX commands, editing and
Functions in C C Programming and Software Tools. N.C. State Department of Computer Science
 Functions in C C Programming and Software Tools N.C. State Department of Computer Science Functions in C Functions are also called subroutines or procedures One part of a program calls (or invokes the
Debugging Techniques. CEFET Engineering Week
 Debugging Techniques CEFET Engineering Week Petrópolis, May 10 th 2017 Luís Tarrataca 1 Luís Tarrataca CEFET Engineering Week (Luís Tarrataca 8:00): Debugging Techniques Task 1 It is expected that course
Lab 8 - Vectors, and Debugging. Directions
 Lab 8 - Vectors, and Debugging. Directions The labs are marked based on attendance and effort. It is your responsibility to ensure the TA records your progress by the end of the lab. While completing these
Simple C Program. Assembly Ouput. Using GCC to produce Assembly. Assembly produced by GCC is easy to recognize:
 Simple C Program Helloworld.c Programming and Debugging Assembly under Linux slides by Alexandre Denault int main(int argc, char *argv[]) { } printf("hello World"); Programming and Debugging Assembly under
Computer Programming. The greatest gift you can give another is the purity of your attention. Richard Moss
 Computer Programming The greatest gift you can give another is the purity of your attention. Richard Moss Outline Modular programming Modularity Header file Code file Debugging Hints Examples T.U. Cluj-Napoca
COSC 4397 Parallel Computation. Debugging and Performance Analysis of Parallel MPI Applications
 COSC 4397 Parallel Computation Debugging and Performance Analysis of Parallel MPI Applications Edgar Gabriel Spring 2006 Edgar Gabriel Debugging sequential applications Several ways how to debug a sequential
CMPT 300. Operating Systems. Brief Intro to UNIX and C
 CMPT 300 Operating Systems Brief Intro to UNIX and C Outline Welcome Review Questions UNIX basics and Vi editor Using SSH to remote access Lab2(4214) Compiling a C Program Makefile Basic C/C++ programming
Using the Debugger. Michael Jantz Dr. Prasad Kulkarni
 Using the Debugger Michael Jantz Dr. Prasad Kulkarni 1 Debugger What is it a powerful tool that supports examination of your program during execution. Idea behind debugging programs. Creates additional
Instructions PLEASE READ (notice bold and underlined phrases)
") Lab Exercises wk05 More Debugging with NetBeans Required Reading None Instructions PLEASE READ (notice bold and underlined phrases) Lab Exercise has three parts: A. Lab Demo Watch Demo, reproduce it, show
Lab Exercises wk05 More Debugging with NetBeans Required Reading None Instructions PLEASE READ (notice bold and underlined phrases) Lab Exercise has three parts: A. Lab Demo Watch Demo, reproduce it, show
Debugging. John Lockman Texas Advanced Computing Center
 Debugging John Lockman Texas Advanced Computing Center Debugging Outline GDB Basic use Attaching to a running job DDT Identify MPI problems using Message Queues Catch memory errors PTP For the extremely
GDB QUICK REFERENCE GDB Version 4
 GDB QUICK REFERENCE GDB Version 4 Essential Commands gdb program [core] debug program [using coredump core] b [file:]function run [arglist] bt p expr c n s set breakpoint at function [in file] start your
Reviewing gcc, make, gdb, and Linux Editors 1
 Reviewing gcc, make, gdb, and Linux Editors 1 Colin Gordon csgordon@cs.washington.edu University of Washington CSE333 Section 1, 3/31/11 1 Lots of material borrowed from 351/303 slides Colin Gordon (University
Chapter - 17 Debugging and Optimization. Practical C++ Programming Copyright 2003 O'Reilly and Associates Page 1
 Chapter - 17 Debugging and Optimization Practical C++ Programming Copyright 2003 O'Reilly and Associates Page 1 Debugging Techniques Divide and conquer Debug only code Debug Command Line Switch Note: Use
BIL 104E Introduction to Scientific and Engineering Computing. Lecture 14
 BIL 104E Introduction to Scientific and Engineering Computing Lecture 14 Because each C program starts at its main() function, information is usually passed to the main() function via command-line arguments.
de facto standard C library Contains a bunch of header files and APIs to do various tasks
 CSE333 SECTION 6 GNU C Library de facto standard C library Contains a bunch of header files and APIs to do various tasks Don t need to memorize everything Do need to know what if there s an API that can
We first learn one useful option of gcc. Copy the following C source file to your
 Lecture 5 p.1 Faculty of Computer Science, Dalhousie University CSCI 2132 Software Development Lab 5: gcc and gdb tools 10-Oct-2018 Location: Teaching Labs Time: Thursday Instructor: Vlado Keselj Lab 5:
Data and File Structures Laboratory
 Tools: GDB, Valgrind Assistant Professor Machine Intelligence Unit Indian Statistical Institute, Kolkata August, 2018 1 GDB 2 Valgrind A programmer s experience Case I int x = 10, y = 25; x = x++ + y++;
The Dynamic Debugger gdb
 Introduction The Dynamic Debugger gdb This handout introduces the basics of using gdb, a very powerful dynamic debugging tool. No-one always writes programs that execute perfectly every time, and while
Bristol Institute of Technology
 Bristol Institute of Technology Academic Year: 09/10 Module Leader: Module Code: Title of Module: Ian Johnson UFCETS-20-1 Programming in C Examination Date: Monday 12 th January 2009 Examination Start
Code Review and Debugging (Lab 05)
") Code Review and Debugging (Lab 05) Assignment Overview The aim of this lab is: do a code review to learn the Google Code style rules learn to debug your C++ programs. The purpose of a debugger is to allow
Code Review and Debugging (Lab 05) Assignment Overview The aim of this lab is: do a code review to learn the Google Code style rules learn to debug your C++ programs. The purpose of a debugger is to allow
Programming Studio #9 ECE 190
 Programming Studio #9 ECE 190 Programming Studio #9 Concepts: Functions review 2D Arrays GDB Announcements EXAM 3 CONFLICT REQUESTS, ON COMPASS, DUE THIS MONDAY 5PM. NO EXTENSIONS, NO EXCEPTIONS. Functions
Libgdb. Version 0.3 Oct Thomas Lord
 Libgdb Version 0.3 Oct 1993 Thomas Lord Permission is granted to make and distribute verbatim copies of this manual provided the copyright notice and this permission notice are preserved on all copies.
Binghamton University. CS-211 Fall Variable Scope
 Variable Scope 1 2 Scope The places in your code that can read and/or write a variable. Scope starts at the location where you declare the variable There may be holes in the scope! Scope ends at the end
Command Line Interface / Application Programming Interface (cliapi) Kevin Sheldrake rtfc.org.uk
 Kevin Sheldrake rtfc.org.uk") Command Line Interface / Application Programming Interface (cliapi) Kevin Sheldrake rtfc.org.uk WTF? cliapi is a tool that runs individual functions in an executable or library on linux. Sometimes a function
Command Line Interface / Application Programming Interface (cliapi) Kevin Sheldrake rtfc.org.uk WTF? cliapi is a tool that runs individual functions in an executable or library on linux. Sometimes a function
Today s presentation. Git gdb Project 1
 CS3214: Project 1 Today s presentation Git gdb Project 1 Project 1 Due Monday, February 20 at 11:59 PM Office hours are on course website Check Piazza for updates Git Version Control System Keep snapshots
Hello, World! in C. Johann Myrkraverk Oskarsson October 23, The Quintessential Example Program 1. I Printing Text 2. II The Main Function 3
 Hello, World! in C Johann Myrkraverk Oskarsson October 23, 2018 Contents 1 The Quintessential Example Program 1 I Printing Text 2 II The Main Function 3 III The Header Files 4 IV Compiling and Running
GDB Tutorial. Young W. Lim Tue. Young W. Lim GDB Tutorial Tue 1 / 32
 GDB Tutorial Young W. Lim 2017-02-14 Tue Young W. Lim GDB Tutorial 2017-02-14 Tue 1 / 32 Outline 1 Introduction Young W. Lim GDB Tutorial 2017-02-14 Tue 2 / 32 Based on "Self-service Linux: Mastering the
Using a debugger. Segmentation fault? GDB to the rescue!
 Using a debugger Segmentation fault? GDB to the rescue! But first... Let's talk about the quiz Let's talk about the previous homework assignment Let's talk about the current homework assignment K findkey(v
CS2141 Software Development using C/C++ Debugging
 CS2141 Software Development using C/C++ Debugging Debugging Tips Examine the most recent change Error likely in, or exposed by, code most recently added Developing code incrementally and testing along
Dynamic memory allocation
 Dynamic memory allocation outline Memory allocation functions Array allocation Matrix allocation Examples Memory allocation functions (#include ) malloc() Allocates a specified number of bytes
Chapter 11 Introduction to Programming in C
 C: A High-Level Language Chapter 11 Introduction to Programming in C Original slides from Gregory Byrd, North Carolina State University Modified slides by Chris Wilcox, Colorado State University! Gives
Your code must have been compiled with the -g compiler option. Example:
 ddd Tips This provides some helpful information about the Unix ddd debugger. with more detailed information: There are other resources available gnu ddd manual matloff ddd information Contents Prerequisites...
Lecture 07 Debugging Programs with GDB
 Lecture 07 Debugging Programs with GDB In this lecture What is debugging Most Common Type of errors Process of debugging Examples Further readings Exercises What is Debugging Debugging is the process of
Debugging with gdb and valgrind
 Debugging with gdb and valgrind Dr. Axel Kohlmeyer Associate Dean for Scientific Computing, CST Associate Director, Institute for Computational Science Assistant Vice President for High-Performance Computing
RVDS 3.0 Introductory Tutorial
 RVDS 3.0 Introductory Tutorial 338v00 RVDS 3.0 Introductory Tutorial 1 Introduction Aim This tutorial provides you with a basic introduction to the tools provided with the RealView Development Suite version
18-600: Recitation #3
 18-600: Recitation #3 Bomb Lab & GDB Overview September 12th, 2017 1 Today X86-64 Overview Bomb Lab Introduction GDB Tutorial 2 3 x86-64: Register Conventions Arguments passed in registers: %rdi, %rsi,
Programming in C First meeting Tiina Niklander
 Programming in C First meeting 5.9.2016 Tiina Niklander Faculty of Science Department of Computer Science www.cs.helsinki.fi 5.9.2018 1 Learning goal objectives Language structures, data structures, modules,
CSE 124 Discussion (10/3) C/C++ Basics
 C/C++ Basics") CSE 124 Discussion (10/3) C/C++ Basics Topics - main() function - Compiling with gcc/makefile - Primitives - Structs/Enums - Function calls/loops - C++ Classes/stdtl - Pointers/Arrays - Memory allocation/freeing
CSE 124 Discussion (10/3) C/C++ Basics Topics - main() function - Compiling with gcc/makefile - Primitives - Structs/Enums - Function calls/loops - C++ Classes/stdtl - Pointers/Arrays - Memory allocation/freeing
Overview (1A) Young Won Lim 9/14/17
 Young Won Lim 9/14/17") Overview (1A) Copyright (c) 2009-2017 Young W. Lim. Permission is granted to copy, distribute and/or modify this document under the terms of the GNU Free Documentation License, Version 1.2 or any later
Overview (1A) Copyright (c) 2009-2017 Young W. Lim. Permission is granted to copy, distribute and/or modify this document under the terms of the GNU Free Documentation License, Version 1.2 or any later
Laboratory Assignment #4 Debugging in Eclipse CDT 1
 Lab 4 (10 points) November 20, 2013 CS-2301, System Programming for Non-majors, B-term 2013 Objective Laboratory Assignment #4 Debugging in Eclipse CDT 1 Due: at 11:59 pm on the day of your lab session
Chapter 11 Introduction to Programming in C
 C: A High-Level Language Chapter 11 Introduction to Programming in C Original slides from Gregory Byrd, North Carolina State University Modified slides by Chris Wilcox, Colorado State University Gives
Debugging. Marcelo Ponce SciNet HPC Consortium University of Toronto. July 15, /41 Ontario HPC Summerschool 2016 Central Edition: Toronto
 Debugging Marcelo Ponce SciNet HPC Consortium University of Toronto July 15, 2016 1/41 Ontario HPC Summerschool 2016 Central Edition: Toronto Outline Debugging Basics Debugging with the command line: GDB
CSE 374 Programming Concepts & Tools. Brandon Myers Winter 2015 Lecture 11 gdb and Debugging (Thanks to Hal Perkins)
") CSE 374 Programming Concepts & Tools Brandon Myers Winter 2015 Lecture 11 gdb and Debugging (Thanks to Hal Perkins) Hacker tool of the week (tags) Problem: I want to find the definition of a function or
CSE 374 Programming Concepts & Tools Brandon Myers Winter 2015 Lecture 11 gdb and Debugging (Thanks to Hal Perkins) Hacker tool of the week (tags) Problem: I want to find the definition of a function or
dbx90: Fortran debugger March 9, 2009
 dbx90: Fortran debugger March 9, 2009 1 Name dbx90 a Fortran 90/95 debugger for use with the NAG Fortran compiler. 2 Usage dbx90 [option]... executable-file 3 Description dbx90 is a Fortran 90/95 debugger