PSS718 - Data Mining
|
|
|
- Allen Hicks
- 5 years ago
- Views:
Transcription
1 Lecture 5 - Hacettepe University October 23, 2016
2 Data Issues Improving the performance of a model To improve the performance of a model, we mostly improve the data Source additional data Clean up the data Deal with missing values Transform the data Analyze the data to choose better variables
3 Data Issues The ACM KDD Cup Building models from the right data is crucial to the success of a data mining project. The ACM KDD Cup, an annual Data Mining and Knowledge Discovery competition, is often won by a team that has placed a lot of effort in preprocessing the data supplied.
4 Data Issues ACM KDD 2009 Orange supplied data related to customer relationship management 50,000 observations with much missing data Each observation recorded values for 15,000 (anonymous) variables Three target variables were to be modeled You really need to pre-process this before mining!
5 Data Issues Data cleaning When collecting data, it is not possible to ensure that it is perfect There are many reasons for the data to be dirty: Simple data entry errors Decimal points can be incorrectly placed There can be inherent error in any counting or measuring device External factors that cause errors to change over time
6 Data Issues A number of simple steps Example Most cleaning will be done during exploration Check frequency counts and histograms for anomalies Check very low category counts for categoric variables Check names and adresses, these usually have many versions Genc vs Genç Çırağan vs Cırağan vs Ciragan vs... Hacettepe Üniversitesi vs Hacettepe University vs University of Hacettepe
7 Data Issues Missing data Missing data is a common feature of any dataset Sometimes there is no information available to populate some value Sometimes the data has simply been lost Sometimes the data is purposefully missing because it does not apply to a particular observation For whatever reason the data is missing, we need to understand and possibly deal with it
8 Data Issues Some examples Use of sentinels for missing data Symbolic values: 999, 1 Jan 1900, Earth (for an address) Negative values where a positive is necessary: -1 Special characters: *, #, $, %, - Simply missing data: Character replacements: None, Missing, Null, Absent

 Min. 1st Qu.")
9 Data Issues Outliers Definition An outlier is an observation that has values for the variables that are quite different from most other observations. Example > summary(rawdata$alan) Min. 1st Qu. Median Mean 3rd Qu. Max
10 Data Issues Outlier vs high variance Hawkins (1980) An outlier is an observation that deviates so much from other observations as to arouse suspicion that it was generated by a different mechanism. Extreme weather conditions Extremely rich people Extremely short people (midgets) We have to be careful in deciding what is an outlier and what is not
11 Data Issues Looking for outliers Sometimes outliers are what we are looking for: Fraud in income tax Fraud in insurance Fraud in medical payment and medication expenses Marketing fraud
12 Data Issues Variable selection By removing irrelevant variables from the modeling process, the resulting models can be made more robust Some variables will also be found to be quite related to other variables Various techniques exist: Random subset selection Principal component analysis Variable importance measures of random forests...
13 Data Issues Rattle and transformation Rattle supports many techniques for transforming data.

14 Data Issues Don t forget Load Data Explore Transform Save!
15 Data Issues Alternative way of saving Log saving Save your log to a script! This will allow you to rerun the script to generate the modified dataset. Or apply the modification to another dataset! You can also modify the way of generation!
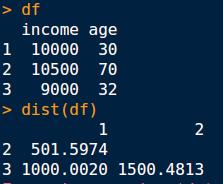
16 Example Different model builders will have different assumptions on the data from which the models are built When building a cluster, ensure all variables have the same scale Observation 1: Income -> $10,000 and Age -> 30 Observation 2: Income -> $10,500 and Age -> 70 Observation 3: Income -> $9,000 and Age -> 32 Which two observations are closest?
17 Normalization
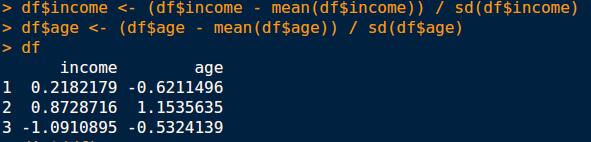
18 Normalization Recenter: uses a so-called Z score, which subtracts the mean and divides by the standard deviation Scale [0-1]: rescaling our data to be in the range from 0 to 1 Median/MAD: a robust rescaling around zero using the median Log 10: Obvious Matrix: transforming multiple variables with one divisor Rank: Order and rank the observations Interval: Group the observations into a predefined amount of bins
19 Recenter Definition (Recenter) This is a common normalisation that re-centres and rescales our data. The usual approach is to subtract the mean value of a variable from each observation s value of the variable (to recentre the variable) and then divide the values by their standard deviation (calculating the square root of the sum of squares), which rescales the variable back to a range within a few integer values around zero. Example > df$rrc_temp3pm <- scale(df$temp3pm)
20 Scale [0-1] Definition (Scale [0-1]) This is done by subtracting the minimum value from the variable s value for each observation and then dividing by the difference between the minimum and the maximum values. Example > library(reshape) > df$r01_temp3pm <- rescaler(df$temp3pm, "range")
21 Median/MAD Definition (Median/MAD) This option for re-centering and rescaling our data is regarded as a robust (to outliers) version of the standard Recenter option. Instead of using the mean and standard deviation, we subtract the median and divide by the so-called median absolute deviation (MAD). Example > library(reshape) > df$rmd_temp3pm <- rescaler(df$temp3pm, "robust")
22 Natural Logarithm Example Used when the distribution of a variable is quite skewed Maps a very broad range into a narrower range Outliers are easily handled Default is to log in base e (natural logarithm) Be careful for log 0 = and log of negative values > df$rlg_temp3pm <- log(df$temp3pm) > df$rlg_temp3pm[df$rlg_temp3pm == -Inf] <- NA
23 Rank Definition (Rank) The Rank will convert each observation s numeric value for the identified variable into a ranking in relation to all other observations in the dataset. A rank is simply a list of integers, starting from 1, that is mapped from the minimum value of the variable, progressing by integer until we reach the maximum value of the variable. Example > library(reshape) > df$rrk_temp3pm <- rescaler(df$temp3pm, "rank")
24 Interval Definition (Interval) An Interval transform recodes the values of a variable into a rank order between 0 and 100.
25 What is? Definition () is the process of filling in the gaps (or missing values) in data. Data is missing for many different reasons, and it is important to understand why can be questionable because, after all, we are inventing data
26 How to do it? Replace with a particular value (helps with regression) Add an additional variable to denote when values are missing (helps with models identifying the importance of the missing values) Some models are not troubled with missing values, e.g., decision trees
27 How Rattle does it?
28 Zero/Missing Definition (Zero/Missing) The simplest imputations involve replacing all missing values for a variable with a single value. This makes the most sense when we know that the missing values actually indicate that the value is 0 rather than unknown. Example > df$izr_sunshine <- df$sunshine > df$izr_sunshine[is.na(df$izr_sunshine)] <- 0
29 Mean/Median/Mode Definition (Mean/Median/Mode) Often a simple, if not always satisfactory, choice for missing values that are known not to be zero is to use some central value of the variable. This is often the mean, median, or mode, and thus usually has limited impact on the distribution. Example no skewness -> use mean skewed -> use median categoric variables -> use mode (the most frequent category) > df$imn_sunshine <- df$sunshine > df$imn_sunshine[is.na(df$imn_sunshine)] <- mean(df$sunshine, na.rm=true)
30 Constant Definition (Constant) This choice allows us to provide our own default value to fill in the gaps. This might be an integer or real number for numeric variables, or else a special marker or the choice of something other than the majority category for categoric variables. Example > df$icn_sunshine <- df$sunshine > df$icn_sunshine[is.na(df$izr_sunshine)] <- 0
31 What is Definition () provides numerous remapping operations, including binning and transformations of the type of the data.
32 Binning Definition (Binning) Binning is the operation of transforming a continuous numeric variable into a specific set of categoric values based on the numeric values. Age into AgeGroups Temperature into Low, Medium, High Humidity into Dry, Normal, Humid
33 Binning Quantile: Each bin will have approximately the same number of observations. If the Data tab includes a Weight variable, then the observations are weighted when performing the binning. KMeans: A kmeans clustering will be used for binning. Equal Width: The min to max range will be divided into equal width bins. We can also change the number of bins to be created for each method
34 Indicator variables Some model builders often do not directly handle categoric variables. One way to fix this is indicator or dummy variables For each level of a categoric variable, create a new indicator variable If for an observation the value of that categoric variable is that specific level, then the indicator value becomes 1, otherwise 0 Note that for a categoric variable with k unique levels, actually k-1 new variables will do. Why?
35 Join Categorics Definition (Join Categorics) The Join Categorics option provides a convenient way to stratify the dataset based on multiple categoric variables. It is a simple mechanism that creates a new variable from the combination of all of the values of the two constituent variables selected in the Rattle interface.
36 Type Conversion Definition (Type Conversion) The As Categoric and As Numeric options will, respectively, convert a numeric variable to categoric and vice versa. Example > df$tfc_cloud3pm <- as.factor(df$cloud3pm) > df$tnm_raintoday <- as.numeric(df$raintoday)
37 It is quite easy to get our dataset variable count up to significant numbers. The option allows us to tell Rattle to actually delete columns from the dataset. Options: Delete Ignored: remove any variable that is ignored Delete Selected: remove any variables we select Delete Missing: remove any variables that have missing values Delete Obs with Missing: remove observations (rather than variables) that have missing values.
Chapter 6: DESCRIPTIVE STATISTICS
 Chapter 6: DESCRIPTIVE STATISTICS Random Sampling Numerical Summaries Stem-n-Leaf plots Histograms, and Box plots Time Sequence Plots Normal Probability Plots Sections 6-1 to 6-5, and 6-7 Random Sampling
Data can be in the form of numbers, words, measurements, observations or even just descriptions of things.
 + What is Data? Data is a collection of facts. Data can be in the form of numbers, words, measurements, observations or even just descriptions of things. In most cases, data needs to be interpreted and
Data Preprocessing. S1 Teknik Informatika Fakultas Teknologi Informasi Universitas Kristen Maranatha
 Data Preprocessing S1 Teknik Informatika Fakultas Teknologi Informasi Universitas Kristen Maranatha 1 Why Data Preprocessing? Data in the real world is dirty incomplete: lacking attribute values, lacking
Basic Medical Statistics Course
 Basic Medical Statistics Course S0 SPSS Intro December 2014 Wilma Heemsbergen w.heemsbergen@nki.nl This Afternoon 13.00 ~ 15.00 SPSS lecture Short break Exercise 2 Database Example 3 Types of data Type
3. Data Preprocessing. 3.1 Introduction
 3. Data Preprocessing Contents of this Chapter 3.1 Introduction 3.2 Data cleaning 3.3 Data integration 3.4 Data transformation 3.5 Data reduction SFU, CMPT 740, 03-3, Martin Ester 84 3.1 Introduction Motivation
2. Data Preprocessing
 2. Data Preprocessing Contents of this Chapter 2.1 Introduction 2.2 Data cleaning 2.3 Data integration 2.4 Data transformation 2.5 Data reduction Reference: [Han and Kamber 2006, Chapter 2] SFU, CMPT 459
Slides for Data Mining by I. H. Witten and E. Frank
 Slides for Data Mining by I. H. Witten and E. Frank 7 Engineering the input and output Attribute selection Scheme-independent, scheme-specific Attribute discretization Unsupervised, supervised, error-
Preprocessing Short Lecture Notes cse352. Professor Anita Wasilewska
 Preprocessing Short Lecture Notes cse352 Professor Anita Wasilewska Data Preprocessing Why preprocess the data? Data cleaning Data integration and transformation Data reduction Discretization and concept
Overview. Data Mining for Business Intelligence. Shmueli, Patel & Bruce
 Overview Data Mining for Business Intelligence Shmueli, Patel & Bruce Galit Shmueli and Peter Bruce 2010 Core Ideas in Data Mining Classification Prediction Association Rules Data Reduction Data Exploration
Data Preprocessing. Why Data Preprocessing? MIT-652 Data Mining Applications. Chapter 3: Data Preprocessing. Multi-Dimensional Measure of Data Quality
 Why Data Preprocessing? Data in the real world is dirty incomplete: lacking attribute values, lacking certain attributes of interest, or containing only aggregate data e.g., occupation = noisy: containing
ECLT 5810 Data Preprocessing. Prof. Wai Lam
 ECLT 5810 Data Preprocessing Prof. Wai Lam Why Data Preprocessing? Data in the real world is imperfect incomplete: lacking attribute values, lacking certain attributes of interest, or containing only aggregate
Data Preprocessing. Slides by: Shree Jaswal
 Data Preprocessing Slides by: Shree Jaswal Topics to be covered Why Preprocessing? Data Cleaning; Data Integration; Data Reduction: Attribute subset selection, Histograms, Clustering and Sampling; Data
Statistics Lecture 6. Looking at data one variable
 Statistics 111 - Lecture 6 Looking at data one variable Chapter 1.1 Moore, McCabe and Craig Probability vs. Statistics Probability 1. We know the distribution of the random variable (Normal, Binomial)
MHPE 494: Data Analysis. Welcome! The Analytic Process
 MHPE 494: Data Analysis Alan Schwartz, PhD Department of Medical Education Memoona Hasnain,, MD, PhD, MHPE Department of Family Medicine College of Medicine University of Illinois at Chicago Welcome! Your
Prepare a stem-and-leaf graph for the following data. In your final display, you should arrange the leaves for each stem in increasing order.
 Chapter 2 2.1 Descriptive Statistics A stem-and-leaf graph, also called a stemplot, allows for a nice overview of quantitative data without losing information on individual observations. It can be a good
Acquisition Description Exploration Examination Understanding what data is collected. Characterizing properties of data.
 Summary Statistics Acquisition Description Exploration Examination what data is collected Characterizing properties of data. Exploring the data distribution(s). Identifying data quality problems. Selecting
ECT7110. Data Preprocessing. Prof. Wai Lam. ECT7110 Data Preprocessing 1
 ECT7110 Data Preprocessing Prof. Wai Lam ECT7110 Data Preprocessing 1 Why Data Preprocessing? Data in the real world is dirty incomplete: lacking attribute values, lacking certain attributes of interest,
STA 570 Spring Lecture 5 Tuesday, Feb 1
 STA 570 Spring 2011 Lecture 5 Tuesday, Feb 1 Descriptive Statistics Summarizing Univariate Data o Standard Deviation, Empirical Rule, IQR o Boxplots Summarizing Bivariate Data o Contingency Tables o Row
WELCOME! Lecture 3 Thommy Perlinger
 Quantitative Methods II WELCOME! Lecture 3 Thommy Perlinger Program Lecture 3 Cleaning and transforming data Graphical examination of the data Missing Values Graphical examination of the data It is important
Math 120 Introduction to Statistics Mr. Toner s Lecture Notes 3.1 Measures of Central Tendency
 Math 1 Introduction to Statistics Mr. Toner s Lecture Notes 3.1 Measures of Central Tendency lowest value + highest value midrange The word average: is very ambiguous and can actually refer to the mean,
Data Mining and Analytics. Introduction
 Data Mining and Analytics Introduction Data Mining Data mining refers to extracting or mining knowledge from large amounts of data It is also termed as Knowledge Discovery from Data (KDD) Mostly, data
Knowledge Discovery and Data Mining
 Knowledge Discovery and Data Mining Unit # 2 Sajjad Haider Spring 2010 1 Structured vs. Non-Structured Data Most business databases contain structured data consisting of well-defined fields with numeric
Basic Concepts Weka Workbench and its terminology
 Changelog: 14 Oct, 30 Oct Basic Concepts Weka Workbench and its terminology Lecture Part Outline Concepts, instances, attributes How to prepare the input: ARFF, attributes, missing values, getting to know
UNIT 2 Data Preprocessing
 UNIT 2 Data Preprocessing Lecture Topic ********************************************** Lecture 13 Why preprocess the data? Lecture 14 Lecture 15 Lecture 16 Lecture 17 Data cleaning Data integration and
Measures of Central Tendency
 Page of 6 Measures of Central Tendency A measure of central tendency is a value used to represent the typical or average value in a data set. The Mean The sum of all data values divided by the number of
MAT 142 College Mathematics. Module ST. Statistics. Terri Miller revised July 14, 2015
 MAT 142 College Mathematics Statistics Module ST Terri Miller revised July 14, 2015 2 Statistics Data Organization and Visualization Basic Terms. A population is the set of all objects under study, a sample
Mining Weather Data Using Rattle
 80 Mining Weather Data Using Rattle 1 Venkata Abhishek Bavirisetty, 2 Avinash Ankireddy, 3 Prasad Seemakurthi, 4 K.V.N. Rajesh 1, 2, 3, 4 Department of Information Technology, Vignan s Institute Of Information
Summary of Last Chapter. Course Content. Chapter 3 Objectives. Chapter 3: Data Preprocessing. Dr. Osmar R. Zaïane. University of Alberta 4
 Principles of Knowledge Discovery in Data Fall 2004 Chapter 3: Data Preprocessing Dr. Osmar R. Zaïane University of Alberta Summary of Last Chapter What is a data warehouse and what is it for? What is
Chapter 2 Basic Structure of High-Dimensional Spaces
 Chapter 2 Basic Structure of High-Dimensional Spaces Data is naturally represented geometrically by associating each record with a point in the space spanned by the attributes. This idea, although simple,
Measures of Central Tendency. A measure of central tendency is a value used to represent the typical or average value in a data set.
 Measures of Central Tendency A measure of central tendency is a value used to represent the typical or average value in a data set. The Mean the sum of all data values divided by the number of values in
Measures of Dispersion
 Measures of Dispersion 6-3 I Will... Find measures of dispersion of sets of data. Find standard deviation and analyze normal distribution. Day 1: Dispersion Vocabulary Measures of Variation (Dispersion
IT 403 Practice Problems (1-2) Answers
 Answers") IT 403 Practice Problems (1-2) Answers #1. Using Tukey's Hinges method ('Inclusionary'), what is Q3 for this dataset? 2 3 5 7 11 13 17 a. 7 b. 11 c. 12 d. 15 c (12) #2. How do quartiles and percentiles
IT 403 Practice Problems (1-2) Answers #1. Using Tukey's Hinges method ('Inclusionary'), what is Q3 for this dataset? 2 3 5 7 11 13 17 a. 7 b. 11 c. 12 d. 15 c (12) #2. How do quartiles and percentiles
Data Mining Clustering
 Data Mining Clustering Jingpeng Li 1 of 34 Supervised Learning F(x): true function (usually not known) D: training sample (x, F(x)) 57,M,195,0,125,95,39,25,0,1,0,0,0,1,0,0,0,0,0,0,1,1,0,0,0,0,0,0,0,0 0
Machine Learning Techniques for Data Mining
 Machine Learning Techniques for Data Mining Eibe Frank University of Waikato New Zealand 10/25/2000 1 PART VII Moving on: Engineering the input and output 10/25/2000 2 Applying a learner is not all Already
Data Analysis and Solver Plugins for KSpread USER S MANUAL. Tomasz Maliszewski
 Data Analysis and Solver Plugins for KSpread USER S MANUAL Tomasz Maliszewski tmaliszewski@wp.pl Table of Content CHAPTER 1: INTRODUCTION... 3 1.1. ABOUT DATA ANALYSIS PLUGIN... 3 1.3. ABOUT SOLVER PLUGIN...
Machine Learning Chapter 2. Input
 Machine Learning Chapter 2. Input 2 Input: Concepts, instances, attributes Terminology What s a concept? Classification, association, clustering, numeric prediction What s in an example? Relations, flat
MIT 801. Machine Learning I. [Presented by Anna Bosman] 16 February 2018
![MIT 801. Machine Learning I. [Presented by Anna Bosman] 16 February 2018](/thumbs/77/76295965.jpg "MIT 801. Machine Learning I. [Presented by Anna Bosman] 16 February 2018") MIT 801 [Presented by Anna Bosman] 16 February 2018 Machine Learning What is machine learning? Artificial Intelligence? Yes as we know it. What is intelligence? The ability to acquire and apply knowledge
MIT 801 [Presented by Anna Bosman] 16 February 2018 Machine Learning What is machine learning? Artificial Intelligence? Yes as we know it. What is intelligence? The ability to acquire and apply knowledge
Road Map. Data types Measuring data Data cleaning Data integration Data transformation Data reduction Data discretization Summary
 2. Data preprocessing Road Map Data types Measuring data Data cleaning Data integration Data transformation Data reduction Data discretization Summary 2 Data types Categorical vs. Numerical Scale types
By Mahesh R. Sanghavi Associate professor, SNJB s KBJ CoE, Chandwad
 By Mahesh R. Sanghavi Associate professor, SNJB s KBJ CoE, Chandwad Data Analytics life cycle Discovery Data preparation Preprocessing requirements data cleaning, data integration, data reduction, data
INTRODUCTION TO DATA MINING. Daniel Rodríguez, University of Alcalá
 INTRODUCTION TO DATA MINING Daniel Rodríguez, University of Alcalá Outline Knowledge Discovery in Datasets Model Representation Types of models Supervised Unsupervised Evaluation (Acknowledgement: Jesús
WHOLE NUMBER AND DECIMAL OPERATIONS
 WHOLE NUMBER AND DECIMAL OPERATIONS Whole Number Place Value : 5,854,902 = Ten thousands thousands millions Hundred thousands Ten thousands Adding & Subtracting Decimals : Line up the decimals vertically.
+ Statistical Methods in
 9/4/013 Statistical Methods in Practice STA/MTH 379 Dr. A. B. W. Manage Associate Professor of Mathematics & Statistics Department of Mathematics & Statistics Sam Houston State University Discovering Statistics
STA Rev. F Learning Objectives. Learning Objectives (Cont.) Module 3 Descriptive Measures
 Module 3 Descriptive Measures") STA 2023 Module 3 Descriptive Measures Learning Objectives Upon completing this module, you should be able to: 1. Explain the purpose of a measure of center. 2. Obtain and interpret the mean, median, and
STA 2023 Module 3 Descriptive Measures Learning Objectives Upon completing this module, you should be able to: 1. Explain the purpose of a measure of center. 2. Obtain and interpret the mean, median, and
MKTG 460 Winter 2019 Solutions #1
 MKTG 460 Winter 2019 Solutions #1 Short Answer: Data Analysis 1. What is a data table and how are the data values organized? A data table stores the data values for variables across different observations,
STA Module 4 The Normal Distribution
 STA 2023 Module 4 The Normal Distribution Learning Objectives Upon completing this module, you should be able to 1. Explain what it means for a variable to be normally distributed or approximately normally
STA /25/12. Module 4 The Normal Distribution. Learning Objectives. Let s Look at Some Examples of Normal Curves
 STA 2023 Module 4 The Normal Distribution Learning Objectives Upon completing this module, you should be able to 1. Explain what it means for a variable to be normally distributed or approximately normally
Data Preprocessing UE 141 Spring 2013
 Data Preprocessing UE 141 Spring 2013 Jing Gao SUNY Buffalo 1 Outline Data Data Preprocessing Improve data quality Prepare data for analysis Exploring Data Statistics Visualization 2 Document Data Each
Data Mining. Practical Machine Learning Tools and Techniques. Slides for Chapter 3 of Data Mining by I. H. Witten, E. Frank and M. A.
 Data Mining Practical Machine Learning Tools and Techniques Slides for Chapter 3 of Data Mining by I. H. Witten, E. Frank and M. A. Hall Input: Concepts, instances, attributes Terminology What s a concept?
Data Mining. Part 2. Data Understanding and Preparation. 2.4 Data Transformation. Spring Instructor: Dr. Masoud Yaghini. Data Transformation
 Data Mining Part 2. Data Understanding and Preparation 2.4 Spring 2010 Instructor: Dr. Masoud Yaghini Outline Introduction Normalization Attribute Construction Aggregation Attribute Subset Selection Discretization
Data Mining. SPSS Clementine k-means Algorithm. Spring 2010 Instructor: Dr. Masoud Yaghini. Clementine
 Data Mining SPSS 12.0 6. k-means Algorithm Spring 2010 Instructor: Dr. Masoud Yaghini Outline K-Means Algorithm in K-Means Node References K-Means Algorithm in Overview The k-means method is a clustering
CS570: Introduction to Data Mining
 CS570: Introduction to Data Mining Fall 2013 Reading: Chapter 3 Han, Chapter 2 Tan Anca Doloc-Mihu, Ph.D. Some slides courtesy of Li Xiong, Ph.D. and 2011 Han, Kamber & Pei. Data Mining. Morgan Kaufmann.
Data Preprocessing Yudho Giri Sucahyo y, Ph.D , CISA
 Obj ti Objectives Motivation: Why preprocess the Data? Data Preprocessing Techniques Data Cleaning Data Integration and Transformation Data Reduction Data Preprocessing Lecture 3/DMBI/IKI83403T/MTI/UI
After opening Stata for the first time: set scheme s1mono, permanently
 Stata 13 HELP Getting help Type help command (e.g., help regress). If you don't know the command name, type lookup topic (e.g., lookup regression). Email: tech-support@stata.com. Put your Stata serial
More Summer Program t-shirts
 ICPSR Blalock Lectures, 2003 Bootstrap Resampling Robert Stine Lecture 2 Exploring the Bootstrap Questions from Lecture 1 Review of ideas, notes from Lecture 1 - sample-to-sample variation - resampling
CITS4009 Introduction to Data Science
 School of Computer Science and Software Engineering CITS4009 Introduction to Data Science SEMESTER 2, 2017: CHAPTER 4 MANAGING DATA 1 Chapter Objectives Fixing data quality problems Organizing your data
CS513-Data Mining. Lecture 2: Understanding the Data. Waheed Noor
 CS513-Data Mining Lecture 2: Understanding the Data Waheed Noor Computer Science and Information Technology, University of Balochistan, Quetta, Pakistan Waheed Noor (CS&IT, UoB, Quetta) CS513-Data Mining
Chapter 3: Data Mining:
 Chapter 3: Data Mining: 3.1 What is Data Mining? Data Mining is the process of automatically discovering useful information in large repository. Why do we need Data mining? Conventional database systems
CHAPTER 2: DESCRIPTIVE STATISTICS Lecture Notes for Introductory Statistics 1. Daphne Skipper, Augusta University (2016)
") CHAPTER 2: DESCRIPTIVE STATISTICS Lecture Notes for Introductory Statistics 1 Daphne Skipper, Augusta University (2016) 1. Stem-and-Leaf Graphs, Line Graphs, and Bar Graphs The distribution of data is
CHAPTER 2: DESCRIPTIVE STATISTICS Lecture Notes for Introductory Statistics 1 Daphne Skipper, Augusta University (2016) 1. Stem-and-Leaf Graphs, Line Graphs, and Bar Graphs The distribution of data is
Data Exploration and Preparation Data Mining and Text Mining (UIC Politecnico di Milano)
") Data Exploration and Preparation Data Mining and Text Mining (UIC 583 @ Politecnico di Milano) References Jiawei Han and Micheline Kamber, "Data Mining, : Concepts and Techniques", The Morgan Kaufmann
Data Exploration and Preparation Data Mining and Text Mining (UIC 583 @ Politecnico di Milano) References Jiawei Han and Micheline Kamber, "Data Mining, : Concepts and Techniques", The Morgan Kaufmann
Data Mining Practical Machine Learning Tools and Techniques
 Input: Concepts, instances, attributes Data ining Practical achine Learning Tools and Techniques Slides for Chapter 2 of Data ining by I. H. Witten and E. rank Terminology What s a concept z Classification,
Regression on SAT Scores of 374 High Schools and K-means on Clustering Schools
 Regression on SAT Scores of 374 High Schools and K-means on Clustering Schools Abstract In this project, we study 374 public high schools in New York City. The project seeks to use regression techniques
Part I, Chapters 4 & 5. Data Tables and Data Analysis Statistics and Figures
 Part I, Chapters 4 & 5 Data Tables and Data Analysis Statistics and Figures Descriptive Statistics 1 Are data points clumped? (order variable / exp. variable) Concentrated around one value? Concentrated
Basic Medical Statistics Course
 Basic Medical Statistics Course S0 SPSS Intro November 2013 Wilma Heemsbergen w.heemsbergen@nki.nl 1 13.00 ~ 15.30 Database (20 min) SPSS (40 min) Short break Exercise (60 min) This Afternoon During the
CHAPTER 1. Introduction. Statistics: Statistics is the science of collecting, organizing, analyzing, presenting and interpreting data.
 1 CHAPTER 1 Introduction Statistics: Statistics is the science of collecting, organizing, analyzing, presenting and interpreting data. Variable: Any characteristic of a person or thing that can be expressed
SPSS. (Statistical Packages for the Social Sciences)
") Inger Persson SPSS (Statistical Packages for the Social Sciences) SHORT INSTRUCTIONS This presentation contains only relatively short instructions on how to perform basic statistical calculations in SPSS.
Inger Persson SPSS (Statistical Packages for the Social Sciences) SHORT INSTRUCTIONS This presentation contains only relatively short instructions on how to perform basic statistical calculations in SPSS.
Visualizing univariate data 1
 Visualizing univariate data 1 Xijin Ge SDSU Math/Stat Broad perspectives of exploratory data analysis(eda) EDA is not a mere collection of techniques; EDA is a new altitude and philosophy as to how we
Data preprocessing Functional Programming and Intelligent Algorithms
 Data preprocessing Functional Programming and Intelligent Algorithms Que Tran Høgskolen i Ålesund 20th March 2017 1 Why data preprocessing? Real-world data tend to be dirty incomplete: lacking attribute
Heteroskedasticity and Homoskedasticity, and Homoskedasticity-Only Standard Errors
 Heteroskedasticity and Homoskedasticity, and Homoskedasticity-Only Standard Errors (Section 5.4) What? Consequences of homoskedasticity Implication for computing standard errors What do these two terms
IQR = number. summary: largest. = 2. Upper half: Q3 =
 Step by step box plot Height in centimeters of players on the 003 Women s Worldd Cup soccer team. 157 1611 163 163 164 165 165 165 168 168 168 170 170 170 171 173 173 175 180 180 Determine the 5 number
Data Mining. Introduction. Hamid Beigy. Sharif University of Technology. Fall 1395
 Data Mining Introduction Hamid Beigy Sharif University of Technology Fall 1395 Hamid Beigy (Sharif University of Technology) Data Mining Fall 1395 1 / 21 Table of contents 1 Introduction 2 Data mining
Data Mining: Exploring Data. Lecture Notes for Chapter 3
 Data Mining: Exploring Data Lecture Notes for Chapter 3 1 What is data exploration? A preliminary exploration of the data to better understand its characteristics. Key motivations of data exploration include
IAT 355 Visual Analytics. Data and Statistical Models. Lyn Bartram
 IAT 355 Visual Analytics Data and Statistical Models Lyn Bartram Exploring data Example: US Census People # of people in group Year # 1850 2000 (every decade) Age # 0 90+ Sex (Gender) # Male, female Marital
SPSS TRAINING SPSS VIEWS
 SPSS TRAINING SPSS VIEWS Dataset Data file Data View o Full data set, structured same as excel (variable = column name, row = record) Variable View o Provides details for each variable (column in Data
Nature Methods: doi: /nmeth Supplementary Figure 1
 Supplementary Figure 1 Schematic representation of the Workflow window in Perseus All data matrices uploaded in the running session of Perseus and all processing steps are displayed in the order of execution.
CHAPTER 2 DESCRIPTIVE STATISTICS
 CHAPTER 2 DESCRIPTIVE STATISTICS 1. Stem-and-Leaf Graphs, Line Graphs, and Bar Graphs The distribution of data is how the data is spread or distributed over the range of the data values. This is one of
PSS718 - Data Mining
 Lecture 3 Hacettepe University, IPS, PSS October 10, 2016 Data is important Data -> Information -> Knowledge -> Wisdom Dataset a collection of data, a.k.a. matrix, table. Observation a row of a dataset,
Data Mining: Concepts and Techniques. (3 rd ed.) Chapter 3. Chapter 3: Data Preprocessing. Major Tasks in Data Preprocessing
 Chapter 3. Chapter 3: Data Preprocessing. Major Tasks in Data Preprocessing") Data Mining: Concepts and Techniques (3 rd ed.) Chapter 3 1 Chapter 3: Data Preprocessing Data Preprocessing: An Overview Data Quality Major Tasks in Data Preprocessing Data Cleaning Data Integration Data
Data Mining: Concepts and Techniques (3 rd ed.) Chapter 3 1 Chapter 3: Data Preprocessing Data Preprocessing: An Overview Data Quality Major Tasks in Data Preprocessing Data Cleaning Data Integration Data
DATA PREPROCESSING. Tzompanaki Katerina
 DATA PREPROCESSING Tzompanaki Katerina Background: Data storage formats Data in DBMS ODBC, JDBC protocols Data in flat files Fixed-width format (each column has a specific number of characters, filled
Statistical Analysis of Metabolomics Data. Xiuxia Du Department of Bioinformatics & Genomics University of North Carolina at Charlotte
 Statistical Analysis of Metabolomics Data Xiuxia Du Department of Bioinformatics & Genomics University of North Carolina at Charlotte Outline Introduction Data pre-treatment 1. Normalization 2. Centering,
Data Mining. Introduction. Hamid Beigy. Sharif University of Technology. Fall 1394
 Data Mining Introduction Hamid Beigy Sharif University of Technology Fall 1394 Hamid Beigy (Sharif University of Technology) Data Mining Fall 1394 1 / 20 Table of contents 1 Introduction 2 Data mining
Chapter 1. Looking at Data-Distribution
 Chapter 1. Looking at Data-Distribution Statistics is the scientific discipline that provides methods to draw right conclusions: 1)Collecting the data 2)Describing the data 3)Drawing the conclusions Raw
Using Machine Learning to Optimize Storage Systems
 Using Machine Learning to Optimize Storage Systems Dr. Kiran Gunnam 1 Outline 1. Overview 2. Building Flash Models using Logistic Regression. 3. Storage Object classification 4. Storage Allocation recommendation
STA Module 2B Organizing Data and Comparing Distributions (Part II)
") STA 2023 Module 2B Organizing Data and Comparing Distributions (Part II) Learning Objectives Upon completing this module, you should be able to 1 Explain the purpose of a measure of center 2 Obtain and
STA 2023 Module 2B Organizing Data and Comparing Distributions (Part II) Learning Objectives Upon completing this module, you should be able to 1 Explain the purpose of a measure of center 2 Obtain and
STA Learning Objectives. Learning Objectives (cont.) Module 2B Organizing Data and Comparing Distributions (Part II)
 Module 2B Organizing Data and Comparing Distributions (Part II)") STA 2023 Module 2B Organizing Data and Comparing Distributions (Part II) Learning Objectives Upon completing this module, you should be able to 1 Explain the purpose of a measure of center 2 Obtain and
STA 2023 Module 2B Organizing Data and Comparing Distributions (Part II) Learning Objectives Upon completing this module, you should be able to 1 Explain the purpose of a measure of center 2 Obtain and
Data Mining: Exploring Data. Lecture Notes for Chapter 3. Introduction to Data Mining
 Data Mining: Exploring Data Lecture Notes for Chapter 3 Introduction to Data Mining by Tan, Steinbach, Kumar What is data exploration? A preliminary exploration of the data to better understand its characteristics.
Data Mining: Exploring Data. Lecture Notes for Data Exploration Chapter. Introduction to Data Mining
 Data Mining: Exploring Data Lecture Notes for Data Exploration Chapter Introduction to Data Mining by Tan, Steinbach, Karpatne, Kumar 02/03/2018 Introduction to Data Mining 1 What is data exploration?
Topic (3) SUMMARIZING DATA - TABLES AND GRAPHICS
 SUMMARIZING DATA - TABLES AND GRAPHICS") Topic (3) SUMMARIZING DATA - TABLES AND GRAPHICS 3- Topic (3) SUMMARIZING DATA - TABLES AND GRAPHICS A) Frequency Distributions For Samples Defn: A FREQUENCY DISTRIBUTION is a tabular or graphical display
Topic (3) SUMMARIZING DATA - TABLES AND GRAPHICS 3- Topic (3) SUMMARIZING DATA - TABLES AND GRAPHICS A) Frequency Distributions For Samples Defn: A FREQUENCY DISTRIBUTION is a tabular or graphical display
SOCIAL MEDIA MINING. Data Mining Essentials
 SOCIAL MEDIA MINING Data Mining Essentials Dear instructors/users of these slides: Please feel free to include these slides in your own material, or modify them as you see fit. If you decide to incorporate
Data Statistics Population. Census Sample Correlation... Statistical & Practical Significance. Qualitative Data Discrete Data Continuous Data
 Data Statistics Population Census Sample Correlation... Voluntary Response Sample Statistical & Practical Significance Quantitative Data Qualitative Data Discrete Data Continuous Data Fewer vs Less Ratio
Things you ll know (or know better to watch out for!) when you leave in December: 1. What you can and cannot infer from graphs.
 when you leave in December: 1. What you can and cannot infer from graphs.") 1 2 Things you ll know (or know better to watch out for!) when you leave in December: 1. What you can and cannot infer from graphs. 2. How to construct (in your head!) and interpret confidence intervals.
1 2 Things you ll know (or know better to watch out for!) when you leave in December: 1. What you can and cannot infer from graphs. 2. How to construct (in your head!) and interpret confidence intervals.
Exploring Data. This guide describes the facilities in SPM to gain initial insights about a dataset by viewing and generating descriptive statistics.
 This guide describes the facilities in SPM to gain initial insights about a dataset by viewing and generating descriptive statistics. 2018 by Minitab Inc. All rights reserved. Minitab, SPM, SPM Salford
DATA MINING AND MACHINE LEARNING. Lecture 6: Data preprocessing and model selection Lecturer: Simone Scardapane
 DATA MINING AND MACHINE LEARNING Lecture 6: Data preprocessing and model selection Lecturer: Simone Scardapane Academic Year 2016/2017 Table of contents Data preprocessing Feature normalization Missing
Vocabulary. 5-number summary Rule. Area principle. Bar chart. Boxplot. Categorical data condition. Categorical variable.
 5-number summary 68-95-99.7 Rule Area principle Bar chart Bimodal Boxplot Case Categorical data Categorical variable Center Changing center and spread Conditional distribution Context Contingency table
Frequency Distributions
 Displaying Data Frequency Distributions After collecting data, the first task for a researcher is to organize and summarize the data so that it is possible to get a general overview of the results. Remember,
Lecture Notes 3: Data summarization
 Lecture Notes 3: Data summarization Highlights: Average Median Quartiles 5-number summary (and relation to boxplots) Outliers Range & IQR Variance and standard deviation Determining shape using mean &
Lecture 1: Exploratory data analysis
 Lecture 1: Exploratory data analysis Statistics 101 Mine Çetinkaya-Rundel January 17, 2012 Announcements Announcements Any questions about the syllabus? If you sent me your gmail address your RStudio account
Basic Data Mining Technique
 Basic Data Mining Technique What is classification? What is prediction? Supervised and Unsupervised Learning Decision trees Association rule K-nearest neighbor classifier Case-based reasoning Genetic algorithm
Data Analyst Nanodegree Syllabus
 Data Analyst Nanodegree Syllabus Discover Insights from Data with Python, R, SQL, and Tableau Before You Start Prerequisites : In order to succeed in this program, we recommend having experience working
Data Mining. CS57300 Purdue University. Bruno Ribeiro. February 1st, 2018
 Data Mining CS57300 Purdue University Bruno Ribeiro February 1st, 2018 1 Exploratory Data Analysis & Feature Construction How to explore a dataset Understanding the variables (values, ranges, and empirical
A. Incorrect! This would be the negative of the range. B. Correct! The range is the maximum data value minus the minimum data value.
 AP Statistics - Problem Drill 05: Measures of Variation No. 1 of 10 1. The range is calculated as. (A) The minimum data value minus the maximum data value. (B) The maximum data value minus the minimum