2013 Residential Broadband Pricing Study
|
|
|
- Kristopher Snow
- 6 years ago
- Views:
Transcription


1
2 Table of Contents I. Introduction pg.3 II. Methodology pg.4 III. Presentation of Data pg. 5 IV. Conclusion pg. 24 V. About the Authors pg. 25 VI. Map Appendices a. Density Map pg.27 b. PCI Competition Map pg.28 c. Map pg.29 d. Price Maps pg.30 2
3 Introduction As part of our ongoing effort to assess the broadband climate in the state of Illinois, Broadband Illinois took a snapshot in time to investigate the pricing for various broadband options and subscriber plans around the state. This was not a study to find out where the cheapest or best values are in broadband, but rather to look at patterns in pricing/speeds as well as the percentages of homes that fall within the various patterns. The report is not written in a way to single out which providers might offer the best plans, lowest prices or best value nor does it attempt to assume any adoption or subscriber rates to the various plans. It is important to note this report did not include mobile broadband prices nor did we include satellite service pricing. While these are available and important choices for the consumers of the state, our particular focus was on high capacity, multiple device connected fixed broadband services, that would make available all of the types of applications consumers are likely to use, particularly those that need low latency connections. There are no simple answers in analyzing pricing data for broadband providers. Many carriers offer different plans at different speeds, and it really depends on what the customer s needs are when selecting a broadband plan. Broadband Illinois chose to collect and organize broadband prices according to the National Telecommunications & Information Administration (NTIA) National Broadband Map speed tiers. By taking this approach, Broadband Illinois was able to study the data more uniformly. 3
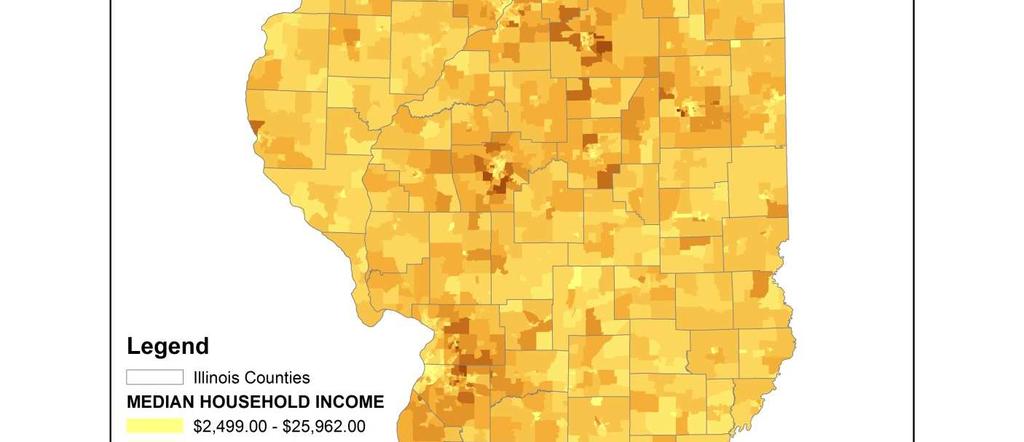
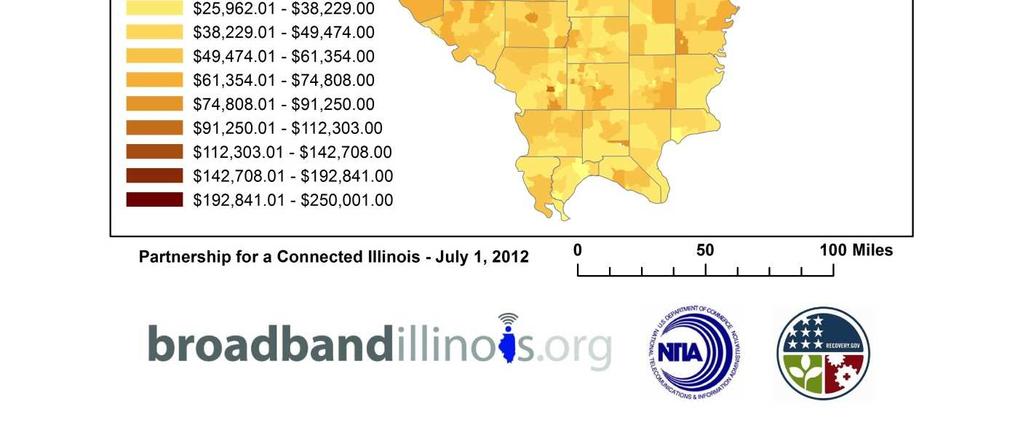
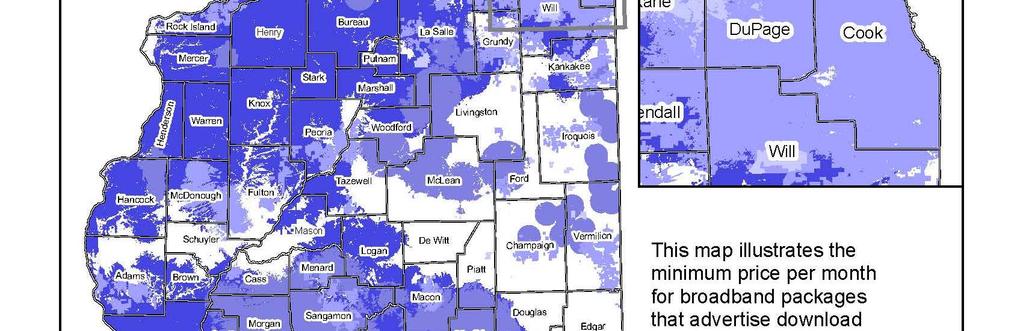
4 Methodology Information was gathered from visiting websites of the broadband providers in Illinois. Data variables included Technology, Bundle requirement, whether the plan was for a Business or Residential Customer, Download and Upload speeds, Price, and Data Cap Amount was recorded. The source URL was also recorded. If no information was available online, the same data variables were collected by placing a phone call to the broadband provider in question. All data was collected during the month of May, Once all available data was collected from the providers, Broadband Illinois used Microsoft Excel to calculate statistics (maximum, minimum, median) and create charts and graphs. Broadband Illinois merged the data collected to the carrier coverage area (footprint) submitted in the April 1, 2013 data submission to the NTIA for use in the National Broadband Map. Broadband Illinois is assuming that broadband packages are offered completely across a provider s footprint where they reported speed tier data to us. These footprints are current as of December 31, The join was completed and used to create a shapefile, each individual plan was separated by speed tier and any business plans were removed. After separating the data, Broadband Illinois used Natural Breaks (Jenks) to classify the broadband plans into 5 price ranges. As many providers overlap with each other, the clip and erase geoprocesses were used to generate map polygons that eliminate the overlap and show the minimum available price for a given point. Then, Broadband Illinois used census block occupied household data from the 2010 Census to calculate the number of households passed by each price range classification. Broadband Illinois specifically used the have the centroid in the source layer feature method to select census blocks within each price range class. The numbers generated were then moved to Microsoft Excel and repeated for each NTIA Speed Tier. Charts and Graphs were then created and are represented in the following pages. To determine if prices vary by economic makeup of any area, Broadband Illinois looked at income data from the United States Census Bureau s 2011 American Community Survey at Census Track levels. Broadband Illinois selected plans using the intersect the source layer feature method to select census tracts within each price range. It is important to note this was done with the unclipped and uneased data. The numbers generated were then moved to Microsoft Excel and repeated for each NTIA Speed Tier. Charts and Graphs were then created and also present in the report. When there are any references to household incomes and the word average this is an average over the census tracts covered by that particular speed/price tier combination. 4
5 Presentation of the Data 5


6 Number of Residential Broadband Internet Packages by Speed Tier kbps. > 200 kbps and < 768 kbps kbps and < 1.5 Mbps. 1.5 Mbps and < 3 Mbps Mbps and < 6 Mbps. 6 Mbps and < 10 Mbps. 10 Mbps and < 25 Mbps. 25 Mbps and < 50 Mbps Mbps and < 100 Mbps. 100 Mbps and < 1 Gbps. 1 Gbps. Chart 1. Number of Residential Broadband Internet Packages by Speed Tier Speed Tier Median Cost Max Cost Min Cost Number of Plans Offered by Carriers 200 kbps $ $ $ > 200 kbps and < 768 kbps $ $ $ kbps and < 1.5 Mbps $ $ $ Mbps and < 3 Mbps $ $ $ Mbps and < 6 Mbps $ $ $ Mbps and < 10 Mbps $ $ $ Mbps and < 25 Mbps $ $ $ Mbps and < 50 Mbps $ $ $ Mbps and < 100 Mbps $ $ $ Mbps $ $ $ Table 1. Residential Broadband Internet Packages by Speed Tier 6
7 $300 $275 Residential Broadband Prices per NTIA Speed Tier Price pre Month (US Dollars) $250 $225 $200 $175 $150 $125 $100 $75 $50 $25 $- Max Cost Median Cost Min Cost Chart 2. Max, Median, and Minimum Prices of Residential Broadband Internet Packages by Speed Tier Speed Tier Most Common Price Range Percentage of s < 768 kbps $ $ % 768 kbps and < 1.5 Mbps $ $ % 1.5 Mbps and < 3 Mbps $ $ % 3 Mbps and < 6 Mbps $ $ % 6 Mbps and < 10 Mbps $ $ % 10 Mbps and < 25 Mbps $ $ % 25 Mbps and < 50 Mbps $ $ % 50 Mbps and < 100 Mbps $ $ % 100 Mbps $ $ % Table 2. Most Common Residential Price Range with Greatest s for Each Speed Tier 7
8 80.00% Percentage of s with Access to Broadband Plans 768 kbps and < 1.5 Mbps 74.20% by Price 70.00% 60.00% 50.00% 40.00% 30.00% 20.00% $ $28.00 $ $36.95 $ $46.95 $ $65.95 $ $ % 0.00% 5.57% 7.74% 0.55% 0.82% $ $28.00 $ $36.95 $ $46.95 $ $65.95 $ $ Chart 3. s with Access to Broadband Plans 768 kbps and < 1.5 Mbps Price Range Broadband Plans 768 kbps and < 1.5 Mbps s Percentage of s $ $ % $ $ % $ $ % $ $ % $ $ % No Access to Speed Tier % Table 3. s with Access to Broadband Plans 768 kbps and < 1.5 Mbps 8
9 (U.S. Dollars) $360,000 $340,000 $320,000 $300,000 $280,000 $260,000 $240,000 $220,000 $200,000 $180,000 $160,000 $140,000 $120,000 $100,000 $80,000 $60,000 $40,000 $20,000 $- to Price Range/Speed Tier Broadband Plans 768 kbps and < 1.5 Mbps Minimum Median Maximum Chart 4. with Access to Broadband Plans 768 kbps and < 1.5 Mbps Price Range Number of Providers Price Range (U.S. Dollars) Broadband Plans 768 kbps and < 1.5 Mbps Percentage Minimum of s s Median Maximum $ $ % $ 12, $ 68, $ 348, $ $ % $ 20, $ 58, $ 138, $ $ % $ 20, $ 75, $ 291, $ $ % $ 20, $ 58, $ 147, $ $ % $ 21, $ 67, $ 201, Table 4. with Access to Broadband Plans 768 kbps and < 1.5 Mbps 9
10 80.00% 70.00% Percentage of s with Access to Broadband Plans 1.5 Mbps and < 3 Mbps 72.34% by Price 60.00% 50.00% 40.00% 30.00% 20.00% $ $30.00 $ $37.00 $ $44.95 $ $59.95 $ $ % 0.00% 9.06% 5.75% 6.74% 0.31% $ $30.00 $ $37.00 $ $44.95 $ $59.95 $ $ Chart 5. s with Access to Broadband Plans 1.5 Mbps and < 3 Mbps Broadband Plans 1.5 Mbps and < 3 Mbps Price Range s Percentage of s $ $ % $ $ % $ $ % $ $ % $ $ % No Access to Speed Tier % Table 5. s with Access to Broadband Plans 1.5 Mbps and < 3 Mbps 10
11 (U.S. Dollars) $360,000 $340,000 $320,000 $300,000 $280,000 $260,000 $240,000 $220,000 $200,000 $180,000 $160,000 $140,000 $120,000 $100,000 $80,000 $60,000 $40,000 $20,000 $- to Price Range/Speed Tier Broadband Plans 1.5 Mbps and < 3 Mbps Minimum Median Maximum Price Range (U.S. Dollars) Chart 6. with Access to Broadband Plans 1.5 Mbps and < 3 Mbps Price Range Number of Providers Broadband Plans 1.5 Mbps and < 3 Mbps s Percentage of s Minimum Median Maximum $ $ % $ 21, $ 72, $ 218, $ $ % $ 12, $ 67, $ 348, $ $ % $ 13, $ 62, $ 312, $ $ % $ 20, $ 69, $ 291, $ $ % $ 23, $ 57, $ 138, Table 6. with Access to Broadband Plans 1.5 Mbps and < 3 Mbps 11
12 100.00% 90.00% Percentage of s with Access to Broadband Plans 3 Mbps and < 6 Mbps 88.11% by Price 80.00% 70.00% 60.00% 50.00% 40.00% 30.00% $ $38.00 $ $54.00 $ $79.95 $ $ $ $ % 10.00% 0.00% 9.05% 1.46% 0.01% 0.02% $ $38.00 $ $54.00 $ $79.95 $ $ $ $ Chart 7. s with Access to Broadband Plans 3 Mbps and < 6 Mbps Broadband Plans 3 Mbps and < 6 Mbps Price Range Percentage of s s $ $ % $ $ % $ $ % $ $ % $ $ % Table 7. s with Access to Broadband Plans 3 Mbps and < 6 Mbps 12
13 (U.S. Dollars) $360,000 $340,000 $320,000 $300,000 $280,000 $260,000 $240,000 $220,000 $200,000 $180,000 $160,000 $140,000 $120,000 $100,000 $80,000 $60,000 $40,000 $20,000 $- to Price Range/Speed Tier Broadband Plans 3 Mbps and < 6 Mbps Minimum Median Maximum Price Range (U.S. Dollars) Chart 8. with Access to Broadband Plans 3 Mbps and < 6 Mbps Price Range Number of Providers Broadband Plans 3 Mbps and < 6 Mbps s Percentage of s Minimum Median Maximum $ $ % $ 12, $ 65, $ 48, $ $ % $ 12, $ 65, $ 348, $ $ % $ 16, $ 65, $ 291, $ $ % $ 23, $ 59, $ 134, $ $ % $ 31, $ 58, $ 106, Table 8. with Access to Broadband Plans 3 Mbps and < 6 Mbps 13
14 Percentage of s with Access to Broadband Plans 6 Mbps and < 10 Mbps % 90.00% 80.00% 90.77% by Price 70.00% 60.00% 50.00% 40.00% 30.00% $ $40.00 $ $52.95 $ $65.00 $ $79.99 $ $ % 10.00% 0.00% 1.74% 1.81% 1.38% 0.18% $ $40.00 $ $52.95 $ $65.00 $ $79.99 $ $ Chart 9. s with Access to Broadband Plans 6 Mbps and < 10 Mbps Price Range Broadband Plans 6 Mbps and < 10 Mbps s Percentage of s $ $ % $ $ % $ $ % $ $ % $ $ % Table 9. s with Access to Broadband Plans 6 Mbps and < 10 Mbps 14
15 (U.S. Dollars) $360,000 $340,000 $320,000 $300,000 $280,000 $260,000 $240,000 $220,000 $200,000 $180,000 $160,000 $140,000 $120,000 $100,000 $80,000 $60,000 $40,000 $20,000 $- to Price Range/Speed Tier Broadband Plans 6 Mbps and < 10 Mbps Minimum Median Maximum Price Range (U.S. Dollars) Chart 10. with Access to Broadband Plans 3 Mbps and < 6 Mbps Price Range Number of Providers Broadband Plans 6 Mbps and < 10 Mbps s Percentage of s Minimum Median Maximum $ $ % $ 12, $ 56, $ 147, $ $ % $ 12, $ 65, $ 348, $ $ % $ 13, $ 67, $ 218, $ $ % $ 12, $ 71, $ 249, $ $ % $ 16, $ 69, $ 279, Table 10. with Access to Broadband Plans 6 Mbps and < 10 Mbps 15
16 90.00% 80.00% Percentage of s with Access to Broadband Plans 10 Mbps and < 25 Mbps 77.56% by Price 70.00% 60.00% 50.00% 40.00% 30.00% 20.00% 10.00% 0.00% 18.22% 1.72% 0.26% 0.00% $ $45.95 $ $58.00 $ $79.99 $ $ $ $ $ $45.95 $ $58.00 $ $79.99 $ $ $ $ Chart 11. s with Access to Broadband Plans 10 Mbps and < 25 Mbps Broadband Plans 10 Mbps and < 25 Mbps Price Range Percentage of s s $ $ % $ $ % $ $ % $ $ % $ $ % Table 11. s with Access to Broadband Plans 10 Mbps and < 25 Mbps 16
17 (U.S. Dollars) $360,000 $340,000 $320,000 $300,000 $280,000 $260,000 $240,000 $220,000 $200,000 $180,000 $160,000 $140,000 $120,000 $100,000 $80,000 $60,000 $40,000 $20,000 $- to Price Range/Speed Tier Broadband Plans 10 Mbps and < 25 Mbps Minimum Median Maximum Price Range (U.S. Dollars) Chart 12. with Access to Broadband Plans 10 Mbps and < 25 Mbps Price Range Number of Providers Broadband Plans 10 Mbps and < 25 Mbps s Percentage of s Minimum Median Maximum $ $ % $ 12, $ 67, $ 348, $ $ % $ 12, $ 65, $ 348, $ $ % $ 12, $ 65, $ 348, $ $ % $ 13, $ 65, $ 201, $ $ % $ 36, $ 73, $ 164, Table 12. with Access to Broadband Plans 10 Mbps and < 25 Mbps 17
18 25.00% Percentage of s with Access to Broadband Plans 25 Mbps and < 50 Mbps by Price 20.00% 19.07% 15.00% 10.00% 10.80% $ $45.00 $ $59.95 $ $70.00 $ $ $ $ % 4.24% 0.00% 0.20% 0.00% $ $45.00 $ $59.95 $ $70.00 $ $ $ $ Chart 13. s with Access to Broadband Plans 25 Mbps and < 50 Mbps Broadband Plans 25 Mbps and < 50 Mbps Price Range Percentage of s s $ $ % $ $ % $ $ % $ $ % $ $ % Table 13. s with Access to Broadband Plans 25 Mbps and < 50 Mbps 18
19 (U.S. Dollars) $320,000 $300,000 $280,000 $260,000 $240,000 $220,000 $200,000 $180,000 $160,000 $140,000 $120,000 $100,000 $80,000 $60,000 $40,000 $20,000 $- to Price Range/Speed Tier Broadband Plans 25 Mbps and < 50 Mbps Minimum Median Maximum Price Range (U.S. Dollars) Chart 14. with Access to Broadband Plans 25 Mbps and < 50 Mbps Price Range Number of Providers Broadband Plans 25 Mbps and < 50 Mbps s Percentage of s Minimum Median Maximum $ $ % $ 16, $ 73, $ 233, $ $ % $ 39, $ 64, $ 97, $ $ % $ 13, $ 63, $ 312, $ $ % $ 21, $ 61, $ 138, $ $ % $ 21, $ 61, $ 138, Table 14. with Access to Broadband Plans 25 Mbps and < 50 Mbps 19
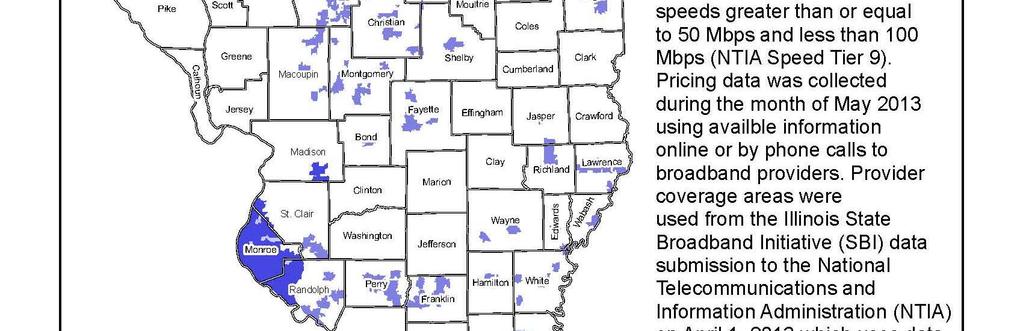
20 70.00% 60.00% Percent of s with Access to Broadband Plans 50 Mbps and < 100 Mbps 62.29% by Price 50.00% 40.00% 30.00% $ $64.95 $ $74.99 $ $90.00 $ $ % 15.43% 10.00% 0.00% 0.11% 0.00% $ $64.95 $ $74.99 $ $90.00 $ $ Chart 15. s with Access to Broadband Plans 50 Mbps and < 100 Mbps Price Range Broadband Plans 50 Mbps and < 100 Mbps s Percent of s in the State of IL $ $ % $ $ % $ $ % $ $ % Table 15. s with Access to Broadband Plans 50 Mbps and < 100 Mbps 20
21 (U.S. Dollars) $360,000 $340,000 $320,000 $300,000 $280,000 $260,000 $240,000 $220,000 $200,000 $180,000 $160,000 $140,000 $120,000 $100,000 $80,000 $60,000 $40,000 $20,000 $- to Price Range/Speed Tier Broadband Plans 50 Mbps and < 100 Mbps Minimum Median Maximum Price Range (U.S. Dollars) Chart 16. with Access to Broadband Plans 50 Mbps and < 100 Mbps Price Range Number of Providers Broadband Plans 50 Mbps and < 100 Mbps s Percentage of s Minimum Median Maximum $ $ % $ 16, $ 65, $ 279, $ $ % $ 12, $ 67, $ 348, $ $ % $ 22, $ 69, $ 312, $ $ % $ 39, $ 76, $ 96, Table 16. with Access to Broadband Plans 50 Mbps and < 100 Mbps 21
22 80.00% Percentage of s with Access to Broadband Plans 100 Mbps By Price 74.82% 70.00% 60.00% 50.00% 40.00% 30.00% $ $75.00 $ $ $ $ % 10.00% 0.00% 0.06% 5.42% $ $75.00 $ $ $ $ Chart 17. s with Access to Broadband Plans 100 Mbps Broadband Plans 100 Mbps Price Range Percentage of s s $ $ % $ $ % $ $ % Table 17. s with Access to Broadband Plans 100 Mbps 22
23 (U.S. Dollars) $360,000 $340,000 $320,000 $300,000 $280,000 $260,000 $240,000 $220,000 $200,000 $180,000 $160,000 $140,000 $120,000 $100,000 $80,000 $60,000 $40,000 $20,000 $- to Price Range/Speed Tier Broadband Plans 100 Mbps Minimum Median Maximum Price Range (U.S. Dollars) Chart 18. with Access to Broadband Plans 100 Mbps Price Range Number of Providers Broadband Plans 100 Mbps s Percentage of s Minimum Median Maximum $ $ % $ 41, $ 53, $ 90, $ $ % $ 23, $ 63, $ 133, $ $ % $ 12, $ 69, $ 348, Table 18. with Access to Broadband Plans 100 Mbps 23
24 Conclusion This study purposely did not go in to any deep analysis of the data to try and determine why various speed plans/prices were offered and where or which technologies offer which prices. Our goal was not to single out specific carriers or technologies and their pricing strategies, but to see the trends statewide. As we have seen over the lifetime of the mapping project, the carriers have been responding to consumers increased demand for bandwidth by improving and upgrading their network capacities. As the speeds have increased, the prices seem to be holding steady or dropping when you compare the cost per megabit of bandwidth. When we compare the current speed/price combinations to T1 circuits of only a few years ago, the costs have dropped dramatically. As the demographic income data was examined it became obvious there were not any patterns of broadband deployment or pricing plans that seemed discriminatory by income. This does not address adoption for the same reasons however. The competition within the state also did not appear to show any areas where pricing seems to be out of the norm due to a fewer number of broadband providers, not does there seem to be a any dramatically lower prices where you have many more providers in an area. We look forward to conducting this study again in a year to be able to investigate the trends at that time and also investigate the change over time if any. 24
25 About the Authors John Horrigan- John, in addition to his work at Broadband Illinois, is Vice President of Policy Research at TechNet, the bipartisan network of technology CEOs, where he is responsible for formulating and carrying out TechNet's research agenda to promote innovation. Prior to that, he was Research Director and member of the leadership team for the National Broadband Plan. He has a PhD in public policy analysis from the University of Texas at Austin. Brian Webster- Brian serves as the Telecom Data Coordinator for the Partnership for a Connected Illinois. He has led the data collection and analysis efforts for PCI and was instrumental in developing many of the measurement methods of broadband supply within the state. He is a wireless engineer and the President/CEO of Wireless Mapping Inc. His experience spans more than 23 years in the wireless and telecom industry in addition to the more than 2 years he has been working with Broadband Illinois. Steve Dryden- Steve currently serves as a GIS Database Analyst for the Partnership for a Connected Illinois where he is responsible for managing the semiannual submission of broadband provider data to the NTIA along with developing maps for publication. He has a Bachelor of Science in Meteorology from Western Illinois University along with a minor in GIS and Mathematics. 25

26 Broadband Illinois is located on the fifth floor at 531 East Washington St. in downtown Springfield, Illinois, across the street from the Old State Capitol building. Contact us Phone: (217) Fax: (217)

27 Map Appendices Map Downloadhttps://s3.amazonaws.com/PCIFile_Storage/Pricing+Rep ort+2013/households+per+square+mile.pdf 27

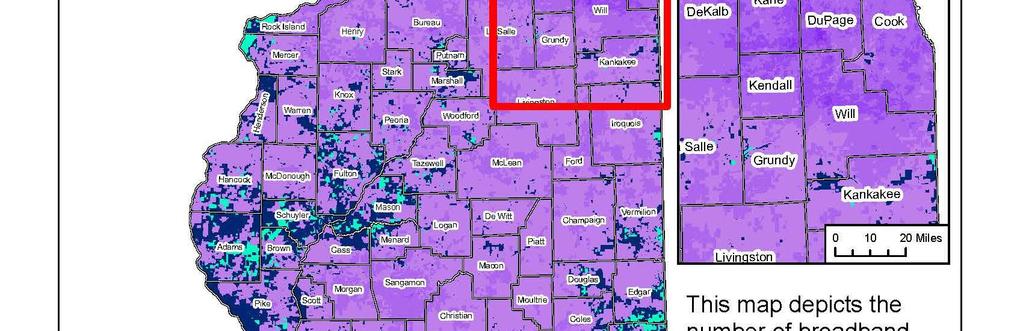
28 Map Download - Map+Final-No+Sat+and+Cell.pdf 28

29 Map Download pdf 29

30 Map Download - Min+Speed+Tier+3.pdf 30

31 Map Download - Min+Speed+Tier+4.pdf 31

32 Map Download - Min+Speed+Tier+5.pdf 32

33 Map Downloadhttps://s3.amazonaws.com/PCIFile_Storage/Pricing+Report+2013/ Min+Speed+Tier+6.pdf 33

34 Map Download - Min+Speed+Tier+7.pdf 34

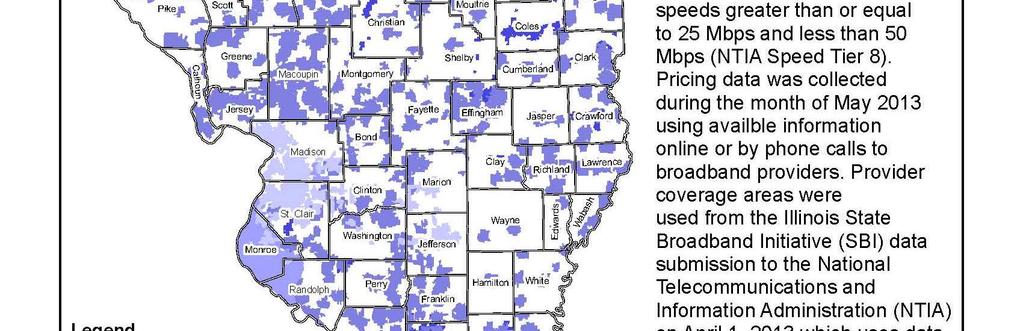
35 Map Download - Min+Speed+Tier+8.pdf 35

36 Map Download - Min+Speed+Tier+9.pdf 36
37 Map Download - Min+Speed+Tier+10.pdf 37
2014 Residential Broadband Pricing Study
 Table of Contents I. Introduction pg.3 II. Methodology pg.4 III. Presentation of Data pg. 5 IV. Conclusion pg. 24 V. About the Authors pg. 25 VI. Appendix a. Household Density Map pg.27 b. PCI Competition
Consistent Measurement of Broadband Availability
 Consistent Measurement of Broadband Availability By Advanced Analytical Consulting Group, Inc. September 2016 Abstract This paper provides several, consistent measures of broadband availability from 2009
Consistent Measurement of Broadband Availability
 Consistent Measurement of Broadband Availability FCC Data through 12/2015 By Advanced Analytical Consulting Group, Inc. December 2016 Abstract This paper provides several, consistent measures of broadband
U.S. Broadband Availability Mid-2016
 U.S. Broadband Availability Mid-2016 By Patrick Brogan, Vice President of Industry Analysis Research Brief August 25, 2017 U.S. broadband providers continue to deploy and upgrade networks rapidly, bringing
By Patrick Brogan, Vice President of Industry Analysis
 RESEARCH BRIEF FEBRUARY 22, 2018 U.S. BROADBAND AVAILABILITY YEAR-END 2016 By Patrick Brogan, Vice President of Industry Analysis U.S. broadband providers continued deploying and upgrading networks to
Connected Tennessee Final Grant Report
 Page 8 I. BROADBAND ACCESS IN TENNESSEE Mapping Since 2007, Connected Tennessee has researched and mapped growth and gaps in Tennessee broadband access in accordance with the Department of Commerce and
BEFORE THE PUBLIC UTILITIES COMMISSION OF THE STATE OF CALIFORNIA
 BEFORE THE PUBLIC UTILITIES COMMISSION OF THE STATE OF CALIFORNIA Order Instituting Investigation into the State of Competition Among Telecommunications Providers in California, and to Consider and Resolve
The State of Broadband in Virginia. Caroline Stolle Center for Innovative Technology
 The State of Broadband in Virginia Caroline Stolle Center for Innovative Technology Who is CIT Broadband? Provide support for localities and regions across the Commonwealth to facilitate expanded broadband
Entertainment Services: The future is mobile White Paper December 2016
 Entertainment Services: The future is mobile White Paper December 2016 Entertainment Services: The future is mobile White Paper Published December 2016 Version 1.0 Report Number: 042016-07 igr 12400 W.
Dr. Brian Whitacre Professor and Extension Economist Oklahoma State University
 Dr. Brian Whitacre Professor and Extension Economist Oklahoma State University Presentation for Federal Reserve Annual Agriculture Conference Chicago, IL November 27, 2018 Agenda What is Broadband, anyway?
rvic November
 rvic 201 Brooks Street, P.O. Box 812 Charleston, West Virginia 25323 Phone: (304) 340-0300 Fax: (304) 340-0325 November 19.201 8 Electronic Service Only J. Andrew Gipson, Esq. Counsel, Boomerang Wireless
U.S. Home Broadband & Wi-Fi Usage Forecast, : More homes, Wi-Fi and data
 U.S. Home Broadband & Wi-Fi Usage Forecast, 2016-2021: More homes, Wi-Fi and data Market Study Third Quarter 2017 U.S. Home Broadband & Wi-Fi Usage Forecast, 2016-2021: More homes, Wi-Fi and data Market
Via
 Howard Slawner 350 Bloor Street East, 6th Floor Toronto, ON M4W 0A1 howard.slawner@rci.rogers.com o 416.935.7009 m 416.371.6708 Via email: ic.spectrumengineering-genieduspectre.ic@canada.ca Senior Director
Broadband Opportunities and Challenges in the United States
 Broadband Opportunities and Challenges in the United States Global Forum 2009 Bucharest, Romania October 19, 2009 Brent Olson Assistant Vice President-Public Policy, AT&T 2009 AT&T Intellectual Property.
Broadband Deployment Data - Moving Beyond Form 477
 Broadband Deployment Data - Moving Beyond Form 477 Henning Schulzrinne (with Columbia DSI capstone teams: Aaron Sadholz, Aman Varma Mantena, Anna Zhou, E.K. Ito, Robert (Davis) DeRodes, Zixuan (Armstrong)
U.S. TV and Internet Providers: Competing services for mobile consumers TV time. Market Study Second Quarter 2017
 U.S. TV and Internet Providers: Competing services for mobile consumers TV time Market Study Second Quarter 2017 U.S. TV and Internet Providers: Competing services for mobile consumers TV time Market Study
Vanuatu Regulatory Statistical Framework An Overview ITU Asia-Pacific ICT Indicator Workshop, Manilla Philippine 2018
 Vanuatu Regulatory Statistical Framework An Overview ITU Asia-Pacific ICT Indicator Workshop, Manilla Philippine 2018 The Government of The Republic of Vanuatu Overview of Presentation Vanuatu a geopolitical
Michael Pierce Public Utilities Regulatory Analyst, Communications Division
 Item 34 (Agenda ID # 15947) Rev. 1 State of California Public Utilities Commission San Francisco M E M O R A N D U M Date : September 22, 2017 To : The Commission (Meeting of September 28, 2017) From :
AUTHORITY: Title II, Division A of the American Recovery and Reinvestment Act of 2009,
 http://www.recovery.gov. AUTHORITY: Title II, Division A of the American Recovery and Reinvestment Act of 2009, Public Law No. 111-5, 123 Stat.115 (Feb. 17, 2009); Broadband Data Improvement Act, Title
Transitioning to an IP economy Modernizing regulation to spur investment and keep up with consumer demand
 Transitioning to an IP economy Modernizing regulation to spur investment and keep up with consumer demand 1 The way the world communicates has changed dramatically since 1934 2 People are connecting in
The Effectiveness of Mobile Wireless Service as a Competitive Constraint on Landline Pricing: Was the DOJ Wrong?
 11 December 2008 The Effectiveness of Mobile Wireless Service as a Competitive Constraint on Landline Pricing: Was the DOJ Wrong? William E. Taylor and Harold Ware 1 The US Department of Justice (DOJ)
West Virginia Broadband Connectivity. Ahmed Saeed, Bao Nguyen, and Peter Gardner George Mason University, Spring 2017
 West Virginia Broadband Connectivity Ahmed Saeed, Bao Nguyen, and Peter Gardner George Mason University, Spring 2017 1 Problem Statement and Scope Rural areas lack high speed internet access Students,
Store Mapper User Guide
 Store Mapper User Guide Find & Display Local Retailer Data D R A F T S e p t e m b e r 1 0, 2 0 1 5 Table of Contents Introduction/Purpose... 3 Site Tour... 4 Map... 4 Info-box... 5 Map Tools... 6 Base
Woodland. 6. Broadband Community Profiles. A. Residential !!!!!!!!!!!!!!!!!!!!!!!!!!!!!!!!!!!!!!!!!!!!!!!!!!!!!!!! 16
 6. Broadband Community Profiles Woodland! A. Residential The residential broadband market in Woodland is served by two primary providers, AT&T of California, the incumbent local exchange carrier and Wave
Connect Minnesota Broadband Mapping Initiative
 Connect Minnesota Broadband Mapping Initiative February 6, 2009 Brent Legg Vice President State & Local Initiatives blegg@connectednation.org Wes Kerr Senior Manager, GIS Division wkerr@connectednation.org
Web+Mail as a Mixed-Mode Solution to General Public Survey Challenges in the United States
 Web+Mail as a Mixed-Mode Solution to General Public Survey Challenges in the United States Don A. Dillman and Benjamin Messer* Social & Economic Sciences Research Center Washington State University Pullman,
Swedish telecommunications market first six months 2018
 Memorandum Date Our reference Page 19-11-2018 1(13) Avdelningen för samhällsfrågor Karin Fransén 08-678 5781, 073-644 57 81 karin.fransen@pts.se Swedish telecommunications market first six months 2018
Excerpt Costa Rica: Liberalization Will More Than Double Mobile Subscribers by 2015
 Excerpt Costa Rica: Liberalization Will More Than Double Mobile Subscribers by 2015 This report is part of Pyramid Research s series of Latin America Country Intelligence Reports August 2010 Edition Jose
NEDAS San Francisco Symposium Colocated With The INCOMPAS Show: Fall 2017 Sponsorship Opportunities
 2017: The Year IoT Demands Infrastructure to be Reshaped Above & Below the Ground NEDAS San Francisco Symposium Colocated With The INCOMPAS Show: Fall 2017 Sponsorship Opportunities It is with great enthusiasm
THE REGIONAL MUNICIPALITY OF YORK
 THE REGIONAL MUNICIPALITY OF YORK Committee of the Whole Report of the Executive Director, Corporate and Strategic Planning ECONOMIC DEVELOPMENT ACTION PLAN UPDATE - YORK REGION BROADBAND STRATEGY PROGRESS
Future of Broadband in Africa Christoph Stork, Enrico Calandro, Ranmalee Gamage
 Future of Broadband in Africa Christoph Stork, Enrico Calandro, Ranmalee Gamage Approach Nationally representative household and individual surveys in 12 African countries (Census Sample Frame) Basket
fibre loop extensions to help mitigate the impact of accidental fibre cuts in rural and remote areas.
 1 2 3 Eligible recipients under the program include entities or groups of entities that are incorporated in Canada, that operate Internet infrastructure, and that meet the assessment criteria. Entities
Before the FEDERAL COMMUNICATIONS COMMISSION WASHINGTON, DC 20554
 Before the FEDERAL COMMUNICATIONS COMMISSION WASHINGTON, DC 20554 In the Matter of ) ) Inquiry Concerning the Deployment of Advanced ) GN Docket No. 12-228 Telecommunications Capability to All Americans
CTIA s Wireless Metrics Reports
 CTIA s Wireless Metrics Reports Bobby Franklin Executive Vice President CTIA-The Wireless Association April 30, 2009 Background on Semi-Annual Survey CTIA s survey began in January 1985 focusing on operational
Comparison of 477 and California Broadband Map Data
 Comparison of 477 and California Broadband Map Data David Reed, CU Boulder and David Espinoza, CSU Chico Workshop on Internet Economics December 13, 218 FCC Aware of Form 477 Deficiencies Data not independently
Quick Guide to American FactFinder
 Quick Guide to American FactFinder 1. Search Terms... 2 2. Finding Neighborhoods... 6 3. Downloading the Tables 13 4. Interpreting the Numbers... 18 Introduction The American FactFinder is a useful online
FCC Form Carrier Annual Reporting Data Collection Form
 - Carrier Annual Reporting Page 1 Contact Name: Person USAC should contact with questions about this data Contact Telephone Number: Number of the person identified in data line Contact Email Address: Email
FTTx and BPL: Analysis and Outlook
 Synopsis Yearly Growth of BPL Subscriber: 2007-2011 FTTx and BPL: Analysis and Outlook analyzes market trends and significant events that will impact FTTx and BPL deployments over the next five years.
State of Numbers of Subscribers to Telecommunications Services
 February 16, 2009 State of Numbers of s to Telecommunications Services (As of the end of December ) As mandated by the Rules for Reporting on Telecommunications Business (MPT Ordinance No. 46 of 1988),
Broadband coverage in Europe in 2012:
 Broadband coverage in Europe in 2012: Guide for France Prepared by: Laura Kell Date: 27 November 2012 Version: 1.1 Point Topic Ltd 73 Farringdon Road London EC1M 3JQ, UK Tel. +44 (0) 20 3301 3303 Email
Converged Infrastructure Matures And Proves Its Value
 A Custom Technology Adoption Profile Commissioned By Hewlett-Packard May 2013 Introduction Converged infrastructure (CI) solutions have been widely adopted by a range of enterprises, and they offer significant
Residential Femtocells: Impact on Carrier Grades. Market Brief Second Quarter, 2012
 Residential Femtocells: Impact on Carrier Grades Market Brief Second Quarter, 2012 Residential Femtocells: Impact on Carrier Grades A Market Brief Published Second Quarter, 2012 Version 1.0 Report Number:
Electric Lightwave FAQ
 Electric Lightwave FAQ CORPORATE STRUCTURE Q: Why is the Company making these changes? How will these changes impact the corporate structure? Over the past 18 months, Electric Lightwave has built a strong
Traditional and Enhanced Listing for Probability Sampling
 University of Mannheim From the SelectedWorks of Stephanie Eckman 2002 Traditional and Enhanced Listing for Probability Sampling Colm O'Muircheartaigh, University of Chicago Stephanie Eckman, University
General Subscriber Service Tariff: A Original Page Original Page
 BELLSOUTH BellSouth Telecommunications, Inc. Jerry D. Hendrix 150 South Monroe Street Vice President Suite 400 Regulatory Relations Tallahassee, Florida 32301 Jerry.hendrix@bellsouth.com Phone: (850) 577-5550
STATISTICS AND TARIFF INFORMATION IN TELECOM SECTOR AS OF SEPTEMBER 2013
 STATISTICS AND TARIFF INFORMATION IN TELECOM SECTOR AS OF SEPTEMBER 2013 Prepared by: Economic and Market Analysis Section CONTENTS I. preliminary remarks... 4 II. summary... 4 1. MOBILE AND FIXED TELEPHONE
AVAILABILITY OF ADVANCED TELECOMMUNICATIONS CAPABILITY IN PUBLIC BODIES YEAR 2008 REPORT. Economic Research and Financial Analysis Division
 AVAILABILITY OF ADVANCED TELECOMMUNICATIONS CAPABILITY IN PUBLIC BODIES YEAR 2008 REPORT Economic Research and Financial Analysis Division Public Utility Commission of Oregon November 2008 Page 1 Availability
June 20, Marlene Dortch Secretary Federal Communications Commission th St., SW Washington, DC 20554
 Mary L. Henze AT&T Services, Inc. Assistant Vice President 1120 20 th Street, NW, Suite 1000 Federal Regulatory Washington, D.C. 20036 Phone : 202 457-2041 E-Mail: mary.henze@att.com June 20, 2016 Marlene
The State of Wireless. NCSL Spring Forum 21 st Century Communications April 14, 2011
 The State of Wireless NCSL Spring Forum 21 st Century Communications April 14, 2011 Estimated Wireless Subscriber Connections Up More than 17 Million Year-Over-Year 350,000,000 300,000,000 250,000,000
Pay-TV services worldwide: trends and forecasts PAY-TV SERVICES WORLDWIDE: TRENDS AND FORECASTS
 RESEARCH FORECAST REPORT PAY-TV SERVICES WORLDWIDE: TRENDS AND FORECASTS 2017 2022 MARTIN SCOTT and ROMAN ORVISKY Analysys Mason Limited 2018 About this report This report provides: forecasts for the number
The Growth and Evolution of CDMA2000 1xEV-DO
 The Growth and Evolution of CDMA2000 1xEV-DO February 2004 CDMA2000 1xEV-DO The fastest mobile wireless networks in the world, from Seoul to San Diego and Sao Paolo, are powered by CDMA2000 1xEV - DO
Broadband 101. Broadband Technologies Overview & What s happening in South Central Minnesota
 Broadband 101 Broadband Technologies Overview & What s happening in South Central Minnesota Bill Coleman bill@communitytechnologyadvisors.com 651-491-2551 Broadband Trends Broadband at the FCC Recently
Telecommunications market data tables Q2 2015
 Telecommunications market data tables Q2 2015 1 Market monitor 2 Fixed telecoms market data tables 3 Mobile telecoms market data tables Published: 12 November 2015-1 - 1. Market monitor In the following
TFI Broadband Forecast Update
 Copyright 2013, Technology Futures, Inc. 1 TFI Broadband Forecast Update Lawrence Vanston, Ph.D. President, Technology Futures, Inc. lvanston@tfi.com 13740 Research Blvd., Bldg. C-1 Austin, Texas 78750
The Value of Content at the Edge
 The Value of Content at the Edge Executive Summary The way we use the Internet has changed, and the result has been exploding traffic growth that is projected to increase at a 30 to 50 percent compound
Hitachi Completes Transfer of Hard Disk Drive Business to Western Digital
 FOR IMMEDIATE RELEASE Contact: Japan: Hajime Kito Hitachi, Ltd. +81-3-5208-9323 hajime.kito.qy@hitachi.com Hitachi Completes Transfer of Hard Disk Drive Business to Western Digital Tokyo, March 9, 2012
Expert Group on Telecom/ICT Indicators (EGTI) Hammamet, Tunisia, 15 November Summary and conclusions of the EGTI work in 2017
 Hammamet, Tunisia, 15 November Summary and conclusions of the EGTI work in 2017") Expert Group on Telecom/ICT Indicators (EGTI) Hammamet, Tunisia, 15 November 2017 Summary and conclusions of the EGTI work in 2017 1 Agenda items 1- Guidelines for fixed network coverage indicators 2-
Expert Group on Telecom/ICT Indicators (EGTI) Hammamet, Tunisia, 15 November 2017 Summary and conclusions of the EGTI work in 2017 1 Agenda items 1- Guidelines for fixed network coverage indicators 2-
Public Consultation on the BEREC Work Programme 2018
 BoR PC06 (17) 07 Public Consultation on the BEREC Work Programme 2018 EOLO SpA response INTRODUCTION EOLO welcomes the draft BEREC Work Programme 2018 for its forward-looking character, and thanks BEREC
PeerApp Case Study. November University of California, Santa Barbara, Boosts Internet Video Quality and Reduces Bandwidth Costs
 PeerApp Case Study University of California, Santa Barbara, Boosts Internet Video Quality and Reduces Bandwidth Costs November 2010 Copyright 2010-2011 PeerApp Ltd. All rights reserved 1 Executive Summary
High-Level Testing Principles. Annex 5 to the Voluntary Codes of Practice on Residential and Business Broadband Speeds
 Annex 5 to the Voluntary Codes of Practice on Residential and Business Broadband Speeds Publication Date: 6 October 2017 1. Introduction 1.1 This document is an annex to the Voluntary Codes of Practice
Geek Speak. Can you keep up with internet terminology? April 24, 2018
 Geek Speak Can you keep up with internet terminology? April 24, 2018 Agenda 1. Fun Facts 2. Definitions 3. Planning for your event 4. Questions to ask your venue 5. Calculating your networking needs Fun
TMT intelligence The growing appeal of fixed wireless access as an alternate fiber-class access method
 Ovum TMT intelligence The growing appeal of fixed wireless access as an alternate fiber-class access method Understanding the advantages of mmwave FWA for enterprise-class services CONTENTS ABOUT THE AUTHOR
COMPETITIVE TELECOMMUNICATIONS PROVIDERS: ANNUAL REPORT TO THE LEGISLATURE Staff Report. Public Utility Commission of Oregon
 COMPETITIVE TELECOMMUNICATIONS PROVIDERS: ANNUAL REPORT TO THE LEGISLATURE 2014 Staff Report Public Utility Commission of Oregon December 2014 EXECUTIVE SUMMARY ORS 759.050(9) requires the Public Utility
10th Tranche Development Account Programme on Statistics and Data (DA10)
") 10th Tranche Development Account Programme on Statistics and Data (DA10) United Nations Statistics Division Regional Seminar on the Implementation of the SDG Indicators 3-4 April 2017, Santiago, Chile
10th Tranche Development Account Programme on Statistics and Data (DA10) United Nations Statistics Division Regional Seminar on the Implementation of the SDG Indicators 3-4 April 2017, Santiago, Chile
Agency Information Collection Activities; Proposed Information Collection; Comment Request; Broadband Availability Data
 This document is scheduled to be published in the Federal Register on 10/25/2018 and available online at https://federalregister.gov/d/2018-23296, and on govinfo.gov BILLING CODE: 3510-60-P DEPARTMENT
I D C T E C H N O L O G Y S P O T L I G H T
 I D C T E C H N O L O G Y S P O T L I G H T Making the Right Broadband Choice for Your Business October 2016 Adapted from Market Analysis Perspective: U.S. SMB Telecom, Broadband, and Video, 2016 by Matt
3. Current Broadband Conditions in Yolo
 3. Current Broadband Conditions in Yolo A. Broadband & Availability in Yolo Broadband in Yolo Per FCC Data Figure 3.1 illustrates the most recent residential broadband penetration data, as reported in
Deploying All-Optical Access Networks
 THE FUTURE IS ACCESS... TM JOIN THE REVOLUTION TM Deploying All-Optical Access Networks Architectures & Implications Ethernet in the First Mile - July 2001 IEEE 802.3 - Seattle, Washington July 11, 2001
Analysis of Housing Square Footage Estimates Reported by the American Housing Survey and the Survey of Construction
 Analysis of Housing Square Footage Estimates Reported by the American Housing Survey and the Survey of Construction Angela Delano U.S. Census Bureau 4600 Silver Hill Road Washington DC 20233 angela.lynn.delano@census.gov
Mapping Maryland s Broadband Inventory: The Maryland Broadband Mapping Initiative. David Sides Center for GIS at Towson University
 Mapping Maryland s Broadband Inventory: The Maryland Broadband Mapping Initiative David Sides Center for GIS at Towson University Maryland Broadband Mapping Initiative Funded Under and By: American Reinvestment
PROPONENT TESTIMONY BEFORE THE HOUSE PUBLIC UTILITIES COMMITTEE HB402 Tuesday, January 23, 2018 JOSH MOTZER PUBLIC POLICY DIRECTOR CENTURYLINK
 PROPONENT TESTIMONY BEFORE THE HOUSE PUBLIC UTILITIES COMMITTEE HB402 Tuesday, January 23, 2018 JOSH MOTZER PUBLIC POLICY DIRECTOR CENTURYLINK Chairman Cupp, Vice-Chairman Carfagna, Ranking Member Ashford
Future of Broadband in Africa Dr Christoph Stork. researchictsolutions
 Future of Broadband in Africa Dr Christoph Stork researchictsolutions Approach Nationally representative household and individual surveys in 12 African countries (Census Sample Frame) Basket methodology
Financial Results Presentation Q1 FY15: Quarter ended 30 June August 2014 Chua Sock Koong Group CEO
 Financial Results Presentation Q1 FY15: Quarter ended 30 June 2014 14 August 2014 Chua Sock Koong Group CEO 1 Forward looking statement important note The following presentation contains forward looking
Access and Entertainment Services in U.S. Broadband Households
 Consumer Analytics Team Yilan Jiang, Manager of Consumer Research David Mitchel, Research Analyst SYNOPSIS Broadband and pay TV remain cornerstones of U.S. operator services. Yet market trends and potential
2 ICT in Aruba introduction Central Bureau of Statistics Aruba
 ICT in Aruba 21 2 ICT in Aruba 21 2 introduction Central Bureau of Statistics Aruba TABLE OF CONTENT INTRODUCTION... 5 COMPUTERS... 5 REGION... 5 TYPE OF HOUSEHOLD... 7 HOUSEHOLD SIZE AND AVERAGE AGE OF
ITU Regional ICT Indicators Workshop for Africa. IDI 2018 Access Sub-index and indicators
 ITU Regional ICT Indicators Workshop for Africa Lilongwe, Malawi 20 21 March 2018 IDI 2018 Access Sub-index and indicators ICT Data and Statistics Division Telecommunication Development Bureau International
Local Telecommunications Competition Survey 2017 Annual Report
 Local Telecommunications Competition Survey 2017 Annual Report Report to the 2018 Oregon Legislature January 02, 2018 Intentionally Left Blank 2 Table of Contents Table of Contents... 3 Executive Summary...
AMERICAN-ARAB ANTI-DISCRIMINATION COMMITTEE INTERNET CONNECTION
 AMERICAN-ARAB ANTI-DISCRIMINATION COMMITTEE INTERNET CONNECTION EXPERT CHOICE MODEL JAWAD ABULHASAN RYAN HACKETT UPGRADING ADC S INTERNET CONNECTION ABSTRACT ADC has decided that their Internet connection
STATE OF THE NETWORK STUDY
 10TH ANNUAL STUDY 2017 1 EXECUTIVE SUMMARY The Tenth Annual State of the Network Global Study focuses a lens on the network team s role in security investigations. Results indicate that 88 percent of network
How to establish an ICT Indicator database in Indonesia 29 October 2 November 2007 Jakarta, Indonesia ITU Telecommunication/ICT Indicators
 How to establish an ICT database in Indonesia 29 October 2 November 2007 Jakarta, Indonesia ITU Telecommunication/ICT s Esperanza C. Magpantay Market Information and Statistics Division Bureau for Telecommunication
2013 North American Software Defined Data Center Management Platforms New Product Innovation Award
 2013 North American Software Defined Data Center Management Platforms New Product Innovation Award 2013 New Product Innovation Award Software Defined Data Center Management Platforms North America, 2013
Telecommunications RFP 02. for. North Country Telemedicine Project (NCTP) Network
 Network") Telecommunications RFP 02 for North Country Telemedicine Project (NCTP) Network TABLE OF CONTENTS 1. PROJECT OVERVIEW 2. PROJECT ADMINISTRATION 3. TECHNICAL REQUIREMENTS 4. PROJECT MANAGEMENT REQUIREMENTS
Telecommunications RFP 02 for North Country Telemedicine Project (NCTP) Network TABLE OF CONTENTS 1. PROJECT OVERVIEW 2. PROJECT ADMINISTRATION 3. TECHNICAL REQUIREMENTS 4. PROJECT MANAGEMENT REQUIREMENTS
CONNECTED CONSUMER SURVEY 2017: TV AND VIDEO IN EUROPE AND THE USA
 analysysmason.com RESEARCH SURVEY REPORT CONNECTED CONSUMER SURVEY 2017: TV AND VIDEO IN EUROPE AND THE USA MARTIN SCOTT About this report This report focuses on aspects of Analysys Mason s Connected Consumer
Mobile Devices in U.S. Consumer Households. A Market Study October 2008
 Mobile Devices in U.S. Consumer Households A Market Study October 2008 Mobile Devices in U.S. Consumer Households Market Study October 2008 Version 1.0 Report Number: 102008-03 igr 12400 W. Hwy. 71, Suite
MANAGEMENT S DISCUSSION AND ANALYSIS OF FINANCIAL CONDITION AND RESULTS OF OPERATIONS
 MANAGEMENT S DISCUSSION AND ANALYSIS OF FINANCIAL CONDITION AND RESULTS OF OPERATIONS TELEFONICA CELULAR DEL PARAGUAY S.A. As at and for the three month period ended 31 March 2018 1. Overview We are a
Strategic Models for State & Regional Broadband Development. Internet2 Fall Member Meeting Raleigh, NC 5 October 2011
 Strategic Models for State & Regional Broadband Development Internet2 Fall Member Meeting Raleigh, NC 5 October 2011 The Need for Partnerships! How advanced networking has been organized from a traditional
Illinois Broadband Opportunity Partnership (IBOP) Monthly Summary. January 2014
 Monthly Summary. January 2014") Illinois Broadband Opportunity Partnership (IBOP) Monthly Summary January 2014 Summary of all IBOP Projects January 2014 Projects complete: 9 of 11 Miles of Conduit Buried: 2,396 (Target was 2,288) Miles
Illinois Broadband Opportunity Partnership (IBOP) Monthly Summary January 2014 Summary of all IBOP Projects January 2014 Projects complete: 9 of 11 Miles of Conduit Buried: 2,396 (Target was 2,288) Miles
2018 HELO Leadership Retreat. The Economic Impact of the Digital Divide on the Latino Community
 2018 HELO Leadership Retreat The Economic Impact of the Digital Divide on the Latino Community on the Latino Community Speakers: Joseph Torres, Senior Director of Policy & Engagement, Free Press David
Broadband Availability and Adoption: A State Perspective
 Broadband Availability and Adoption: A State Perspective Prepared for the Oklahoma Corporation Commission Sherry Lichtenberg, Ph.D. Principal Researcher - Telecommunications October 11, 2017 Today s discussion
Dynamic Time Metered Delivery (DTMD): Potential Effect on the Goals of the Federal Communications Commission's National Broadband Plan!
: Potential Effect on the Goals of the Federal Communications Commission's National Broadband Plan!") Dynamic Time Metered Delivery (DTMD): Potential Effect on the Goals of the Federal Communications Commission's National Broadband Plan! Jess Posey (SDM ʻ10)! Advisors: James Utterback! Frank Fields! April
Dynamic Time Metered Delivery (DTMD): Potential Effect on the Goals of the Federal Communications Commission's National Broadband Plan! Jess Posey (SDM ʻ10)! Advisors: James Utterback! Frank Fields! April
COMMENTS OF INFORMATION TECHNOLOGY AND INNOVATION FOUNDATION. Richard Bennett
 Before the Federal Communications Commission Washington, D.C. 20554 In the Matter of: ) ) Cellco Partnership D/B/A Verizon Wireless, ) SpectrumCo, LLC and Cox TMI Wireless, LLC ) WT Docket No. 12-4 ) For
2019 MARKETING OPPORTUNITIES.
 2019 MARKETING OPPORTUNITIES info@cybersecurity-insiders.com CYBERSECURITY MARKETING & MEDIA Cybersecurity Insiders is a US centric online community of information security professionals representing a
Industry Update. View of the WISP Market. January, 2018
 Industry Update View of the WISP Market January, 2018 Who We Are Clearfield is a leading provider of fiber optic management and connectivity solutions Our patented technology significantly reduces the
NTCA 2016 WIRELESS SURVEY REPORT
 NTCA 2016 WIRELESS SURVEY REPORT January 2017 DISCLAIMER: Data from the survey has been presented as reported. To get more information on this report please contact Rick Schadelbauer at NTCA (703-351-2019,
Leveraging the Regulatory Data Into Tomorrow s Environments. Sponsored by the Associate Member Committee
 Leveraging the Regulatory Data Into Tomorrow s Environments Sponsored by the Associate Member Committee Discussion Participants Matt Gilbert (Moderator) Mapcom Systems Eric Cramer Wilkes Communications,
Research Report: Voice over Internet Protocol (VoIP)
") Research Report: Voice over Internet Protocol (VoIP) Statement Publication date: 26 July 2007 Contents Section Page 1 Executive Summary 1 2 Background and research objectives 3 3 Awareness of VoIP 5 4
Research Report: Voice over Internet Protocol (VoIP) Statement Publication date: 26 July 2007 Contents Section Page 1 Executive Summary 1 2 Background and research objectives 3 3 Awareness of VoIP 5 4
The Case for Virtualizing Your Oracle Database Deployment
 June 2012 The Case for Virtualizing Your Oracle Database Deployment Much has been written about the benefits of virtualization over the last few years. Hypervisor software promises to revolutionize the
Assessing Broadband in America. By Phil Heidenreich
 Assessing Broadband in America By Phil Heidenreich In the American Recovery and Reinvestment Act passed by Congress and signed into law by President Obama earlier this year, a provision was made for a
P.O BOX 7289 KIGALI, Tel: , Fax: Website:
 P.O BOX 7289 KIGALI, Tel: +250 252584562, Fax: +250 252584563 Email: info@rura.rw Website: www.rura.rw GUIDELINES N.../GL/UAS-ICS/ RURA/017 OF.../.../2017 ON MINIMUM BANDWIDTH FOR BROADBAND INTERNET CONNECTIVITY
Copyright 2015, Technology Futures, Inc. 1
 Copyright 2015, Technology Futures, Inc. 1 Broadband Access in America: Status, Forecasts, and Politics Lawrence Vanston, Ph.D. President, Technology Futures, Inc. lvanston@tfi.com International Institute