Incorta Analytics. User Guide. Release 3.3
|
|
|
- Alexina Golden
- 5 years ago
- Views:
Transcription

1 Incorta Analytics User Guide
2 INCORTA ANALYTICS USER GUIDE, RELEASE 3.3 COPYRIGHT 2018, INCORTA AND/OR ITS AFFILIATES. ALL RIGHTS RESERVED. INCORTA IS A REGISTERED TRADEMARK OF INCORTA INCORPORATION AND/OR ITS AFFILIATES. OTHER NAMES MAY BE TRADEMARKS OF THEIR RESPECTIVE OWNERS. This software and related documentation are provided under a license agreement containing restrictions on use and disclosure and are protected by intellectual property laws. Except as expressly permitted in your license agreement or allowed by law, you may not use, copy, reproduce, translate, broadcast, modify, license, transmit, distribute, exhibit, perform, publish or display any part, in any form, or by any means. Reverse engineering, disassembly, or decompilation of this software, unless required by law for interoperability, is prohibited. The information contained herein is subject to change without notice and is not warranted to be error-free. If you find any errors, please report them to us in writing. If this software or related documentation is delivered to the U.S. government or anyone licensing it on behalf of the U.S. government, the following notice is applicable: U.S. GOVERNMENT RIGHTS Programs, software, databases, and related documentation and technical data delivered to U.S. government customers are "commercial computer software" or "commercial technical data" pursuant to the applicable federal acquisition regulation and agency-specific supplemental regulations. As such, the use, duplication, disclosure, modification, and adaptation shall be subject to the restrictions and license terms set forth in the applicable government contract, and, to the extent applicable by the terms of the government contract, the additional rights set forth in far , Commercial computer software license (December 2007). This software is developed for general use in a variety of information management applications. It is not developed or intended for use in any inherently dangerous applications, including applications, which may create a risk of personal injury. If you use this software in dangerous applications, then you shall be responsible to take all appropriate fail-safe, backup, redundancy and other measures to ensure the safe use of this software. Incorta corporation and its affiliates disclaim any liability for any damages caused by use of this software in dangerous applications. This software and documentation may provide access to or information on content, products and services from third parties. Incorta corporation and its affiliates are not responsible for and expressly disclaim all warranties of any kind with respect to third party content, products and services. Incorta corporation and its affiliates will not be responsible for any loss, costs, or damages incurred due to your access to or use of third party content, products or services. Author: Ahmed Elkady Contributors: Matthew Halliday, Hichem Sellami, Mohamed Obide, Osama Elkady, Klaus Fabian, Ahmed Eltanahy, Mohamed El Prince
3 Contents Contents 3 About Incorta Analytics 6 Our Product 6 Our Philosophy 6 Organization of this Document 7 PART 1: Get Familiar with Incorta Analytics 8 What Type of User are You? 9 Consumer User 9 Analyze User 9 User Types and Permissions 10 Logging In 11 Functional Areas 13 Security 13 Data Sources & Data Files 13 Schemas 13 Content 13 Get Familiar with the Workspace 14 Elements of Your Workspace 14 Manage and Organize Your Workspace 16 Get Familiar with Dashboards 25 Insights 25 Visualizations 25 3
4 Tables 26 Key Performance Indicators 26 Data Analysis 27 Filter Data for Analysis 27 Types of Filters in Incorta Analytics 29 PART 2: Behind the Scenes 35 Data Management 36 Data Sources & Data Files 36 Data Sources 36 Schemas 44 The Schemas Page 44 The Schema Definition Page 45 The Table Details Page 45 Create a New Schema 51 Manage Schemas 55 Business Schemas 90 Overview 90 Using Business Schemas 91 Build a New Dashboard 117 Create a New Dashboard from the "Content" Page 118 Create a New Dashboard from within a Schema 119 Build and Edit Insights: The Analyzer 120 Insight Viewing Features 133 Filters: Attributes, Operators, and Values 144 Create Dashboard Filters 153 The Formula Builder 164 URL drill-down 166 4
5 Advanced Features 168 Base Table 168 Query Plan 178 Data Hub 181 Important Terms 181 Connect to Data Hub from external BI tools 182 Use Incorta as your BI tool with Data Hub 183 Share, send, or schedule a dashboard 186 Share a dashboard 186 Send a dashboard 187 Schedule a Dashboard 191 The scheduler and data alerts 194 Dashboard schedules 194 Schema schedules 195 Data Alerts 200 App. A: Build the Right Insight 205 What's an Insight 205 App. B: Formula Functions 217 App. C: Date Variables 236 App. D: Load Filter Syntax 238 The operators table 238 The functions table 240 The date variables table 241 5
6 About Incorta Analytics 1 Our Product Incorta Analytics is a seamless, end-to-end analytical warehouse solution engineered for simple and powerful real-time analysis of massive volumes of data. High-impact graphical representations transform raw data from arcane and inaccessible to clear and meaningful, delivering unprecedented insight into patterns, trends, key performance indicators and their causality. Unification of data sources into a single and secure source of truth ensures that all users at all levels of the organization analyze, strategize, and collaborate around the latest and most relevant information. The Incorta Analytics platform removes the dependency on star schemas, preaggregation, complex ETL processes, and a large data team. With Incorta s cloud technologies and mobile-first design, even a mobile user can merge external real-time data sets like weather data with large-volume business data, and then make informed time-sensitive decisions based on the results. Our Philosophy Incorta Analytics is driven by the belief that data analytics should not be complex or frustrating. We are passionate about delivering full analytics for business users with elegance and efficiency. With over one hundred years of combined experience in developing applications, analytics and reporting solutions for enterprise software firms including Oracle, Siebel, IBM & Microsoft, we have stepped out of the old world of data analytics into a new one we re building ourselves. At Incorta, we are not just passionate about analytics -- We are passionate about our world. We want to make a positive impact beyond the direct role of our product in the business sector. At key milestones in the past, we have celebrated by sharing our success through giving away gifts like meals for hungry children in Honduras, offering our software at reduced rates for startups, and free of charge for non-profits, in the hope that our sharing will help others solve some of the world s most pressing issues. 6
7 Organization of this Document 2 The information in this document is divided into two parts: Part One, Get Familiar with Incorta, develops your understanding of the look and feel of the available capabilities and features. This section describes the basic end-user experience, and refers the reader to Part Two for details about the implementation. In Part Two, Behind the Scenes, you will find details about how to implement the Dashboards, Insights, Filters, and other features described in Part One. The section begins with Data Management as a foundation, and moves through the design and implementation of Dashboards and the Insights they contain. 7
8 PART 1: Get Familiar with Incorta Analytics 8
9 What Type of User are You? 3 Your role in the organization and the permissions you have been given determine what functions you can perform in the Incorta Analytics application. This guide is written for the Analyze User and Incorta Analytics administrator. Consumer User A Consumer User can view Dashboards and drill down into the details of the data to gain valuable business insights. A Consumer User can also share and export Dashboards. This user cannot create, copy, or edit, Dashboards, Insights, or Schemas. They have no access to the datasources or data files in Incorta Analytics. The user should contact their administrator to request new dashboards or Insights, or changes the structures underlying the Insights. The administrator cannot assign additional permissions to a user working on a Consumer User license. Analyze User An Analyze User has access to the Analyzer tool to build Insights, can view and drill down on dashboards and Insights, and may be given other permissions as well. The Analyzer allows the user to develop Insights based on existing schemas and data sources by relating data elements to each other and applying appropriate filters. This user also customizes the appearance of the Insights by positioning them on the Dashboard and by choosing table and chart styles. The Incorta Analytics administrator may assign additional roles or permissions for an Analyze user. 9
10 User Types and Permissions Dashboard Function Consumer Analyzer View Share Favorite Export Create Dashboards Create Insights Edit Copy Move Delete 10

11 Logging In You can use an ipad or internet browser to access the Incorta Analytics application. If you are using a browser, enter or follow the URL provided by your organization to navigate to the login screen. You can use Chrome, Safari, Firefox, or Internet Explorer. If you are using an ipad, tap on the Incorta app to navigate to the login screen. In the login screen: 1. Provide the tenant name (ask the administrator for this info). 2. Enter your username, and password, which is case-sensitive. Note: The version number and release date are displayed at the bottom lefthand side of the screen. If you forgot your password: 1. Click Forgot?. 2. Provide the Tenant, Username, and information. 11

12 3. Click Send Password. 12
13 Functional Areas On the left-hand side of the screen, you can navigate between different functional areas in the Incorta Analytics application. Only items in the left-hand side menu, for which you have permission, will be displayed. For example, you may not have permission to manipulate users, groups, and roles in the Security area. In this case, you would not see the Security icon. Security In the Security area, users with the necessary permissions can define and maintain users, groups, and roles. For more information, see the "Management Security" section in the Incorta Analytics Security Management Guide. Data Sources & Data Files This area is the interface for connecting data sources and data files to Incorta Analytics for data ingestion. This is typically the role of the schema developer, but may be performed by an end user who has the Analyze User role. For more information see Data Management. Schemas The Schemas area is used by an Analyze User to define and maintain schemas and session variables. For more information, see Data Management. Content The Content page gives you access to Folders and Dashboards. The "My Content" tab contains only the folders and dashboards that you own. The "Shared Content" tab contains only the content that has been shared with you by another user. Finally, the "All Content" tab displays the folders and dashboards that you both own and have access to (i.e. shared with you by another user). 13
14 Get Familiar with the Workspace After logging in, the first screen you see is the "Content" page -- your portal to the application. To return to this page from anywhere in the application, click the Incorta logo in the upper left-hand corner of the screen. Elements of Your Workspace In the Content page, there are three tabs at the top of the screen, as shown in the previous image. Select the tab that corresponds to the type of content you would like to display. The "All Content" tab displays all the content that you have access to, including what you own and what s shared with you. The "Shared Content" tab displays what is shared with you. The "My Content" tab displays only the content that you own. Folders and Dashboards The main body of the "Content" page is divided into Folders and Dashboards. Click the action menu (piled horizontal dashes) corresponding to a folder or dashboard to customize your workspace. 14
15 The Search Box The search box at the top center of the screen is context-aware. It knows, for instance, that when you are in your workspace (i.e. Content page), you would be looking for Dashboards and Folders, not for rows of data. When you are inside a specific Dashboard, the search box returns results pertaining only to that dashboard, and that has not already been filtered out. This smart function limits the results list as you type, so you find the most relevant match quickly. Add an Object The "+" icon in the upper right-hand corner of the screen is a context-aware button. Where available, clicking it allows you to add the object appropriate for where you are. For example, from the "Content" page, it allows you to create a folder, or create/import a dashboard to your Workspace. From the "Schemas" page, it allows you to add or import schemas. Account Access The user account icon in the upper right-hand corner of the screen displays the current user information and allows users to: 1. View and edit profile: Change your password and image. Set your language, location, and date and time preferences. 2. Log out of the application. 15
 page in the root folder, or create them from within another folder.")
16 Manage and Organize Your Workspace This section contains information about organizing the workspace, including creating, moving, renaming, copying, deleting, sharing, and exporting content. Create a new folder/dashboard You can choose whether to create a folder/dashboard from the "Content" (landing) page in the root folder, or create them from within another folder. You can also import a dashboard into your workspace. To create a new folder/dashboard in the root folder: 1. Navigate to the "Content" page. 2. Click the "+" icon in the upper right-hand corner of the screen. 3. Select "Create Folder", "Create Dashboard", or "Import Dashboard" from the drop-down menu. To create a new folder/dashboard from within another folder: 1. Navigate to the parent folder. 2. Click the "+" icon in the upper right-hand corner of the screen. 3. Select "Create Folder", "Create Dashboard", or "Import Dashboard" from the drop-down menu. Import a Dashboard Incorta Analytics supports the import of data in a.xml format. In order to import a dashboard, its schema, including tables and columns, must match the schema 16
17 into which it is imported. Users can import a dashboard whether from the content page or from within a folder. 1. Click the "+" icon and select Import Dashboard. 2. Click Select from your PC. 3. Select a dashboard to import. 4. Click Open. NOTE: If there is a naming conflict due to the existence of a dashboard with the same name, you will be prompted to go back and either rename the imported Dashboard with a unique name, or check the "Overwrite" checkbox to replace the existing dashboard. Actions for existing folders and dashboards There are a few actions you can perform with existing folders and dashboards to help you organize your workspace and export or share them with others. You will notice that every dashboard or folder tile contains three piled bars to click and access the action menu. You will notice a small difference in the action menus for folders and dashboards, as dashboard actions are not quite the same as folder actions. You can share, move, rename, or delete a folder. 17
18 Not only can you perform the folders actions for dashboards, you can also copy or export a dashboard, from the dashboards action menu. 18
19 Move objects in a folder To move a folder or dashboard in an existing (parent) folder: 1. Locate the object you want to move. 2. Click on the corresponding three piled bars, the action menu opens. 3. Click on Move. 4. Select the parent folder where you want to place the current object. Rename Folders and Dashboards 1. Locate the object you want to rename. 2. Click on the corresponding three piled bars, the action menu opens. 3. Click on Rename. 4. Type a new name in the name field. 5. Click Rename. 19
20 6. Click Done. Copy a Dashboard Note: Folders cannot be copied. You can choose whether to Copy a dashboard from the content page or Copy a dashboard from within. NOTE: If you do not select a destination folder, the copied dashboard will be placed in the root folder (content page), and the dashboard will be appended with Copy. Additional copies will be appended with numbers (e.g. Copy2 ), according to the number of existing copies. Copy a dashboard from the content page This feature enables users to copy dashboards from the content page. 1. Locate the object you want to copy. 20
21 2. Click on the corresponding three piled bars, the action menu opens. 3. Click Copy, a window opens to select a destination folder. 4. Select the destination folder where you want to paste the copied object. 5. Click Copy. Copy a dashboard from within This feature enables users to copy a dashboard from within the page of that dashboard, instead of having to return to the Content page. 1. Navigate to any Dashboard. 21

22 2. Click on the settings menu (gear icon) in the upper right-hand corner of the screen. 3. Select Copy from the drop-down menu. A window opens to select a destination folder. 22
23 4. Click Copy. Share Folders and Dashboards 1. Navigate to the object you want to share. 2. Click on the corresponding three piled bars. 3. Click on Share. 4. Type in the search box to select individual users or groups with whom to share. 5. Choose a permission level to the user or group. 6. The "Can Share" permission includes "Can View". 7. The "Can Edit" permission includes "Can Share" and "Can View". 8. Click Save. 23
24 Export Dashboards as.xml 1. Navigate to the dashboard you want to export. 2. Click on the corresponding three piled bars. 3. Click Export. 4. The.xml file will be exported to your computer. For importing a dashboard, see Import a Dashboard. Download Insights 1. Open the Dashboard where the Insight is located. 2. Click on the download icon in the upper right-hand corner of the Insight.. 3. Select either "Download CSV" or "Download XLSX". Delete Folders and Dashboards 1. Navigate to the object you want to delete. 2. Click on the corresponding three piled bars. 3. Confirm the action to delete the object. 4. Click Delete. 24

25 Get Familiar with Dashboards A dashboard is a screen or page that displays data Insights and visualizations. The contents of a dashboard are defined by an Analyze user. For information about designing dashboard contents see Data Management to learn about the underlying data structures, and then see Build and Edit Insights: The Analyzer. Insights In Incorta Analytics, an Insight refers to any component representing data in a dashboard. There are four types of Insights, any or all of which can be placed on a single dashboard: Visualizations (charts), Tables, Key Performance Indicators (KPI)/Highlights and Gauges. Visualizations A Visualization presents data in an intuitive graphical form such as a pie chart, line graph, or bar chart. Incorta creates elegant, feature-rich charts and graphs. 25
26 Tables Incorta Analytics provides a wide and flexible selection of tables, from simple row-column tables to pivot and summary tables that display complex relationships between dimensions. These tables can group data and make measurements using aggregate functions including Sum, Count, Average, Median, Maximum, and Minimum to make large amounts of data meaningful at a glance. Key Performance Indicators A Key Performance Indicator (KPI) Insight presents key data in the form of a single value to provide instant feedback on the state of the business. As the name suggests, a KPI is a measurement of performance for a business process. 26

27 Data Analysis 4 Filter Data for Analysis Incorta Analytics enables you to fully engage with your data at every level, from the broadest overview to the smallest detail. At a high level, Incorta Analytics Insights give overviews and summaries. As you explore your data, Insights help you focus on the details. Digging into the details is called drilling down on the data, and is done by applying one or more filters. In fact, every dashboard and every Insight is based on the application of filters that limit and structure the presentation of your data. This section describes how Incorta Analytics filters work. For information about creating and applying filters, see Build a New Dashboard. Concepts in Filtering The following concepts and definitions will help you understand and design Insights in Incorta Analytics. It is useful to think of filters in terms of a data table with rows, columns, and data. Familiarize yourself with the following concepts: Attribute: Any fact about or trait of a person, place or thing. For example, 27


28 attributes of a customer might include First Name, Last Name, Gender, and City. Attributes of a car might include its Make, Model, Color, and Mileage. Attributes of a Country could include Country Name, Capital City, and Population. Attribute Value: The value associated with an attribute for a specific person, place or thing. Values for the First Name attribute might include Sam, Jane, or Carlo. In the table above, Electronics, Hardware, etc. are attribute values for Category. Dimension: An attribute is used to structure data. In the table above, there are two dimensions: Category describes the category for which the values in that row apply. Year describes the year for which the values in that column apply. Category and Year are both attributes that are used to structure the table. Parameter: A limiting attribute value. For example, if you want to display only electronics-specific data, type "electronics" (the value of the Category attribute) as a parameter. Filter: A dimension plus a parameter equals a filter. The filter (Category = electronics) has a dimension of Category and a parameter of electronics. When the filter is applied, the table looks like this: You could also use 2009 and 2010 as filter parameters. The filter would read: (Year = 2009, 2010) and the table would look as shown below: By adding filter parameters, you can drill down into the details or narrow the scope of your data. You can apply as many filters as needed to get to the level of detail that you want. 28

29 No matter which parameters you choose, the dimensions will remain the same. "Electronics" is still in the "Category" dimension, and "2009" and "2010" are still in the "Year" dimension. Types of Filters in Incorta Analytics This section describes the types of filters available to users in Incorta Analytics. For information about creating these filters, see Build a New Dashboard and Build and Edit Insights: The Analyzer. Dashboard Applied Filter: A Dashboard Applied Filter is a permanent part of the dashboard. The filter is implicitly applied to all Insights in the dashboard, but is not shown at the top of the screen. To create a Dashboard Applied Filter, click on the gear icon in the upper right-hand corner of the dashboard. For more information, see Dashboard Applied Filters. Dashboard Runtime Filters: A Dashboard Runtime Filter is available to the end user in the Filters menu to the left of the search box. The filter may or may not have a default value, and may be optional or mandatory. Default Runtime Filters A Default Filter is a Dashboard Runtime Filter that is set to a value and active by default. It appears at the top of the dashboard when active. When not active, a default filter can be activated from the Filter menu to the left of the search box 29
30 at the top of the dashboard. Mandatory versus Optional Default Runtime Filters: A Default Runtime Filter may be optional (white background) for the user, meaning they can delete it, or mandatory (blue background), meaning they cannot view the dashboard without this filter applied. If the filter is of blue background and no X symbol appears in the filter label, the filter is mandatory. A Consumer or Analyze user can deactivate an Optional Default Runtime Filter while using the dashboard by clicking the X symbol on the filter label, and can be activated by selecting it from the Filter menu next to the search box at the top of the dashboard. Clicking "Remove All" will deactivate all Optional Default Runtime Filters. For a Mandatory Default Filter, the user can change or add parameters, but the filter must always have at least one parameter. Clicking Remove All will not remove mandatory filters. In the screenshot below, there are two Default Runtime Filters applied to the Dashboard. The Year filter is mandatory, but the Category filter is optional. Single vs. Multi-Select Default Runtime Filters: The Analyze User can choose to limit a Default Runtime Filter to a single parameter at a time or to allow multiple parameters. For a single-select filter, a new filter parameter replaces the previous one. For a multi-select filter, more than one parameter can be applied to the filter at the same time. A checkmark appears to the right of each selected value. Check or uncheck values as needed and click Filter in the upper right corner of the menu to apply your changes. 30

31 In the above figure, Year is a mandatory, multi-select filter while Category is an optional, single-select filter. For more information about creating Default Filters, see Build and Edit Insights: The Analyzer. Insight Definition Filter: An Insight Definition Filter is a permanent part of the Insight. It affects only the Insight for which it was created and it does not appear at the top of the Insight or dashboard. To create an Insight Definition Filter, click on Analyze at the bottom left corner of the Insight, and then on the filter icon in the upper right corner of the Analyzer. For more information, see Build and Edit Insights: The Analyzer. The title of the Dashboard or Insight should inform the user of the presence of any Definition Filters. For example, an Insight that was designed to show order data for female customers should have a title like Sales Orders for Female Customers. If the design filters to the current calendar year, an informative title might be Sales Orders for Female Customers, Year to Date. User Filters A User Filter is applied when a Consumer or Analyze User drills down in an Insight. In this example, the pie chart shows the percentage of revenue for the United States, by state. Note that there is a Defining Filter applied to this Insight: (Region = United States). A Consumer User cannot alter a Defining Filter, so even if the rest of the dashboard shows worldwide data, this Insight shows data only for the Region specified in the Defining Filter. 31
32 Note: Using the Back Button During Drill-Down When you drill down on an Insight, the browser s back button does not return you to the most recent step in the drill-down. To move upward through a drill-down path, click Remove Allto remove the filters shown at the top of the screen. Apply User Filters Across Dashboards When you apply a User filter to one Insight, the same filter is applied to each Insight on your dashboard. This is true for any User Filter, regardless of which filtering method you use. The following figure represents an example of a dashboard before applying a runtime filter across it. Filter Bookmark Filters can be bookmarked to be accessed later without having to repeat the filter selection process. Add a Bookmark Filter Once the filters are applied, you can add a bookmark filter by doing the following: 1. Click on the add-a-bookmark icon next to the applied filters at the top center of the screen, just under the search box. 2. When the "Add New Bookmark" window appears, enter a name for the new bookmark (e.g. New Bookmark). 3. Click Add. 32
33 Access a Bookmark Filter You can access the bookmark you created by clicking on the bookmark icon, to the left of the search box at the top center of the screen. Delete a Bookmark Filter To delete a bookmark filter: 1. Click on the bookmark icon to the left of the search box at the top center of the screen, to access the drop-down menu. 2. Click on Edit at the top left of the bookmark drop-down menu, a red circle will appear next to each bookmark. 3. Click on the red circle to the left of the bookmark you want to delete. Delete will appear to the right-hand side of the bookmark. 33
34 4. Click on Delete. 34
35 PART 2: Behind the Scenes 35
36 Data Management 5 This chapter describes how to set up and manage the data structures that underlie each dashboard and Insight you build, including data sources and files, schemas, and tables. Read this before attempting to build dashboards and Insights. Data Sources & Data Files This section describes how to browse connected data sources, define new ones, or browse and upload data files. Data Sources Data Sources are external databases or applications that you can connect to Incorta Analytics. The data sources supported by Incorta Analytics are: Apache Drill, Apache Hive, Box, Cassandra (Simba), Dropbox, Essbase, Google Drive, IBM DB2, Kafka, MySQL, Netezza, NetSuite, Oracle, PostgreSQL, Presto, RedShift, SalesForce, SAP Hana, SAP Sybase IQ, ServiceNow, SQL Server, SQL Server (jtds), Teradata, Vertica, and Zuora. Custom data sources are also supported. You can upload your custom JDBC library and provide its connection string and driver class to connect to your data. In order to load the data to the Incorta Analytics engine, you need to create a connection to your data source. To view a list of defined "Data Source" connections, go to the"data Sources" tab in the "Data Sources & Data Files" page. You can access this page from the menu on the left-hand side of the screen. 36
37 Creating a New Data Source Connection 1. Click the "+" symbol in the upper right-hand corner of the "Data Sources" page. The Add New Data Source dialogue window opens. 2. Click on "Select Database" in the "Database" field to choose a database type. 37
 located on any of the fore mentioned applications, select the one you want, Google Drive for example.")
38 a. If you do not want to connect to a file located on Google Drive, Box, or Dropbox, go to step 3. To connect to a file (data source) located on any of the fore mentioned applications, select the one you want, Google Drive for example. It is important to note that the "https" protocol must be enabled, which can be done during or post installation. b. If you have already configured Google Drive in the admin UI, go to step c. To connect for the first time, an authorization needs to be done in the admin UI (which can be accessed by the system admin at ADDRESS>:<PORT_NO>/incorta/admin). After logging in, go to Tenants > Tenant_Name > Miscellaneous to add the following parameters: Google Drive Client ID Google Drive Client Secret Note that changing any of above requires restarting Incorta. c. Click Authorize. A new browser will open to authorize you in the application portal using your address and password (which is not accessible by Incorta Analytics). 38
 is not handled in current version.")
39 d. Once authorized, click Select to locate the data source on Google Drive. Note: Ensure that file names inside the drives (Google, Box, and Dropbox) are UNIQUE. Handling Multiple files with same name (including recovering a deleted file on Google Drive/Box/Dropbox having the same name as an existing file) is not handled in current version. In Google drive, It allows to have multiple files with same name and this is not valid in incorta. In DropBox, Trial version, it is not allowed to have multiple files with same name. If you even deleted a file, and then uploaded another one with same name, the Trash is emptied automatically Known Issue: When a file is dropped or renamed in Google drive, the effect is not reflected immediately in Incorta. 3. Fill out the fields and click Add Data Source. 39
40 4. Click the Test Connection button. The connection test status window appears. 5. Click OK. Note: If you are using a custom JDBC driver that was not shipped with Incorta Analytics, place your driver in $INCORTA_HOME/server/lib/. 40
41 Modify Data Source Connection 1. Click on the data source name from the Data Sources list. 2. Modify the Data Source connection data and click Save Changes. 3. Click the Test Connection button. Test Data Source Connectivity Click the Test Connection button that corresponds to the data source to be tested. Delete Data Source 1. Select one or more data source(s) by checking the box to the left. An Actions menu will appear in the upper right-hand corner of the screen. 2. Choose Delete Selection from the menu. 3. Confirm that you want to delete the data source. Data Files Data Files is the place where you can upload data files directly from your computer. Upload a New Data File Incorta Analytics enables users to upload data files with a wide range of extensions (e.g. xlsx, csv, tsv, tab, txt, zip). Zipped files are unzipped automatically after the upload. Password-enabled Excel data files can also be uploaded, where developers would need to enter the password when creating a table based on this file. Additionally, administrators must enable this feature in the admin UI under "Tenant Configurations", download the Java Cryptography Extension (JCE) Unlimited Strength Jurisdiction Policy Files 8 from the Oracle website at: download html, and place the jar files in the "<INSTALLATION_ PATH>/server/lib" directory. To upload a data file to Incorta: 1. Go to the "Data Sources and Data Files" page. 2. Click on the "Data Files" tab. A list of uploaded data files appears. 41

42 3. Click the "+" symbol in the upper right-hand corner of the screen. The "New Data File" window appears. 4. Select a file to upload from your computer. Zipped files are unzipped automatically after the upload. Share a Data File 1. Navigate to the "Data Sources and Data Files" page. 2. Click on the name of the file to be shared. The Share Data File window opens. 3. Click on the "+" symbol in the upper right-hand corner. 4. Type in the search box to select individual users or groups with whom to share. 5. Select a permission level to assign to the user, or group. 42
43 6. Click Save. Update a Data File To update a Data File: 1. Upload a new version of the file you want to update with the same name. 2. Click Continue when you are prompted to replace the existing file. Delete a Data File 1. Select the data file(s) you intend to delete. An Actions menu appears in the upper right-hand corner of the screen. 2. Select "Delete Selection" from the drop-down menu. 3. Click Delete to confirm that you want to delete the data file. 43
44 Schemas A schema is a collection of tables that provide the underlying structure for a dashboard. This structure must be created before dashboards and Insights can be designed. The Schemas Page To begin, you should be familiar with the "Schemas" page, which displays all the schemas that exist in your Incorta Analytics Server. In the Schemas Page, you can sort any column (except for the "Permission" column) by clicking the header of that column. Notice a small arrow appearing next to the header you click on to indicate the sorting column and direction (upward/downward). The "Schema" column contains the name of each schema. Click directly on a schema name in this column to view or modify its definition, including tables, columns, filters, and joins. For more information on defining a schema structure, see Create a New Schema. The "Status" column indicates whether the schema s data is loaded and current. If an exclamation mark appears in this column, it means that the schema s data needs to be loaded. For more information, see Load Data. The "Permission" column lists the permission granted for the logged-in user for each schema. The "Owner" column contains the name of the owner for each of the listed schemas. "Last Load Status" displays the timestamp from the most recent data load, or a message indicating that the data needs to be loaded. To view a schema loading activities and type (full/incremental), hover over that schema and click Details. For more information, see Load Data. 44
45 "Memory Used" indicates the size of the schema including all of its data and measures after the data is loaded into the schema. "Total Memory Used" in the header bar indicates memory consumed by all schemas for which data is loaded. Use the checkboxes to access the schema settings, export, or delete one or more schemas. When you check a box, the "Actions" menu appears in the upper right-hand corner of the screen. Use the "+" symbol to add a new schema. For details, see Create a New Schema. The Schema Definition Page Navigate to the Schema Definition page by clicking on a schema name. Here, you can view statistics about the schema and access its tables. Each table is represented with an icon representing its data source. For example, if the table uses a CSV file as its data source, it will show an icon with "CSV" on it. If the data source is an SQL, it will show "SQL". If the table is multi-source, the icon will show "Multi", etc. To access a table definition, click on the down arrow corresponding to that table and select "Table Details". The Table Details Page In a table details page, you can: find information about its datasource(s) and columns, Create Formula Columns, Runtime Security Filters, joins, and Load Filter. For information about modifying table details, see Edit Schema Structure. 45
 column exists in the table you are loading incrementally.")
46 Set up a table for incremental loading This feature enables loading only the data that has been generated since it was last loaded into Incorta Analytics. To use this feature, ensure that a CDC (Change Data Capture) column exists in the table you are loading incrementally. Otherwise, it would be fully loaded even if you select the "Incremental" loading option when loading data in The Schema Definition Page. An SQL update query will be needed to fetch the updated data from the server. To enable Incremental Loading: 1. Click on "Schemas & Session Variables" on the left-hand side, to navigate to the "Schemas" page. Click on the "Schemas" tab. 2. Click on the schema that contains the table to be loaded incrementally, to get to the schema definition page. 46
47 3. Click on the down arrow corresponding to the table of interest on the righthand side. 4. Select "Table Details" to go to the table details page. 5. Click on the datasource where the data is located. The "Data Source" window appears. 47
48 6. Enable incremental loading to show the "Update Query" field. 48

49 7. Copy the query from the "Query" field and paste it into the "Update Query" field, and append it with the update statement "where <CDC_column>>?". Note that "?" refers to the last successful load start time. 8. Click Save to get back to the table definition page. 49
50 9. Click Done in the upper right-hand corner of the screen, or click Cancel to ignore the changes. Add a Data Source to a Table With Incorta you can create multi-source tables. To add a source table, click on the add button in the data source list at the top of the Table Details page. However, it is important to note that in the case of an existing materializedview table, this feature, and thus the add button, would be disabled. The following screenshots show a multi-source data source list with, and without, a materialized-view table. Column Definition Features In the "Columns" section, you can select what columns to appear in the Source Elements List in the Analyzer, and define the column features. When you make changes, you must perform a refresh from snapshot in order for the change(s) to take effect. "Name" lists the columns of the table. Uncheck the box for any column(s) you do not want to include in your schema. "Label" displays a user-friendly name for the column. This name should be 50
51 descriptive of the data in the column. Customize labels here as needed. This can be done by clicking in the cell you want to rename and typing the name you may find appropriate. "Type" indicates the data type. You can choose the data type that the column contains. You can choose it to be either date, double, integer, long, string, or null. "Function" indicates whether the column is a key, dimension or measure. Incorta Analytics' auto-intelligence assigns a default value. To change the function, click on the current value and choose from the drop-down list. Key - Assign the Key function to columns used to uniquely identify each record. Keys are used for table joins and for incremental refresh of data. During an incremental load, each record with an existing key is updated, and each record with no matching key is inserted. Dimension - Assign the Dimension function to columns used to categorize or group data, such as country, state and city, or days, months and years. In a line graph or bar chart, a dimension used for grouping is plotted on the x-axis, while a dimension used to give a count is plotted on the y-axis. Measure - Assign the Measure function to columns used to measure and aggregate data. Data from these columns must be plotted on the y-axis and with the proper aggregation function. For information about setting the aggregation function, see Build and Edit Insights: The Analyzer. If you are not sure which function to assign, you can change the value at any time after the schema has been created. See Change the Function of a Column. Create a New Schema There are two ways to create a new schema: From the Schemas Page. Using the Schema Wizard. A. Create a New Schema from the Schemas Page 1. Go to the "Schemas" page. 2. Click on the "+" symbol in the upper right-hand corner of the screen. In the drop-down menu, choose one of the two methods; Create Schema or Schema Wizard. 51


52 3. Select "Create Schema". The "New Schema" dialogue box appears. 4. Enter a schema name and description in their respective fields. 5. Click Create. 6. Start creating tables in the schema. a. Specify the type of your data source to start adding tables to your schema. b. Select a data source. c. Create a query and click Update Columns. 52
53 7. Once the schema has been created, customize its tables and columns as needed, see Edit Schema Structure. B. Create a New Schema using the Schema Wizard The Schema Wizard is the simplest way to create a new schema. The wizard walks you through a series of steps to build the schema, add tables to it, customize it, and automatically create table joins if required. 1. Go to the Schemas page. 2. Click on the "+" symbol in the upper right-hand corner. A drop-down menu appears. 3. Select "Schema Wizard". The wizard opens. Schema Wizard Step 1: Select Data Source 1. Give your new schema a name and description. 2. Select your datasource for this schema. The datasource must have been added and the data must have been loaded. 3. Leave the checkbox marked to have Incorta automatically create required table joins. You can edit or add joins later if needed. Uncheck this box if you want to 53
54 create joins manually. 4. Click Next. Schema Wizard Step 2: Build and Customize Schema 1. Choose a database schema from the left-hand side of the screen. A list will show the tables contained in the selected database in the middle of the screen. 2. Select one or more tables to add to your schema. Each table you add appears in the middle section of the page. 3. Click the "+" next to a table to expand it and edit its columns definitions. 54
55 4. Select columns and set labels, mapping types and functions as needed. For details, see Column Definition Features. 5. Click the blue arrow to edit the SQL query that Incorta uses to retrieve and load data. 6. Click the red X to delete this table from your new schema. 7. When you have finished checking and/or customizing the columns for each table, click Next. Schema Wizard Step 3: Save Schema Manage Schemas Load Data 1. Navigate to the "Schemas" tab in the "Schemas & Session Variables" page. 2. Click on a schema to go to that schema page, not the checkbox. 55
56 3. Click "Load" in the upper right-hand corner of the schema page. A drop-down menu appears. 4. Hover over "Load now" and select the loading type from the submenu. Full: Select this option to perform a full schema load. This is typically done the first time data is loaded into Incorta Analytics, or for a full refresh of the data. To perform "Full" loading: a. Select "Full" from the Load drop-down menu. The confirmation box appears. b. Click Load to proceed with the full load, otherwise click Cancel. Incremental: Select this option to load only the data that has been 56
57 generated in the data source since it was last loaded. Incorta Analytics uses an SQL query to fetch the new data from the server. Incremental loading only applies to tables for which it has been enabled, see Set up a table for incremental loading. Note that a CDC (Change Data Capture) column MUST exist within this table. Otherwise, it will be fully loaded even if you select this option. To perform "Incremental" loading: a. Select "Incremental" from the "Load" drop-down menu. The confirmation box appears. b. Click Load to proceed with the incremental load, otherwise click Cancel. Staging: Select this option to load data from the Incorta Analytics staging area. This is the area where all the data gets extracted, but only data specified by the Load Filter (defined in the Table Details page) gets loaded into the Incorta engine. If there is no load filter defined, choosing this option would load the extracted data into the staging area only, where as choosing the "Full" load option would also load the data into the Incorta engine. You may choose to load all schema tables from staging ( by selecting "Staging" from the "Load" drop-down menu at the top of the schema definition page), or individual schema table(s) (by clicking on the down arrow corresponding to any table in the schema definition page and selecting "Load from Staging"). In this case, you do not have to refresh the schema if it has already been loaded. To load data from "Staging": a. Select "Staging" from the "Load" drop-down menu. The confirmation box appears. b. Click Load to proceed with the staging load, otherwise click Cancel. Snapshot: Select this option to load data into the schema from an Incorta 57
58 Analytics data snapshot persistence, rather than directly from the data source. The snapshot is updated with every full/incremental load, and could be used to restore the latest successfully loaded data in the situation of a load failure. To load data from a snapshot: a. Select "Snapshot" from the "Load" drop-down menu. The confirmation box appears. b. Click Load to proceed with the load from a snapshot, otherwise click Cancel. NOTE: If you receive a loading error, contact your system administrator. Errors are logged in <INCORTA_HOME>/server/logs/catalina.out. Performance Optimization Incorta Analytics release 3.3 offers the option to optimize performance, freeing users from having to load all their data into memory. There are three optimzation options: a. Loading schemas into memory - Using this option, users can load all of their data into Incorta's memory. This can be done from any table's definition page, by disabling the Performance Optimized option. 58
59 b. Loading schemas partially into memory - using the Load Filter. c. Loading schemas in the staging area - This option allows users to load their data to the staging area, and query only the needed data to be loaded into Incorta's memory. This can be done by either Loading tables in the staging area, or Selecting/Deselecting tables in a schema. Loading tables in the staging area Users can control whether to load schema tables in Incorta's memory or the staging area, by toggling the Performance Optimized button in any table's definition page. To disable performance optimization and load tables in the staging area: 1. Navigate to "Schemas & Sessions Variables" page. 2. Select a schema. 59

60 3. Click on the down arrow in the upper right-hand corner corresponding to a table. 4. Select "Table Details" from the drop-down menu. 5. Disable the Performance Optimized option in the upper-right hand corner of the screen. 6. Click Done, in the upper right-hand corner of the screen. 7. Click Load, and choose "Full Load". Upon successful loading, tables with disabled performance optimization get loaded into the staging area. Those tables with enabled performance optimization get loaded into Incorta's memory. 60
61 Selecting/Deselecting tables in a schema Loading specific tables in a schema, or the whole schema, to the staging area can be applied by selecting or deselcting tables at once from the settings menu. To select/deselect tables to load to the staging area: 1. Navigate to the "Schemas & Sessions Variables" page. 2. Select a schema. 3. Click on the settings menu (gear icon) in the upper right-hand corner of the screen. The schema settings window opens. 61
62 4. Deselect or search for the tables to be loaded to the staging area, e.g. "Customers". 62
63 Note: Tables in the schema will be shown selected by default as they are loaded to the engine memory. 5. Click Save Changes. A confirmation window appears. 6. Click Confirm Changes. 63
64 Create a schema containing query tables If you load your data into the staging area, you have the option to run a query and load only the returned data to Incorta's memory. To do that, create a schema based on query tables, and load it. Create a query table To add a query table in a schema, the following example will be used to create a table querying the revenue per product: 1. Choose a database schema from the left-hand side of the schema wizard, e.g. "Sales". 2. Select one or more tables to add to your schema. Each table you add appears in the middle section of the page. 64
65 3. Click the "+" sign in the upper right-hand corner of the schema wizard window, to create a custom query table. 4. Provide a "Table Name" and a query in the empty field. 65
66 5. Click Execute. Edit an existing query in a schema To edit a custom query table in a schema, the following example will be used to edit a table querying the revenue per product: 1. Choose a database schema from the left-hand side of the schema wizard, e.g. "Sales". 66
67 2. Click the icon in the upper right-hand corner of the schema wizard window. 3. Edit the query. 4. Click Execute. Schedule a schema to load automatically To schedule a schema load job, refer to Schema schedules. Entity Relationship Diagram Incorta Analytics provides a convenient way to show the relationship diagram of the tables used within a specific schema. Follow the steps below to learn more about using this feature: 1. Navigate to the "Schemas" tab in the "Schemas & Session Variables" page. 2. Select a schema to see its ERD by clicking on its row, not the checkbox. 3. Click on "Diagram" in the upper right-hand corner of the screen. 67

68 Edit Schema Settings, Share a Schema, Set tables loading sequence You can easily Add/Edit a schema description, Share a schema with other users and groups, and Set the loading sequence for a schema tables in the "Settings" menu for that schema. You may access a schema settings menu from the "Schemas" page or from the schema definition page. To learn more, refer to Edit schema settings from the schemas page, or Edit schema settings from the schema definition page. Edit schema settings from the schemas page You may edit a schema settings from the "Schemas" tab in the "Schemas & Session Variables" page. To access it: 1. Navigate to the "Schemas" tab in the "Schemas & Session Variables" page. 2. Select the checkbox next to one schema only to edit its settings. The "Actions" 68
69 menu appears in the upper right-hand corner of the screen. Note that selecting ticking more than one checkbox affects the items available in the "Actions" menu. 3. Click "Actions" in the upper right-hand corner of the screen. 4. Select "Schema settings" from the drop-down menu. The "Schema Settings" window appears. 69
70 Edit schema settings from the schema definition page You may edit a schema settings from the definition page of that schema: 1. Navigate to the "Schemas" tab in the "Schemas & Session Variables" page. 2. Click on a schema to access the definition page for that schema by clicking on its row, not the checkbox. The schema definition page opens. 70
71 3. Click on the gear (settings) icon in the upper right-hand corner of the screen. The "Schema Settings" window appears. Add/Edit a schema description In the schema settings window, you can add/edit a schema description. To add or edit a schema desctiption, simply use the following steps: 1. Click on the "Settings" tab. 71
72 2. Add or edit the schema description in the "Schema Description" field. 3. Click Save Changes. Share a schema with other users and groups In the schema settings window, you can easily share a schema with other users and groups, and set their permissions on that schema. To share a schema with other users and groups, simply use the following steps: 1. Click on the "Sharing" tab. 72
73 2. Click on "+" in the upper right-hand corner to add users/groups. The search bar appears with the least privilege (i.e. "Can View") selected by default. 73
74 3. Enter a name, address, or group name to share the schema with. Once you start typing, suggestions will be displayed to help you choose. 74
75 4. Select a user/group. The permissions menu appears. 75
76 5. Select a permission for the selected user or group. 6. Click Save. Note that each permission includes the one on top of it (e.g. if a user has the "Can Share" permission, they will automatically have the "Can View" permission). The sharing wizard closes, returning back to the "Shared With" list, showing all the users along with their permission level. 76
77 7. Click on the permission (in blue) corresponding to a user to either change their permission level, or remove them and stop sharing the schema with them. 77
78 8. Select a privilege and click Save, or Cancel to ignore the changes. Set the loading sequence for a schema tables When loading a schema, you can easily set the extraction sequence for the tables wihtin that schema. This can be done by giving each table a number, and they will be extracted in an ascending order according to that number. For example, if there are five tables; two of which share the same load order of 1 and the rest have the load order of 2, the two tables of the order 1 will be extracted in parallel first. After loading is successful, the rest of the tables will follow. To set the tables extraction sequence, simply use the following steps: 1. Click on the "Tables load order" tab. The tables list appears with the corresponding extraction sequence number, defaulted at
79 2. Click in the "Table Load Order" column corresponding to any table and enter the extraction order for that table. The default extraction order for all tables is 10, meaning that they will all be extracted in parallel. The number 10 is set so that you can easily set other tables to be extracted first. Note that tables having the same load order will be extracted in parallel. 3. Click Reset Tables Load Order to reset any values you may have changed back to the default value, i.e Click Save Changes. Edit Schema Structure You may use the schema definition page to edit a schema structure and the underlying tables of that schema. To access a schema definition page: 1. Go the "Schemas" page. 2. Click on a schema (not the checkbox) to edit its structure. The schema definition page opens. 79
 from the panel on the left-hand side.")
80 Add a Table with the Schema Wizard To add tables using the schema wizard, click on "+" in the upper right-hand corner of the screen, and select "Schema Wizard". Run the wizard and add the table(s) from the panel on the left-hand side. Add a Table, Alias or Join Manually To add tables, aliases, or joins manually, see Add a Table Manually, Create an Alias, or Create a Join. Add a Table Manually 1. Select "Table" from the "+" drop-down menu. A submenu appears. 2. Select the type of datasource or file for the new table, the Data Source window opens on top of the New Table page. For xlsx, csv, tsv, tab and txt files, select "File System". 80
81 3. Specify a datasource or data file. 4. Turn on the "Incremental" switch button (where available) to enable incremental loading, in which only new data is loaded from the server. If you do not enable incremental loading, this table will always be loaded fully when data is loaded or refreshed. This may result in long loading times. For more details, see Set up a table for incremental loading. 5. Specify the datasource parameters: For a SQL datasource, defined the SQL query in the "Query" field. If you have selected incremental loads, define an update query in the "Update Query" field, e.g. "where <Last_Update_Date>>?", given that a Change Data Capture column exists within the table. Note that "?" refers to the last successful load start time. For CSV files: Specify the character set, thousands separator and date 81
82 format. If you have enabled incremental loading, specify which CSV file to use for the incremental changes. For Excel XLSX files: Select a Worksheet. If no Worksheet is specified, the first one will be used. If your have enabled incremental loading, specify which worksheet contains the incremental changes (the delta from the last version loaded). For password-protected Excel files, ensure that this feature is enabled in the admin UI under "Tenant Configurations". Users will need to enter the password when creating a table based on this file. For SalesForce data, define an SOQL query. If you have selected incremental loads, define an update query. Fetch Size is 300 rows by default; leave this value unset unless you are tuning the performance. 6. For query-based tables, add or delete columns as needed by modifying the SQL or SOQL (SalesForce) query and then clicking Update Columns. 7. Customize columns in your table by modifying the Label, Type and Dimension as needed. 8. Scroll down to add any of the following: Formula Columns. Runtime Security Filters. Parent and Child Joins: see Create a Join. Delete a Table To delete a table, click on the corresponding down arrow, and select "Remove". Add or delete table columns. For a query-based table: 1. From the "Schemas" page, select the schema where the table exists. 2. Locate the table to be modified and click the down arrow in the upper righthand corner of the block of that table. 3. Add column names to, or remove column names from, the select-statement. 4. Click Save. For a file-based table: 1. Edit the source file to add or remove columns. 82
, corresponding to the column you want to change. 6.")
83 2. Load the edited file. 3. Click Save. Change the Function of a Column To change the function of a column: 1. Navigate to the "Schemas" page. 2. Select a schema. 3. Click on the down arrow in the upper right-hand corner of the section of the table containing that column function. 4. Select "Table Details" from the drop-down menu. 5. In the "Columns" section, click on the function (in the "function" column), corresponding to the column you want to change. 6. Select a function from the drop down list. 7. Click Done in the upper right-hand corner of the screen. Create Formula Columns A formula column is one that can be added to a table, containing formulacalculated data using other columns in that table. This way, you do not have to add that missing column to the table in the data source. For example, if you have "Revenue" and "Cost" columns in a table, but missing the "Profit" column, you can easily create a column (e.g. "Profit") defined by a formula that calculates the profit (i.e. Revenue - Cost). Now the formula-calculated "Profit" column is a formula column. Formula Columns can easily be created in the "Table Details" page. 83
84 To create a Formula Column: Navigate to the "Schemas" page. 1. Select a schema. 2. Click on the down arrow in the upper right-hand corner of the section of the table where you want to add the formula column. 3. Select "Table Details" from the drop-down menu. The table definition page opens. 4. Click on "+" in the upper right-hand corner of the page. 5. Select "Formula Column". 6. Scroll down to the "Formula Columns" section, and find the new formula column field. 7. Check the "Show in Analyzer" checkbox, to show this Formula Column in the Insight "Analyzer". 8. Set the Name, Label, and Function fields. 9. Click anywhere in the Column Formula field to open the Formula Builder. The "Formula Builder" window opens, where you can enter the formula expression. NOTE: Formula columns created in business schemas will not be added to the default dashboard filters list. Runtime Security Filters A runtime security filter limits the data visible to users by filtering the table prior to its use in any dashboard. Note that runtime security filters are not the same as runtime dashboard filters. 84
85 To add additional filters, click the "+" icon in the upper right-hand corner of the screen. Load Filter The "Load Filter" feature can be used to load large datasets at once and select data segments that would fit into the Incorta engine for efficient memory consumption. Using this feature, the Schema Manager would be able to extract all the data into a staging area and only load specific data into the Incorta engine. For information about the supported syntax with examples, see App. D: Load Filter Syntax To create a load filter: 1. From the Schemas page, select a schema. 2. Click on the down arrow in the upper right-hand corner of the section of that table. 3. Select "Table Details" from the drop-down list. 4. Scroll down to the "Load Filter" section to add a filter expression. 5. Click Done in the upper right-hand corner of the screen, to exit the "Table Details" page. Create an Alias By creating an alias you can refer to a table by an alternative name. You can create aliases for tables in the same or different schemas, using the following steps: 1. Use the Schemas page to select the schema to which you want to add an alias. 2. Click on the "+" icon in the upper right-hand corner of the screen, and select "Alias". 85

86 3. In the "Schema Name" field, select the schema that contains the original table. 4. From the "Select Table" drop-down menu, select the original table. 5. Click in the "Table Name" field to name the alias table. 6. Click Done in the upper right-hand corner of the screen. The schema definition now includes the new alias as the last table listed. Create a Materialized View To create a Materialized View: 1. Use the Schemas page to select the schema to which you want to add an alias. 2. Click on the "+" icon in the upper right-hand corner of the screen, and select "Materialized View". 3. Choose language from the "Language" drop-down list. 4. Paste the script in the "Script" field. 5. Click Add Property to provide the "key" and "value" in the respective fields. 86

87 You may add a property by clicking the Add Property, or click the trash icon to delete a property. 6. Click Add. Create a Join Incorta Analytics allows you to join two tables in separate schemas, even if the source data exists in two separate databases. Joins can be viewed from within a Parent schema table. For example, If schemaa.table1 is joined to schemab. Table2 (where Table1 is the child table while Table2 is the parent table), then the join can be viewed in the schema where the parent table is, i.e. schemab. You may either Create a join from the schema definition page, or Create a join from the table details page. Create a join from the schema definition page 1. Click "+" in the upper right-hand corner of the screen and select "Join" from the drop-down menu. 2. Select the parent and child tables, along with the type of join, in the appropriate fields. You may also add filters by clicking + in the upper right-hand corner of the "Filters" block. 87


88 Create a join from the table details page 1. Locate the table of interest and click on the corresponding down arrow in the same block in the upper right-hand corner. 2. Click "+" in the upper right-hand corner of the screen. 3. Select a parent, or child, join from the drop-down menu. 4. To add conditions to any join, select "Join Details" in the drop-down menu in the upper right-hand corner of the block of that join. To delete a join, click "Remove Join". 5. Add filters to a join by clicking + in the upper right-hand corner of the filter block. 88


89 Modify an Existing Join To modify an existing join: 1. Click on the down arrow in the upper right-hand corner of the join. 2. Select "Join Details" to modify the join conditions. 3. Click + in the filter box to add filters for the join. For more information, see Create a Join. Delete a Join To delete a join, click on the corresponding down arrow, and select "Remove". 89
90 Business Schemas Business Schemas can be used to create views on tables without compromising the security of the underlying data, or occupying the physical space that could otherwise be taken by physical tables. A view (i.e. Business View) may be created using different schemas and different tables, as long as the schemas are loaded and the tables are properly joined. For information on loading schemas, see Load Data, and to learn about creating joins, see Create a Join. Overview In order to use the business schema feature (i.e. business view), you need to: 1. have a physical schema loaded, and the included tables properly joined. 2. navigate to Business Schemas in the menu bar on the left-hand side of the screen to: add, or import, business schemas, by clicking on "+" in the upper righthand corner of the screen, see Create/Import a Business Schema. edit existing business schemas to: add a new business view, see Create/Delete a view in a business schema. edit and remove an existing view, see Managing business views and business schemas. export, or delete, one or more business schemas, see Managing business schemas. share, or edit the description of, a schema, by selecting a schema in the "Schemas" page, then selecting "Schema settings" from the "Actions" menu in the upper right-hand corner of the screen. In order to create a view in a business schema, you need physical and loaded schema(s) to use its tables in that view. After selecting the schema(s), you can drag the columns needed to add to the new view. Analyze users can define formulas in Business View (Business Schema screen) and use it in Analyzer. These formulas are saved as logical objects only and are computed at runtime. Additionally, in a business view, you can create formula columns and reuse them in another formula column in the same, or any other, view or business schema. For more details, read the following example and see Managing business views and business schemas. 90
91 Example: If you add a new formula column (e.g. Profit) to a business view (e.g. BV-1), you may use it in another formula column (e.g. Profit_02) in the Formula Builder. Note that in the formula builder, you would need to add the business view where the desired formula column exists, which in this example would be "BV-1". To add a business view in the formula builder, click the "+" at the top of the columns list on the left-hand side, then click on the "Business Schemas" tab. The following chart illustrates the flow of Business Schemas: Using Business Schemas This section explains in detailed steps how to use Business Schemas. Create/Import a Business Schema To create, or import, a Business Schema: 91
92 1. Click on "Business Schemas" in the main menu column on the left-hand side. A list of existing business schemas opens. 2. Click on "+" in the upper right-hand corner to create, or import, a business schema. 3. To create a business schema, go to step 5. Select "Import Schema(s)", to upload a schema from your computer. 4. Click on select from your PC to choose a schema from your computer to upload. Select "Overwrite" to replace the existing schema if the imported one shares the same name. Now, you are ready to Create/Delete a view in a business schema. 5. Select "Create Schema" to build a business schema based on an existing loaded (physical) schema. The "New Business Schema" window appears. 92
93 6. Enter a name, and optionally a description, for the new schema to be displayed on the "Business Schemas" page. Note that the name given here cannot be changed. However, the description can be changed in the "Settings" menu. 7. Click Create. The new schema page opens. Create/Delete a view in a business schema Now that you created a new business schema, you are ready to start creating business views using existing and loaded physical schemas. To create/delete a view in a business schema: 1. Navigate to the business schema definition page. 93
94 2. Click on the business schema where you want to create a business view, not the checkbox. The business schema page opens. 3. Click on "+" in the upper right-hand corner of the screen, or click Add New View in the middle of the screen of any empty schema page. The views page opens in a view editing mode. 4. Enter a name for the new view in the view name field. The default name for a new view is "New_View". If the default name is not changed, additional views will be given the default name (i.e. "New_View") appended by its sequence number. 94
95 5. Click on + in the source element list on the left-hand side of the screen, to add the physical schema(s) containing the table(s) needed for the view. The physical schemas menu opens, listing all the available physical schemas. In this menu, you can: a. expand schemas to see the underlying tables. 95
96 b. Resize the schema list horizontally, by moving the cursor to the center of the right edge of the menu until it changes to a horizontal doubleheaded arrow. 96
97 6. Select all schema tables automatically by selecting the checkbox corresponding to that schema, or select specific tables individually. The selected tables are added to the panel on the left-hand side, listing the columns within those tables. 97
98 7. Click Collapse All, at the bottom of the source element list (i.e added tables panel) on the left-hand side, to collapse the view to the schema level. Alternatively, you may collapse or expand individual tables and/or schemas, by clicking on the corresponding down arrow. 98
99 8. Click Done at the bottom of the schema list (on the right-hand side) when you are done selecting the schemas and tables. 99
100 9. Drag the columns you want to add in the view area from the source elements list on the left-hand side to the columns list under the new view. You can quickly search for a column in the search bar to locate and drag it from the search results. You can also preview any column data when you hover over that column, and click the eye icon. 10. Click on the trash bin icon corresponding to a column, to remove it. 11. Click on the actions menu (three vertical dots) corresponding to a view/ folder, to delete it. 12. Click Done in the upper right-hand corner of the screen, when done. The business schema definition page opens, containing all the business views within that schema. 100
101 Managing business views and business schemas Business schemas and views can easily be managed in the "Business Schemas" page, accessed from the main menu on the left-hand side of the screen. There, you can manage the export, deletion, and settings (sharing and changing description) of business schemas. Additionally, this section explains in details how to edit, delete, and organize business views. Managing business schemas Incorta Analytics enables you to easily share business schemas with other users, and export them from one environment to import into another. The following steps show in details how to share, export, and delete a business schema: 1. Navigate to the "Business Schemas" page, accessed from the main menu on the left-hand side of the screen. 2. Click on a schema checkbox. The "Actions" menu appears in the upper right-hand corner of the screen. 3. Select "Schema settings" to open the business schema settings menu: a. Click on the "Settings" tab to edit the schema description. 101
102 b. Click on the "Sharing" tab to share the schema with other user(s), or group(s), and set their privilege level. Sharing a business schema works the same as sharing physical schemas. To learn more, see Share a schema with other users and groups. 102
103 c. Click Save Changes. 4. Select "Export schema" to export the selected schema to your computer. 5. Select "Delete selection" to delete the selected schema(s). 6. Click Delete to confirm. Managing views in business schemas Incorta Analytics enables you to easily manage business views within business schemas. Starting from Incorta Analytics 3.1, you can organize business views using folders, in addition to the existing management options (e.g. add/remove columns, formula columns, remove views, etc.). 103
104 Enable the edit mode In order to edit and organize business views within a business schema, you have to enable the edit mode for that schema. To enable the edit mode for a business schema: 1. Navigate to the "Business Schemas" page. 2. Click on the schema containing the view(s) to be edited. The schema definition page opens. 3. Click on the arrow corresponding to any view to expand and preview a list of the contained columns within that view. 104
105 4. Click on the actions menu (three vertical dots) corresponding to a view to enter the edit mode for all the views within. 5. Select "Edit" from the drop-down menu. The views definition page opens in edit mode. 105

106 6. The edit mode can also be enabled by clicking on "+" (to add a new folder or view) in the upper right-hand corner of the business schema definition page. 7. Select "Add New Folder" or "Add New View" to open the views definition page in edit mode. Organize views in business schemas In the "Business Schemas" page, you can easily stay organized by rearranging views and creating logical folders. Folders can be used to group business views in the way you want to present them to business users. This also would help users select the correct business views when choosing attributes for an Insight. For example, employees can play multiple roles in a transactional table. In the service area, a table can have the following columns: Open_By_Employee (Employee who opened the ticket). Closed_By_Employee (Employee who closed the ticket). Fixed_By_Employee (Employee who fixed the ticket). One common approach in reporting is to create a folder (e.g. "Employee"), 106

107 where you can find one view for each of the roles (i.e. columns). In each view you can add attributes for that employee, e.g. EmployeeName, EmployeeOrganization, EmployeeManager, etc. In order to start organizing your business views, navigate to the "Business Schemas" page, then click on any schema. From any business schema page, you can create a folder, enabling the views edit mode. There, you can move existing views to a folder of your choice, or create a new view from within a folder. Create a new folder You may create a new folder either from any business schema definition page, or from the views definition page (in edit mode). To create a new folder from the business schema definition page: 1. Click on any business schema from the "Business Schemas" page, the business schema definition page opens. 2. Click on "+" in the upper right-hand corner of the screen. 3. Select "Add New Folder". A new empty folder gets created in the views definition page. 107

108 To create a new folder from the views definition page (in edit mode): 1. Enable the views edit mode, see Enable the edit mode. 2. Click on "+" in the upper right-hand corner of the screen. A drop-down menu opens. 3. Select "Add New Folder". A new empty folder gets created. 108
109 Move an existing view to a folder 1. Click on the three vertical dots corresponding to a view. The actions menu opens. 2. Hover over "Move To Folder", a submenu of the available folders appears. (If there are no folders within the same business schema, this option will be disabled.) 3. If you want to move a view from one folder to another (or to the root folder the current business schema), click on the three vertical dots corresponding to a view to do any of the following: 109
110 Move To Folder: to move to a different folder, or Move Out of Folder: to move to the root location of the current business schema, or Delete: to delete the view. Create a new view from within a folder 1. Click on the "+" button corresponding to that folder. 2. Name the view and start creating it by dragging columns from the source element list (panel), on the left-hand side of the screen, into the view area. Edit views within business schemas In order to edit views within a business schema, you have to enable the edit mode for that schema, see Enable the edit mode. You may edit business views to: rearrange columns and views (see Drag-To-Rearrange business views and columns) add a new view (see Create/Delete a view in a business schema). add/remove columns within a view (see Create/Delete a view in a business schema). create/delete formula columns within a view. Drag-To-Rearrange business views and columns 110
111 You may Drag-To-Rearrange to arrange folders, views, and columns to best suit your viewing preference, noting the following hierarchical conditions: Folders: Folders are placed automatically atop the views. You may drag a folder to the top/bottom of other folders, but not other views. To move a folder: 1. Collapse that folder (if it is expanded). 2. Click and hold that folder. 3. Drag the folder vertically to the preferred position. A vertical double-headed arrow appears as you hover over the view, indicating the option to drag it up and down. Note that if there is only one folder in the business schema, it will not be moved. Business views: You may drag a view to the top/bottom of other views, but not other folders. To move a view out of a folder or to another folder, see Move an existing view to a folder. To move a view: 1. Collapse that view (if it is expanded). 2. Click and hold that view. 3. Drag the view vertically to the preferred position. A vertical double-headed arrow appears as you hover over the view, indicating the option to drag it up and down. Note that if there is only one view in the business schema, it will not be moved. Columns: You can only arrange columns within a view. That is, you cannot drag a column out of a view. To drag a column: 1. Click and hold anywhere on the row of that column. 2. Move the column vertically to the preferred position. Create/Delete formula columns within a view Formula columns can be used in business schemas just like in physical schemas. 111
112 To learn more about formula columns, refer to Create Formula Columns. Once created, formula columns can be used in other formula columns. For example, if you create a formula column to calculate the profit (i.e. Revenue - Cost), you may use it in another to calculate a percentage of that profit (e.g. 0.2 * Profit). In this case, both are formula columns that help formulate needed data without having to add new columns to your source data. To create a formula column in a business schema: 1. Enable the edit mode for that business schema (see Enable the edit mode). 2. Go to step 10, to create a formula column within another. Drag the "New Formula" item from the panel on the left-hand side to the view columns area. 3. Enter a name and label for the new formula (e.g. Profit), and set the data type for the new column from the drop-down list. 112
113 4. Click in the "Column Formula" field to open the Formula Builder (i.e. the tool used to create and edit formulas in Incorta Analytics). 5. Enter a formula, e.g. Revenue - Cost, by clicking on the "+" icon (which appears when hovering over a column on the left-hand side) to add a column (e.g. Revenue). 113
114 6. Click on the eye icon (which appears when hovering over a column on the left-hand side) to preview the column data. 7. Click Save. The new formula column is added in the view definition page. 114
. Name it \"Profit20\", for example. 9. Repeat steps 4-6. 10.")
115 8. If you are done, go to step 15. To use a formula column within another, drag "New Formula" from the left-hand side of the screen to the view columns area. Let this formula calculate 20% of the formula column "Profit" (created in the previous steps). Name it "Profit20", for example. 9. Repeat steps Click the "+" button in the upper right-hand corrner of the source element list on the left-hand side of the formula builder. The submenu opens on the right-hand side. 11. Select "Views" from the drop-down menu in the upper left-hand corner of the submenu, and select the view containing the formula column you want 115
116 to use (i.e. Profit in this example). 12. Click Done at the bottom of the submenu to close it. Notice the formula column (i.e. Profit) appears in the source element list on the left-hand side. 13. Enter a formula to calculate 20% of the formula column (Profit). 14. Click Save. The new formula column is added in the view definition page. 15. Click on the trash bin icon corresponding to a formula column to delete it. 116
117 Build a New Dashboard 6 Now that you understand the underlying data structures, you are ready to build a new dashboard using one of the following methods: A. Click the "+" icon in the upper right-hand corner of the "Content" page: 1. Create an empty dashboard that you can build from the ground up, using the schemas you have already defined. 2. Manually specify a name, choose specific schemas and tables, set Dashboard Filters, choose a visualization type for your first Insight. See Create a New Dashboard from the "Content" Page. B. Click Create a Dashboard in the upper right-hand corner of any schema/ business schema definition page to: 1. Create a dashboard pre-populated with all of the tables and columns defined in that schema. You can also add tables from other schemas if needed. 2. Automatically name the dashboard after that schema, which you can change. For example, if you click Create Dashboard from the "Sales" schema definition page, the dashboard will be named "Sales Dashboard". 3. Open the dashboard with no Dashboard filters. You can add these later if needed. 4. Start the Analyzer with a suggested visualization type, which you can always change. See Create a New Dashboard from within a Schema. NOTE: Before creating a dashboard by either method, ensure you have: 1. connected Incorta Analytics to your datasources and data files. 2. defined your schemas based on those datasources and data files. 3. loaded the data to the Incorta Analytics engine. 117
118 Create a New Dashboard from the "Content" Page To create a new dashboard from the "All Content" page: 1. Click on the "+" icon in the upper right-hand corner of the screen. 2. Select "Create Dashboard", the new dashboard name window opens, with a default name "New Dashboard". 3. Enter a unique dashboard name, then click Create. The new dashboard opens in the "Analyzer" mode (this is the mode required in order to build/ edit an Insight), with a column chart selected by default. At this point, there are no schemas or tables selected. 118
119 4. Click on the brush icon in the upper right-hand corner, to open the "Visualization" window and choose a different Insight type. Create a New Dashboard from within a Schema From the schema definition, click on Create Dashboard in the upper right hand corner. Because this dashboard was created directly from within a schema, clicking on Create Dashboard results in opening the Analyzer pre-populated with the schema tables. You can use this Analyzer to build Insights for the new dashboard. For an introduction to the Analyzer, See Build and Edit Insights: The Analyzer. The new dashboard is automatically given the current schema name followed by "Dashboard". If the name already exists, the new dashboard name will be 119
120 appended with a number, i.e. SchemaName Dashboard-1. If you want to customize the dashboard s schema(s) and add Dashboard Filters, see Build and Edit Insights: The Analyzer. To build an Insight, see Build and Edit Insights: The Analyzer. Build and Edit Insights: The Analyzer Now that you know how dashboards depend on the underlying data structure, you are ready to design Insights for your own dashboard(s). To see definitions for each type of the Insight visualization types before you begin designing, see App. A: Build the Right Insight. 1. Ensure that the underlying data structure has been defined for the dashboard. For more information, see Data Management. 2. Navigate to a Dashboard. 3. Click on the "+" icon in the upper right-hand corner of the screen, to add a new Insight. The "Visualization" menu opens. 120
121 4. Choose a visualization type to open a new, undefined Insight in the Analyzer. Click on the paint brush icon in the upper right-hand corner to change the visualization type. 5. Start dragging columns from the Source Elements List (panel), on the lefthand side of the screen, to the grouping, coloring, and measure dimensions fields. If the list is empty, i.e. does not contain any tables or columns, click the "+" icon for a list of the available tables to choose from. See Build a New Dashboard. Note that the dimensions fields change according to the type of Insight you select. See Set up Insight Dimensions in the Analyzer. Set up Insight Dimensions in the Analyzer Recall that a dimension is an attribute used to structure the data. Each 121
122 dimension of the Insight contains (and is defined by) one or more filters. Fields in the Analyzer: Measures It is easiest to define an Insight if you begin by thinking about what you want your Insight to measure, e.g. units sold or revenue would be a Measure. For more details about defining a measure, See Specify Filters for Measures. Grouping Next, the grouping dimension would be defined by how you want to group, or slice, the measure you choose. For example, you can group by category, or by a time period. For details about defining the grouping dimension, See Specify Filters for the Grouping Dimension(s). Coloring Finally, the coloring dimension would help with making visual distinctions. For example, if you choose to group Revenue (i.e. Measure dimension) by Year (i.e. Grouping dimension), you can use the coloring dimension to display each year in a different color. You can also add an additional filter to the coloring dimension to enable a drill-down. Some visualizations, such as a Grouped- Column Charts, require the coloring dimension to be defined. See Specify Filters for the Coloring Dimension(s). Specify Filters for Measures You can specify a filter for a measure by dragging an element from the source elements list (on the left-hand side of the screen) and dropping it in the measure field. You can type the element you are searching for in the search box to easily locate it. Elements that are defined as Measures in the table definition are labeled by dark blue circles. After placing an element in the field, click on the down arrow to set the corresponding filter parameters. 122
, Millions(M), or Percent(%). If you set the scale to None, the x-axis will scale automatically.")
123 Data Settings for Measures Name: Specify a display name for the measure filter. Aggregation: Choose an aggregation for the method of the measure. Scale: Set the scale of the x-axis to Thousands(K), Millions(M), or Percent(%). If you set the scale to None, the x-axis will scale automatically. Running Total: If you turn Running Total on, data will be displayed cumulatively along the y-axis. Filter-in-Filter: Use this setting to add a filter to a measure only, without affecting the rest of the Insight. Choose a column, operator, and value for this filter. Format Settings for Measures Format: Use this setting to define how you want numbers to be displayed in the Insight. This is simply a display mask and does not affect how the data is stored or processed. Color: This setting affects the primary color used to visualize data in the Insight. Use it to change the color of the line in a time series, or of the columns in a column chart, for instance. In a line graph with multiple data series represented, this setting affects only the highest or lowest line on the x-axis, depending on the sort order. In a grouped row or column chart, the color set here will be applied to either the first or last row or column in each group. 123


124 Conditional Formatting: Tables and KPIs support conditional formatting for measures. Use conditional formatting to highlight values that meet a preset condition. Choose an operator and a value for each condition. For tables, you can specify both background and text colors. For KPIs, you can specify text color. Using a Formula Filter on Measures To create a Formula Filter for a measure: 1. Drag and drop the New Formula button into the measures field. 2. Click on the down arrow corresponding to the new formula to define it. 124
 to determine the")

125 3. Set the aggregate function to "FORMULA", in the "Aggregation" field. This causes Incorta Analytics to refer to the formula expression (entered in the next step) to determine the actual aggregation function. 4. Click in the "Formula" field to open The Formula Builder, where you can create the formula expression. The Formula Builder opens. For details about the available formulas you can use, refer to App. B: Formula Functions. 125
126 5. Click Done to close the Formula Builder. 6. Set the remaining filter parameters, including Name, Scale, Formatting, etc. Specify Filters for the Grouping Dimension(s) When you specify more than one filter for the grouping dimension in a single Insight: Their order from left to right determines the drill-down path for the Insight. If you use multiple filters in the grouping dimension, use no more than one filter for the coloring dimension. If there are multiple filters in both the coloring and grouping dimension, the grouping dimension determines the drill-down path. Specify Filters for the Coloring Dimension(s) 126
127 Adding a filter to the coloring dimension for this Insight allows you to split revenue per year by category. In the following figure, because the visualization type is a Stacked Column Chart, the Category filter causes the data for each bar to be split and stacked by product category. When you define filters for the color dimension, the visualization type determines how the color is applied. In a line graph, for instance, the data series for a color dimension would be split into multiple colored lines. The categories are sorted alphanumerically unless you define a sort order. See Define a Sort Order. 127
128 You can add as many filters to the coloring dimension as you need. When you specify multiple filters for the coloring dimension in a single Insight, their order from left to right determines the drill-down path for the Insight unless there are multiple filters in the grouping dimension. you should define only one filter for the grouping dimension. Define a Sort Order To set a sort order: 1. Click on the down arrow on the coloring or grouping dimension element you want to sort, e.g. Category. 128

129 2. Search for the element you want to sort by in the search box atop the Source Elements List on the left hand side of the screen, e.g. Revenue. 129
130 3. Drag the element and drop it in the sort-by field of the drop-down menu of the grouping, or coloring, dimension. 4. Click on the black arrow to sort ascendingly (arrow pointing up), or click it again to sort descendingly (arrow pointing down). 130

131 5. Click on the drop-down menu indicator inside the "revenue" element to view the table and column information for the element, and to edit its display name if desired. 131

132 NOTE: Be sure to set the sort order for each filter in the dimension so that as the user drills down, the sort order remains consistent. 132
133 Insight Viewing Features Incorta Analytics provides users with features that facilitate the way data is previewed in a dashboard. These features are Pagination in Table and Pivot Table Insights, Toggling between Insights, and Dynamic Group-By. Pagination in Table and Pivot Table Insights This feature allows users to set the number of rows per page in a table, to suit their viewing prefernece. NOTE: This feature applies to Table and Pivot Table Insights only. To activate pagination: 1. Navigate to any dashboard with a table Insight. 2. Go to the Analyzer mode by clicking in the upper right-hand corner of the Insight. 3. Click on the settings menu (gear icon) in the upper right-hand corner of the page. 133

134 4. Select the number of rows by clicking on the up and down arrows, or inserting the number required in the box next to "Page Size". NOTE: If the Page Size is set to Zero or left blank, the default number of rows displayed will be 1000 rows per page. 5. Click Done in the upper right-hand corner of the screen, to exit the Analyzer mode. The number of pages appears in the bottom left-hand corner of the Insight. 134
135 6. Click on the single left (or right) arrow on the lower left-hand side of the table Insight to go to the previous (or next) Insight. 7. Click on the double left (or right) arrows to move to the very first or very last page. Toggling between Insights This feature allows users to switch from one Insight to another in a dashboard, by selecting the Insight from a drop-down list. This feature can be used only when the "Full Screen Mode" option is enabled. To enable "Full Screen Mode", use the following steps: 1. Navigate to a dashboard. 2. Click on the settings menu (gear icon) in the upper right-hand corner of the screen. 3. Enable "Full Screen Mode". 135

136 4. Click on the maximize icon in the upper right-hand corner of any Insight. The Insight will appear in full screen mode. 5. Click on the drop-down list at the bottom of the screen to choose another Insight. To go to the next or previous Insight, click on the arrows to the right or to the left of the Insight, respectively. 6. To exit Full Screen Mode, click on the minimize icon in the upper right-hand corner of the Insight. 136
137 NOTE: If the full screen mode is not activated from the settings menu, the Insight may be viewed in full screen mode, but the Insight drop-down list will not appear. Dynamic Group-By This feature only applies to non-aggregated Table Insights containing more than one grouping dimension. It enables users to select a grouping dimension from a drop-down list of a table Insight without going to the Analyzer. To use this feature: 1. Navigate to any dashboard. 2. Click on the icon in the upper right-hand corner of an Insight to go to the Analyzer mode. 3. Add more than one grouping dimension in the grouping dimension field. 4. Click on the settings menu (gear icon) in the upper right-hand corner of the page. A drop down menu opens. 137

138 5. Enable "Merge Columns" and "Dynamic Group-By". 6. Enable "Only Show selected". This option appears only after activating "Dynamic Group-By". If this option is not enabled empty columns for the rest of the dimensions will be displayed with no data. 7. Click Done in the upper right-hand corner, to exit the Analyzer mode. 8. Click on the down arrow button in the upper right-hand corner of the Insight. A drop down menu opens. 138
139 9. Select the grouping dimension required. Dynamic Hierarchy This feature helps view an organizational structure in a tree view, while adding optional attributes that can be specified in the Analyzer. The tree view can be collapsed and expanded when viewing managers and their subordinates. NOTE: Schema tables used in Insights with hierarchy must be self-joined, in order for the data to be properly calculated. The following steps show an example applying dynamic hierarchy on an HR Dashboard: 10. Navigate to a Dashboard with a table Insight. 11. Add a measure, (e.g. Salary), and a unique dimension, (e.g. ). 139

140 12. Click on the settings menu (gear icon). 13. Enable the "Merge Columns" option. 140

141 14. Click the down arrow of the grouping dimension. A drop down menu opens. 15. Enter the hierarchy levels in the "Hierarchy Depth" field. 16. Drag measures and dimensions to the attributes field to add to the table. Notice the grouping dimension is added by default in the attributes field. 141

142 17. Enable "Exclude Parent" to hide the parent in the hierarchy tree view. NOTE: The parent in the hierarchy tree is shown by default. Enabling "Exclude Parent" hides the parent. 18. Click the arrow next to the table column header, to expand or collapse all parent values in the column. 142
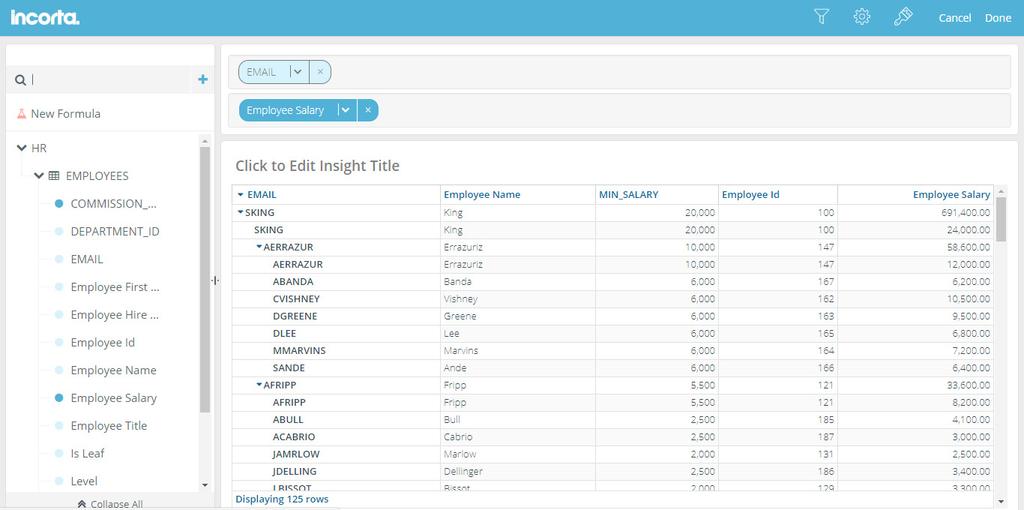
143 143
144 Filters: Attributes, Operators, and Values Filters enable you to focus on specific data based on certain conditions, using filter operators. To apply a filter you need to specify: An attribute to filter on. An operator to set the filter condition. A value to filter by. The following steps will show you how to create a filter: 1. Select the attribute to filter on from the default filter screen. 2. Click the filter operator (e.g. In), next to the attribute. 3. Select a filter operator. 144
145 4. Filter values can be added using one of the the following options: Select values from a list. Type values in the Search/Add box. Paste values from a CSV/XLSX file. Select values from a list 1. Select one or more values. 2. You can locate values using the Search/Add box, and select them from the suggestions. 145
146 3. Erase the typed value to show the selected values at the top of the list. To search for additional values, repeat step 2. Type values in the Search/Add box You can type multiple values separated by either a comma, or Line Break when using the following operators: Starts With, Contains, "In" Does Not Start With, Does Not Contain, "Not In", and "Ends With". 1. Click on Bulk in the bottom of the filter list. 146
147 2. Enable the "Case Sensitive" option to match the letter case of the values and the returned results. This option is disabled by default. NOTE: "Case Sensitive" appears when using the operators resulting in string values (i.e. "Starts With", "Does Not start With", "Contains", "Does Not Contain", "Ends With"). 3. Select a "Delimiter" from the drop-down menu. 4. Enter one or more values seperated by the selected delimiter. 147
148 5. Click Select. Paste values from a CSV/XLSX file Users can copy values from a CSV/XLSX file separated by a comma, or Line Break, and paste them in the Search/Add box using the following operators: Starts With, Contains, Does Not Start With, Does Not Contain, "Ends With" "In", and "Not In". 1. Copy values from a CSV/XLSX file. 2. Paste values from a CSV/XLSX file. 5. Click Filter. Insight Defining Filters You may add filters to your insights to limit the results to a specific range of values Navigate to the Analyzer screen (click the icon at the top of an Insight) and click on the filter icon in the upper right-hand corner of the Analyzer screen. There are two types of Insight filters you can use either individually or simultaneously in an Insight: Filter Individual Values This filter can be added to all visualization types (aggregated or not). You can use it to filter Insights using dimensions, e.g. country. For example, you may want to build a report to show the revenue data, grouped by country, filtered by a specific country value. To add this filter and specify a country value: 1. Click on the filter icon in the upper right-hand corner of the screen, the "Filter Individual Values" field opens. 148

149 2. Drag a dimension, i.e. "country", column from the source elements list on the left-hand side and drop it in the filter field. 3. Click the down arrow corresponding to the dimension. 4. Click on Edit Operator/Values in the drop-down menu, to set the filter operator and values. If you choose the "IN" operator, click Filter in the upper right-hand corner after selecting the filter values. Filter Aggregate Values You can use this filter to filter Insights using measures, e.g. revenue. However, it can only be added to list table visualizations type, and they must be aggregated (i.e. the "Aggregated" item in the Insight Settings menu must be enabled). If these conditions are satisfied, this filter field will open automatically, when clicking the filter icon in the upper right-hand corner of the screen. If either the visualization type is something other than "list table", or it is not aggregated, this filter field will not be opened. Only the "Filter Individual Values" filter field will open. You may want to use this filter type to show the revenue data, grouped by country, where the revenue is greater than $8M. To add this filter and specify a revenue value: 1. Click on the filter icon in the upper right-hand corner of the screen, the Filter Individual Values and Filter Aggregate Values fields open. 2. Drag a measure, i.e. "revenue", column from the source elements list on the left-hand side and drop it in the filter field. 3. Click the down arrow corresponding to the dimension. 149

150 4. Choose a type from the Aggregation field list. 5. Click on Edit Operator/Values in the drop-down menu, to set the filter operator and values. 6. Press Enter. Insight Settings Menu Use the gear icon to access non-filter settings for an Insight. The Settings menu of an Insight is divided into two tabs; the Settings Tab and Layout Tab. Details about the items included in each tab is provided below each of the following screenshots: 150

151 Settings Tab Max Rows: This setting limits the number of rows of data from the grouping dimension to be included in the Insight. Max Groups: Use this to return a large table where there is a group-by of 500,000 values or more. Logarithmic: Switch on to focus on the part where data points starts fluctuating. For example, if all the horizontal data points on the chart share the same vertical values up to a certain point, you may want to start the vertical dimension at this point to increase the scale and focus on the fluctuating data. Switching Logarithmic on does this automatically. Auto-Refresh: Auto-Refresh is set on by default. Leave it on if you want the Insight to update automatically whenever the underlying data is updated. Set it off if you want the Insight to update only when a new session is begun, as when the underlying data set is very large. Join Measures: Calculating the group-by function across joined tables is a very complex operation impacting the engine s performance, and thus disabled by default. Setting the join-measures feature on enables this calculation. A popular example for this is calculating product cost grouped by years. 151

152 Layout Tab Rotation: Select the labels orientation on the horizontal axis of the Insight. Legend: Switch on to display what dimensions the chart colors represent. Values: Switch on to display the values on the charts. X-Axis Labels: Switch on to display labels on the x-axis. X-Axis Title: Switch on to display the title of the x-axis. Y-Axis Labels: Switch on to display labels on the y-axis. Y-Axis Title: Switch on to display the title of the y-axis. Y-Axis Min: Provide the minimum value of the displayed y-axis value. Y-Axis Max: Provide the maximum value of the displayed y-axis value. 152
153 Create Dashboard Filters Incorta Analytics allows users to filter the data within a dashboard using three types of dashboard filters; Prompts, Dashboard Applied Filters, and Presentation Variables. To access and set up dashboard filters: 1. Click the gear icon in the upper right-hand corner of the dashboard. 2. Click on "Filters and Prompts" to open the Dashboard filters page. A blue dot next to a tab indicates that there is at least one column is added to that tab. Prompts The dashboard prompts allow users to set attributes to be shown in the dashboard runtime filter (funnel icon in the dashboard). You may also choose to either create a new formula column, or use formula columns created within a business schema, to use in prompts. To create a new formula column from 153
154 within a business schema, see Create Formula Columns. To set up a Prompt: 1. Click on the "Prompts" tab, from the "Dashboard filters" screen. 2. Drag a data element (column name) from the Source Elements List on the lefthand side of the screen into the Prompts field. 3. Enable the Default Filter toggle button to apply the filter by default when the user opens the dashboard. The user will then have the option to remove the filter from the dashboard. 4. Enable the Mandatory Filter toggle button to make the filter mandatory to apply when the user opens the dashboard. This option appears only when the "Default Filter" option is enabled, and the user will not have the option to remove the filter form the dashboard. 5. Select the attribute, values, and operator for the default filter. 154

155 6. Click on Filter in the upper right-hand corner of the drop-down menu. 7. Click Done in the upper right-hand corner of the screen. 8. Click on the funnel icon to the left of the search box, a drop-down menu opens. 9. Select the attributes and values for the filter to apply to the dashboard. Dashboard Applied Filters Applied filters allow users to set and apply filters to any dashboard using specific values. These filters may either be default or mandatory. Dashboard viewers may remove an applied "Default Filter" from a dashboard, but cannot remove a "Mandatory Filter". 155
156 To set up a Dashboard applied filter: 1. Click on the "Applied Filters" tab. 2. Drag a column from the Source Elements List on the left-hand side of the screen into the "Applied Filters" field. 3. Click the down arrow of the column, a drop down menu appears. 4. Click Edit Operator/Value(s) to get a list of the available parameters for the Applied Filter. 5. Click Filter in the upper right-hand corner of the drop-down menu. Presentation Variables Users with "Analyzer User" role may use presentation variables in filters and/ or formulas, to apply to specific Insights within a dashboard. For example, if you define a presentation variable using a column (e.g. Products) with string values (e.g. computers, cameras, etc.) you can apply that variable as a filter to specific Insights. However, if you define a presentation variable (e.g. Tax) with a default numerical value (e.g. 0.1), you can use that variable in a formula column or any formula of specific Insights. After creating a presentation variable in a dashboard, it gets displayed in the top center of that dashboard, so that viewer users can easily change its value, by clicking it and selecting/entering a different value. This will update only the Insights using the presentation variable. 156

157 Define a Presentation Variable When defining a presentation variable, it is important to decide on whether you are going to use it in a filter or in a formula. This affects the data type to choose for the variable. For example, using it in a filter requires a string data type, where as using it in a formula requires a numerical data type (e.g. long, double, int.). To define a presentation variable: 1. Click the "Presentation Variables" tab. 2. Drag "New Variable" from the left-hand side of the screen. 3. Click the down arrow of "New Variable", a drop down menu appears. Field Display Name Variable Data Type Default Value Description This is the name that will be displayed in the top center of the dashboard. That is the name that will be used to call the variable. Set the data type for the variable in this field, e.g. string to be used in filters, or numerical to be used in formulas. Enter a default value for the variable, ensuring that it exists. 157

158 4. Click Done in the upper right-hand corner of the drop down menu. 5. Click Done in the upper right-hand corner to go to the dashboard screen. Apply a presentation variable in a filter To apply a presentation variable in a filter: 1. Click on the icon in the upper right-hand corner of an Insight to go to the Analyzer mode. 2. Click on the filter (funnel icon) in the upper right-hand corner of the screen. 3. Drag the column you choose when creating the variable, from the left-hand side of the screen, into the "Filter Individual Values" field. 4. Click the down arrow of the column added, a drop down menu appears. 5. Click Edit Operator/Value(s) to select the variable, a drop down list appears. 6. Type $ before the variable name to call the variable, i.e. $<VAR_NAME>. Ensure 158

159 the variable name matches the one you chose when crearting the variable. 7. Press Enter, then click Filter in the upper right-hand corner of the drop down menu. 8. Click Done in the upper right-hand corner of the screen. The variable will be applied to the selected Insight only. Apply a presentation variable in a formula column A common use of a presentation variable in formulas is using it in a formula column. The values of the formula column will update automatically when dashboard viewers select/enter a different value for teh variable. To use a presentation variable in a formula column: 1. Click the icon in the upper right-hand corner of an Insight to go to the Analyzer mode. 2. Add a "New Formula" column in the measure field. 159

160 3. Click the down arrow of "New formula" to open the drop down menu. 4. Provide the formula name in the "Name" field. 5. Click in the "Formula" field. The "Formula Builder" window opens. 6. Insert the formula using the variable previously created. 160
 to select/enter a different value. Only the Insights using that presentation variable will update automatically.")
161 7. Click Done. 8. Click Done in the upper right-hand corner to go to the dashboard screen. 9. Click on any variable (in the top center of the dashboard) to select/enter a different value. Only the Insights using that presentation variable will update automatically. Show Empty Groups Show Empty Groups is a feature that can be used to display aggregated 161
162 dimensions that have no child values. Suppose a child table (e.g. Sales transactions) has a foreign key referencing a parent table (e.g. Country). Using Show Empty Groups, you can build an Insight showing countries (parent) with no sales (child values). The following steps explain how to Show Empty Groups on a table Insight, containing different countries (Parent) with their corresponding revenue (child) values. Notice in the following screenshot, each row in the Country column has a non-zero value in the Revenue column. To enable Show Empty Groups: 1. Click the pen icon in the upper right-hand corner of the Insight to open the Analyzer mode. 2. Click on the down arrow next to a (parent) dimension to show its null child values (e.g. Country). The drop-down menu appears. 162

163 3. Enable the Show Empty Groups. 4. Click Done in the upper right-hand corner of the page to exit the analyzer mode. Notice that dimensions with null (child) values are now displayed in the table. 163
164 The Formula Builder The Formula Builder makes it simple to create a complex formula expression. Formulas are color-coded in the formula builder, displaying functions in red, variables in black, operators in purple, numeric parameters in blue, and string parameters in green. To access the Formula Builder, click inside any "Formula" box, wherever found. For example, you may create a function in the Create Formula Columns section or in Using a Formula Filter on Measures. The Formula Builder opens. On the left side of the page is a list of columns, pre-populated according to the underlying schema definition. To add columns from additional schemas, click the +. To build a formula expression: 1. Select a function category from the function drop-down menu to select a formula. 164
165 2. Select a function, it will be automatically inserted into the formula field. 3. Click on the "+" appearing when hovering over a column name in the panel on the left-hand side. The formula builder inserts its full path of that column between the parentheses, in the format "<SCHEMA_NAME>.<TABLE_ NAME>.<COLUMN_NAME>", e.g. "SALES.SALES.COST_OF_GOODS". 4. Use the Variables drop down menu to select and insert variables. Variables are displayed in yellow. Formula Functions For a complete list of functions, see App. B: Formula Functions. Formula Variables For a complete list of formula variables, see App. C: Date Variables. 165
. 2.")
166 URL drill-down The URL drill-down feature can be used in Insights of type list table to link its rows to external URLs (e.g. EBS). To add a URL drill-down to an Insight: 1. Open the Insight in Analyze mode (by clicking the pen icon in the upper right-hand corner of the Insight). 2. Open the measure definition and provide the address you would like to drill down to in the URL field: 1. Note that the URL feature is only available for reports of type "List", and for measures when "Aggregated" is turned off in the dashboard settings menu. To turn off the "Aggregated" feature, click on the gear icon in the upper righthand corner of the Insight in the Analyze mode. 166

167 2. Click Done to save and exit the analyze mode. 167

168 Advanced Features Base Table The "Base Table" feature allows you to join two tables that are not directly joined (i.e. tables that do not share common dimensions). To use it, a transactional table has to be selected as the Base Table, or driving table, in order to join the two tables. Example: Consider a SALES table that is joined with a CUSTOMERS table, which is joined with a COUNTRY table. Now assume that there is a PRODUCT table and it is joined with the SALES table, but not to the COUNTRY table. If you try to build a report showing the countries where the products were sold, you will get an error because the COUNTRY table is not directly joined to the PRODUCTS table. However, if you use the transactional table (SALES in this case) as the Base Table, this information can easily be obtained. Refer to the ER diagram below for clarification, and walk through the following steps to learn more about this feature: Assumptions: You have a schema where there is a transactions table (SALES table in this example), and it is joined with a CUSTOMERS table that is joined with a COUNTRY table. The SALES table should also be directly joined with the PRODUCTS table. (Please note that in this example, the COUNTRY table is not 168
169 directly joined with the PRODUCTS table.) Build a Table Insight containing the countries versus the products 1. From a new, or any, dashboard page, click on the + in the upper righthand corner of the screen to add a new component (Insight) to the dashboard. 2. When the Choose a Visualization window appears, select the Table chart from the TABLES list. The Insight opens in Analyzer mode. 3. Click on the + next to the search box at the top of the source elements list, on the left-hand side of the screen. The schemas and tables submenu opens to the right-hand side. 4. Select "Tables" in the drop-down menu at the top of the submenu. A list of schemas and included tables appears. 169

170 5. Select the "SALES" schema, or the "COUNTRY" and "PRODUCTS" tables individually from the "SALES" schema. Notice the schema/tables being added to the list on the left-hand side. 170

171 6. Click Done at the bottom of the submenu on the right-hand side, to close it. Note: Since we would like to see the number of products sold in each country, we need to drag the Product column to the measure field and drag the Country column to the grouping dimension field. 7. Type Country in the search box to quickly locate it and drag it into the list to the "grouping dimension" field. Another option is to hover over "Country" in the search results and click on the "+" that appears. The item will automatically get placed in the "grouping dimension" field, if the circle next to the item is light-blue. If the circle is dark blue, it will pop in the "measure" field. In any case, you can move any column from one field to the other. 8. Similarly, type Product in the Search box and place it in the "measure" field. Note: The Base Table feature can only be turned on for the elements in the measure field (i.e. Product in this example). 9. Enable "Aggregation" in the Insight Settings menu in the upper right-hand corner of the screen. 171

172 10. Ensure only distinct data is returned, by clicking on the down arrow corresponding to the Product element. The dimension menu appears. 11. Change "COUNT" TO "DISTINCT" in the "Aggregation" field of the measure drop-down menu. 172

173 12. Click on the "Advanced" tab, to set the base table for this measure. 13. Enable the "Base Table" feature. A new field "Base Table" appears to set the base table. 173
.")

174 14. Click on Set Base Table Field to locate the base table ("SALES" in this example). That is, the common table that is joined to both "County" and "Product". First, locate the schema where the table is located (the schema name is also "SALES" in this example). 174

175 15. Select the "SALES" schema from the schemas list. A list of the tables within the "SALES" schema appears. 16. Select the "SALES" table from the tables list. A new list of all the table columns appears. 175

176 17. Select any column. The base table Insight is now ready and updated with the number of products in each country. 176
177 Note: The Sales table is selected as the Base Table since it is joined with both; the Country and Product tables. (Again, the Country table is not directly joined with the Product table.) 18. Now if you would like to build an Insight Table showing the number of countries where each product is sold, repeat the previous steps, swapping "Product" with "Country". 19. Notice the table is updated, listing each product corresponding to the number of countries where it was sold. 177
178 Query Plan Query Plan is a feature that can be used to show the relationship between the tables used within an Insight in an Entity Relationship Diagram (ERD). The diagram can be accessed from the measure elements only, i.e. elements in the measure field. To access the ERD of the elements used within an Insight: 1. Navigate to any Insight. 2. Click on the pen icon in the upper right-hand corner of any Insight. The Insight opens in Analyzer mode. 178
179 3. Click on the down arrow of the element in the "measure" field. 179
 is joined with the PRODUCTS table (containing the \"Category\" column).")
180 4. Click on the "Advanced" tab. 5. Click on Query Plan. A window opens showing the relationship between the tables used by this Insight. In this case, it shows that the SALES table (containing the "Revenue" column) is joined with the PRODUCTS table (containing the "Category" column). The SALES table is also joined with the CUSTOMERS table, which is joined with the COUNTRIES table (containing the "Country" column). 180
181 Data Hub Incorta analytics 3.3 introduces Data Hub. Data Hub is a tool that enables Incorta to act as a PostgreSQL database, enabling users to utilize Incorta s powerful engine performance and features, even through other BI tools (e.g. Tableau, MicroStrategy, Power BI). For example, Users can choose to load their data into the Incorta engine (memory) so that they can take advantage of its robust performance. Or, they can opt to load their data into Incorta s staging area (if the data is too large for the Incorta assigned memory), and access this data from other BI tools through the SQLi port, set in the admin UI. Refer to the following table for an overview of the pros and cons of Data Hub. Scenario Pros Cons All Schema tables are loaded in Memory Analyze users are flexible to build any Insight (since all the data will have been loaded in memory). No need for technical database (e.g. SQL) expertise. Huge memory consumption. Degraded performance when building Insights, since querys will be esecuted at runtime. Schemas built on Data Hub Enhanced performance when building/editing Insights, since the querys will already have been loaded in memory (at the time of loading the schema). No need for large memory. Analyze users do not have the flexibility of building an Insight without referring to the schema manager. Query tables will cause schemas to take a long time to load. Important Terms Before proceeding, it is important that you become familiar with the following terms: 181
182 Loaded Source Schema, containing all the tables from the data source (e.g. Oracle, MySQL). This schema can be loaded: Fully in memory. Partially in memory, and partially in the staging area. Fully in the staging area. To learn about creating a source schema, see A. Create a New Schema from the Schemas Page or B. Create a New Schema using the Schema Wizard. Loaded Query Schema, only if you are planning to use Incorta as your BI tool. This schema contains only the query tables to avail for Analyzer users when building dashboards. These queries will depend on the business user s requirements, and must be created by users with the Schema Manager role. The following sections provide information on how to Connect to Data Hub from external BI tools and how to Use Incorta as your BI tool with Data Hub. Connect to Data Hub from external BI tools In order to connect to Incorta s Data Hub from external BI tools (e.g. Tableau), use the following steps: 1. Create a connection to Data Hub. In the external BI tool, provide the following parameters: Data Source type: Choose PostgreSQL as your data source type. Data Source Name: Provide the tenant name used in Incorta. Username/Password: Provide Incorta s login credentials in the appropriate fields. Connection string: Provide a connection string including Incorta s host server, port number (5436 to connect to Incorta s engine, or 5442 to connect to Data Hub), and the tenant name. 2. Discover the source schema tables created in Incorta as defined in Important Terms. To learn about creating a source schema, see A. Create a New Schema from the Schemas Page or B. Create a New Schema using the Schema Wizard. Now you are ready to build dashboards in your BI tool. 182
183 Use Incorta as your BI tool with Data Hub If you are planning to use Incorta as your BI tool with Data Hub, use the following steps: 1. Create a New Data Source Connection. 2. Create a query schema. 3. Build a Dashboard. Create a New Data Source Connection In order to deploy Incorta with Data Hub, the first step is to create a connection with Incorta as PostgreSQL, using the following steps: 1. Click the "+" symbol in the upper right-hand corner of the "Data Sources" page. The Add New Data Source dialogue window opens. 2. Provide the following parameters: Data Source type: Choose PostgreSQL as your data source type. Data Source Name: Provide the tenant name used in Incorta. 183
184 Username/Password: Provide Incorta s login credentials in the appropriate fields. Connection string: Provide a connection string including Incorta s host server, port number (5436 to connect to Incorta s engine, or 5442 to connect to Data Hub), and the tenant name. 3. Click Add Data Source. The Test Connection button appears. 4. Click Test Connection. The connection test status window appears.. 5. Click OK. 184
185 Create a query schema As mentioned before, a query schema contains query tables. Depending on the business user s requirements, users with the "Schema Managers" role can build query schemas based on the query table(s) they create, and load them. In this step, Schema Manager can use the schema wizard to discover tables located in the source schema initially created in Incorta. To learn about creating a source schema, see A. Create a New Schema from the Schemas Page or B. Create a New Schema using the Schema Wizard. Once the query schema is properly defined and loaded in Incorta's memory, users with "Analyzer" role can easily use it to build Insights. To learn more about creating a query schema with query tables, see Create a schema containing query tables. Build a Dashboard Now that you have properly defined source and query schemas, you are ready to build dashboards and Insights without having to load all of your data in Incorta's memory. All query tables defined within the query schema should be displayed in the source elements list in the Analyzer mode. To learn how to build a new dashboard see Create a New Dashboard from the "Content" Page. 185

186 Share, send, or schedule a dashboard Share a dashboard You can share a dashboard either with internal or external users. To share a dashboard: 1. Navigate to the dashboard page. 2. Click on the export icon in the upper right-hand corner of the page, a dropdown menu opens. 3. Click Share, the sharing wizard window opens. 186
187 4. Click on the Share icon, or the "+" corresponding to "Shared with". 5. Provide the users/recipient addresses/ groups and set a privilege for them. 6. Click Save. Send a dashboard This feature allows you to send dashboards to users/groups/shared folder, in the same way you would send a regular . Starting from release 3.1.9, users can add Cc/Bcc recipients, a subject line, and body text in the dashboard . This release also includes the all-new Incorta-over-Incorta feature. This feature enables re-using formula-generated data of one CSV/XLSX Insight in another dashboard. That is, after creating a CSV/XLSX table Insight, containing formula columns, Incorta Analytics enables you to send this data to a specific folder on the same Incorta Server as a CSV/XLSX file. This file can then be used as the data source for an Incorta schema, which can be used in building other dashboard(s). Thus, this feature enables building Incorta dashboards on other existing Incorta dashboards. 187

188 To send a dashboard: 1. Navigate to any dashboard. 2. Click on the export icon in the upper right-hand corner of the page, a dropdown menu opens. 3. Select "Send", the send wizard window opens. 188
189 4. Type the subject in the Subject field. This field is optional, if you leave it blank, the file name will be used. 5. Type your message in the Body field. This field is optional. 6. Check Hide Notification Text, if you want to hide the auto-generated text (which contains the sender name, the dashboard name, and the filters applied to CSV/XLSX tables) from the body of the Select from the following formats to use for the sent dashboard: HTML: The dashboard will be sent in the same layout as displayed. XLSX: An XLSX file will be sent only for the tables and pivot tables in the dashboard. CSV: A CSV file will be sent only for the first table in the dashboard. 189
190 NOTE: Check Append Timestamp to append file names with a timestamp when they are generated. Uncheck this option to overwrite a file, if it already exists in the destination shared folder. 8. Click on "+" corresponding to To, to add dashboard recepients. 9. Search for users by their names, groups, or addresses. In this step, you can specify a destination folder for the sent dashboard. NOTE: The dashboard sent to the shared folder can be used as a data source. 10. Click Add. 11. Repeat the steps 6-8 to add Cc and Bcc recipients. 12. Click Send. 190
191 Schedule a Dashboard With Incorta Analytics, you can easily schedule dashboards to be sent to internal users, groups, or even external users with external addresses either once or at scheduled intervals. For a list of suspended, active, and completed dashboards scheduled jobs, go to the "Scheduler" page, by clicking on the clock icon in the menu on the left-hand side of the screen. To learn more about scheduling a dashboard to be sent to users, use the following example. The following example will walk you through the steps of scheduling the Top and Bottom 10 Sales dashboard to be ed at specified intervals, e.g, hourly per day: 1. Navigate to the dashboard page ("Top and Bottom 10 Sales" in this example). 191
192 2. Click on the export icon in the upper right-hand corner of the page, a dropdown menu opens. 3. Click "Schedule". The scheduler window appears. 4. Select a "Start On" date and time to schedule a dashboard to send. You can either type them in the respective fields or select them in the pop-up calendar (click on the calendar icon) and clock (click on the clock icon). 192
193 5. Select a recurrence of the scheduled job, e.g. "Daily". 6. Select a job frequency in the "Every" field, e.g. 1, and a time unit, e.g. "day(s)". 7. Select an end date in the End By or No End. 8. Provide a job name and a description in the "Job Name" and "Description" fields, respectively. 9. Scroll down to provide more scheduling details. 10. Fill the rest of the fields, just like when you Send a dashboard. After completing the previous steps, a scheduler job gets created and can be viewed/deleted in the "Scheduler" page. To learn more about navigating dashboards scheduled jobs, see Dashboard schedules. 193
194 The scheduler and data alerts The "Scheduler" section is the place that contains a list of all the scheduling jobs for dashboards and schemas loading (not business schemas), in addition to Data Alerts. To access it, simply click on the clock icon in the menu column on the left-hand side of the screen. This page contains three tabs for "Dashboards", "Schema Loads", and "Data Alerts", displaying a list of all the scheduled jobs for the chosen tab. Dashboard schedules Dashboards schedules can only be viewed or deleted in the "Scheduler" page. To schedule dashboards to be sent to other users, refer to Schedule a Dashboard. To view a list of all the scheduled jobs for dashboards: 1. Click on the "Scheduler" item (clock icon) in the menu column on the lefthand side of the screen. 2. Click on the drop-down menu in the upper right-hand corner of the "Jobs" table to toggle the view between "All", "Active", "Suspended", and "Completed" dashboard schedule jobs. Note that jobs with no recurrence end date would not show in the "Completed" jobs list, until an end date has been set. 3. Click anywhere (not the "Dashboard" name) on any job row to view the details for that job. 194
195 4. Click on the value for the "Dashboard" column to view that dashboard. 5. If you would like to delete a dashboard scheduled job, select that job. The "Actions" menu appears in the upper right-hand corner. 6. Click on the "Actions" drop-down menu. 7. Select "Delete selection". The deletion confirmation box appears. 8. Click Delete. Schema schedules Incorta Analytics offers the option to schedule schemas to load automatically, replacing the previously known "Automatic Refresh". Scheduled jobs for schemas can be created, viewed or deleted in the "Scheduler" page. To create a schema load schedule job, you can either Schedule a schema load from the "Scheduler" page or Schedule a schema load from the schema definition page. View/delete schema load schedule jobs 1. Click on the "Scheduler" item (clock icon) in the menu column on the lefthand side of the screen. The "Scheduler" opens to the "Dashboards" tab by default. 195
196 2. Click on the "Schema Loads" tab to see the scheduled jobs for schema loads. 3. Click on the drop-down menu in the upper right-hand corner of the "Jobs" table to toggle the view between "All", "Active", "Suspended", and "Completed" schema schedule jobs. Note that jobs with no recurrence end date would not show in the "Completed" jobs list until an end date has been set. 4. Click anywhere (not the "Schema" column) on any job row to view the details for that job. 5. Click on the value for the "Schema" column to view the definition page for that schema. 6. If you would like to delete a schema loading schedule job, select that job. The "Actions" menu appears in the upper right-hand corner. 7. Click on the "Actions" drop-down menu. 8. Select "Delete selection". The deletion confirmation box appears. 196
197 9. Click Delete. Schedule a schema load from the "Scheduler" page One place to schedule a schema load job is the "Scheduler" page. The other place to access the scheduler tool for schemas is the schema definition page, see Schedule a schema load from the schema definition page. Schedule a schema load from the "Scheduler" page 1. Navigate to the "Scheduler" page for schemas, see View/delete schema load schedule jobs. 2. Click "+" in the upper right-hand corner of the screen. The scheduler window opens. 3. Provide a job name and a description in the "Job Name" and "Description" fields, respectively. 4. Select a schema to load. 5. Select the type of loading from the drop-down list. 6. Select a "Start on" date and time to schedule a dashboard to send. You can either type them in the respective fields or select them in the pop-up calendar (click on the calendar icon) and clock (click on the clock icon). 197
198 7. Select a recurrence of the job to be, e.g. "Daily". 8. Select a job frequency in the "Every" field, e.g. 1, and choose a time unit, e.g. "hour(s)". 9. Select an end date (if any), in the "End By" field. 10. Confirm all the entries and click Schedule. After completing the previous steps, a scheduler job gets created and can be viewed/deleted in the "Scheduler" page. To learn more about navigating dashboards scheduled jobs, see Dashboard schedules. Schedule a schema load from the schema definition page In addition to the "Scheduler" page, you may schedule a schema load job from the schema definition page using the following steps: 1. Navigate to the "Schemas & Session Variables" page, accessed from the menu column on the left-hand side of the screen. 198
199 2. Select a schema. Then, select "Schedule" in the "Actions" menu in the upper right-hand corner of the screen. The scheduler window opens. 3. You can also open the scheduler window from any schema definition page. Select a schema. The definition page opens for that schema. 4. Click Load in the upper right-hand corner of the screen. A drop-down menu appears. 5. Select "Schedule". The scheduler window opens. 199
200 6. Repeat steps 3-10 from Schedule a schema load from the "Scheduler" page. As shown, when opening the scheduler window from the schema page, you do not need to provide a schema as the menu to select a schema is not present. Data Alerts Incorta Analytics supports "Data Alerts". This feature tests a trigger on a scheduled basis and delivers an Insight via to a list of recipients if the trigger condition is true. Triggers are based on a selected table and are true if the table has at least one row of data, and false if the table is empty. That is, to use this feature, the logged-in user would need to select a target dashboard that already exists, and creates a condition table Insight (containing a filter). If the condition table returns at least one row, the condition is true and the target dashboard will be sent to the recipients listed in the "Alert" editor. If the table is empty, the condition is then false, and thus no alerts will be sent. To access the "Data Alerts" feature: 1. Navigate to the "Scheduler" section of the Incorta Analytics web UI, by clicking on the clock icon in the menu column on the left-hand side of the screen. The "Scheduler" opens to the "Dashboards" tab by default. 200

201 2. Click on the "Data Alerts" tab. 3. Select "Active", "Suspended", "Completed", or "All", alerts in the dropdown menu to display a list of the selected alerts filter. 4. Click on the "+" icon in the upper right-hand corner of the page to create, or import, an alert. The "Alert Editor" window opens. 201
202 5. Provide the following fields: Alert Name: Provide a name for the alert, as this field is mandatory. The name must be unique per logged-in user, and it is case sensitive. Alert Description: Optionally, provide a description for the alert. Type: Select the format (HTML/XLSX/CSV), which is a mandatory field. HTML is the default format for this field. Target: Click the pen icon to select a dashboard (owned by, or shared with, the logged-in user) to be sent in this mandatory field. The dashboard list opens. When sending a target dashboard, Default/ Mandatory Prompt filters, Applied filters, and dashboard default filter options will be considered. 202
, then the condition will be evaluated as true. Otherwise, it is considered false.")
203 Condition: Use the pen icon to create a condition table Insight (using a filter on that Insight) to be sent to the engine. The Analyzer opens. If the table gets returned from the engine containing data (rows), then the condition will be evaluated as true. Otherwise, it is considered false. Start By: Set the date, time, and time zone when the condition 203
204 evaluation should start. Recurrence: Set the recurrence of evaluating the condition. This is a mandatory field. Send To: Click the "+" icon to add the alert recipients, which could be any combination of the Incorta users/groups and s. Then, type the names, groups, or addresses of the dashboard recipients. You can also select from the suggestions appearing as you type. Click Add, or Cancel. Click Done in the upper right-hand corner of the screen to finish creating the data alert. 6. Select an alert from the Data Alerts list, the Alert Editor window appears. 7. Select one or more data alerts, and click on the "Actions" drop-down menu in the upper right-hand corner to: Export the data alert(s). Delete the selection(s). Note: The Data Alerts feature is available to create and edit for users with the following roles: Analyze User. Individual Analyzer. SuperRole. (When the "Super User" mode is enabled, users with this role may view and edit other users' alerts.) 204
205 App. A: Build the Right Insight What's an Insight An Insight is the component that helps you visualize your data, and is placed in the dashboard. Insights in Incorta Analytics are divided into three categories: Tables Charts Gauges Part of designing an effective Insight is selecting the appropriate visualization type. In this Appendix, you will find a description of each of these types. The choice of a visualization type is not set in stone; after defining an Insight in the Analyzer, you can still change the visualization type to whatever you find as the best fit. You can even change a visualization type to a completely different one, e.g. you can transform a table into a column chart. In the Analyzer, you may find one, two, or three fields depending on the selected visualization type. The common field you will find across all types is the "measure" field, which is the attribute you want to measure (e.g. revenue). You can also drag the attributes you want to group by to the "grouping dimension" field (e.g. Country). Finally, you may also choose to add coloring attributes by dragging them to the "coloring dimension" field (e.g. Product Subcategory). 205


206 Types of Tables Pivot Table Use a pivot table to plot two dimensions against each other. The attributes entered in the "grouping dimension" field define the rows in the pivot table. Those entered in the "coloring dimension" field define the columns in the pivot table. Finally, the attributes entered in the "measure" field define the cells of the pivot table. The "grouping dimension" and the "coloring dimension" both are required to build a pivot table. Table This is the simplest mode of a table. All attributes and measures have to be entered in the "measure" field. You can enter columns from different tables, if they are joined together. If a column shows as Null, this may indicate a missing join, or joins in the wrong direction. Aggregated The user can group-by the data by certain dimensions. The group-by dimensions have to be dragged to the "grouping dimension" field, while the rest of the attributes should be dragged to the "measure" field. By default, Incorta will aggregate the data, grouping by the "grouping dimensions." User can select not to Aggregate, by turning off the Aggregated button from the Settings drop-down menu in the upper right-hand corner of the screen. Aggregated - Total This table type has a row added at the bottom where the sum of all the rows would be calculated. 206

 Chart Plot grouping dimensions on the (horizontal) x-axis,and measures on the (vertical) y-axis.")

207 Aggregated - Subtotal This table type has the totals calculated and displayed for each row. Aggregated - Subtotal - Total In addition to the Aggregated - Subtotal table, this table type has a row added at the bottom where the sum of all the rows would be calculated. The values in this row would be the same as those in the total row, if the Aggregated - Total were chosen. Types of Visualizations Column (Vertical-Bar) Chart Plot grouping dimensions on the (horizontal) x-axis,and measures on the (vertical) y-axis. The first added attribute to the "grouping dimension"field is used for data slicing. Additional attributes to this field enables the user to click on one group, filter the data on that value, and drill down to the next dimension. Additional measures are represented by different colors. Bar Chart This chart is similar to the column chart representing the data in horizontal bars rather than vertical columns. Using this chart, you may plot grouping dimensions on the (vertical) y-axis versus measures on the (horizontal) x-axis. Additional measures are represented by different colors. 207

, you can filter on one Product Category, drill down to the Products in that category, and see data for all the years.")

208 Stacked-Column Chart Use this chart to display multiple categories in each column. The colored bands represent slicing of the total by the coloring dimension. Attributes in the grouping dimension field define the x-axis of the chart. The bar represents the measure in the chart. The bar can be sliced according to the attributes in the "coloring dimension." If you add two attributes to the "grouping dimension" field (e.g. Year and Quarter), you can filter by one year, drill down to quarters in that year, and keep data sliced using the coloring dimension. If you add two attributes in the coloring dimension field (e.g. Product Category and Product), you can filter on one Product Category, drill down to the Products in that category, and see data for all the years. However, you cannot add two attributes to the grouping dimension field and two attributes to the coloring dimension field for this kind of chart. You can also use this type of chart to stack multiple measures, by adding two or more measures to the measure field and no attributes to the coloring dimension field. You cannot add multiple measures and a coloring dimension in this type of chart. Stacked-Bar Chart This chart is similar to the Stacked-Column chart representing data in horizontal bars rather than vertical columns. Percentage Column Chart Use this chart type to represent data in columns sliced by the coloring dimension and represented as a percentage of a total. This chart is similar to the Stacked-Column Chart in terms of adding dimensions and measures. However, it is not used to analyze measure values. It represents the relative percentage of each coloring (or slicing) dimension compared to the whole measure value for that grouping dimension value. 208


209 Percentage Bar Chart As in the Percentage Column Chart, use this chart type to represent data in bars sliced by the coloring dimension and represented as a percentage of a total. Combo Dual Axis Chart Use this chart when you want to plot two different measures on the same y-axis. The two measures will have the same scale. You only need to add a grouping dimension, and two measures to obtain this chart. Additional grouping dimensions will be used for drill-down. This type of chart is used when both analyzed measures have similar ranges. Dual Axis Chart Use this chart type to plot two different measures on two separate y-axes, which may have different scales. This type requires at least one grouping dimension only, however, more grouping dimensions may be added to drill down. Dual Axis Chart Use this chart type to plot two different measures on two separate x-axes, which may have different scales. This type requires at least one grouping dimension only, however, more grouping dimensions may be added to drill down. Area Chart In this type of chart, the areas under the lines for multiple data series are overlayed on each other. This chart requires a grouping dimension and a measure. A coloring dimension can be added to slice the area for each dimension value by another dimension. Similar to the Stacked-Column Chart, you can choose to stack two measures, but then you cannot add a coloring dimension in that case. 209
210 Stacked-Area Chart This type of chart is also called a Subdivided Surface Chart or a Band Chart. If possible, use the Sort By function in your filters to plot the smoothest trend at the bottom of your chart. Only the data series plotted at the bottom of the chart starts at zero on the y-axis, each following series is plotted relative to the series below it. This chart type behaves similar to the Stacked-Column Chart except that the data is shown as colored areas instead of separate bars. Percentage Area Chart This chart shows the area under the line as a percentage of the total. It behaves similar to the 100-Percent-Stacked Column Chart, except that the data is shown as colored areas, instead of separate vertical bars. Line Chart This graph connects data points in the series with a line, but does not indicate exact values between data points. Additional measures will be represented by separate colored lines. Stacked-Line Chart Only the data series plotted at the bottom of the chart starts at zero on the y-axis, each following series is plotted relative to the series below it. This chart behaves similar to the stacked column chart, except that the graphs are drawn with lines instead of vertical bars. Percentage Line Chart This graph shows each data point in the series as a percentage or part of 100% or of another specified threshold. This chart is similar to the 100-percent-stackedcolumn chart, except that the data is plotted as lines instead of vertical bars. 210


211 Spider Chart A spider chart can be used to represent actual vs target values. A radar chart can be used to represent multiple measures against 3 or more grouping dimension values. Pyramid Chart A pyramid chart can be used to represent categories based on their hierarchy, importance, or size. A pyramid chart requires one grouping dimension and one measure. It is the same as a funnel chart, but inverted. Treemap Chart Treemap charts can be used to represent hierarchical structures, using a specific column for coloring. The size of the rectangle represents the value of the grouping dimension. Treemaps can also show the 2nd level of the grouping dimensions. Any hierarchical type data can be shown with a glimpse into the next level. They are useful for showing two levels of values at the same time. Treemaps only show 1 measure but 2 levels. Heatmap Chart Heatmap charts can be used to represent values of each slot using varying darkness. That is, the darker the slot, the higher the value it represents. Pie Chart Use a pie chart to display distinct categories of data. It can be used to slice one measure by one grouping dimension. Additional grouping dimensions can be added to allow for drill down from one dimension to the next. Pie Donut Chart Use a pie chart to display distinct categories of data. It can be used to slice one measure by one grouping dimension. Additional grouping dimensions can be added to allow for drill down from one dimension to the next. 211


212 Donut Chart The donut chart is used in the same way as the pie chart, representing data sets in a donut rather than a pie. Time Series Use this chart type to represent a time series uisng splines. This chart requires a minimum of one grouping dimension and a measure. The graph has zooming capabilities that enables the user to zoom in different periods. Additional grouping dimensions may be added for drill-down. Additional measures are represented by separate colored splines. Line Time Series Use this chart type to represent a time series using lines. This chart requires a minimum of one grouping dimension and a measure. The graph has zooming capabilities that enables the user to zoom in different periods. Additional grouping dimensions may be added for drill-down. Additional measures are represented by separate colored lines. Funnel Chart A funnel chart displays values as progressively decreasing proportions. The size of the area is determined by the series value as a percentage of the total of all values. Scatter Chart The Scatter Chart is an X-Y plot in which each entity represented is assigned a symbol called a point shape. Both the x and y dimensions are quantitative; that is, they have magnitude. If there is an independent variable, place it on the x-axis. The grouping dimension is descriptive or categorical. The purpose of a scatterplot is to discover or illustrate correlations between the variables. 212
.")
 in varying sizes according to the element numerical value in the measure field (e.g. revenue).")
213 Bubble Chart Use this chart type for a bubble representation of a grouping dimension (e.g. Product Subcategory) varying in size according to a numeric measure placed third in the measure field. In this chart, you must have three numeric elements in the measure field in a specific order (e.g. Revenue, Cost, Profit). The first measure indicates the x-axis value, while the second measure indicates the y-axis value. Finally, the size of each bubble represents the magnitude of the third measure. Bubble This chart type uses bubbles to represent a grouping dimension (e.g. Country) in varying sizes according to the element numerical value in the measure field (e.g. revenue). The grouping dimension labels each bubble. 213
. To use a map chart ensure the following: 1.")
214 Map Chart When you design a geographical chart in Incorta Analytics, the drill-down path should be Country, State/Province (use a column that contains the ISO state code), and a full address (street address, city, state). To use a map chart ensure the following: 1. The Google API key must be provided in the admin UI (accessed at " NUMBER>/incorta/admin") > Tenants > Tenant Name > Miscellaneous. Please ask the system administrator to do this. 2. For the Lat/Long data, the Lat/long column data must be in the (lat,long) format, e.g , This is one data point. 3. The data must reflect real locations. 4. For full-address data: Notes: a. The county full name (with capital initials) must be provided, e.g. San Mateo. b. The country name can be provided in full name (with capital initials), e.g. United States of America, Egypt, or in 2 or 3-letter code (in upper case), e.g. US, USA, EG, EGY. Google Maps do not allow two map charts in the same dashboard. There was an issue in release 2.8 when combining two columns using a "concat" formula in the grouping dimension of the Map chart blocking it from rendering. The issue is fixed in 2.9. Map Bubble This chart type maps the grouping dimension values (e.g. Country) as bubbles in varying sizes according to the element numerical value in the measure field (e.g. revenue). 214

 versus two measures (e.")

215 TagCloud This chart type displays the grouping dimension values (e.g. Country) as tags in varying sizes according to the element numerical value in the measure field (e.g. revenue). Area Range Chart Use this chart type to plot a grouping dimension (e.g. Country) versus two measures (e.g. Revenue and Cost) using two different lines. The area enclosed between the two lines is shaded. Combination Chart Use this chart type to combine a pie chart with a column chart in the same Insight. 215


216 Types of Gauges Angular Gauge An Angular Gauge shows a single value in relation to a range of values. You can set stops, or ranges on the gauge to be displayed in certain colors, independent of the value. Solid Gauge A Solid Gauge uses a single block of color to show a single value in relation to a range. You can set stops, or thresholds, above or below which a certain color is used. The color of the fill corresponds to the range in which the data value falls. 216
Copyright 1998, 2009, Oracle and/or its affiliates. All rights reserved.
 Clearing Cache COPYRIGHT & TRADEMARKS Copyright 1998, 2009, Oracle and/or its affiliates. All rights reserved. Oracle is a registered trademark of Oracle Corporation and/or its affiliates. Other names
End User s Guide Release 5.0
 [1]Oracle Application Express End User s Guide Release 5.0 E39146-04 August 2015 Oracle Application Express End User's Guide, Release 5.0 E39146-04 Copyright 2012, 2015, Oracle and/or its affiliates. All
About the P6 EPPM Importing and Exporting Guide
 P6 EPPM Importing and Exporting Guide October 2018 Contents About the P6 EPPM Importing and Exporting Guide Scope This guide contains information about import and export formats and the process of importing
New Features in Primavera P6 16.2
 New Features in Primavera P6 16.2 COPYRIGHT & TRADEMARKS Copyright 2016, Oracle and/or its affiliates. All rights reserved. Oracle is a registered trademark of Oracle Corporation and/or its affiliates.
ORACLE USER PRODUCTIVITY KIT USAGE TRACKING ADMINISTRATION & REPORTING RELEASE SERVICE PACK 1 PART NO. E
 ORACLE USER PRODUCTIVITY KIT USAGE TRACKING ADMINISTRATION & REPORTING RELEASE 3.6.1 SERVICE PACK 1 PART NO. E17383-01 MARCH 2010 COPYRIGHT Copyright 1998, 2010, Oracle and/or its affiliates. All rights
Oracle Fusion Middleware. 1 Introduction. 1.1 Supported Functionality and Intended Use. 1.2 Limitations
 Oracle Fusion Middleware Installation Notes for Oracle Business Intelligence Mobile App Designer Trial Edition 11g Release 1 (11.1.1) E49297-01 September 2013 Welcome to Installation Notes for Oracle Business
Oracle. Field Service Cloud Configuring and Using Reports 18B
 Oracle Field Service Cloud 18B Part Number: E94743-02 Copyright 2018, Oracle and/or its affiliates. All rights reserved Authors: The Field Service Cloud Information Development Team This software and related
Oracle Cloud. Using the Google Calendar Adapter Release 16.3 E
 Oracle Cloud Using the Google Calendar Adapter Release 16.3 E68599-05 September 2016 Oracle Cloud Using the Google Calendar Adapter, Release 16.3 E68599-05 Copyright 2015, 2016, Oracle and/or its affiliates.
Oracle Cloud Using the Google Calendar Adapter with Oracle Integration
 Oracle Cloud Using the Google Calendar Adapter with Oracle Integration E85501-05 January 2019 Oracle Cloud Using the Google Calendar Adapter with Oracle Integration, E85501-05 Copyright 2017, 2019, Oracle
Oracle Database Express Edition
 Oracle Database Express Edition Getting Started Guide 11g Release 2 (11.2) E18585-04 July 2011 Welcome to Oracle Database Express Edition (Oracle Database XE). This guide gets you quickly up and running
Oracle Retail XBR i Loss Prevention Release Notes Release
 Oracle Retail XBR i Loss Prevention Release Notes Release 10.8.3 March 2018 Copyright 2018, Oracle and/or its affiliates. All rights reserved. Primary Author: Barbara Clemmer Contributors: Bill Warrick,
Oracle Fusion Middleware. 1 Oracle Team Productivity Center Server System Requirements. 2 Installing the Oracle Team Productivity Center Server
 Oracle Fusion Middleware Installation Guide for Oracle Team Productivity Center Server 11g Release 1 (11.1.1) E14156-05 June 2010 This document provides information on: Section 1, "Oracle Team Productivity
New Features in Primavera Unifier June 2014
 New Features in Primavera Unifier 10.0 June 2014 COPYRIGHT & TRADEMARKS Copyright 2014, Oracle and/or its affiliates. All rights reserved. Oracle is a registered trademark of Oracle Corporation and/or
Oracle. Sales Cloud Integrating with Oracle Marketing Cloud. Release 13 (update 18B)
") Oracle Sales Cloud Integrating with Oracle Marketing Cloud Release 13 (update 18B) Release 13 (update 18B) Part Number E94441-01 Copyright 2011-2018, Oracle and/or its affiliates. All rights reserved.
Oracle Sales Cloud Integrating with Oracle Marketing Cloud Release 13 (update 18B) Release 13 (update 18B) Part Number E94441-01 Copyright 2011-2018, Oracle and/or its affiliates. All rights reserved.
Oracle Communications EAGLE Element Management System Reporting Studio. Upgrade/Installation Guide Release 46.2 E69122 Revision 2
 Oracle Communications EAGLE Element Management System Reporting Studio Upgrade/Installation Guide Release 46.2 E69122 Revision 2 December 2015 Oracle Communications EAGLE Element Management System Reporting
Getting Started With Data Sync
 Oracle Cloud Data Sync Getting Started Release 2.5 E25001-01 June 2018 Getting Started With Data Sync This guide introduces Data Sync Version 2.5 and provides installation instructions. Data Sync loads
Oracle. Engagement Cloud Using Service Request Management. Release 12
 Oracle Engagement Cloud Release 12 Oracle Engagement Cloud Part Number E73284-05 Copyright 2011-2017, Oracle and/or its affiliates. All rights reserved. Author: Joseph Kolb This software and related documentation
Overview of the Plug-In. Versions Supported
 Oracle Enterprise Manager System Monitoring Plug-In Installation Guide for Exadata Power Distribution Unit Release 11.1.0.2.0 E20087-03 March 2011 Overview of the Plug-In This plug-in will be used to monitor
Oracle Cloud Using the Google Calendar Adapter. Release 17.3
 Oracle Cloud Using the Google Calendar Adapter Release 17.3 E68599-09 October 2017 Oracle Cloud Using the Google Calendar Adapter, Release 17.3 E68599-09 Copyright 2015, 2017, Oracle and/or its affiliates.
Oracle Utilities Smart Grid Gateway Adapter for Echelon
 Oracle Utilities Smart Grid Gateway Adapter for Echelon User's Guide Release 2.0.0 Service Pack 9 E23539-04 May 2013 Oracle Utilities Smart Grid Gateway Adapter for Echelon User's Guide Release 2.0.0 Service
Oracle Enterprise Single Sign-on Logon Manager How-To: Configuring ESSO-LM Event Logging with Microsoft SQL Server 2005 Release
 Oracle Enterprise Single Sign-on Logon Manager How-To: Configuring ESSO-LM Event Logging with Microsoft SQL Server 2005 Release 11.1.1.5.0 21012-01 March 2011 Oracle Enterprise Single Sign-on Logon Manager
EnterpriseTrack Reporting Data Model Configuration Guide Version 17
 EnterpriseTrack EnterpriseTrack Reporting Data Model Configuration Guide Version 17 October 2018 Contents About This Guide... 5 Configuring EnterpriseTrack for Reporting... 7 Enabling the Reporting Data
Service Cloud Using Service Cloud Configuration Assistant Release 17D
 Oracle Service Cloud Using Service Cloud Configuration Assistant Release 17D Part Number: E89541-02 Copyright 2017, Oracle and/or its affiliates. All rights reserved Authors: The Service Cloud Information
Oracle Utilities Analytics for Oracle Utilities Extractors and Schema and Oracle Utilities Analytics Dashboards
 Oracle Utilities Analytics for Oracle Utilities Extractors and Schema and Oracle Utilities Analytics Dashboards User s Guide Release 2.5.0 E48997-01 December 2013 Oracle Utilities Analytics for Oracle
User's Guide Release
 [1]Oracle Communications Customer Experience Analytics User's Guide Release 12.1.1 E72007-01 August 2016 Oracle Communications Customer Experience Analytics User's Guide, Release 12.1.1 E72007-01 Copyright
Module Code Entries Utility Oracle FLEXCUBE Universal Banking Release [December] [2016]
![Module Code Entries Utility Oracle FLEXCUBE Universal Banking Release [December] [2016]](/thumbs/95/125396641.jpg "Module Code Entries Utility Oracle FLEXCUBE Universal Banking Release [December] [2016]") Module Code Entries Utility Oracle FLEXCUBE Universal Banking Release 12.3.0.0.0 [December] [2016] Table of Contents 1. DSN ENTRIES UTILITY... 1-1 1.1 INTRODUCTION... 1-1 1.2 SETTING UP MODULE CODE ENTRIES...
Module Code Entries Utility Oracle FLEXCUBE Universal Banking Release 12.3.0.0.0 [December] [2016] Table of Contents 1. DSN ENTRIES UTILITY... 1-1 1.1 INTRODUCTION... 1-1 1.2 SETTING UP MODULE CODE ENTRIES...
Oracle Hospitality OPERA Exchange Interface Cloud Authentication. October 2017
 Oracle Hospitality OPERA Exchange Interface Cloud Authentication October 2017 Copyright 2016, 2017, Oracle and/or its affiliates. All rights reserved. This software and related documentation are provided
Oracle Communications Performance Intelligence Center
 Oracle Communications Performance Intelligence Center Browser Export Scheduler Guide Release 10.2 E66874 Revision 1 February 2016 i Oracle Communications Performance Intelligence Center Browser Export
Oracle Hospitality Suite8 Export to Outlook User Manual Release 8.9. July 2015
 Oracle Hospitality Suite8 Export to Outlook User Manual Release 8.9 July 2015 Copyright 1987, 2015, Oracle and/or its affiliates. All rights reserved. This software and related documentation are provided
JD Edwards EnterpriseOne. Overview. Prerequisites. Web Client for ipad Quick Start Guide Release 8.98 Update 4, Service Pack 5
 JD Edwards EnterpriseOne Web Client for ipad Quick Start Guide Release 8.98 Update 4, Service Pack 5 E25437-01 September 2011 This document contains the following topics: "Overview" "Prerequisites" "User
Oracle Hospitality Query and Analysis Languages and Translation Configuration Guide. March 2016
 Oracle Hospitality Query and Analysis Languages and Translation Configuration Guide March 2016 Original Issued Date: March 2006 Vision / Serduct version: 03.x Author Product: MICROS Opera 3.x Copyright
Apple Safari Settings Oracle FLEXCUBE Release [May] [2017]
![Apple Safari Settings Oracle FLEXCUBE Release [May] [2017]](/thumbs/72/66339650.jpg "Apple Safari Settings Oracle FLEXCUBE Release [May] [2017]") Apple Safari Settings Oracle FLEXCUBE Release 12.4.0.0.0 [May] [2017] Table of Contents 1. CONFIGURING APPLE SAFARI (LATEST QUALIFIED VERSION)... 1-1 1.1 CLEARING CACHE... 1-1 1.2 REMOVING BACK/FORWARD
Apple Safari Settings Oracle FLEXCUBE Release 12.4.0.0.0 [May] [2017] Table of Contents 1. CONFIGURING APPLE SAFARI (LATEST QUALIFIED VERSION)... 1-1 1.1 CLEARING CACHE... 1-1 1.2 REMOVING BACK/FORWARD
New Features in Primavera Professional 15.2
 New Features in Primavera Professional 15.2 COPYRIGHT & TRADEMARKS Copyright 2015, Oracle and/or its affiliates. All rights reserved. Oracle is a registered trademark of Oracle Corporation and/or its affiliates.
Documentation Accessibility. Access to Oracle Support. Supported Browsers
 Oracle Cloud Known Issues for Oracle Business Intelligence Cloud Service E37404-12 March 2018 Known Issues Learn about the issues you may encounter when using Oracle Business Intelligence Cloud Service
Oracle Business Intelligence Publisher. 1 Oracle Business Intelligence Publisher Certification. Certification Information 10g Release 3 (
 Oracle Business Intelligence Publisher Certification Information 10g Release 3 (10.1.3.4.1) E12692-06 July 2009 This document outlines the certified hardware and software configurations for Oracle Business
Quick Start for Coders and Approvers
 Quick Start for Coders and Approvers Oracle Health Sciences Central Coding Release 3.1 Part Number: E69161-01 Copyright 2009, 2016, Oracle and/or its affiliates. All rights reserved. This software and
Open Development Tool Application Deployment in Weblogic Oracle FLEXCUBE Universal Banking Release [May] [2017]
![Open Development Tool Application Deployment in Weblogic Oracle FLEXCUBE Universal Banking Release [May] [2017]](/thumbs/90/101584799.jpg "Open Development Tool Application Deployment in Weblogic Oracle FLEXCUBE Universal Banking Release [May] [2017]") Open Development Tool Application Deployment in Weblogic Oracle FLEXCUBE Universal Banking Release 12.4.0.0.0 [May] [2017] Table of Contents 1. OPEN DEVELOPMENT TOOL (ODT) APPLICATION FULL DEPLOYMENT...
Open Development Tool Application Deployment in Weblogic Oracle FLEXCUBE Universal Banking Release 12.4.0.0.0 [May] [2017] Table of Contents 1. OPEN DEVELOPMENT TOOL (ODT) APPLICATION FULL DEPLOYMENT...
PeopleSoft Fluid Required Fields Standards
 ORACLE CORPORATION PeopleSoft Fluid Required Fields Standards Fluid User Experience November 2015 PeopleSoft Fluid Required Fields Standards Copyright 2015, Oracle and/or its affiliates. All rights reserved.
Oracle Application Express
 Oracle Application Express End User s Guide Release 4.2 E35124-03 January 2013 Oracle Application Express End User's Guide, Release 4.2 E35124-03 Copyright 2012, 2013, Oracle and/or its affiliates. All
Live Help On Demand Analytics
 Oracle Live Help On Demand Analytics Administrator s Guide µ Live Help On Demand Analytics Version 2013-04 Administrator s Guide Oracle ATG One Main Street Cambridge, MA 02142 USA Contents i µ Oracle Live
This section includes information on important Oracle Healthcare Data Model installation and configuration details. 1.1 Obtain and Apply IP Patch
 Oracle Healthcare Data Model Release Notes 11g Release 2 (11.2) E18028-02 November 2010 This document contains important information that was not included in the documentation for this release of Oracle
Spend less on file attachment storage space Reliably back up your data or file attachments Use your OpenAir data in your reporting tools
 Spend less on file attachment storage space Reliably back up your data or file attachments Use your OpenAir data in your reporting tools With OpenAir s Automatic Backup System (ABS) and Workspace downloads,
Oracle User Productivity Kit Convert Player Topics to MP4. E August 2016
 Oracle User Productivity Kit Convert Player Topics to MP4 E79040-01 August 2016 Oracle User Productivity Kit Convert Player Topics to MP4 E79040-01 August 2016 Copyright 1998, 2016, Oracle and/or its affiliates.
Oracle Cloud Using the Microsoft Adapter. Release 17.3
 Oracle Cloud Using the Microsoft Email Adapter Release 17.3 E70297-10 December 2017 Oracle Cloud Using the Microsoft Email Adapter, Release 17.3 E70297-10 Copyright 2016, 2017, Oracle and/or its affiliates.
Oracle Cloud E
 Oracle Cloud Administering Oracle Real-Time Integration Business Insight Release 12c (12.2.1) E76086-05 May 2017 Documentation for application users with various user roles that describes tasks to administer
Installing Data Sync Version 2.3
 Oracle Cloud Data Sync Readme Release 2.3 DSRM-230 May 2017 Readme for Data Sync This Read Me describes changes, updates, and upgrade instructions for Data Sync Version 2.3. Topics: Installing Data Sync
Oracle Cloud Using the Evernote Adapter. Release 17.3
 Oracle Cloud Using the Evernote Adapter Release 17.3 E69234-07 September 2017 Oracle Cloud Using the Evernote Adapter, Release 17.3 E69234-07 Copyright 2016, 2017, Oracle and/or its affiliates. All rights
Liquidity Management OBIEE Setup Oracle Banking Liquidity Management Release [November] [2017]
![Liquidity Management OBIEE Setup Oracle Banking Liquidity Management Release [November] [2017]](/thumbs/93/113005666.jpg "Liquidity Management OBIEE Setup Oracle Banking Liquidity Management Release [November] [2017]") Liquidity Management OBIEE Setup Oracle Banking Liquidity Management Release 14.0.0.0.0 [November] [2017] Table of Contents 1. Starting BI Server... 3 1.2 Upload OBIEE Reports... 4 2.REPORT CREATION...
Liquidity Management OBIEE Setup Oracle Banking Liquidity Management Release 14.0.0.0.0 [November] [2017] Table of Contents 1. Starting BI Server... 3 1.2 Upload OBIEE Reports... 4 2.REPORT CREATION...
Copyright
 P6 Team Member for iphone App User's Guide P6 EPPM Release 8.1 July 2011 Copyright Oracle Primavera P6 Team Member for iphone App User's Guide Copyright 2011, Oracle and/or its affiliates. All rights reserved.
Oracle Communications Order and Service Management. OSM New Features
 Oracle Communications Order and Service Management What s New Release 7.3.5 E89975-01 March 2018 This document describes the new features that are delivered in Oracle Communications Order and Service Management
Oracle Utilities Smart Grid Gateway Adapter Development Kit
 Oracle Utilities Smart Grid Gateway Adapter Development Kit User's Guide Release 2.1.0 Service Pack 2 E41628-02 April 2014 Oracle Utilities Smart Grid Gateway Adapter Development Kit User's Guide Release
What's New. Features introduced in New Features in Primavera Gateway 17
 What's New New Features in Primavera Gateway 17 Features introduced in 17.7 An External Custom provider utility enables you to build, deploy, and maintain custom providers outside of Gateway. By leveraging
Recipe Calculation Survey. Materials Control. Copyright by: MICROS-FIDELIO GmbH Europadamm 2-6 D Neuss Date: August 21 st 2007.
 Recipe Calculation Survey Materials Control Copyright by: MICROS-FIDELIO GmbH Europadamm 2-6 D - 41460 Neuss Date: August 21 st 2007 Page 1 of 8 Copyright 2015, Oracle and/or its affiliates. All rights
Oracle is a registered trademark of Oracle Corporation and/or its affiliates. Other names may be trademarks of their respective owners.
 Primavera Portfolio Management 9.0 What s New Copyright 1999-2011, Oracle and/or its affiliates. The Programs (which include both the software and documentation) contain proprietary information; they are
ORACLE USER PRODUCTIVITY KIT UPGRADE RELEASE SERVICE PACK 2 PART NO. E
 ORACLE USER PRODUCTIVITY KIT UPGRADE RELEASE 3.6.1 SERVICE PACK 2 PART NO. E17977-01 JUNE 2010 COPYRIGHT Copyright 1998, 2010, Oracle and/or its affiliates. All rights reserved. Part No. E17977-01 Oracle
Documentation Accessibility. Access to Oracle Support
 Oracle Fusion Middleware Known Issues for Oracle Data Visualization Desktop E72027-15 December 2017 Data Visualization Desktop Known Issues This chapter lists and describes known Oracle Data Visualization
Oracle Adapter for Salesforce Lightning. Winter 18. New Feature Summary
 Oracle Adapter for Salesforce Lightning Winter 18 New Feature Summary TABLE OF CONTENTS REVISION HISTORY... 3 OVERVIEW... 4 ORACLE ADAPTER FOR SALESFORCE LIGHTNING... 4 LIGHTNING TRANSACTION UI... 4 File
 PQM Submitter FAQs Version 18 February 2018 Contents About This Guide... 5 PQM Overview... 7 What is included in the Workspace?... 7 How do I view task listings?... 8 How do I navigate between tasks?...
Set Up Rules Palette
 Oracle Insurance Policy Administration Set Up Rules Palette Installation Instructions Step 3 Version 9.5.0.0 Documentation Part Number: E23638_01 June 2012 Copyright 2009, 2012 Oracle and/or its affiliates.
Oracle Cloud Using the Eventbrite Adapter with Oracle Integration
 Oracle Cloud Using the Eventbrite Adapter with Oracle Integration E85506-05 January 2019 Oracle Cloud Using the Eventbrite Adapter with Oracle Integration, E85506-05 Copyright 2017, 2019, Oracle and/or
Export generates an empty file
 Known Issues for Oracle SQL Developer Web Release 18.1 E96172-01 May 2018 Known Issues for Oracle SQL Developer Web This section describes known issues associated with the Oracle SQL Developer Web 18.1
Oracle Public Sector Revenue Management Self Service
 Oracle Public Sector Revenue Management Self Service Release Notes Release 2.4.0 Service Pack 2 E61989-01 August 2015 Oracle Public Sector Revenue Management Self Service Release Notes Release 2.4.0 Service
Oracle Simphony Venue Management (SimVen) Installation Guide Release Part Number: E
 Installation Guide Release Part Number: E") Oracle Simphony Venue Management (SimVen) Installation Guide Release 3.7.100 Part Number: E68504-01 May 2015 Copyright 2002, 2015, Oracle and/or its affiliates. All rights reserved. This software and related
Oracle Simphony Venue Management (SimVen) Installation Guide Release 3.7.100 Part Number: E68504-01 May 2015 Copyright 2002, 2015, Oracle and/or its affiliates. All rights reserved. This software and related
CRM On Demand Oracle CRM On Demand Connected Mobile Sales Administration Guide
 CRM On Demand Oracle CRM On Demand Connected Mobile Sales Administration Guide For Oracle CRM On Demand Release 32 June 2016 Copyright 2005, 2016 Oracle. All rights reserved. This software and related
1 Siebel Attachments Solution Overview
 Oracle Fusion Middleware User's Guide for Oracle Enterprise Content Management Solutions for Oracle Siebel 11g Release 1 (11.1.1) E17067-01 May 2010 This document provides information on options available
Oracle. Loyalty Cloud Extending Loyalty. Release 13 (update 18B)
") Oracle Loyalty Cloud Release 13 (update 18B) Release 13 (update 18B) Part Number E94297-01 Copyright 2011-2018, Oracle and/or its affiliates. All rights reserved. Authors: Sharon Conroy, Hugh Mason, Tracy
Oracle Loyalty Cloud Release 13 (update 18B) Release 13 (update 18B) Part Number E94297-01 Copyright 2011-2018, Oracle and/or its affiliates. All rights reserved. Authors: Sharon Conroy, Hugh Mason, Tracy
Oracle. Sales Cloud Getting Started with Extending Sales. Release 13 (update 17D)
") Oracle Sales Cloud Release 13 (update 17D) Release 13 (update 17D) Part Number E90542-02 Copyright 2011-2017, Oracle and/or its affiliates. All rights reserved. Authors: Chris Kutler, Bob Lies, Robyn King
Oracle Sales Cloud Release 13 (update 17D) Release 13 (update 17D) Part Number E90542-02 Copyright 2011-2017, Oracle and/or its affiliates. All rights reserved. Authors: Chris Kutler, Bob Lies, Robyn King
Oracle. Field Service Cloud Using Android and ios Mobile Applications 18B
 Oracle Field Service Cloud Using Android and ios Mobile Applications 18B Part Number: E94755-02 Copyright 2018, Oracle and/or its affiliates. All rights reserved Authors: The Field Service Cloud Information
Lookout Mobile Endpoint Security. Deploying Lookout with BlackBerry Unified Endpoint Management
 Lookout Mobile Endpoint Security Deploying Lookout with BlackBerry Unified Endpoint Management June 2018 2 Copyright and disclaimer Copyright 2018, Lookout, Inc. and/or its affiliates. All rights reserved.
Overview of the Plug-In. Versions Supported. Deploying the Plug-In
 Oracle Enterprise Manager System Monitoring Plug-In Installation Guide for Exadata Avocent MergePoint Unity Switch Release 11.1.0.2.0 E20086-03 March 2011 Overview of the Plug-In The Avocent MergePoint
Defining Constants and Variables for Oracle Java CAPS Environments
 Defining Constants and Variables for Oracle Java CAPS Environments Part No: 821 2547 March 2011 Copyright 2008, 2011, Oracle and/or its affiliates. All rights reserved. License Restrictions Warranty/Consequential
OBIEE Metadata Repository Deployment Guide Oracle FLEXCUBE Universal Banking Release [May] [2017]
![OBIEE Metadata Repository Deployment Guide Oracle FLEXCUBE Universal Banking Release [May] [2017]](/thumbs/72/66450564.jpg "OBIEE Metadata Repository Deployment Guide Oracle FLEXCUBE Universal Banking Release [May] [2017]") OBIEE Metadata Repository Deployment Guide Oracle FLEXCUBE Universal Banking Release 12.4.0.0.0 [May] [2017] Table of Contents 1. OBIEE METADATA REPOSITORY DEPLOYMENT GUIDE... 1-1 1.1 INTRODUCTION... 1-1
OBIEE Metadata Repository Deployment Guide Oracle FLEXCUBE Universal Banking Release 12.4.0.0.0 [May] [2017] Table of Contents 1. OBIEE METADATA REPOSITORY DEPLOYMENT GUIDE... 1-1 1.1 INTRODUCTION... 1-1
User Scripting April 14, 2018
 April 14, 2018 Copyright 2013, 2018, Oracle and/or its affiliates. All rights reserved. This software and related documentation are provided under a license agreement containing restrictions on use and
Contents About Connecting the Content Repository... 5 Prerequisites for Configuring a Content Repository and Unifier... 5
 Unifier Content Repository Configuration Guide for On-Premises Version 17 July 2017 Contents About Connecting the Content Repository... 5 Prerequisites for Configuring a Content Repository and Unifier...
Oracle Cloud Using the Trello Adapter. Release 17.3
 Oracle Cloud Using the Trello Adapter Release 17.3 E84579-03 September 2017 Oracle Cloud Using the Trello Adapter, Release 17.3 E84579-03 Copyright 2016, 2017, Oracle and/or its affiliates. All rights
Oracle Hospitality Simphony Cloud Services Post-Installation or Upgrade Guide Release 2.10 E July 2018
 Oracle Hospitality Simphony Cloud Services Post-Installation or Upgrade Guide Release 2.10 E89810-04 July 2018 Copyright 2010, 2018, Oracle and/or its affiliates. All rights reserved. This software and
Oracle Enterprise Manager. 1 Introduction. System Monitoring Plug-in for Oracle Enterprise Manager Ops Center Guide 11g Release 1 (
 Oracle Enterprise Manager System Monitoring Plug-in for Oracle Enterprise Manager Ops Center Guide 11g Release 1 (11.1.3.0.0) E18950-03 November 2011 This document provides describes the System Monitoring
Documentation Accessibility
 Oracle Warehouse Builder Release Notes 11g Release 2 (11.2) E10585-04 March 2010 This document contains important information not included in the Oracle Warehouse Builder documentation. This document provides
Open Development Tool Database Setup Oracle FLEXCUBE Universal Banking Release [May] [2017]
![Open Development Tool Database Setup Oracle FLEXCUBE Universal Banking Release [May] [2017]](/thumbs/86/93962724.jpg "Open Development Tool Database Setup Oracle FLEXCUBE Universal Banking Release [May] [2017]") Open Development Tool Database Setup Oracle FLEXCUBE Universal Banking Release 12.4.0.0.0 [May] [2017] Table of Contents 1. SETTING UP DATABASE FOR OPEN DEVELOPMENT TOOL... 1-1 1. Setting up Database for
Open Development Tool Database Setup Oracle FLEXCUBE Universal Banking Release 12.4.0.0.0 [May] [2017] Table of Contents 1. SETTING UP DATABASE FOR OPEN DEVELOPMENT TOOL... 1-1 1. Setting up Database for
Oracle Enterprise Manager Ops Center. Introduction. What You Will Need. Installing and Updating Local Software Packages 12c Release
 Oracle Enterprise Manager Ops Center Installing and Updating Local Software Packages 12c Release 12.1.2.0.0 E37233-01 November 2012 This guide provides an end-to-end example for how to use Oracle Enterprise
Oracle Communications Performance Intelligence Center
 Oracle Communications Performance Intelligence Center KPI Configuration Guide Release 10.2.1 E77501-01 June 2017 1 Oracle Communications Performance Intelligence Center KPI Configuration Guide, Release
Oracle Retail Order Broker (Locate) Release Notes Release 5.2. December 2014
 Release Notes Release 5.2. December 2014") Oracle Retail Order Broker (Locate) Release Notes Release 5.2 December 2014 Oracle Retail Order Broker Release Notes, Release 5.2 Copyright 2014, Oracle and/or its affiliates. All rights reserved. This
Oracle Retail Order Broker (Locate) Release Notes Release 5.2 December 2014 Oracle Retail Order Broker Release Notes, Release 5.2 Copyright 2014, Oracle and/or its affiliates. All rights reserved. This
USING ADMINISTRATOR FEATURES
 HYPERION FINANCIAL MANAGEMENT SYSTEM 9 RELEASE 9.3.1 USING ADMINISTRATOR FEATURES Oracle's Hyperion Financial Management System 9 Release 9.3 contains significant enhancements to administrator features
Development Workbench Getting Started Oracle FLEXCUBE Universal Banking Release
 Development Workbench Getting Started Oracle FLEXCUBE Universal Banking Release 12.3.0.0.0 Contents 1 Preface... 2 1.1 Audience... 2 1.2 Related Documents... 2 2 Introduction... 2 3 Explanation of Some
PeopleSoft Fluid Icon Standards
 ORACLE CORPORATION PeopleSoft Fluid Icon Standards Fluid User Experience November 2015 PeopleSoft Fluid Icon Standards Copyright 2015, Oracle and/or its affiliates. All rights reserved. This software and
Oracle Utilities Work and Asset Cloud Service End-User Provisioning Guide
 Oracle Utilities Work and Asset Cloud Service End-User Provisioning Guide Release 2.1.1 SP 1 E84299-01 February 2017 Oracle Utilities Work and Asset Cloud Service Release 2.1.1 SP 1 End-User Provisioning
Oracle Enterprise Manager Ops Center. Introduction. What You Will Need. Creating vservers 12c Release 1 ( )
") Oracle Enterprise Manager Ops Center Creating vservers 12c Release 1 (12.1.4.0.0) E27357-02 June 2013 This guide provides an end-to-end example for how to use Oracle Enterprise Manager Ops Center. Introduction
Oracle Enterprise Manager Ops Center Creating vservers 12c Release 1 (12.1.4.0.0) E27357-02 June 2013 This guide provides an end-to-end example for how to use Oracle Enterprise Manager Ops Center. Introduction
Getting Started with Attunity Replicate on Amazon EC2. Version 6.0
 Getting Started with Attunity Replicate on Amazon EC2 Version 6.0 November 21, 2017 Getting Started with Attunity Replicate on Amazon EC2 All rights reserved. Primary Author: Charlton Book The Programs
User Guide. Oracle Health Sciences Central Coding Release 3.1. Part Number: E
 User Guide Oracle Health Sciences Central Coding Release 3.1 Part Number: E69156-01 Copyright 2006, 2016, Oracle and/or its affiliates. All rights reserved. This software and related documentation are
Reports DSN Entries Utility Oracle FLEXCUBE Universal Banking Release [May] [2018]
![Reports DSN Entries Utility Oracle FLEXCUBE Universal Banking Release [May] [2018]](/thumbs/93/112011303.jpg "Reports DSN Entries Utility Oracle FLEXCUBE Universal Banking Release [May] [2018]") Reports DSN Entries Utility Oracle FLEXCUBE Universal Banking Release 14.1.0.0.0 [May] [2018] Table of Contents 1. REPORTS DSN ENTRIES UTILITY... 1-1 1.1 INTRODUCTION... 1-1 1.2 SETTING UP REPORTS DSN
Reports DSN Entries Utility Oracle FLEXCUBE Universal Banking Release 14.1.0.0.0 [May] [2018] Table of Contents 1. REPORTS DSN ENTRIES UTILITY... 1-1 1.1 INTRODUCTION... 1-1 1.2 SETTING UP REPORTS DSN
Deploying Oracle FLEXCUBE Application on WebSphere Oracle FLEXCUBE Universal Banking Release [December] [2016]
![Deploying Oracle FLEXCUBE Application on WebSphere Oracle FLEXCUBE Universal Banking Release [December] [2016]](/thumbs/74/71078880.jpg "Deploying Oracle FLEXCUBE Application on WebSphere Oracle FLEXCUBE Universal Banking Release [December] [2016]") Deploying Oracle FLEXCUBE Application on WebSphere Oracle FLEXCUBE Universal Banking Release 12.3.0.0.0 [December] [2016] Table of Contents 1. DEPLOYING ORACLE FLEXCUBE ON WEBSPHERE... 1-1 1.1 INTRODUCTION...
Deploying Oracle FLEXCUBE Application on WebSphere Oracle FLEXCUBE Universal Banking Release 12.3.0.0.0 [December] [2016] Table of Contents 1. DEPLOYING ORACLE FLEXCUBE ON WEBSPHERE... 1-1 1.1 INTRODUCTION...
Customer Service Training Activities Created on 10/10/2011 3:33:00 PM. FSU Service Center. Quick Reference Guide v.
 Created on 10/10/2011 3:33:00 PM FSU Service Center Quick Reference Guide v.4 Revised 10/10/11 COPYRIGHT & TRADEMARKS Copyright 1998, 2009, Oracle and/or its affiliates. All rights reserved. Oracle is
Oracle. SCM Cloud Configurator Modeling Guide. Release 13 (update 17D)
") Oracle SCM Cloud Release 13 (update 17D) Release 13 (update 17D) Part Number E89207-02 Copyright 2011-2017, Oracle and/or its affiliates. All rights reserved. Author: Mark Sawtelle This software and related
Oracle SCM Cloud Release 13 (update 17D) Release 13 (update 17D) Part Number E89207-02 Copyright 2011-2017, Oracle and/or its affiliates. All rights reserved. Author: Mark Sawtelle This software and related
Deploying Lookout with IBM MaaS360
 Lookout Mobile Endpoint Security Deploying Lookout with IBM MaaS360 February 2018 2 Copyright and disclaimer Copyright 2018, Lookout, Inc. and/or its affiliates. All rights reserved. Lookout, Inc., Lookout,
Site User Guide. Oracle Health Sciences InForm CRF Submit Release Part Number:E
 Site User Guide Oracle Health Sciences InForm CRF Submit Release 4.0.2 Part Number:E79080-01 Copyright 2016, 2017, Oracle and/or its affiliates. All rights reserved. This software and related documentation
Microsoft Active Directory Plug-in User s Guide Release
 [1]Oracle Enterprise Manager Microsoft Active Directory Plug-in User s Guide Release 13.1.0.1.0 E66401-01 December 2015 Oracle Enterprise Manager Microsoft Active Directory Plug-in User's Guide, Release
Advanced ARC Reporting
 COPYRIGHT & TRADEMARKS Copyright 1998, 2009, Oracle and/or its affiliates. All rights reserved. Oracle is a registered trademark of Oracle Corporation and/or its affiliates. Other names may be trademarks
Oracle Enterprise Manager. Description. Versions Supported
 Oracle Enterprise Manager System Monitoring Plug-in Installation Guide for Microsoft.NET Framework Release 2 (2.0.2.1.0) and Release 9 (2.0.2.2.0) B28043-03 December 2008 This document provides a brief
ORACLE USER PRODUCTIVITY KIT KNOWLEDGE CENTER: REPORTS MANAGEMENT RELEASE 11.0 PART NO. E
 ORACLE USER PRODUCTIVITY KIT KNOWLEDGE CENTER: REPORTS MANAGEMENT RELEASE 11.0 PART NO. E23918-01 JULY 2011 COPYRIGHT & TRADEMARKS Copyright 1998, 2011, Oracle and/or its affiliates. All rights reserved.
Oracle Cloud Using the File Adapter. Release 17.4
 Oracle Cloud Using the File Adapter Release 17.4 E71397-08 October 2017 Oracle Cloud Using the File Adapter, Release 17.4 E71397-08 Copyright 2016, 2017, Oracle and/or its affiliates. All rights reserved.