Database Visibility Documentation
|
|
|
- Erick Sherman
- 5 years ago
- Views:
Transcription
1 Database Visibility Documentation Version 4.3.x reserves the right to change the features at any time before making them generally available as well as Page 1
2 Database Visibility Overview of Database Visibility Database Visibility Requirements and Supported Environments Administer the Database Agent Prepare to Install the Database Agent Install the Database Agent Verify the Database Agent Installation Upgrade the Database Agent Uninstall the Database Agent Configure the Database Agent Database Agent Configuration Properties Enable SSL and SSH for Database Agent Communications Monitor SSL-enabled PostgreSQL on Amazon RDS Install the Database Agent as a Windows Service Enable Snapshot Correlation for Oracle Increasing JVM Memory Configure Controller Settings for Database Agents Start and Stop the Database Agent Start the Database Agent Automatically on Linux Start the Database Agent Automatically on Windows Add Database Licenses Add Database Collectors Configure IBM DB2 Collectors Configure Microsoft SQL Server Collectors Microsoft SQL Server on AWS RDS Permissions Configure Microsoft Azure Collectors Configure MongoDB Collectors Configure MySQL Collectors Troubleshooting MySQL Permissions Configure Oracle Collectors Configure PostgreSQL Collectors Configure Sybase Collectors Configure Sybase IQ Collectors Use the Database Visibility API to Configure Collectors Monitor Sybase Databases Using Kerberos Authentication Configure the Database Agent to Monitor Server Hardware Required Monitored Host Permissions Configure WMI Permissions and Security Monitor Databases and Database Servers Access Database Visibility from Application Monitoring Views Discover Normal Database and Server Activity Monitor Database Performance View Overall Database and Server Performance Database Dashboard Database Topology Window Database Live View Window Database Queries Window Database Query Details Window Database Query Execution Plan Window Database Clients Window Database Sessions Window Database Schemas and Databases Windows Database Modules Window Database Programs Window Database Object Browser Window Database Reports Window Monitor Database Server Hardware Database Health Rules and Alerts Database Monitoring Metrics Database Agent Events Reference Configure Query Literals Security Configuring Custom Metrics reserves the right to change the features at any time before making them generally available as well as Page 2
3 Database Visibility Database Visibility gives you end-to-end visibility on the performance of your database. Database Visibility helps you troubleshoot problems such as slow response times and excessive load. Database Visibility provides metrics on database activity, such as: Which SQL statements or stored procedures are consuming the most system resources Statistics on procedures, SQL statements, and SQL query plans How much time is spent fetching, sorting, or waiting on a lock Activity from the previous day, week, or month Installation and Administration Install the Database Agent Start and Stop the Database Agent Upgrade the Database Agent Using Database Visibility Overview of Database Visibility Monitor Database Performance Monitor Database Server Hardware Configuration Configure the Database Agent Add Database Collectors Reference Database Agent Configuration Properties Database Agent Events Reference Database Monitoring Metrics Wa tch the Vid eo Quick Overvi ew: Datab ase Monito ring Dashb oards and Metric s Page 3
4 Overview of Database Visibility Components of Database Visibility Database Visibility consists of four main components: Database Agent Collector Controller Events Service (on-premises only) Database Agent The Database Agent is a standalone Java program that collects performance metrics about your database instances and database servers. One Database Agent can monitor database instances. To monitor 100+ database instances, increase the initially allocated heap size for the Database Agent JVM. You can deploy the Database Agent on any machine running Java 1.7 or higher. The machine must also have network access to the Controller and the database instance that you want to be monitored. Collector The Database Agent Collector is the process that runs within the Database Agent to collect performance metrics about your database instances and database servers. One Collector collects metrics for one database instance. Multiple collectors can run in one Database Agent. Each database server that you monitor requires one license. For SQL Server, you can monitor many database instances with one license. Database Visibility detects when a database backend has matching credentials with a database server being monitored by a Collector. Database Visibility automatically associates the backend with the collector, so you can view its performance with the Application Flow Map, Tier Flow Map, or Node Flow Map. Controller The Controller is the central interface where you can see all your database instance and database server performance metrics. The following types of information are sent to the Controller: Database-level metrics, such as number of queries processed and other database statistics Names and attributes of all sessions, clients, queries, and other objects on the monitored system Events Service If you are using the on-premises version of Database Visibility, you must install the Events Service, which stores high volumes of metric data. The following types of information are sent to the Events Service: The time each query spends in each wait state Individual query statistics for databases that support it Information about individual execution plans in databases that support it Page 4
5 Page 5
6 Database Visibility Requirements and Supported Environments On this page: Systems that Database Visibility Supports Pro Controller Sizing Requirements Software Requirements Network Requirements Related pages: Add Database Collectors Database Visibility Systems that Database Visibility Supports Once Database Visibility is available, you can create collectors that run on the Database Agent to monitor any of the following systems: System Category System Type Supported via Amazon RDS Version Databases MongoDB, MongoDB cluster 2.2 and higher MySQL yes all versions including Percona and MariaDB Microsoft SQL Server Microsoft SQL Server on Linux Oracle, Oracle RAC yes yes 2005, 2008, 2012, 2014, 2016 and SQL Azure SQL Server on Linux is currently available as a public preview, and is not recommended for production use. Database Visibility works correctly with this preview release, but until a stable version of SQL Server on Linux is available, monitoring results may vary. 10g, 11g, and 12c PostgreSQL yes all versions IBM DB2 LUW Sybase ASE 9.x, 10.x, 11.x 15+ Sybase IQ Hardware Monitoring Windows 32-bit (will also work on 64-bit systems) Linux 32-bit and 64-bit Solaris all versions AIX Amazon RDS To avoid metric value errors, use a 64-bit JRE with the 64-bit operating system. Page 6
7 If you use a third-party application along with Database Visibility to monitor Sybase, the data displayed in the controller may not display correctly. For accurate metrics, it is recommended that you do not use both a third-party application and Database Visibility to monitor Sybase. Agent Hardware Requirements Hardware requirements vary depending on database activity. If your database activity increases, you may need to adjust your initial hardware configuration. recommends the following hardware requirements for the machine running the Database Agent: 1 GB of heap space and an additional 256 MB of heap space for each collector. When monitoring production databases, the heap usage per collector may reach 512 MB. 500 MB of disk space per collector per day 500 MB for the Events Service per day. By default, Events Service retains data for 10 days. 2 GHz or higher CPU Examples of heap space allocation: Monitoring 5 databases instances requires ( 5 x 256 MB ) MB = 2,304 MB Monitoring 20 database instances requires ( 20 x 256 MB ) MB = 6,144 MB Monitoring 100 database instances requires ( 100 x 256 MB ) MB = 26,624 MB Pro Controller Sizing Requirements For information on additional hardware requirements for the Controller to support Database Visibility, see Controller System Requirements. Start the Controller Events Service The Database Agent requires the Controller Events Service, which must be started before starting the agent. Software Requirements The Database Agent runs on a Java Virtual Machine. You must have Java 1.7 or 1.8. The operating systems Linux and Windows are supported Network Requirements The machine on which the database is running or the machine you want to monitor must be accessible from the machine where the Database Agent is installed and running. This machine must have a network connection, internet or intranet. If your databases are behind a firewall, you must configure the firewall to permit the machine running the Database Agent program access to the databases. The database listener port (and optionally the SSH or WMI port) must be open. The network bandwidth used between the agent and the controller is approximately 300kb/min per collector for a large database with 200 clients using 50 schemas, processing about 10,000 queries a minute. The actual numbers depend on the type of database server, the number of individual schemas on the server, and the number of unique queries executed daily, and will therefore vary. Page 7
8 Administer the Database Agent On this page: Related pages: Using Multiple Agents Database Visibility Database Agent Configuration Properties Add Database Collectors Start the Database Agent Automatically on Linux Start the Database Agent Automatically on Windows To start monitoring your database, you must first install the Database Agent. The Database Agent is a standalone Java program that collects performance metrics about your database instances and database servers. You can then view these metrics in the Metric Browser of the Controller UI. Using Multiple Agents You may want to install multiple agents for the following reasons: You have databases on multiple networks that are not accessible by one machine. You have multiple SQL Server instances that each require different credentials, and you want to connect to them via Windows Authentication. You want one or more agents to back up a primary agent. Backup agents ensure that your database instances are continually monitored during agent failure or machine downtime. Page 8
9 Prepare to Install the Database Agent On this page: Prerequisites for Installing the Agent Controller Communication Information Related pages: Database Visibility Database Agent Configuration Properties Add Database Collectors Start the Database Agent Automatically on Linux Start the Database Agent Automatically on Windows Prerequisites for Installing the Agent Ensure that your environment meets the following requirements Java 1.7 or 1.8 The machine that you install the agent on has network access to the databases that you want to monitor. Controller Communication Information If you are installing using the Database Agent downloaded from the Getting Started Wizard, the Controller communications information is already configured for you in the agent controller-info.xml file. To complete the Getting Started Wizard - Databases, you need the following information: Controller Host Name Controller Port Number If you are installing using the agent installation zip file downloaded from the portal, you need the following information: Controller Host Name Controller Port Number Account Access Key See Agent-to-Controller Connections. Watch the video: Page 9
10 Install the Database Agent On this page: Install the Agent Software License the Agent (on premise only) Configure the Agent Start the Controller Events Service (on-prem only) Launch the Database Agent using System Properties Related pages: Database Visibility Database Agent Configuration Properties Add Database Collectors Enable SSL and SSH for Database Agent Communications Start the Database Agent Automatically on Linux Start the Database Agent Automatically on Windows Follow the procedure below to manually install the Database Agent. You can alternatively follow the steps in the Download & Install Wizard, which simplifies this process. To avoid permission issues, you should install the agent as the same user who owns the Database Agent or as an administrator on the host machine. To run the Database Agent, you must have write privileges to the logging output directory and to the conf directory, which is located in the agent installation directory. Install the Agent Software Download the version of the installation package that is appropriate for your OS environment from the Download Center ( Extract the zip file to the destination directory. Do not use spaces in the agent installation destination directory. Log on as an administrator to the machine where you will be installing the Database Agent. Windows Double-click the dbagent-x.x.x.zip file and extract the files to <db_agent_home >. If necessary, you can unblock the zip file before you extract it as follows: Right-click on the zip file, select Properties, and choose unblock. Linux Enter the following on the command line: unzip dbagent-x.x.x.zip -d <db_agent_home> Running Multiple Database Agents You can have multiple Database Agents concurrently running the agent jar in the <db_agent_home> directory on the same machine. Some system properties may be required depending on how you'll be using the agents. License the Agent (on premise only) Obtain a license.lic file with Database Monitoring licensing from your sales or support representative and put the license file in the directory where you installed the Controller. After placing the license in the directory, the Controller may take a minute or two to detect the new license. Restarting the Controller forces it to detect new licenses. Page 10
11 Configure the Agent You can configure properties for the Controller host name, port number, and account access key using either the <db_agent_home>/conf/controller-info.xml file or by adding system properties to the Database Agent startup script. Controller Host Name Configure using controller-info.xml: <controller_host> Configure using System Properties: -Dappdynamics.controller.hostName Required: Yes Default: None Controller Port Configure using controller-info.xml: <controller_port> Configure using System Properties: -Dappdynamics.controller.port Required: Yes Default: For On-premise Controller installations: Port 8090 for HTTP and 8181 for HTTPS communication. For SaaS Controller service: Port 80 for HTTP and port 443 for HTTPS communication. Account Access Key Configure using controller-info.xml: <account_access_key> Configure using System Properties: -Dappdynamics.agent.accountAccessKey Required: Yes Default: None Optional Configurations: Configure agent to use SSL, see Enable SSL for Communicating with the Controller. Configure the agent to use Proxy Settings, see Proxy Settings for the Controller. Configure the agent to run automatically when the Machine starts on Linux or Windows. Configure the agent to uniquely identify itself to the Controller, such as when you require multiple agents. See Multiple Agent Environment Properties. Configure the agent to act as a backup to another Database Agent. See Multiple Agent Environment Properties. Configure the logging level of the Database Agent running on the agent JVM. The attached log file shows an example of the agent log file when the agent logging is set to INFO level. This is the default. The log files are in <db_agent_home>\logs. Start the Controller Events Service (on-prem only) Linux % <controller_home>/bin/controller.sh start-events-service Windows C:\<controller_home>\bin\controller.bat start-events-service Launch the Database Agent using System Properties The following assumes that all the necessary parameters have been specified in the controller-info.xml. Launch Command Examples Linux % java -Ddbagent.name='Scarborough Network Database Agent' -jar <db_agent_home>/db-agent.jar Page 11
12 Windows 64-bit C:\java -Djava.library.path="<db_agent_home>\auth\x64" -Ddbagent.name="Scarborough Network Database Agent" -jar <db_agent_home>\db-agent.jar Systems Properties Database Agent Name Configure using System Properties : -Ddbagent.name=<db_a gent_name> Type: ASCII string, including spaces. If <db_agent_name> contains spaces, you must enclose the entire name in double quotes (" ") for Windows and single quotes (' ') for Linux. Required: Yes, when you have multiple agents reporting to the same controller. Default: Default Database Agent Java Library Path Configure using System Properties : -Djava.library.path=<db_agent_home>\auth\x64 Type: ASCII string, including spaces. If <db_agent_home> contains spaces, you must enclose the entire name in double quotes (" "). Required: Yes, for Windows only Specify: For 64-bit systems: <db_agent_home>\auth\x64 For 32-bit systems: <db_agent_home>\auth\x86 Increase the JVM Memory To monitor 100 or more databases, you may need to increase the JVM memory allocation size. Increased activity on the databases you are monitoring results in increased memory usage. On Linux, use this command to start the agent, and to initially allocate 256 MB to the agent instead of the default of 64 MB. For Windows 64-bit C:\java -Xmx256m -Djava.library.path="<db_agent_home>\auth\x64" -jar <db_agent_home>\db-agent.jar Page 12
13 Verify the Database Agent Installation On this page: Check the Agent Logs Verify that the Agent is Reporting to the Controller Verify that the Agent is Running Related pages: Database Agent Configuration Properties Agent and Controller Compatibility Check the Agent Logs After a successful install, your agent logs, located at <db_agent_home>/logs, should contain the following message: Started Database Agent Successfully If the agent log file is not present, the Database Agent may not be accessing the Database Agent command properties. To troubleshoot, check the application server log file where STDOUT is logged. It will have the fallback log messages, useful for troubleshooting the agent. Verify that the Agent is Reporting to the Controller Click Settings > Agents. Click the Database Agents tab. Here, you should see a listing for each Database Agent reporting to the Controller. An agent can have one of the following statuses: Active: The agent is running Passive: The agent is used as a backup for active agents If you don't see the Database Agent, check your controller-info.xml properties to ensure they have specified the correct host properties. Verify that the Agent is Running Use the following command to verify that the agent process is running: Linux: ps -ef grep DBAgent Windows: Open a command line console. Start the Task Manager and click the Processes tab. The agent process should be running. If it is not running, stop and restart the agent. Page 13
14 Upgrade the Database Agent On this page: Important Upgrade Notes Stop the Agent Back up the Existing Agent Directory Install the Agent Copy the controller-info.xml File Start the New Agent Verify the Database Agent Installation Related pages: Database Agent Configuration Properties Agent and Controller Compatibility Important Upgrade Notes If you are upgrading the Controller and agents, first upgrade the Controller and then upgrade the Database Agents. Shut down the Database Agent process before you install the new agent. All Database Agents that are running from the same install location need to be shut down when updating that install location. Download the installation package that is appropriate for your OS environment from the Download Center ( Back up the <db_agent_home> directory so you can revert to the previous installation if required. To maintain the same configuration information, you will also need the <db_agent_home>\conf\controller-info.xml file. If both the old and new agents are 4.2 or newer, you can keep the old agent running while installing the new agent, allowing you to upgrade the agent with no downtime. Once you see the new agent showing up as "ACTIVE" in the agents page in the controller, stop the old agent. Stop the Agent Stop the agent as described for your specific installation in Start and Stop the Database Agent. Back up the Existing Agent Directory Make a copy of the existing agent directory, <db_agent_home>. Backing up allows you to revert to the previous agent installation if you need to. You can also copy over the controller-info.xml configuration file to the new installation to ensure the agent configuration is maintained. Install the Agent Install the Database Agent as described for your specific installation in Administer the Database Agent. Copy the controller-info.xml File To ensure the agent configuration is maintained, copy the <backup_db_agent_home>\conf\controller-info.xml file to the new installation directory, <db_agent_home>\conf. Start the New Agent See Start and Stop the Database Agent. Verify the Database Agent Installation Page 14
15 See Verify the Database Agent Installation. Page 15
16 Uninstall the Database Agent Related pages: Administer the Database Agent Database Agent Configuration Properties Manage App Agents If you delete a Database Agent from the Controller UI, but do not shut down the JVM that the Database Agent runs on, the Database Agent will reappear in the UI the next time the Controller polls the agent. To prevent a Database Agent from connecting to the Controller, ensure it doesn't start up. This frees the license associated with the agent in the Controller and makes it available for use by another Database Agent. In most cases, uninstalling the Database Agent simply requires deleting the installation directory. However, if you have installed the agent as a service, you must also remove the service as described below. In all cases you must first stop the Database Agent service. After removing the service, delete the agent installation directory. Page 16
17 Configure the Database Agent Once you have installed and launched the Database Agent, you can further customize the agent. Database Agent Configuration Properties Enable SSL and SSH for Database Agent Communications Install the Database Agent as a Windows Service Enable Snapshot Correlation for Oracle Increasing JVM Memory Page 17
18 Database Agent Configuration Properties On this page: Where to Configure Database Agent Properties Example Database Agent controller-info.xml File Example Startup Configuration Using System Properties Database Agent Properties Required System Properties Optional System Properties Agent-Controller Communication Properties Multiple Agent Environment Properties Proxy Properties for the Controller Other Properties Related pages: Administer the Database Agent Where to Configure Database Agent Properties You can configure agent properties in the following locations: The controller-info.xml file located in the <db_agent_home> /conf directory The system properties (-D options) section in the JVM start-up script: java -D<db_agent_system_properties> -jar <db_agent_home>/db-agent.jar You can only configure agent properties related to naming agents or designating them as backup partners on the command line or in the JVM start-up script. However, you can specify the Controller/Agent connection details in the controller-info.xml file. The system properties override the settings in the controller-info.xml file. System properties are case-sensitive. Example Database Agent controller-info.xml File <?xml version="1.0" encoding="utf-8"?> <controller-info> <controller-host> </controller-host> <controller-port>8090</controller-port> <account-access-key>165e c1-40e a1424de9625</account-a ccess-key> <!-- The following attribute enables or disables SSL communications between the agent and the Controller.--> <controller-ssl-enabled>false</controller-ssl-enabled> <!-- The following account-related parameters are necessary only for SaaS installations--> <!--account-name></account-name--> </controller-info> Example Startup Configuration Using System Properties Page 18
19 A bash example. Note that the system properties are case-sensitive. -Dappdynamics.controller.hostName= Dappdynamics.controller.port=8090 Database Agent Properties This section describes the Database Agent configuration properties, including their controller-info-xml elements and their system property options. Required System Properties Path to the Agent jar File Description : Provides the absolute path to sqlijdbc_auth.dll. System Property: -jar Value: <db_agent_home>db-agent-jar Type: If <db_agent_name> contains spaces, you must enclose the entire name in double quotes (" ") on Windows and single quotes (' ') on Linux. Required: Yes Example: -jar="d:\\database Agent\db-agent.jar" Path to the Java Library Description : Provides the absolute path to sqlijdbc_auth.dll. System Property: -Djava.library.path Value: For 64-bit systems: <agent_home>\auth\x64 For 32-bit systems: <agent_home>\auth\x32 Type: If <db_agent_name> contains spaces, you must enclose the entire name in double quotes (" ") on Windows and single quotes (' ') on Linux. Required : Recommended. Required for SQL Server Windows Authentication on Windows 64-bit systems. Example: -Djava.library.path="D:\\Database Agent\auth\x64" Optional System Properties Disable Retry on Auth Failure Description : Stops retrying to establish JDBC connection when JDBC authentication fails. System Property: -Dretry.on.auth.failure=false Default: The system property is set to true. Type: String Supported Locales for Parsing Numbers Description: Specifies which locale to use for parsing numbers. See Java 7 Supported Locales or Java 8 Supported Locales for valid values. Use the values for the Java version that you are running in your environment. System Property: -Ddbagent.language Page 19
20 Default: The system property is set to en-us or en_us. Type: String Agent-Controller Communication Properties Controller Host Property Description: This is the host name or the IP address of the Controller, e.g or myhost or myhost.abc.com. This is the same host that you use to access the Controller UI. Element in controller-info.xml: <controller-host> System Property: -Dappdynamics.controller.hostName Type: String Default: None Required: Yes Controller Port Property Description: This is the HTTP(S) port of the Controller. This is the same port that you use to access the browser-based user interface. If the Controller SSL Enabled property is set to true, specify the HTTPS port of the Controller; otherwise specify the HTTP port. See Controller SSL Enabled Property. Element in controller-info.xml: <controller-port> System Property: -Dappdynamics.controller.port Type: Positive Integer Default: For on premises installations, port 8090 for HTTP and port 8181 for HTTPS are the default ports the Controller listens to. For the SaaS Controller Service, port 80 for HTTP and port 443 for HTTPS are the default ports the Controller listens to. Required: Yes Account Access Key Property Description: This is the account access key used to authenticate with the Controller. Element in controller-info.xml: <account-access-key> System Property: -Dappdynamics.agent.accountAccessKey Type: String Default: None Required: Yes. Prior to version 4.1, this property was required only for SaaS and multi-tenant Controllers. The account access key property is now required to authenticate all agent to Controller communications. Example: -Dappdynamics.agent.accountAccessKey=165e c1-40e a1424de9625 Multiple Agent Environment Properties The following properties are useful when you are configuring your system to include more than one Database Agent. Database Agent Name Property Description: This property uniquely identifies the Database Agent to the Controller. System Property: -Ddbagent.name=<db_agent_name> Type: ASCII string, including spaces. If <agent_name> contains spaces, you must enclose the entire name in double quotes (" "). Default: Default Database Agent Required: Required when you have more than one Database Agent reporting to the Controller. Page 20
21 You may want to run multiple Database Agents under the following conditions: When you have databases spread across multiple networks, and one machine cannot access all the databases on all the networks. In this case you can have a uniquely named Database Agent in each network that monitors the databases only visible on that network. If you have multiple SQL Server instances that each require different credentials, and you want to connect to them via Windows Authentication. When using Windows Authentication, the Database Agent will use the credentials of the currently logged in user. When you want one or more agents to back up a primary agent. The database agent names for your backup agents must match the database agent name of your primary agent. The last agent you launch will be the primary agent. Example: -Ddbagent.name="Scarborough Network Database Agent" Multi-Tenant Mode Properties If the Controller is running in multi-tenant mode or if you are using the SaaS Controller, specify the account name and account access key for this agent to authenticate with the Controller. If the Controller is running in single-tenant mode (the default) there is no need to configure these values. Account Name Property Description: This is the account name used to authenticate with the Controller. If you are using the SaaS Controller, the Account Name is in the Welcome sent to you. Element in controller-info.xml: <account-name> System Property: -Dappdynamics.agent.accountName Type: String Default: None Required: Yes for SaaS Controller and other multi-tenant users No for single-tenant users. Proxy Properties for the Controller These properties route data to the Controller through a proxy. Proxy Host Property Description: This is the proxy host name or IP address. Element in controller-info.xml: Not applicable System Property: -Dappdynamics.http.proxyHost Type: String Default: None Required No Proxy Port Property Description: This is the proxy HTTP(S) port. Element in controller-info.xml: Not applicable System Property: -Dappdynamics.http.proxyPort Type: Positive Integer Default: None Required: No Page 21
22 Other Properties Controller SSL Enabled Property Description: This property specifies whether the agent should use SSL (HTTPS) to connect to the Controller. If SSL Enabled is true, set the Controller Port property to the HTTPS port of the Controller. See Controller Port Property. Element in controller-info.xml: <controller-ssl-enabled> System Property: -Dappdynamics.controller.ssl.enabled Type: Boolean Default: False Required: No Sybase Disabled Property Description: This property specifies whether the agent should disable Sybase. You may want to disable Sybase monitoring with Database Visibility if you are already using other tools to monitor Sybase. Refer to Sybase Database Permissions for information on configuring Sybase permissions. Element in controller-info.xml: Not applicable System Property: -Ddbagent.disable.sybase.ase.system.monitoring Type: Boolean Default: False Required: No Page 22
23 Enable SSL and SSH for Database Agent Communications On this page: Enable SSL for the Database Agent Enable SSH for the Database Agent Enable SSL for the Database Agent This topic covers how to configure the Database Agent to connect to the Controller using SSL. It assumes that you use a SaaS Controller or have configured the on premise Controller to use SSL. The Database Agent supports extending and enforcing the SSL trust chain when in SSL mode. Requirements Gather the following information: The Controller SSL port. For SaaS Controllers the SSL port is 443. For on premises Controllers the default SSL port is 8181, but you may configure the Controller to listen for SSL on another port. The signature method for the Controller's SSL certificate: A publicly known certificate authority (CA) signed the certificate. This applies for DigiCert, Verisign, Thawte, and other commercial CAs. A CA internal to your organization signed the certificate. Some companies maintain internal certificate authorities to manage trust and encryption within their domain. The Controller uses a self-signed certificate. Establish Trust for the Controller's SSL Certificate To establish trust between the Database Agent and the Controller, you must create an agent truststore that contains the root certificate for the authority that signed the Controller's certificate. If you secured your on premises Controller with a self-signed certificate, see Keystore Certificate Extractor Utility for instructions to create the agent keystore Obtain one of the following root certificates: DigiCert Global Root CA for the SaaS Controller the root certificate for the publicly known certificate authority (CA) that signed the certificate for your on premises Controller the root certificate for the internal CA that signed the Controller certificate for your on premises Controller Run the Java keytool command to create the Database Agent truststore: keytool -import -alias rootca -file <root_certificate_file_name> -keystore cacerts.jks -storepass <truststore_password> For example: keytool -import -alias rootca -file /usr/home/appdynamics/digicertglobalrootca.pem -keystore cacerts.jks -storepass MySecurePassword Make note of the truststore password, you need it to configure the Database Agent. Page 23
24 3. Install the agent truststore to the Database Agent configuration directory: <db_agent_home>/conf/ Secure the Database Agent Truststore recommends you take the following security measures to prevent tampering with the Database Agent truststore: Secure the truststore file through file system permissions: Make the Database Agent truststore readable by any user. Make the truststore owned by a privileged user. Make the truststore writable only by the specified privileged user. Secure the Database Agent configuration files so that they are only readable by the agent runtime user and only writable by a privileged user: Global configuration file: <db_agent_home>/conf/controller-info.xml. Configure SSL System Properties for the Database Agent 1. Configure the following system properties in the versioned controller-info.xml: <db_agent_home>/<version_number>/conf/controller-info.xml. See "SSL Configuration Properties" on Data base Agent Configuration Properties for full details on each property. Controller Port: the SSL port for the controller. 443 for SaaS. <controller-port>443</controller-port> Controller SSL Enabled: true. <controller-ssl-enabled>true</controller-ssl-enabled> Controller Keystore Password: the plain text password for the Database Agent truststore. <controller-keystore-password>mysecurepassword</controller-keystore-password> Controller Keystore Filename: path of the Database Agent truststore relative to <db_agent home>/<version>/conf. Required if you use a truststore other than the default <db_agent_home>/<version_number>/conf/cacerts.jks. <controller-keystore-filename>../../conf/cacerts.jks</controller-keystore-filename> You can specify the Controller port and enable SSL for the Controller in the JVM startup script, but you must specify the truststore password and filename in the controller-info.xml file. 2. Save your change to the controller-info.xml file and restart the Database Agent. Sample SSL controller-info.xml configuration Page 24
25 <?xml version="1.0" encoding="utf-8"?> <controller-info> <controller-host>mycompany.saas.appdynamics.com</controller-host> <controller-port>443</controller-port> <controller-ssl-enabled>true</controller-ssl-enabled> <controller-keystore-password>mysecurepassword</controller-keystore -password> <controller-keystore-filename>../../conf/cacerts.jks</controller-ke ystore-filename>... </controller-info> Keystore Certificate Extractor Utility The Keystore Certificate Extractor Utility exports certificates from the Controller's Java keystore for the Database Agent truststore. It installs to the following location: <agent_home>/utils/keystorereader/kr.jar To avoid copying the Controller keystore to a Database Agent machine, you can run this utility from the Controller server. Access the agent distribution on the Controller at the following location: 1. Run the Keystore Certificate Extractor Utility from the Controller as follows: % java - jar <controller_home>/appserver/glassfish/domains/domain1/appagent/ <controller_version>/utils/keystorereader/kr.jar 2. Enter the following when prompted: The full path to the Controller's keystore: Enter input keystore: <controller_home>/appserver/glassfish/domains/domain1/conf ig/keystore.jks The truststore output file name. By default the Database Agent looks for cacerts.jks. Enter output agent truststore file name: <controller_home>/appserver/glassfish/domains/domain1/conf ig/keystore.jks The password for the Controller's certificate, which defaults to "changeit". If you don't include a password, the extractor applies the password "changeit" to the output truststore. Page 25
26 Example command to execute kr.jar java -jar kr.jar <controller_home>/appserver/glassfish/domains/domain1/conf ig/keystore.jks cacerts.jks <controller_certificate_password> 3. Install the agent trust store to the agent configuration directory: <db_agent_home>/conf/ Enable SSH for the Database Agent For Linux hosts only Applies only when Database Agent is running on a Linux host. When the Database Agent is running on Linux and you want to monitor hardware, except to monitor the local host, authentication is required and a password is passed between the Database Agent and the database server. SSH port option The SSH port option does not appear unless the Database Agent is running on Linux. 1. Generate the rsa or dsa key as follows: Generate rsa key % ssh-keygen -b f id_rsa -t rsa or Generate dsa key % ssh-keygen -b f id_dsa -t dsa This will create a rsa or dsa, 1024-bit key and put the keys into /home/<user_name>/.ssh/id_rsa and /home/<user_name>/.ssh/id_rsa.pub or /home/<user_name>/.ssh/id_dsa' and /home/<user_name>/.ssh/ida_dsa.pub' files. Do not change the names of these files. Copy the private key, /home/<user_name>/.ssh/id_rsa or /home/<user_name>/.ssh/id_id_dsa into the <db-agent_home>/keys directory. Verify that you have the correct permissions on the.ssh directory, or set them as follows: Page 26
27 % cd /home/<user_name> % chmod 755.ssh.ssh directory permissions 4. Verify that you have a /home/<user_name>/.ssh/authorized_keys file. If you do not have this file, create the authorized_keys file as follows: % cd /home/<user_name>/.ssh % touch.ssh/authorized_keys Create authorized_keys file 5. Verify that you have the correct permissions to the /home/<user_name>/.ssh/authorized_keys file, or change the permissions as follows: % cd /home/<user_name>/.ssh % chmod 644 authorized_keys authorized_keys file permissions 6. Append (do not copy) the file 'id_rsa.pub' or the file 'id_dsa.pub' to the file, /home/<user_name>/.ssh/authorized_keys, such as follows: Append rsa public key to authorized key % echo /home/<user_name>/.ssh/id_rsa.pub >> /home/<user_name>/.ssh/authorized_keys or Append dsa public key to authorized key % echo /home/<user_name>/.ssh/id_dsa.pub >> /home/<user_name>/.ssh/authorized_keys If you are using a dsa key, append the contents of /home/<user_name>/.ssh/id_dsa.pub to the ~/.ssh/authorized_keys file on the machine running Pro. The SSH port of the database Collector is set to 22 by default. You can change it by navigating to the Monitoring Hardware section of the Collector configuration dialog. In the dialog, set the SSH port to the port your require. Save your change to the Collector configuration and restart the Database Agent. Enable SSH via PEM certificate For Linux, also supports certificate-based authentication via Privacy Enhanced Mail (PEM). To implement certificate-based authentication: Enable the Use certificate option in the Monitoring hardware section of the Collector configuration dialog. Copy the PEM file to the <db_agent_home>/keys directory. Note, if the home/<user_home>/.ssh directory exists, the agent will Page 27
28 3. use the certificate found there. Restart the agent. Page 28
29 Monitor SSL-enabled PostgreSQL on Amazon RDS If your PostgreSQL instance uses SSL connections, you must complete the following steps to monitor it Download PEM file from Amazon and copy to a local directory. Convert the PEM file to a DER file using the following openssl command: openssl x509 -outform der -in rds-combined-ca-bundle.pem -out rds-combined-ca-bundle.der 3. Add the certificate to the Java keystore using the following command: sudo keytool -import -noprompt -trustcacerts -alias AmazonRDS -file rds-combined-ca-bundle.der -keystore $JAVA_HOME\jre\lib\security\cacerts -storepass changeit You can verify that the certificate was added by running the following command: keytool -list -keystore $JAVA_HOME/jre/lib/security/cacerts -storepass changeit Re-start the dbagent process to register the certificate you added. In the Controller, create a new collector for PostgreSQL. In the Custom JDBC Connection String field, enter the following JDBC string: jdbc:postgresql://<rds-hostname>:<rds-port>/postgres?ssl=true Page 29
30 Install the Database Agent as a Windows Service On this page: Install the Database Agent as a Windows Service - Pre Windows 2008 Install the Database Agent as a Windows Service - Windows 2008 and 2012 Uninstall the Database Agent as a Service Known Issues Running the Agent on Windows Using the Task Scheduler Related pages: Administer the Database Agent Database Agent Configuration Properties Database Visibility Most Windows server software runs as a service when the machine boots up. To secure your environment and ensure Database Agent availability, you can install the Database Agent as a Windows service using the SRVANY.EXE and SC.EXE utilities that are part of the Microsoft Resource Kit for Windows 2003 Server. The SRVANY.EXE tool creates a Windows service that launches the JVM processes for the agent in non-gui mode using parameters specified in the registry of the service. The SC.EXE command is used to install and uninstall the agent service. Install the Database Agent as a Windows Service - Pre Windows 2008 The following procedure involves editing the registry. Before proceeding, know how to backup and restore the registry as described in the WIndows Registry Editor online help Install the agent as usual, described in Install the Database Agent. Obtain the INSTSRV.EXE and SC.EXE utilities. Download the Windows Server 2003 Resource Kit Tools, at The required utilities are included in this resource kit 3. Prepare registry and batch command files. To simplify service creation and deregistration, we have attached two batch command files, InstallService.cmd and UninstallService.cmd to this page. InstallService.cmd requires the information in the DatabaseAgent.reg file to set the registry key for the service. DatabaseAgent.reg to set the registry key values for the service InstallDBService.cmd to install the service UninstallDBService.cmd to uninstall the service a. Download these files and edit them as indicated below. Specify the same service name in all three files. Customize DatabaseAgent.reg. Edit the service name, Application, AppParameters, and AppDirectory values of this file for your environment. Specify the service name is specified on the first line of this file. Database Agent Service in the sample attached. Application is the path to the JDK you use for Database Agent. <db_agent_home> \\jre7\\bin\\java.exe in the sample attached. The Database Agent is compatible with JRE 1.7 and 1.8 AppParameters is everything you want to pass to the JVM as arguments. For a 32-bit system, set java.library.path="<db_agent_home>\auth\x32", the absolute path For a 64-bit system, set java.library.path="<db_agent_home>\auth\x64", the absolute path If your agent will be monitoring more than 100 databases, increase the size of the initial memory allocation specified in the code example below as follows: change -Xmx32m to -Xmx256m Page 30
31 For 64-bit systems, allocating 32 MB of initial heap size java -Djava.library.path="<db_agent_home>\auth\x64" -Xms32m -jar "<agent_home>\db-agent.jar" b. AppDirectory points to the agent working directory, the location where you installed the Database Agent. <agent_home>. Customize InstallDBService.cmd. Edit the create and binpath values in this file for your environment. Specify the service name in quotes in the sc command create option as follows: sc create " Database Agent Service" in the sample attached. Specify binpath as the path to the SRVANY.EXE Windows Resource <agent_home>\srvany.exe in the sample attached The service installed runs with the permissions of the user logged in when service is created. To change the user running the installed process, modify InstallService.cmd by inserting the following anywhere before "pause" at the end of the file. sc config <service> obj= <username> password= <password> Note: There is a required space between obj= and <username>. c. Customize UninstallDBService.cmd UninstallDBService.cmd - Uninstalls the Database Agent off rem UnInstall Database Agent Service echo "Stopping Database Agent Service - may be running" sc stop " Database Agent Service" echo "Uninstalling Database Agent Service from the Service Manager" sc delete " Database Agent Service" echo "done." pause d. Specify the name of the service in quotes after the sc stop or delete options. " Database Agent Service" in the sample file attached. 4. From the Windows Explorer, right-click InstallDBService.cmd and click Run as Administrator. Install the Database Agent as a Windows Service - Windows 2008 and 2012 Download NSSM - the Non-Sucking Service Manager. Create a start.bat file containing your agent startup script, such as: java -Djava.library.path="<agent_home>\auth\x64" -jar "<agent_home>db-agent.jar" where <agent_home> is where you installed the Database Agent. Note that if the agent configuration property values contain spaces, you must enclose the entire name in double quotes (" "). For example, Page 31
32 Windows, 64-bit system with 256 MB initial memory allocation java -Djava.library.path="<db_agent_home>\auth\x64" -Ddbagent.name=" Scarborough Network Database Agent" -Dappdynamics.agent.uniqueHostId="Scarborough Network Database Agent Host" -jar "<db_agent_home>\db-agent.jar" For a 32-bit system, set java.library.path="<db_agent_home>\auth\x32" as the absolute path For a 64-bit system, set java.library.path="<db_agent_home>\auth\x64" as the absolute path If your agent will be monitoring more than 100 databases, increase the size of the initial memory allocation specified in the code example below as follows: change -Xmx32m to -Xmx256m Add the path to nssm.exe to your Path environment variable. Start a command shell and enter the following: nssm.exe install <service name> where <service name> is the name of the agent service. In the NSSM service installer dialog, enter the full path to the agent startup script in the Path field of the Application tab. Enter any other details appropriate for your environment. For information on the various options, see the NSSM documentation. Click Install service. A service is created named <service name>, that starts up automatically when the machine is started and that is also restarted if the process stops for any reason. Uninstall the Database Agent as a Service If you used INSTSRV.EXE and SC.EXE utilities: From the Windows Explorer, right-click UninstallService.cmd and click Run as Administrator. This stops and removes the service from Windows. If you used NSSM: From a command shell, enter nssm.exe remove <service name> where <service name> is the name of the agent service. Known Issues In Windows Server 2003 you must install and start or stop the service from the console window. If you do a normal RDP connection to the 2003s Terminal Services the service will be stopped when you log-out. Therefore issue the command "mstsc /console <machinename>" to connect to the console session of Windows Server Running the Agent on Windows Using the Task Scheduler It is recommended to run the Database Agent as a Windows service. However, if you choose to run the agent using Task Scheduler, ensure the agent runs with the highest privileges available. When using Task Scheduler, if the host is restarted, the agent will not start automatically. Page 32
33 Enable Snapshot Correlation for Oracle In order for the Oracle Collector Database Visibility to collect database queries, sessions, clients, and schemas information that occurred during snapshots captured by the Java Agent, you need to set the jdbc-dbcam-integration-enabled App Agent property for the Java Agent. For information on the jdbc-dbcam-integration-enabled property, see App Agent Node Properties Reference. For information on snapshot correlation between the Oracle database Collector and a Java business transaction, see Access Database Visibility from Application Monitoring Views Page 33
34 Increasing JVM Memory To monitor 100 or more databases, you may need to increase the JVM memory allocation size. Increased activity on the databases you are monitoring results in increased memory usage. On Linux, use this command to start the agent, and to initially allocate 256 MB to the agent instead of the default of 64 MB. For Windows 64-bit C:\java -Xmx256m -Djava.library.path="<db_agent_home>\auth\x64" -jar <db_agent_home>\db-agent.jar Page 34
35 Configure Controller Settings for Database Agents You can configure parameters for the controller, such as the number of events sent to the Events Service at a time. To Change the Controller Settings for Database Agents Log in to the Administration Console. Click Controller Settings. Change the settings as needed and Save. Controller Settings Reference for Database Agents Property Name About the property Default Minimum value dbmon.event.publisher.esclient.batch.size Batch size for each Event Service client used by Database Monitoring dbmon.event.publisher.queue.size Maximum measurement queue size maintained by Database Monitoring Page 35
36 Start and Stop the Database Agent On this page: Start the Agent Stop the Agent Reset the Agent Start the Agent If you are using an on-premises version of Database Visibility, you must start the Events Service before you start the Database Agent. Before starting the agent, you must configure the properties in this file. You must specify these properties: Controller Host Property, Controller Port Property, and Account Access Key Property. Start the Agent in a Command Shell The following assumes that all the necessary parameters have been specified in the controller-info.xml. The controller-info.xml file describes the properties of agent to Controller communications. Note that <db_agent_home> is the absolute path to the location where the Database Agent is installed. Setting the heap size is recommended as shown below. Windows cd <db_agent_home> start-dbagent.bat -Xms<min_heap_size> -Xmx<max_heap_size> Linux cd <db_agent_home>./start-dbagent -Xms<min_heap_size> -Xmx<max_heap_size> & Start the Agent as a Service See Install the Database Agent as a Windows Service, Start the Database Agent Automatically on Windows, and Start the Database Agent Automatically on Linux. Stop the Agent Stop the Agent in a Command Shell If the Database Agent process is running in the background, you can stop it by simply entering the kill command with the process ID as the argument. If it is running in the foreground in a console, you can press Ctrl+C to shut down the agent. Stop the Agent Service in Windows In the Windows Services application, select Database Agent and click Stop. Reset the Agent If you want the agent to automatically restart after you stop it, you can reset the agent. The reset operation purges all existing data for an agent and starts gathering them again. 1. Using an Administrator account, login to the Controller UI, click Settings > Agents > Databases tab and select a Database Agent. 2. Click Reset Selected Database Agent. Page 36
37 Page 37
38 Start the Database Agent Automatically on Linux Related pages: Install the Database Agent Database Agent Configuration Properties 1. Create an initialization script that starts the agent, as in the sample initialization script that is an attachment to this page. In your script, set the JAVA and AGENT_HOME values to the paths for your system. Also configure agent options, as needed. 2. Enable execution permissions for the script. For example, given an initialization script named db-agent, enter: sudo chmod 775 db-agent 3. Place the script in the initialization directory on your system, typically /etc/init.d. Alternatively, create a symbolic link to the script from the init.d directory to the script if you want to keep it in another location. 4. Add the script as a service as follows: On Red Hat and most Linux Operating Systems, run these commands, replacing " db-agent" with the name of your file or symbolic link: chkconfig --add db-agent chkconfig --level 2345 db-agent on On Ubuntu and Debian Operating Systems, run this command, replacing "appdcontroller" with the name of your file or symbolic link: update-rc.d -f db-agent start In the command: start is the argument given to the script (start, stop). 99 is the start order of the script (1 = first one, 99 = last one) are the runlevels to start Be sure to include the dot (.) at the end of the command. The Database Agent now starts automatically upon machine startup. When setting the agent to automatically start up using Task Scheduler when the machine starts or restarts, ensure the agent runs with the highest privileges available. Page 38
39 Start the Database Agent Automatically on Windows Related pages: Administer the Database Agent Database Agent Configuration Properties 1. Create a batch file containing the following line: For 64-bit systems, allocating 32 MB of initial heap size java -Xmx2048m -Djava.library.path="<adb_gent_home>\auth\x64" -jar <db_agent_home>\db-agent.jar Select. When setting the agent to automatically start up using Task Scheduler when the machine starts or restarts, ensure the agent runs with the highest privileges available. 6. Enter the administrator's credentials to run the Database Agent as that user. 7. Click Finish. 8. For a 32-bit system, the set java.library.path="<db_agent_home>\auth\x32" If your agent will be monitoring more than 100 databases, you may need to increase the size of the initial memory allocation specified in the code above as follows: change -Xmx2048m to -Xmx26624m Click Control panel > Scheduled Tasks. Select the batch file to execute. This is the file created in step 2. Create a new task. When my computer starts To start the Database Agent for the first time, right-click on the scheduled task, and click Run. Page 39
40 Add Database Licenses On this page: Add New Licenses Transfer a License Between Databases Related pages: Add Database Collectors License Management The Controller requires a license for the total number of databases to monitor concurrently. One database agent can monitor 100+ databases. Add New Licenses Obtain a license.lic file with your existing licenses plus the new licenses from support. Copy the license file in the Controller home directory. The Controller may take a few minutes to detect the new license. Restart the Controller to force immediate license detection. Settings (gear icon) > License displays license information. The Application Performance Management and Database Server Monitoring section shows the number of database license units provisioned and the maximum number allowed. In general one license unit is required for each database instance. For Oracle or IBM DB2, if an instance comprises more than eight cores, then an additional license unit is required for each set of 8 cores. For MongoDB, each primary node requires one license. Transfer a License Between Databases A database license is allocated to the first agents that register with the Controller up to the licensed limit. To transfer a license for the Database Agent to another database, you simply remove the Collector for the old database and then add a new Collector for the database you want to monitor instead. See Add Database Collectors. Page 40
41 Add Database Collectors On this page: Prepare for Collector Configuration Add a Database Collector Edit a Database Collector Delete a Database Collector Troubleshooting Collector Problems To enable the Database Agent to collect data, you must add and configure a Database Collector for each database instance that you want to monitor. The Database Collector is the process that runs within the Database Agent to collect performance metrics about your database instances and database servers. Prepare for Collector Configuration You must have the required permissions to monitor your databases. See Database Visibility Requirements and Supported Environments. For required roles and permissions required to add, edit, and create collectors, see Roles and Permissions. Add a Database Collector Click the Configuration tab in the left panel menu. Click the Collectors option. In the Collectors window, click the Add ( + ) option. Complete each field of the Create New Collector dialog and then click OK. Your database administrator can provide you with the necessary details. After you have added a collector, you can configure the collector for your database. You can also link a database on the application flow maps to a database instance monitored by Database Visibility. Hardware Monitoring For information on the fields you must complete in order for the Database Agent to monitor the database server in addition to the database server, see Configure the Database Agent to Monitor Server Hardware. Verify Collector Setup Once the Collector is up and running, in just a short time you can start viewing the historical activity data. The Collector configuration window now has a collector icon you can click to edit the details of the collector if required. The Collector will also appear in the list of Databases shown in the left navigation menu. It might take a few minutes before the Collector and its metrics are reported. From the left navigation menu, click Databases to see a high-level view of the activity of all the configured Collectors. Click the name of the database to see more details of the metrics Database Monitoring has captured. For information on using and interpreting the Collector windows, see Monitor Databases and Database Servers. Edit a Database Collector Page 41
42 From the Collectors window, you can edit any of the details of the collector except the type of database platform to monitor. For more information on collector fields, see the collector configuration page for your database. Configure IBM DB2 Collectors Configure Microsoft SQL Server Collectors Configure Microsoft Azure Collectors Configure MongoDB Collectors Configure MySQL Collectors Configure Oracle Collectors Configure PostgreSQL Collectors Configure Sybase Collectors Configure Sybase IQ Collectors Delete a Database Collector From the Collectors window, you can delete a database Collector. Troubleshooting Collector Problems Collectors that have not been configured correctly, or that cannot connect to the database for any reason, will show an error on the Databases overview page and individual database dashboards. Hovering over the error icon displays the potential reason for the error. If your Collector isn't reporting any metrics after a few minutes, and you know the database is up and running with activity, check the Events window. Agent Diagnostic Events can appear if the password is incorrect or communication errors have occurred. The message summaries on the Events window can help you diagnose and troubleshoot Collector problems. Check the collector configuration to ensure all the values you entered are correct. Ensure that your Database Agent has network connection to the databases you want to monitor along with the required permissions. See Database Monitoring Requirements and Supported Environments. Watch the video: Page 42
43 Configure IBM DB2 Collectors On this page: Connection Details User Permissions for IBM DB2 LUW To monitor IBM DB2 with Database Visibility, you must be running DB2 9.x or newer. Connection Details Field Database Type Database Agent Name Hostname or IP Address Listener Port Custom JDBC Connection String Username Password CyberArk Logging Enabled Description The database type that you want to monitor. The Database Agent that manages the collector. The name you want to identify the collector by. The hostname or IP address of the machine that your database is running on. The TCP/IP address of the port on which your database communicates with the Database Agent The JDBC connection string generated by the database agent. You can also specify a custom connection string, which is useful for setting custom authentication options. The name of the user who is connecting to and monitoring the database through the Database Agent. The user should have the permissions described in User Permissions for IBM DB2 LUW. The password of the user who is connecting to and monitoring the database through the Database Agent. Click to enable CyberArk for database username and password. When CyberArk is enabled, information about Safe, Folder, and Object is required to fetch the username and password for your database. To use CyberArk with Database Visibility, you must download the JavaPasswordSDK.jar file from the CyberArk web site and rename the file to cyberark-sdk-9.5.jar. Then, you must copy the JAR file to the lib directory of the database agent zip file. Click to enable verbose mode logging, which logs all communications between the Controller and the Collector. Enable only during troubleshooting because logging consumes a lot of disk space. If you have enabled logging, you can click the logging icon in the Log column of the Collector Administration window to view the log file. The log files are located in the <db_agent_home>\agent directory and have the format <CollectorName>_out.log and <CollectorName> _ err.log. User Permissions for IBM DB2 LUW The monitoring user needs SYSMON authority and connect privileges to monitor. In general, this user must be a part of the sysmon_group. DB2 version 9.7 and greater For complete Database Visibility functionality, the following monitoring switches of the DB2 server need to be enabled: "TIMESTAMP". You can enable the "TIMESTAMP" monitoring switch by the following commands: Page 43
44 update dbm cfg using dft_mon_timestamp on; Privileges grant select on SYSIBMADM.MON_CURRENT_SQL to user DBMon_Agent_User grant select on SYSIBMADM.MON_LOCKWAITS to user DBMon_Agent_User grant execute on function SYSPROC.MON_GET_CONNECTION to user DBMon_Agent_User grant select on SYSIBMADM.SNAPAPPL_INFO to user DBMon_Agent_User grant EXECUTE on function SYSPROC.MON_GET_PKG_CACHE_STMT to user DBMon_Agent_User (version 10.5 and above) grant execute on function SYSPROC.MON_GET_TRANSACTION_LOG to DBAgent_User (version 10.5 and above) grant execute on function SYSPROC.MON_GET_DATABASE to DBAgent_User Replace DBMon_Agent_User with the user name under which you run the Database Visibility Agent. DB2 version 9.5 For complete Database Visibility functionality, the following monitoring switches of the DB2 server need to be enabled: "STATEMENT", and "TIMESTAMP". You can enable these monitoring switches by the following commands: update dbm cfg using dft_mon_stmt on; update dbm cfg using dft_mon_timestamp on; Privileges grant select on SYSIBMADM.SNAPSTMT to user DBMon_Agent_User grant select on SYSIBMADM.SNAPAPPL_INFO to user DBMon_Agent_User grant select on table SYSIBMADM.ENV_PROD_INFO to user DBMon_Agent_User where DBMon_Agent_User is the user name under which you run the Database Visibility Agent. Page 44
45 Configure Microsoft SQL Server Collectors On this page: Connection Details User Permissions for Microsoft SQL Server To monitor Microsoft SQL Server with Database Visibility, you must be running the 2005 version or newer. Connection Details Field Database Type Database Agent Database Name Hostname or IP Address Failover Partner Listener Port Custom JDBC Connection String Window Authentication Username Password CyberArk Logging Enabled Description The database type that you want to monitor. The Database Agent that manages the collector. Specify "master." All databases within a single SQL Server instance are monitored from a single collector. The name you want to identify the collector by. The hostname or IP address of the machine that your database is running on. The hostname or IP address of the failover partner. The TCP/IP address of the port on which your database communicates with the Database Agent The JDBC connection string generated by the database agent. You can also specify a custom connection string, which is useful for setting custom authentication options. Click to enable Windows authentication when connecting to the database. The name of the user who is connecting to and monitoring the database through the Database Agent. The user should have the permissions described in User Permissions for Microsoft SQL Server. The password of the user who is connecting to and monitoring the database through the Database Agent. Click to enable CyberArk for database username and password. When CyberArk is enabled, information about Safe, Folder, and Object is required to fetch the username and password for your database. To use CyberArk with Database Visibility, you must download the JavaPasswordSDK.jar file from the CyberArk web site and rename the file to cyberark-sdk-9.5.jar. Then, you must copy the JAR file to the lib directory of the database agent zip file. Click to enable verbose mode logging, which logs all communications between the Controller and the Collector. Enable only during troubleshooting because logging consumes a lot of disk space. If you have enabled logging, you can click the logging icon in the Log column of the Collector Administration window to view the log file. The log files are located in the <db_agent_home>\agent directory and have the format <CollectorName>_out.log and <CollectorName> _ err.log. User Permissions for Microsoft SQL Server The user account used for monitoring can be a Windows authenticated account (if the Database Agent is running on Windows) or SQL Server authenticated (if Database Visibility is running on Windows or Linux). Page 45
46 Required Permissions to See Execution Plans The SQL Server user, specified in the Create Collector > Connection Details section must be a SQL Server Authenticated user that is a member of the sysadmin server role or a Windows Authenticated Account with SHOWPLAN access on each database. For more information, see Showplan Security and SHOWPLAN Permission and Transact-SQL Batches in the SQL Server documentation. Minimum Permissions Required for SQL Server Logon You can use the procedure below to create a SQL Server user with the minimum permissions required. Use the following to create a SQL Server logon user that provides the minimal level of permissions required in order to gain full Database Visibility/SQL Server functionality Using SQL Server Management Studio, create a new login for the SQL Server Database Collector, such as DBMon_Agent_User. From the User Mapping tab, map the new user to the master and msdb databases. Viewing Object Information To view object information on the Database > Objects Browser, map the monitoring user to the databases of interest. 3. Once you have created the login, give the following privileges to the user, substituting DBMon_Agent_User with the name you specified on the Login - New window: Note: You can execute the following as a batch from a query window in Management Studio. The example shows grants to DBMon_Agent_User; remember to change this if you have set up a different login. use master GRANT VIEW ANY DATABASE TO DBMon_Agent_User; GRANT VIEW ANY definition to DBMon_Agent_User; GRANT VIEW server state to DBMon_Agent_User; GRANT SELECT ON [sys].[sysaltfiles] TO DBMon_Agent_User GRANT execute on sp_helplogins to DBMon_Agent_User GRANT execute on sp_readerrorlog to DBMon_Agent_User use msdb GRANT SELECT on dbo.sysjobsteps TO DBMon_Agent_User GRANT SELECT on dbo.sysjobs TO DBMon_Agent_User GRANT SELECT on dbo.sysjobhistory TO DBMon_Agent_User where DBMon_Agent_User is the name of the SQL Server user account specified in Create New Collector, Connection Details, Username field. SQL Server Authentication If you are running Database Visibility on Linux then you must use SQL Server authentication. If your SQL Server database allows mixed-mode authentication, then the SQL Server Database Visibility uses to monitor the SQL Server database can use a SQL Server username/password authenticated account. If you would like to lock the role/permissions for the account down, then the account running Database Visibility requires: View any database Page 46
47 View any definition View server state One additional requirement for I/O monitoring is to give permissions on a System view called sys.sysaltfiles. To do this you need to select the master database > Views > System Views > Properties for sys.sysaltfiles and then give select permissions on the object to the Public role. Windows Authentication If you would like to use a Windows authenticated account to connect to the SQL Server database, the following is required: When creating the collector from the Create New Collector dialog, do not specify Username and Password in the database Connection Details. Also, the agent must be started with the path to its authentication library. For more information see, Windows Authentication for Microsoft SQL Server. Access Rights The following Select privileges are required: xp_msver sys.dm_exec_requests sys.dm_exec_sessions sys.dm_os_performance_counters sys.dm_exec_query_stats ::fn_virtualfilestats sys.sysaltfiles sys.configurations sys.dm_exec_sql_text sys.sysperfinfo sys.sysprocesses sys.syscurconfigs ::fn_get_sql Page 47
48 Microsoft SQL Server on AWS RDS Permissions The user account used for monitoring can be a Windows authenticated account (if the Database Agent is running on Windows) or SQL Server authenticated (if Database Visibility is running on Windows or Linux). Minimum Permissions Required for SQL Server Logon You can use the procedure below to create a SQL Server user with the minimum permissions required. Use the following to create a SQL Server logon user that provides the minimal level of permissions required in order to gain full Database Visibility/SQL Server functionality Using SQL Server Management Studio, create a new login for the SQL Server Database Collector, such as DBMon_Agent_User. From the User Mapping tab, map the new user to the master and msdb databases. Viewing Object Information To view object information on the Database > Objects Browser, map the monitoring user to the databases of interest. 3. Once you have created the login, give the following privileges to the user, substituting DBMon_Agent_User with the name you specified on the Login - New window: Note: You can execute the following as a batch from a query window in Management Studio. The example shows grants to DBMon_Agent_User; remember to change this if you have set up a different login. use master ALTER SERVER ROLE processadmin ADD MEMBER DBMon_Agent_User; GRANT VIEW ANY DATABASE TO DBMon_Agent_User; GRANT VIEW ANY definition to DBMon_Agent_User; GRANT VIEW server state to DBMon_Agent_User; where DBMon_Agent_User is the name of the SQL Server user account specified in Create New Collector, Connection Details, Username field. To generate an execution plan on AWS RDS, you need additional permissions. The SHOWPLAN permission must be provided explicitly for each database: USE <DB NAME> go GRANT SHOWPLAN to DBMon_Agent_User; go Page 48
49 Configure Microsoft Azure Collectors On this page: Connection Details User Permissions for Microsoft Azure To monitor Microsoft Azure with Database Visibility, you must be running version 2008 or newer. Connection Details Field Database Type Database Agent Database Name Hostname or IP Address Failover Partner Listener Port Custom JDBC Connection String Username Password CyberArk Logging Enabled Description The database type that you want to monitor. The Database Agent that manages the collector. Specify "master." All databases within a single SQL Server instance are monitored from a single collector. The name you want to identify the collector by. The hostname or IP address of the machine that your database is running on. The hostname or IP address of the failover partner. The TCP/IP address of the port on which your database communicates with the Database Agent The JDBC connection string generated by the database agent. You can also specify a custom connection string, which is useful for setting custom authentication options. The name of the user who is connecting to and monitoring the database through the Database Agent. The user should have the permissions described in User Permissions for Microsoft Azure. The password of the user who is connecting to and monitoring the database through the Database Agent. Click to enable CyberArk for database username and password. When CyberArk is enabled, information about Safe, Folder, and Object is required to fetch the username and password for your database. To use CyberArk with Database Visibility, you must download the JavaPasswordSDK.jar file from the CyberArk web site and rename the file to cyberark-sdk-9.5.jar. Then, you must copy the JAR file to the lib directory of the database agent zip file. Click to enable verbose mode logging, which logs all communications between the Controller and the Collector. Enable only during troubleshooting because logging consumes a lot of disk space. If you have enabled logging, you can click the logging icon in the Log column of the Collector Administration window to view the log file. The log files are located in the <db_agent_home>\agent directory and have the format <CollectorName>_out.log and <CollectorName> _ err.log. User Permissions for Microsoft Azure The user account used for monitoring can be a Windows authenticated account (if the Database Agent is running on Windows) or an SQL Server authenticated account (if Database Visibility is running on Windows or Linux). Page 49
50 Minimum Permissions Required for SQL Server Logon You can create a SQL Server logon user that can access the database with the minimal level of permissions required. To create a SQL Server logon user, you must be connected to the master database. 1. Run the command below to create a login. Specify a secure password in the command. CREATE LOGIN DBMon_Agent_User WITH PASSWORD = 'Password123' 2. Run the following command in both the master database and your SQL Server database to create a user account for the newly created login: CREATE USER DBMon_Agent_User FOR LOGIN DBMon_Agent_User WITH DEFAULT_SCHEMA = dbo 3. From the User Mapping tab, map the new user to the master and msdb databases. Mapping the monitoring user to the monitored databases allows you to view object information in the Objects Browser. grant VIEW DATABASE STATE to DBMon_Agent_User You can execute the command as a batch from a query window in Management Studio. 4. While connected to your SQL Server database, run the command below to grant the roles and privileges. Substitute DBMon_Ag ent_user with the name of the SQL Server user account you specified when creating a new collector for this database. grant VIEW DATABASE STATE to DBMon_Agent_User Page 50
51 Configure MongoDB Collectors On this page: Connection Details User Permissions for MongoDB To monitor MongoDB with Database Visibility, you must be running version 2.2 or newer. If you are configuring a collector for a MongoDB cluster, you only need to configure one collector for the entire cluster. You can choose any node in the cluster to connect to, and the entire cluster will automatically be detected. Connection Details Field Database Type Database Agent Name Hostname or IP Address Listener Port Custom Connection String Username Password CyberArk Logging Enabled Description The database type that you want to monitor. The Database Agent that manages the collector. The name you want to identify the collector by. The hostname or IP address of the machine that your database is running on. The TCP/IP address of the port on which your database communicates with the Database Agent The connection string generated by the database agent. You can also specify a custom connection string, which is useful for setting custom authentication options. The name of the user who is connecting to and monitoring the database through the Database Agent. The user should have the permissions described in User Permissions for MongoDB. The password of the user who is connecting to and monitoring the database through the Database Agent. Click to enable CyberArk for database username and password. When CyberArk is enabled, information about Safe, Folder, and Object is required to fetch the username and password for your database. To use CyberArk with Database Visibility, you must download the JavaPasswordSDK.jar file from the CyberArk web site and rename the file to cyberark-sdk-9.5.jar. Then, you must copy the JAR file to the lib directory of the database agent zip file. Click to enable verbose mode logging, which logs all communications between the Controller and the Collector. Enable only during troubleshooting because logging consumes a lot of disk space. If you have enabled logging, you can click the logging icon in the Log column of the Collector Administration window to view the log file. The log files are located in the <db_agent_home>\agent directory and have the format <CollectorName>_out.log and <CollectorName> _ err.log. User Permissions for MongoDB For MongoDB versions prior to 2.6.X, the readanydatabase and ClusterAdmin built-in roles are required in order to monitor using Database Visibility. For MongoDB sharded clusters, the monitoring user must have access to all shards. For MongoDB 2.6 and later, the new clustermonitor built-in role in addition to readanydatabase is required. If you choose to create a new user to monitor MongoDB, the user must be created in the admin database. You can configure user roles as shown in the sample query below: Page 51
52 use admin db.createuser({ user: "tanujaadmin", pwd: "tanuja123", roles: [ { role: "clusteradmin", db: "admin" }, { role: "readanydatabase", db: "admin" }, ] }) Page 52
53 Configure MySQL Collectors On this page: Connection Details User Permissions for MySQL To monitor MongoDB with Database Visibility, you must be running version 2.2 or newer. Connection Details Field Database Type Database Agent Name Hostname or IP Address Listener Port Custom JDBC Connection String Username Password CyberArk Logging Enabled Description The database type that you want to monitor. The Database Agent that manages the collector. The name you want to identify the collector by. The hostname or IP address of the machine that your database is running on. The TCP/IP address of the port on which your database communicates with the Database Agent The JDBC connection string generated by the database agent. You can also specify a custom connection string, which is useful for setting custom authentication options. The name of the user who is connecting to and monitoring the database through the Database Agent. The user should have the permissions described in User Permissions for MySQL. The password of the user who is connecting to and monitoring the database through the Database Agent. Click to enable CyberArk for database username and password. When CyberArk is enabled, information about Safe, Folder, and Object is required to fetch the username and password for your database. To use CyberArk with Database Visibility, you must download the JavaPasswordSDK.jar file from the CyberArk web site and rename the file to cyberark-sdk-9.5.jar. Then, you must copy the JAR file to the lib directory of the database agent zip file. Click to enable verbose mode logging, which logs all communications between the Controller and the Collector. Enable only during troubleshooting because logging consumes a lot of disk space. If you have enabled logging, you can click the logging icon in the Log column of the Collector Administration window to view the log file. The log files are located in the <db_agent_home>\agent directory and have the format <CollectorName>_out.log and <CollectorName> _ err.log. User Permissions for MySQL The MySQL user the Database Agent uses to monitor the MySQL database must have "SELECT", "PROCESS", and "SHOW DATABASES" privileges on all databases. If you do not have a suitable existing user, you can use the command below to create a new user. Page 53
54 GRANT SELECT,PROCESS,SHOW DATABASES on *.* to identified by 'password'; FLUSH privileges; Substitute DBMon_Agent_User with the username under which you run the Database Visibility Agent. Substitute host with the hostname or IP address of the machine running the Database Agent, and substitute password with a secure password. Set the secure_file_priv parameter to NULL. After you do this, you must restart MySQL. Set the max_allowed_packet parameter to on the server. Page 54
55 Troubleshooting MySQL Permissions Viewing MySQL Error Logs To see the error log file, the following conditions must be met: secure_file_priv is either empty or the name of folder containing the error log file. You must restart MySQL for changes in the secure_file_priv variable to take effect. The error log file is readable to all users max_allowed_packet is larger than the error log file size The user has FILE privileges Page 55
56 Configure Oracle Collectors On this page: Connection Details User Permissions for Oracle To monitor Oracle with Database Visibility, you must be running Oracle 10g or newer. If you are configuring a collector for Oracle RAC, you only need to configure one collector for the entire cluster. You can choose any node in the cluster to connect to, and the entire cluster will automatically be detected. Connection Details Field Database Type Database Agent Name Hostname or IP Address Listener Port Custom JDBC Connection String Use Service Name SID or SERVICE_NAME Connect as a sysdba Username Password CyberArk Description The database type that you want to monitor. The Database Agent that manages the collector. The name you want to identify the collector by. The hostname or IP address of the machine that your database is running on. The TCP/IP address of the port on which your database communicates with the Database Agent The JDBC connection string generated by the database agent. You can also specify a custom connection string, which is useful for setting custom authentication options. Select if the field that follows is the service name. The SID or service name of the database you want to monitor. Click if you want to connect to the database as a sysdba user and enable password files. Running the collector with a sysdba account allows the collector to monitor an Oracle instance that is on standby. The name of the user who is connecting to and monitoring the database through the Database Agent. The user should have the permissions described in User Permissions for Oracle. The password of the user who is connecting to and monitoring the database through the Database Agent. Click to enable CyberArk for database username and password. When CyberArk is enabled, information about Safe, Folder, and Object is required to fetch the username and password for your database. To use CyberArk with Database Visibility, you must download the JavaPasswordSDK.jar file from the CyberArk web site and rename the file to cyberark-sdk-9.5.jar. Then, you must copy the JAR file to the lib directory of the database agent zip file. Page 56
57 Oracle Wallet Click to enable Oracle Wallet. Truststore Location: location of the e-wallet file on the DB Agent host Truststore Type: type of Oracle Wallet. There are two truststore types: PKCS12 (default) SSO: enables auto-login. If you use SSO, you only need to provide the truststore location and truststore type. Truststore Password: password for Oracle Wallet If the SSL_CLIENT_AUTHENTICATION parameter is set to true in listener.ora and sqlnet.ora, then click the Enable SSL Client Authentication box. Keystore Location: location of the e-wallet file on the DB Agent host Keystore Type: type of Oracle Wallet Keystore Password: password for Oracle Wallet Logging Enabled Click to enable verbose mode logging, which logs all communications between the Controller and the Collector. Enable only during troubleshooting because logging consumes a lot of disk space. If you have enabled logging, you can click the logging icon in the Log column of the Collector Administration window to view the log file. The log files are located in the <db_agent_home>\agent directory and have the format <CollectorName>_out.log and <CollectorName> _ err.log. User Permissions for Oracle For versions of Oracle prior to 10g The permissions required for the Oracle user are: CONNECT SELECT ANY DICTIONARY To create a user with these permissions, you can run the following SQL. In this SQL, change "password" to a safe and secure password, and change the tablespace names, "users" and "temp" to those available in your Oracle instance. CREATE user DBMon_Agent_User IDENTIFIED BY password default tablespace users temporary tablespace temp; GRANT CONNECT, SELECT ANY DICTIONARY to DBMon_Agent_User; where DBMon_Agent_User is the user name under which you run the Database Visibility Agent. For versions of Oracle 10g and later The permissions required for the Oracle user are : CREATE SESSION SELECT_CATALOG_ROLE To create a user with these permissions, you can run the following SQL. In this SQL, change "password" to a safe and secure password, and change the tablespace names, "users" and "temp" to those available in your Oracle instance. Page 57

58 CREATE USER DBMon_Agent_User IDENTIFIED BY password default tablespace users temporary tablespace temp; GRANT CREATE SESSION, SELECT_CATALOG_ROLE TO DBMon_Agent_User; where DBMon_Agent_User is the user name under which you run the Database Visibility Agent. For versions of Oracle 12c and later with Multitenant Container Database Option enabled The permissions required for the Oracle user are : CREATE SESSION SELECT_CATALOG_ROLE To create a user with these permissions, you can run the following SQL. In this SQL, change "password" to a safe and secure password, and change the tablespace names, "users" and "temp" to those available in your Oracle instance. CREATE USER C##DBMon_Agent_User IDENTIFIED BY password default tablespace users temporary tablespace temp CONTAINER=ALL; GRANT CREATE SESSION, SELECT_CATALOG_ROLE TO C##DBMon_Agent_User CONTAINER=ALL; ALTER USER C##DBMon_Agent_User QUOTA 100M ON USERS; alter user C##DBMON_AGENT_USER set container_data=all container=current; Permissions Required for Oracle Explain Plans To generate an execution plan for a specified query, click Explain New Plan. You must provide a plan table in the monitoring user's schema. You can find a sample output table named PLAN_TABLE in the UTLXPLAN.SQL script. To update or view the plan table, you need INSERT and SELECT privileges. To explain a query, you need access privileges for the tables and views included in that query. Database Visibility can generate explain plans within its SQL drilldown window. To enable this functionality, you must have a plan table accessible to the Database Visibility schema user. You can create this plan table with the following command from sqlplus when logged on as the Database Visibility user: Windows: Page 58
59 @?\rdbms\admin\utlxplan.sql Access Rights The following Select and Execute privileges are required: V$statname V$instance V$parameter V$active_instances 5V$sqltext V$session V$sesstat V$sqlstats V$session_wait V$sysstat dba_data_files V$datafile V$sql V$license dbms_application_info Page 59
60 Configure PostgreSQL Collectors On this page: Connection Details User Permissions for PostgreSQL You can monitor any version of PostgreSQL with Database Visibility. Connection Details Field Database Type Database Agent Name Hostname or IP Address Description The database type that you want to monitor. The Database Agent that manages the collector. The name you want to identify the collector by. The hostname or IP address of the machine that your database is running on. EnterpriseDB Click if your PostrgreSQL database installation is an EnterpriseDB distribution. Listener Port Custom JDBC Connection String Username Password CyberArk Logging Enabled The TCP/IP address of the port on which your database communicates with the Database Agent The JDBC connection string generated by the database agent. You can also specify a custom connection string, which is useful for setting custom authentication options. The name of the user who is connecting to and monitoring the database through the Database Agent. The user should have the permissions described in User Permissions for PostgreSQL. The password of the user who is connecting to and monitoring the database through the Database Agent. Click to enable CyberArk for database username and password. When CyberArk is enabled, information about Safe, Folder, and Object is required to fetch the username and password for your database. To use CyberArk with Database Visibility, you must download the JavaPasswordSDK.jar file from the CyberArk web site and rename the file to cyberark-sdk-9.5.jar. Then, you must copy the JAR file to the lib directory of the database agent zip file. Click to enable verbose mode logging, which logs all communications between the Controller and the Collector. Enable only during troubleshooting because logging consumes a lot of disk space. If you have enabled logging, you can click the logging icon in the Log column of the Collector Administration window to view the log file. The log files are located in the <db_agent_home>\agent directory and have the format <CollectorName>_out.log and <CollectorName> _ err.log. User Permissions for PostgreSQL The monitoring user must either have a role of superuser or be granted access to the pg_stat_activity table using the technique described below. The following script allows you to create a SECURITY DEFINER function that is owned by the superuser, and runs the query you want, thus allowing non-superusers to see the contents of pg_stat_activity by calling the get_sa() function. Page 60
61 CREATE FUNCTION get_sa() RETURNS SETOF pg_stat_activity AS $$ SELECT * FROM pg_catalog.pg_stat_activity; $$ LANGUAGE sql VOLATILE SECURITY DEFINER; CREATE VIEW pg_stat_activity_allusers AS SELECT * FROM get_sa(); GRANT SELECT ON pg_stat_activity_allusers TO public; The monitoring user must also be able to connect remotely to the PostgreSQL instance from the for Databases machine. Page 61
62 Configure Sybase Collectors On this page: Connection Details User Permissions for Sybase To monitor Sybase with Database Visibility, you must be running version 15 or newer. Connection Details Field Database Type Database Agent Name Hostname or IP Address Description The database type that you want to monitor. The Database Agent that manages the collector. The name you want to identify the collector by. The hostname or IP address of the machine that your database is running on. EnterpriseDB Click if your PostrgreSQL database installation is an EnterpriseDB distribution. Listener Port Custom JDBC Connection String Username Password CyberArk Logging Enabled The TCP/IP address of the port on which your database communicates with the Database Agent The JDBC connection string generated by the database agent. You can also specify a custom connection string, which is useful for setting custom authentication options. The name of the user who is connecting to and monitoring the database through the Database Agent. The user should have the permissions described in User Permissions for Sybase. The password of the user who is connecting to and monitoring the database through the Database Agent. Click to enable CyberArk for database username and password. When CyberArk is enabled, information about Safe, Folder, and Object is required to fetch the username and password for your database. To use CyberArk with Database Visibility, you must download the JavaPasswordSDK.jar file from the CyberArk web site and rename the file to cyberark-sdk-9.5.jar. Then, you must copy the JAR file to the lib directory of the database agent zip file. Click to enable verbose mode logging, which logs all communications between the Controller and the Collector. Enable only during troubleshooting because logging consumes a lot of disk space. If you have enabled logging, you can click the logging icon in the Log column of the Collector Administration window to view the log file. The log files are located in the <db_agent_home>\agent directory and have the format <CollectorName>_out.log and <CollectorName> _ err.log. User Permissions for Sybase For complete Database Visibility functionality, the monitoring user requires the sa_role and mon_role privilege. To create a new dedicated user for Database Visibility, you can use following sample user creation script. Before running the script, change "password" to a more secure value. Page 62
63 exec sp_addlogin @fullname='dbmon_agent_user monitoring = 'ANY' go exec sp_locklogin 'DBMon_Agent_User', 'unlock' go exec sp_role 'grant', 'sa_role', 'DBMon_Agent_User' go exec sp_role 'grant', 'mon_role', 'DBMon_Agent_User' go where DBMon_Agent_User is the user name under which you run the Database Visibility Agent. Also, the following configuration parameters must be set to 1 (true) in order to monitor the Sybase ASE database with Database Visibility: "enable monitoring", "wait event timing", "SQL batch capture", and "object lockwait timing". You should also set "max SQL text monitored" to at least 8192 (8kB). Here is an example of the commands required to configure these settings: sp_configure "enable monitoring", 1 go sp_configure "wait event timing", 1 go sp_configure "SQL batch capture", 1 go sp_configure "object lockwait timing", 1 go sp_configure "max SQL text monitored", 8192 go If the value for "max SQL text monitored" was previously less than 4096, then increasing this setting will require that you restart the Sybase ASE instance. Page 63
64 Configure Sybase IQ Collectors On this page: Connection Details User Permissions for Sybase IQ You can monitor any version of Sybase IQ with Database Visibility. Connection Details Field Database Type Database Agent Name Hostname or IP Address Description The database type that you want to monitor. The Database Agent that manages the collector. The name you want to identify the collector by. The hostname or IP address of the machine that your database is running on. EnterpriseDB Click if your PostrgreSQL database installation is an EnterpriseDB distribution. Listener Port Custom JDBC Connection String Username Password CyberArk Logging Enabled The TCP/IP address of the port on which your database communicates with the Database Agent The JDBC connection string generated by the database agent. You can also specify a custom connection string, which is useful for setting custom authentication options. The name of the user who is connecting to and monitoring the database through the Database Agent. The user should have the permissions described in User Permissions for Sybase IQ. The password of the user who is connecting to and monitoring the database through the Database Agent. Click to enable CyberArk for database username and password. When CyberArk is enabled, information about Safe, Folder, and Object is required to fetch the username and password for your database. To use CyberArk with Database Visibility, you must download the JavaPasswordSDK.jar file from the CyberArk web site and rename the file to cyberark-sdk-9.5.jar. Then, you must copy the JAR file to the lib directory of the database agent zip file. Click to enable verbose mode logging, which logs all communications between the Controller and the Collector. Enable only during troubleshooting because logging consumes a lot of disk space. If you have enabled logging, you can click the logging icon in the Log column of the Collector Administration window to view the log file. The log files are located in the <db_agent_home>\agent directory and have the format <CollectorName>_out.log and <CollectorName> _ err.log. User Permissions for Sybase IQ To monitor with a non-dba account, you need the following: User account with SERVER OPERATOR system privilege. Execution privileges on several procedures which can be granted as follows: Page 64
65 grant execute on sp_iqconnection to DBMon_Agent_User grant execute on sp_iqtransaction to DBMon_Agent_User grant execute on sp_iqcontext to DBMon_Agent_User grant execute on sp_iqstatus to DBMon_Agent_User grant execute on sp_iqcolumn to DBMon_Agent_User grant execute on sp_iqindex to DBMon_Agent_User where DBMon_Agent_User is the user name under which you run the Database Visibility Agent. Grant DBA authority to DBMon_Agent_User as follow: grant DBA to DBMon_Agent_User Page 65
66 Use the Database Visibility API to Configure Collectors On this page: Supported API Calls Example Request and Response UI Collector versus JSON Collector Configuration Field Names Related pages: Add Database Collectors Configure the Database Agent to Monitor Server Hardware APIs The Database Visibility API allows you to get, create, update, and delete Database Visibility Collectors. Include the following headers for all Database Visibility API requests: Accept: application/json; Content-type: application/json JSON is currently the only supported format. Supported API Calls Get all Collectors GET /controller/rest/databases/collectors Get a Specific Collector GET /controller/rest/databases/collectors/{configurationid} Create Collector POST /controller/rest/databases/collectors/create The JSON you send must contain the relevant Collector information. The required fields describing the Collector vary based on the type of database. See the table in the "UI Collector versus JSON Collector Configuration Field Names" section that follows for more information. Update a Collector POST /controller/rest/databases/collectors/update Page 66
67 The JSON you send must contain all the details of the existing collector with only the fields that you want to modify changed. To ensure you have all the fields, use the Get a Specific Collector call. Delete a Specific Collector DELETE /controller/rest/databases/collectors/{configurationid} Batch Delete Multiple Collectors POST /controller/rest/databases/collectors/batchdelete Send an array of the configuration Ids of the Collectors. Example request to batch delete curl --user user1@customer1:password -H "Accept: application/json" -H "Content-type: application/json" -X POST -d [1,2,3] ectors/batchdelete Example Request and Response Example Request curl --user user1@customer1:password Example Response Page 67
68 [ { } ] "performancestate": null, "collectorstatus": "COLLECTING_DATA", "eventsummary": null, "config": { "id": 1, "version": 0, "name": "test", "nameunique": true, "builtin": false, "createdby": "user1", "createdon": , "modifiedby": "user1", "modifiedon": , "type": "MYSQL", "hostname": "localhost", "usewindowsauth": false, "username": "root", "password": "appdynamics_redacted_password", "port": 8080, "loggingenabled": false, "databasename": null, "failoverpartner": null, "connectassysdba": false, "useservicename": false, "sid": null, "customconnectionstring": null, "enterprisedb": false, "usessl": false, "enableosmonitor": false, "hostos": null, "uselocalwmi": false, "hostdomain": null, "hostusername": null, "hostpassword": "", "certificateauth": false, "removeliterals": true, "sshport": 0, "agentname": "Default Database Agent" } UI Collector versus JSON Collector Configuration Field Names Use the table below to ensure you use the correct field names for your API calls. The Collector configuration field names are described in Configure the Database Agent to Monitor Server Hardware and Add Database Collectors. Page 68
69 Section Connection Details Hardware Monitoring UI Collector Configuration Field Name Database Type Database Agent Database Hostname/IP Address EnterpriseDB Failover Partner Listener Port Custom JDBC Connection String Use Service Name SID or SERVICE_NAME Connect as a sysdba Username Password Logging Enabled Monitor Operating System Operating System Use Local WMI Domain SSH Port Use certificate Username Password JSON Collector Configuration Field Name id ( assigns this ID to the Collector when you configure the Collector. You need this ID when doing a batch delete.) type agentname name hostname enterprisedb failoverpartner port customconnectionstring useservicename sid connectassysdba hostusername hostpassword enableosmonitor hostos uselocalwmi hostdomain sshport certificateauth hostusername hostpassword SSL field In addition to JSON Configuration Fields listed above, there is also the ssl field. SSL is a configurable property for the Database Agent. If the Database Agent has been configured to use SSL, then you must also provide the ssl field and its value in your Database Visibility API calls. Page 69
70 Page 70
71 Monitor Sybase Databases Using Kerberos Authentication In order to for the Database Agent to connect to and monitor Sybase databases using Kerberos authentication, the following are required: In the Connection Details section of the Collector configuration dialog, specify the following JDBC connection string: jdbc:sybase:tds:<hostname>:<portnum>?request_kerberos_session=true&s ERVICE_PRINCIPAL_NAME=<myserver> Start the Database Agent using the -Djavax.security.auth.useSubjectCredsOnly=false option such as the following: nohup java -Djavax.security.auth.useSubjectCredsOnly=false /<db_agent_home>/db-agent.jar & Page 71
72 Configure the Database Agent to Monitor Server Hardware On this page: Complete the Hardware Monitoring Section Resolve Metric Reporter Type Mismatch Problem Related pages: Add Database Collectors Monitor Database Server Hardware In addition to monitoring the database server, the Database Agent can also monitor the hardware that hosts the database server. To configure the Database Agent to monitor the database server hardware, complete the Hardware Monitoring section of the Collector configuration dialog. Click Databases > Configuration > Collectors and then choose an existing collector to monitor the hardware for that database server and click Edit, or click Add to setup a new collector to monitor a different database server and the hardware hosting that server. Complete the Hardware Monitoring Section The following describes the fields in the Collector Configuration dialog that you must complete if you want to monitor the database server host hardware, in addition to the database server. Monitor Operating System: Select if you want CPU consumption metrics collected from the monitored host. Operating System: Specify the operating system of the monitored host: Windows, Linux, Solaris, AIX, or RDS. Use Local WMI: Check this box if you want to monitor the machine the Database agent is running on, i.e. localhost. When selected, the authorization fields are not used because no authorization is required. Domain: For Windows only, specify the the name of the domain in which the hardware resides. SSH Port: For Linux, AIX, and Solaris only, specify the Secure Shell (SSH) port number the Controller should use for encrypted communications with the monitored host. The default port number of 22 will be used if you do not specify a different port number here. Use certificate: For Linux, AIX, and Solaris only, also supports certificate-based authentication via Privacy Enhanced Mail (PEM). To implement certificate-based authentication, enable the Use certificate option and copy the PEM file to the <db_agent_home>\keys directory. Note, if the $HOME/.ssh directory exists, the agent will use the certificate found there. This option appears only if the agent is running on a machine running Linux, AIX or Solaris. Username: Specify the name of the user the Database Agent uses to log on to the monitored host. To collect OS metrics from a Windows host, the configured user (or Collector Service user if using Windows Authentication) must be able to establish a WMI connection to the target host and collect Windows Performance Counters. Password: Specify the password of the user the Database Agent uses to log on to the monitored host. The number of echo characters shown in the password text field should not be interpreted to imply the number of characters stored for the (encrypted) user password. Resolve Metric Reporter Type Mismatch Problem Switch from the Java Hardware Monitor to the Hardware Monitor if you see messages similar to the following in the logs: Page 72
73 [Worker-7] 12 Sep :27:49,449 WARN MonitorOutputHandler - Metric Reporter type mismatch for metric [Hardware Resources Network Incoming packets/sec] com.singularity.ee.agent.commonservices.metricgeneration.metrics.met ricreportertypemismatchexception: Aggregator of OBSERVATION already exists for metric Metric Identifier[Hardware Resources Network Incoming packets/sec] ID[0] Page 73
74 Required Monitored Host Permissions On this page: Required SSH Permissions Related pages: Configure a Controller SSH Key Database Agent User Permissions Database Visibility collects the stats from common commands like vmstat/iostat or gathering metrics from the file system such as /proc and as such the user that runs the Database Agent requires no special permissions, just the ability to run those common commands and write to files in the Database Agent directory. Database Agent Collector Authentication When monitoring the database host, Database Visibility must log in to the host system to gather system information. There are three ways to authenticate the Database Collector to access the monitored host: Specify a username and password in the Collector configuration dialog Place a PEM file or an id_rsa file in the <agent home>/keys directory If the Database Agent is running on LINUX, Solaris or AIX, place SSH keys in the <home>.ssh directory of the user running the agent. You can create an SSH key using the same procedure as described for the Controller, Configure a Controller SSH Key. Required SSH Permissions When monitoring the database host, Database Visibility uses SSH on Linux and Windows systems to gather system information. SSH access can be through either an authenticated username/password or a private key. You can create an SSH key using the same procedure as described for the Controller, Configure a Controller SSH Key. Page 74
75 Configure WMI Permissions and Security On this page: Requirements to Monitor Windows 7 and Higher Systems (agent running on Unix-like platform) Additional Requirements to Monitor Windows 2012 and Higher Systems (agent running on Unix-like platform) General Considerations for all Platforms Related pages: WMI and the Database Agent on the Community To monitor Windows-based machine hardware with Database Visibility, uses Windows Management Instrumentation (WMI) to remotely gather the metrics. WMI is often complicated to troubleshoot when the Database Agent is running on a Linux or Unix-like machine. This topic identifies requirements for the target machine configuration that can help you avoid some problems and pitfalls. It also provide some additional considerations regarding using WMI to monitor a SQL Server database agent and preventing unauthorized remote access to WMI. Named Windows Account: The user specified in the collector configuration that the Database Agent uses to connect to the target machine is referred to as "named Windows account." The following are required when the Database Agent is hosted on AIX, Linux or Solaris platforms to monitor Windows 7 and higher systems. Ensure that the named Windows account is a member of the local Administrators group. Ensure User Account Meets Minimum Security Requirements When Using WMI Enable Remote Registry Access Grant access to WBEM scripting locator The following are required when the Database Agent is hosted on AIX, Linux or Solaris platforms to monitor Windows 2012 and higher systems. Grant full control permissions to select registry keys Requirements to Monitor Windows 7 and Higher Systems (agent running on Unix-like platform) The following are required when the Database Agent is hosted on AIX, Linux or Solaris platforms to monitor Windows 7 and higher systems. Ensure User Account Meets Minimum Security Requirements When Using WMI Enable Security Options for Windows Systems that are part of a Domain Ensure the named Windows account has the correct permissions for WMI Control Run the wmimgmt.msc program. Right click the WMI Control icon on the left and click Properties. Click the Security tab. Click the root node of the tree, and click Security. Ensure that the named user account running the Database Agent has the relevant permissions. The minimum permissions that your remote Windows account needs for the Database Agent are: Execute Methods Enable Account Remote Enable If the named Windows account does not have all of these permissions, you might see an access denied error or the following error: Error=800706BA The RPC server is unavailable. SWbemLocator Page 75
76 or Error= Access is denied SWbemLocator Enable Classic Security Options for Local (non-domain) Windows Systems Applies to Windows computers that are not part of a domain Open the Control panel, and go to Administrative Tools > Local Security Policy. The Local Security Settings window appears. Go to Local Policies > Security Options. Change the value of "Network access: Sharing and security model for local accounts." to Classic. Enable Remote Registry Access The Remote Registry service must be running on the target machine. If the Remote register service is off, you will see the following error: Message not found for errorcode: 0xC or Access is denied By default Windows 7 and above systems will still deny remote access to the registry, even if the Remote Registry service is started. To test this, try to connect to the slave registry via regedit on another machine. If you get a error similar to Access is denied, run powershell as an administrator on the slave, and execute Enable-PSRemoting. Restart the machine and try launching the slave again. Grant Access to WBEM Scripting Locator The Database Agent requires full access to the WBEM Scripting Locator. On the target system allow full access to the WBEM Scripting Locator as follows: As an Administrator on the target machine, launch regedit. Locate the registry key: 76A64158-CB41-11D1-8B D9B6 in HKEY_CLASSES_ROOT\CLSID Right click the key and click Permissions. Click Advanced, and then on the Owner tab change the owner to the Administrators group. Click Apply. On the Permissions tab change the permissions for the Administrators group to Full Control. Click Apply. Close regedit. Restart the Remote Registry Service, using Administrative Tools > Services. Configure the Firewall WMI uses RPC which listens on port 135 but then allocates a dynamic port for subsequent communication. Configure your Firewall to always allow the TCP port 135 exception and follow the dynamic RPC ports. If there is a problem with the firewall, port 135 then you will probably see this error: ERROR: Message not found for errorcode: 0xC For more information, see How to configure RPC dynamic port allocation to work with firewalls. Additional Requirements to Monitor Windows 2012 and Higher Systems (agent running on Unix-like platform) In addition to the requirements described in Requirements to Monitor Windows 7 and Higher Systems, the following are also required when the Database Agent is hosted on AIX, Linux or Solaris platforms to monitor Windows 2012 and higher systems. Grant Full Control Permissions to Select Registry Keys For the Database Agent running on AIX, Linux or Solaris to monitor Windows 2012 (64-bit) and above systems, complete the following changes on the target system As an Administrator on the target machine, launch regedit. Change the permissions for both of the following registry keys to Full Control: 72C24DD5-D70A-438B-8A B88AFB8 in HKEY_LOCAL_MACHINE\SOFTWARE\Classes\Wow6432Node\CLSID 76A64158-CB41-11D1-8B D9B6 in HKEY_CLASSES_ROOT\CLSID Page 76
77 3. Find the following registry key: 72C24DD5-D70A-438B-8A B88AFB8 in HKEY_LOCAL_MACHINE\SOFTWARE\Classes\Wow6432Node\CLSID 4. Right click and click Permissions. 5. Change the owner to the Administrators group. 6. Change the permissions for the Administrators group to Full Control. 7. Change owner back to TrustedInstaller. User is "NT Service\Trusted Installer" on local machine. 8. Repeat steps 4 to 6 above for the following registry key: 76A64158-CB41-11D1-8B D9B6 in HKEY_CLASSES_ROOT\CLSID Close regedit. Restart the Remote Registry service, using Administrative Tools > Services. General Considerations for all Platforms These topics apply to the Database Agent running on Windows systems. Use Windows Authentication for Microsoft SQL Server To use Windows Authentication for the Database Agent to connect to a Microsoft SQL Server database instance, you must use a command similar to following to start the Database Agent; specifying the path to the Database Agent authentication library. Windows 64-bit java -Djava.library.path="C:\dbagent404\auth\x64" -jar db-agent.jar Windows 32-bit java -Djava.library.path="C:\dbagent404\auth\x86" -jar db-agent.jar Also, the Windows account used to start the Database Agent must be a Windows user who can authenticate with the database server. Prevent Unauthorized Remote Access to WMI For Windows 2003 R2 SP2 You may want to setup extra security in the Windows Distributed Component Object Model (DCOM) to prevent unauthorized users from accessing WMI remotely. The following prevents users other than those configured as follows from remotely accessing the WMI. You can configure the named Windows account as follows: 1. On the target machine, add the named Windows account to the Performance Monitor Users group 2. In Services and Applications, bring up the properties dialog of WMI Control. On the Security tab, highlight Root/CIMV2, click S ecurity > Add Performance Monitor Users and enable the options: Enable Account and Remote Enable. 3. Run dcomcnfg. Click Component Services > Computers > My Computer > Properties > COM Security, and then click E dit Limits for both Access Permissions and Launch and Activation Permissions. Add Performance Monitor Users and allow remote access, remote launch, and remote activation permissions. 4. In Component Services > Computers > My Computer > DCOM Config > Windows Management Instrumentation, give R emote Launch and Remote Activation privileges to the Performance Users Group. Page 77
78 Monitor Databases and Database Servers Related pages: Overview of Database Visibility Database Visibility Roles and Permissions Top 6 Database Performance Metrics to Monitor in Enterprise Applications The topics in this section show you how to use the features of to monitor and troubleshoot your database environments. Access Database Visibility from Application Monitoring Views Discover Normal Database and Server Activity Monitor Database Performance Monitor Database Server Hardware Database Health Rules and Alerts Database Monitoring Metrics Database Agent Events Reference Configure Query Literals Security Configuring Custom Metrics For roles and permissions required to view Database Monitoring windows, see Roles and Permissions. Watch the video Page 78
79 Access Database Visibility from Application Monitoring Views On this page: View Database Activity in Database Visibility View Business Transaction Snapshot Correlated Database Details Related pages: Monitor Database Performance App Agent Node Properties Reference View Database Activity in Database Visibility Once you have configured a database Collector in Monitoring, you can access Database Visibility either from the Home page or you can link to the Database Visibility database instance Dashboard by right-clicking the database and selecting View in Database Visibility on the Application Flow Map, Tier Flow Map or Node Flow Map. Database backends with the same hostname, port number, and database type as a database server already configured in a database Collector are automatically matched with the Collector, and drill downs from the Application Flow Map, Tier Flow Map or Node Flow Map to Database Visibility are enabled. Page 79


80 The Database Visibility section in the Application Database Dashboard displays which database Collector is associated with the database. To change this association, click Configure mapping and choose another database collector. View Business Transaction Snapshot Correlated Database Details Available for Java applications and their Oracle database backends, Snapshot correlation shows the details of queries, clients, sessions, and schemas around the time when the business transaction snapshot was captured. To see the correlated database details 1. From a list of business transactions with snapshots, choose a longer running business transaction that accesses the database, one that takes a few seconds or more. These are more likely to have captured database details. 2. Double-click Drill Down above the database icon. The correlated database details window appears. 3. Click the Queries, Clients, Sessions, and Schema tabs to view details of database activity that occurred around the time when the snapshot was captured. Page 80

81 To enable snapshot correlation, you must enable the jdbc-dbcam-integration-enabled node property for the Java Agent. Page 81
82 Discover Normal Database and Server Activity On this page: Related pages: View Performance Metrics on the Metrics Browser Dynamic Baselines Health Rules Database Visibility automatically learns to detect performance anomalies using baselines that are specific to your database and database server environments. creates baselines by collecting metrics from your monitored databases and servers over defined periods of time. This establishes what is normal for your environment. You can also create your own baselines. View Performance Metrics on the Metrics Browser On the Metric Browser for Database Visibility, you can visualize performance metrics and see how they deviate from expected behaviors established by the baseline. Page 82
83 Monitor Database Performance Related pages: Access Database Visibility from Application Monitoring Views Monitor Databases and Database Servers The subtabs for each database provide detailed information about your database. This section describes the various windows for the database instance and how to interpret the displayed information. From most of these subtabs you can drill down to the Queries view. View Overall Database and Server Performance Database Dashboard Database Topology Window Database Live View Window Database Queries Window Database Clients Window Database Sessions Window Database Schemas and Databases Windows Database Modules Window Database Programs Window Database Object Browser Window Database Reports Window Important information Garbage collection affects all monitored entities, including database queries, sessions, clients, and schemas. Entities that are garbage collected will be displayed as unavailable. Watch the video: Page 83
84 View Overall Database and Server Performance On this page: Access the Databases Window Features of the Databases Window Related pages: Access Database Visibility from Application Monitoring Views Database Visibility provides overall views of your databases that show key performance indicators. Access the Databases Window From Home, click Databases. Features of the Databases Window On the views of the Databases window you can: Show only databases meeting certain criteria by enter search criteria in the search box on the top right of the page. Click Filters to show only databases meeting certain search criteria, such as criteria that describes Health, Load, Time in database, or Type. Click the + symbol to add a new database Collector. Click Actions to export the data on this window in a.csv formatted file that is automatically downloaded to your specified downloads directory. Click View to switch between card and list view. See the overall performance of your databases and if there are any critical issues with them. The server health or status indicates whether critieria has been met for normal, warning or critical health rules. The green check mark indicates that the database is operating within normal conditions, the red exclamation mark indicates that at least one critical health rule has been violated. Click the name of the database to switch to the Database Dashboard for that specific database. Databases Card View From the Databases card view, you can see: The Total Executions graph that provides insight into the total number of queries monitored for the database over the selected time period. This metric is expressed in millions of queries. The Time in Database graph that indicates the total time spent executing those queries during the selected time period. This metric is expressed in hours, minutes, and seconds. CPU Usage metrics that when enabled shows the percentage of CPU capacity consumed by the database. Page 84

85 Databases List View From the Databases list view, you can: Click Options to turn the spark charts on and off. Get to the databases you want to see quickly If you are monitoring many databases. Click on any point in the spark charts to see a metric for that point in time. For example, clicking on a point in the Queries Trend shows how many queries were monitored at that time. Click on a column name to sort the list on that key. Page 85
86 Database Dashboard On this page: Access the Database Dashboard Features of the Database Dashboard Related pages: Access Database Visibility from Application Monitoring Views View Overall Database and Server Performance Discover Normal Database and Server Activity Database Health Rules and Alerts Monitor Database Performance The dashboard for each individual database provides the most detailed information about your database. Access the Database Dashboard You can access the Database Dashboard in one of the following ways: From Home, double-click the name of the database you want to see in detail on the Database Dashboard. From the Databases overview window, click the name of the database you want to see in detail on the Database Dashboard. Features of the Database Dashboard On the Database Dashboard you can: Click the dropdown arrow next to the database Collector name at the top of the page to choose a database that you want to see the dashboard for. Click the status icon below SERVERS in the top section of the dashboard to go directly to Events where you can see any recent events.. On the Database Dashboard you can see the following information: Server Health: Server Health at the top of this window indicates the extent to which health rules are being violated: Green - Healthy server Yellow/orange - server with warning-level violations Red - server with critical-level violations Type: The database type. Load and Time Spent in Database: Load - At a glance you can see the total number of calls during the specified time period and the number of calls for any point in time. The number of calls to the database directly correlates with database performance; the more calls there are, the longer it takes to respond to each call. Time spent in Database - The total time spent executing SQL statements during the specified time period. Top 10 SQL Wait States: Activities that contribute to the time it takes the database to service the request. The wait states consuming the most time may point to performance bottlenecks. For example, a db file sequential read wait state may be caused by segment header contention on indexes or by disk contention. See your database platform documentation for descriptions of the SQL wait states. For example, the following was developed from information in a Microsoft Customer Service blog for SQL Server : Wait State - CHECKPOINT_QUEUE Description - Used by background worker that waits on events on queue to process checkpoint requests. Recommended Action - You should be able to safely ignore this one as it is just indicates the checkpoint background worker is waiting for work to do. I suppose if you thought you had issues with checkpoints not working or log truncation you might see if this worker ever "wakes up". Expect higher wait times as this will only wake up when there is work to do. Average number of active connections: The average number of connections established with the database at any point in time during the selected time period. A connection is a session established between a database client and a server. Page 86

87 The CPU, Memory, Disk I/O, and Network I/O graphs display when the Database Agent has been configured to also monitor the database host hardware. See, " Configure the Database Agent to Monitor Server Hardware" on Add Database Collectors. CPU: The CPU graph shows the relative percentages of CPU processing time used for handling system and users processes. Memory: The Memory graph shows the percentage of total memory in use at any point in time. Disk I/O: The Disk I/O graph shows disk usage, volume of data read and written. Network I/O: The Network I/O graph shows network activity, volume of data sent and received. Page 87

88 Accessing Metric Brower To see more information about a specific metric, double click any point on the graph and the Metric Browser opens displaying that metric. You can then hover over a point on the graph in the Metric Browser for more information about the metric. This feature is available for all the graphs except the SQL wait states graph. Watch the video: Page 88
89 Database Topology Window The Topology view displays current activity for the routing service and shards of a MongoDB database or Oracle RAC server. The Topology view shows key performance metrics for the routing service and shards of the database. Access the Database Topology Window To access the Database Topology Window From Home, double-click the name of the MongoDB database or Oracle RAC that you want to see in detail on the Database Dashboard. Click the Topology tab. Features of the Database Topology Window On the Database Topology Window you can: Select the Auto Refresh box. From the Every list, you can choose how often the system updates the live view. Click the dropdown arrow next to the database Collector name at the top of the page to choose a node or cluster that you want to see the metric views for. You can either select the database Collector name from the list, or search for the database Collector by entering text in the search bar and then clicking the refresh icon to show only database Collectors that meet that search criteria. Hover over the sections of the trends to see their details. Click a column title on the Topology name list to sort the topologies using that column as the sort key. On the MongoDB and Oracle RAC Topology window you can see the following information: Health: Indicates whether any health rules for the MongoDB or Oracle RAC routing service or shards of the replica set have been violated. Role: The role performed by the shard. The routing service routes the queries to the shards to balance the load. The members or shards of the replica sets can have either primary or secondary shard role. Num Queries: The number of queries handled. Queries Trend: The trend of queries handled over time. Time in Database: The time required for the database to respond to the queries. Time Spent in Database Trend: The trend of time spent in the database over time. Page 89
90 Database Live View Window On this page: Access the Database Live Window Features of the Database Live Window Related pages: Access Database Visibility from Application Monitoring Views Database Visibility Monitor Databases and Database Servers Monitor Database Performance The Live view displays current activity for the database server. The live view shows key performance metrics for the last time period, which can be refreshed in a specified time interval between 10 seconds and 5 minutes. Access the Database Live Window To access the Database Live Window From Home, double-click the name of the database you want to see in detail on the Database Dashboard. Click the Live View tab. Features of the Database Live Window On the Database Live Window you can: Select the Auto Refresh box and then from the Every list, choose how often you want the system to update the live view. Click the down arrow next to the database Collector name at the top of the page to choose to view the live view of a different database Collector by either selecting the database Collector name from the list or by searching for the database Collector by entering text in the search bar and then clicking the refresh icon to show only database Collectors that meet that search criteria. Hover over the sections of the charts to see their details. Click the View list to view All Active Sessions or All Sessions. Click a column title on the Session List to sort the Session List using the clicked column as the sort key. On the Database Live window you can see the following information: CPU Usage: If you have enabled Hardware Monitoring for the server the chart shows the percentage of available CPU resources consumed by users and the system and a break down of how the CPU is being used. IO - Disk input and output. System - Database operating system activities. User - User interaction with the database. Memory Usage: Displays how much memory is in use and how much is available. Query wait states: Activities that contribute to the time it takes the database to service the request. The wait states consuming the most time may point to performance bottlenecks. For example, db file sequential reads may be caused by segment header contention on indexes or by disk contention. Session List: A table describing database usage instances and their properties. The database session is the application interaction with the database, a new session is started for each request. The columns displayed are database dependent. Page 90

91 In the Live View for database clusters, you must select a node from the dropdown menu to view that node's activity. Page 91
92 Database Queries Window On this page: Access the Database Queries Window Features of the Database Queries Window Related pages: Access Database Visibility from Application Monitoring Views Add Database Collectors Database Visibility Monitor Databases and Database Servers Monitor Database Performance The Queries window displays the SQL statements and stored procedures that consume the most time in the database. You can compare the query weights to other metrics such as SQL wait times to determine SQL that requires tuning. Access the Database Queries Window To access the Database Queries Window From Home, double-click the name of the database you want to see in detail on the Database Dashboard. Click the Queries tab. Features of the Database Queries Window On the Database Queries window you can: View the top N queries. These are the queries that consumed the greatest amount of database time to complete. Choose to display the top 5, 10, 100 or 200 queries. Click the name of a column to sort the Query list using that key. Click Filter by Wait States to choose wait states to filter the Query list by. The filtered list only displays queries that caused the selected wait states. Search for a specific query, by entering text in the Search bar that may appear in the Query. This is useful if you found a slow query in the Slow Database calls window of Application monitoring. Double-click a query or select a query and click View Query Details to dive into the Query Details for more detailed information about that specific query. Click the down arrow next to the database Collector name at the top of the page to choose to view the database queries of a different database Collector by either selecting the database Collector from the list or by searching for the database Collector by entering text in the search bar and then clicking the refresh icon to show only database Collectors that meet that search criteria. Click Actions to export the data on this window in a.csv formatted file that is automatically downloaded to your specified downloads directory. On the Database Queries window you can see the following information: Query Id: This is the unique ID assigned to the query internally by the database. Query: The text of the query, or, in the case of a stored procedure invocation, the name of the stored procedure. If the user does not have the ANY permission to view the the stored procedure name, the definition of the stored procedure is shown instead of the stored procedure name. For SQL Server, Azure, Oracle, and DB2 the metrics Number of Executions, Average Response TIme and Elapsed Time are inferred from the query index. For databases such as MySQL and MongoDB which don't have a query index, no data will appear in the Number of Executions and Average Response Time columns. However, Elapsed Time can be inferred for MySQL and MongoDB databases using the wait state index. Elapsed Time can also be inferred using the wait state index when query statistics for a query run on an SQL Server, Azure, Oracle or DB2 database are otherwise not available. Number of Executions: (supported for SQL Server, Azure, Oracle, DB2) The number of times the query ran during the specified time period. Average Response Time (hh:mm:ss): (supported for SQL Server, Azure, Oracle, DB2) The average time required during the specified time period to respond to the query. Elapsed Time: The total time consumed by all executions of this query. Query statistics such as Number of Executions, Average Response Time and Elapsed time are available for databases supporting the query index, such as SQL Server, Page 92
93 Azure, Oracle, and DB2. For databases where the query index is not available, elapsed time is inferred from the wait state index. Weight (%): The percentage of the total time consumed by the query. Once you have identified the statements that are consuming the most resources, you can dig down deeper for details that can help you tune the SQL statement. For indepth query details, click a SQL statement and then click View Query Details. See Database Query Details Window. Page 93
94 Database Query Details Window On this page: Access the Database Query Details Window Features of the Database Query Details Window Related pages: Access Database Visibilityisbility from Application Monitoring Views Add Database Collectors Database Visibility Monitor Databases and Database Servers Monitor Database Performance Once you have identified the statements on the Database Queries Window window that are spending the most amount of time in the database, you can dig down deeper for details that can help you tune those SQL statements. The database instance Query Details window displays details about the query selected on the Database Queries Window window. Access the Database Query Details Window To access the Database Query Details Window From Home, double-click the name of the database you want to see in detail on the Database Dashboard. Click the Queries tab. Select a query and click View Query Details. Features of the Database Query Details Window On the Database Query Details window you can: Click Execution Plan to view an explanation plan for the query you selected on the Queries window if it was a SELECT query. Click on the graphs to see metrics for that specific point in time. Click the down arrow next to the database Collector name at the top of the page to choose to view the query details of a different database Collector by either selecting the database Collector name from the list or by searching for the database Collector by entering text in the search bar and then clicking the refresh icon to show only database Collectors that meet that search criteria. On the Database Query Details window you can see the following information: Resource consumption over time: For SQL Server, Azure, Oracle, and DB2: Shows query statistics: the amount of time the query spent in the database using resources, the number of executions, and the amount of CPU time consumed. Query statistics are only available for the aforementioned database platforms. Disk and buffer usage: Displays data when hardware monitoring is enabled for this database Collector. This graph shows at a Page 94

95 glance how effectively the database buffer is used. SQL that runs frequently is best kept in the buffer as physical disk reads are much more time consuming. You may need to optimize your buffer manager if you see that the ratio of physical reads to buffer gets is too high.queryd Queries Executed By: Shows the machines that executed the selected SQL statement and the percentage of the total time required to execute the statement performed by each machine. The table also shows the applications, nodes, and tiers of the machines. <database_type> wait states: Activities that contribute to the time it takes the database to service the selected SQL statement. The wait states consuming the most time may point to performance bottlenecks. For example, a db file sequential read wait state may be caused by segment header contention on indexes or by disk contention. See your database platform documentation for descriptions of the SQL wait states and recommended actions. SQL Active in Schema: Shows the schemas that have been accessed by this SQL. SQL ID (Oracle) SQL Handle (SQL Server): A unique ID that allows the database server to more quickly locate this SQL statement in cache. SQL: The entire syntax of the selected SQL statement. To see how the SQL was executed internally within the database, click the Execution Plan tab. The statement execution plan is the sequence of operations the database performs to run the statement. Oracle Explain Plan Limitations For Oracle, Database Visibility displays execution plans for only SELECT, UPDATE, INSERT, and DELETE statements because Database Visibility relies on the Oracle EXPLAIN PLAN statement to obtain the execution plans and the Oracle EXPLAIN PLAN statement only provides the Oracle optimizer's execution plans for SELECT, UPDATE, INSERT, and DELETE statements. See also, User Permissions for Oracle. If you have a poorly performing piece of SQL that you are trying to tune, the obvious place to start it to look at the most costly step of the execution plan. Tuning SQL is of course a vast topic, but a couple of things to look out for include: Index or table scans: May indicate a need for better or additional indexes. Page 95
96 Bookmark Lookups: Consider changing the current clustered index, using a covering index and limiting the number of columns in the SELECT statement. Filter: Remove any functions in the WHERE clause, don't include views in your Transact-SQL code, may need additional indexes. Sort: Does the data really need to be sorted? Can an index be used to avoid sorting? Can sorting be done at the client more efficiently? Page 96
97 Database Query Execution Plan Window On this page: Access the Database Query Execution Plan Window Features of the Database Query Execution Plan Window Related pages: Access Database Visibility from Application Monitoring Views Add Database Collectors Database Visibility Monitor Databases and Database Servers Monitor Database Performance The Database Query Execution Plan window can help you to determine the most efficient execution plan for your queries. Once you've discovered a potentially problematic query, you can explain the statement to check the execution plan that the database created. This execution plan may reveal that the query is not using the relevant indexes, or indexes to support the query are missing, resulting in a SQL query that executes slowly. Access the Database Query Execution Plan Window To access the Database Query Execution Plan Window From Home, double-click the name of the database you want to see in detail on the Database Dashboard. Click the Queries tab. Click a SELECT statement you want to examine and click View Query Details. Click Execution Plan. Features of the Database Query Execution Plan Window On the Database Query Execution Plan window, you can take the following actions: Choose a database from the Explain list and then click Explain to choose a different database on which to explain the selected query. Click Schema to choose a different schema and then explain the execution plan based on that schema. Enter text in the Explain another query box to explain another query instead of the one you previously selected on the Queries window. Click the down arrow next to the database Collector name at the top of the page to choose to view queries and query execution plans of a different database Collector. You can either select the database Collector name from the list or search for the database Collector in the search bar. Click the refresh icon to show only database Collectors that meet your search criteria. If you are using Oracle, you can also take the following actions: Select a cached execution plan to explain. Click Explain New Plan to request a new explain plan from the agent. Double-click a cached execution plan or select the plan and then click View Cached Plan to view the plan details. If you are using MySQL, you can also take the following actions: Choose to explain the query on another schema. In Plan Details, from the list on the right, choose the schema name and then click EXPLAIN. Copy the text in the Parsed SQL output box and paste it into the Explain another query box where you can edit it and then explain the edited version of the query. On the Database Query Execution Plan window you can see the following information: Cached Execution Plan(s): identifying details of the cached execution plan, which vary from one database to another. Plan Details: execution plan details, showing the step by step procedure the database followed to process the selected query. Referenced Objects: the database objects accessed by the execution plan. Page 97
98 Page 98
99 Database Clients Window On this page: Access the Database Clients Window Features of the Database Clients Window Related pages: Access Database Visibility from Application Monitoring Views Database Queries Window Database Visibility Monitor Databases and Database Servers Monitor Database Performance The database Clients window shows you the hostname or IP addresses of the Top N clients using the database. A database client is any host that accesses the database instance. To see the Top N Queries run by the client, click a Client name and then click View Top Queries. From the Client top queries page, to see more details about a query you can double-click a query to open the Query Details wi ndow. Access the Database Clients Window To access the Database Clients window From Home, double-click the name of the database you want to see in detail on the Database Dashboard. Click the Clients tab. Features of the Database Clients Window On the Database Query Clients window you can: Choose to view information for the top 10, 50, 100 or 200 clients sorted by total time spent in the database. Choose to view information for one client in particular. Click the down arrow next to the database name at the top of the page to choose to view the database clients of a different database by either selecting the database from the list or by searching for the database by entering text in the search bar and then clicking the refresh icon to show only databases that meet that search criteria. Click Actions to export the data on this window in a.csv formatted file that is automatically downloaded to your specified downloads directory. On the Database Clients window you can see the following information: Client: The names of the machines that have connected to the database. Application: The application used on the machine. Click on individual applications to see data on the application. Tier: The tiers in the application. Node: The nodes in the tier. Weight (%): The percentage of time the client was connected to the database in comparison with connection times of other clients. Page 99
100 Database Sessions Window On this page: Access the Database Sessions Window Features of the Database Sessions Window Related pages: Access Database Visibility from Application Monitoring Views Database Visibility Monitor Databases and Database Servers Monitor Database Performance The database Sessions window shows you the Session ID of the Top N sessions using the database sorted by time spent. To see the Top N SQL run by a session, click the Session ID and then click View Top Queries. From the Client top queries page, to see more details about a query, double-click a query to open the Query Details window and from there see the Execution Plan of the query. Access the Database Sessions Window To access the Database Sessions Window From Home, double-click the name of the database you want to see in detail on the Database Dashboard. Click the Sessions tab. Features of the Database Sessions Window On the Database Sessions window you can: Choose to view information for the top 10, 50, 100 or 200 sessions consuming database resources. Double click a session ID to view the queries run in that particular session. Click the down arrow next to the database name at the top of the page to choose to view the database sessions of a different database by either selecting the database from the list or by searching for the database by entering text in the search bar and then clicking the refresh icon to show only databases that meet that search criteria. Click Actions to export the data on this window in a.csv formatted file that is automatically downloaded to your specified downloads directory. On the Database Sessions window you can see the following information: Session ID: the Session ID of each database instance usage. Weight (%): the percentage of time that instance was using the database in comparison with the database usage of other sessions. Page 100
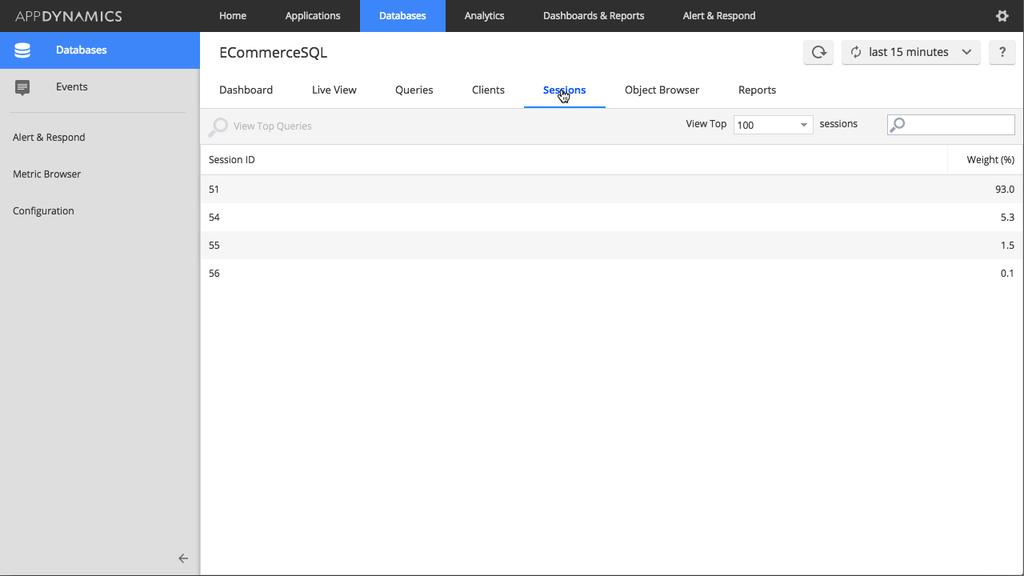
101 Page 101
102 Database Schemas and Databases Windows The Database Schemas window is available only for Oracle database servers. The Database Databases window is available for other database servers. The database Schemas or Databases window shows you the names of the Top N busiest schemas or databases on the database server. To see the Top N Queries run on a specific Database or Schema, click a name and then click View Top Queries. From the Schema or Database top queries page, to see more details about a query you can double-click a query to open the Query Details windo w. Access the Database Schemas or Databases Window To access the Database Schemas or Database window From Home, double-click the name of an database you want to see in detail on the Database Dashboard. Depending on the platform, click either the Schemas or Databases tab. Features of the Database Schemas or Databases Window On the Database Schemas and Databases window you can: Choose to view information for the top 10, 50, 100 or 200 schemas or databases containing the most time spent executing queries by the database server. Double click the name of a schema or database to view the top queries for one schema database in particular, or select the schema or database and click View Top Queries. Click the down arrow next to the Database Collector name at the top of the page to choose to view the database schemas or databases of a different database Collector by either selecting the database Collector from the list or by searching for the database Collector by entering text in the search bar and then clicking the refresh icon to show only database Collectors that meet that search criteria. Click Actions to export the data on this window in a.csv formatted file that is automatically downloaded to your specified downloads directory. On the Database Schemas or Databases window you can see the following information: Schema or database: The names of the schemas or database on the database server. Weight (%): The percentage of time the schema or database was used by the database server in comparison with usage percentage of other schemas or databases. Page 102

103 Database Modules Window The Database Modules window is available only for Oracle database servers. The Module field is often identical to the Program field unless it has been programmatically set with a call to DBMS_APPLICATION_INFO. Some packaged applications, such as Oracle E-Business Suite, automatically set the Module field with relevant identifiers. The database Modules window shows you the names of the Top N busiest modules on the Oracle database server. To see the Top N Queries run on the database by a module, click a module name and then click View Top Queries. From the Modules top queries page, to see more details about a query you can double-click a query to open the Query Details window. Access the Database Modules Window To access the Database Modules window From Home, double-click the name of a database you want to see in detail on the Database Dashboard. Click the Modules tab. Features of the Database Modules Window On the Database Modules window you can: Choose to view information for the top 10, 50, 100 or 200 modules most frequently accessing the database server. Double click the name of a module to view the top queries for one module in particular, or select the module and click View Top Queries. Click the down arrow next to the Database Collector name at the top of the page to choose to view the modules of a different Oracle database Collector by either selecting the database Collector from the list or by searching for the database Collector by entering text in the search bar and then clicking the refresh icon to show only database Collectors that meet that search criteria. Click Actions to export the data on this window in a.csv formatted file that is automatically downloaded to your specified downloads directory. On the Database Modules window you can see the following information: Module: The name of the module run by the active sessions in the database. Weight (%): The percentage of time the module was consuming the database resources in comparison with usage percentage of other modules. Page 103

104 Database Programs Window The Database Programs window is available for Oracle and SQL Server. The Programs window shows you the names of the Top N programs on the database instance based on time. To see the Top N Queries run on the database by a program, click a program name and then click View Top Queries. From the Programs top queries page, to see more details about a query you can double-click a query to open the Query Details window. Access the Database Programs Window To access the Database Programs window From Home, double-click the name of a database you want to see in detail on the Database Dashboard. Click the Programs tab. Features of the Database Programs Window On the Database Programs window you can: Choose to view information for the top 10, 50, 100 or 200 programs most frequently accessing the database server. Double click the name of a program to view the top queries for one program in particular, or select the program and click View Top Queries. Click the down arrow next to the Database Collector name at the top of the page to choose to view the programs of a different Oracle database Collector by either selecting the database Collector from the list or by searching for the database Collector by entering text in the search bar and then clicking the refresh icon to show only database Collectors that meet that search criteria. Click Actions to export the data on this window in a.csv formatted file that is automatically downloaded to your specified downloads directory. On the Database Programs window you can see the following information: Program: The name of the program run by an active session in the database. Weight (%): The percentage of time the program was consuming the database resources in comparison with usage percentage of other programs. Page 104
105 Database Object Browser Window On this page: Access the Database Objects Window Features of the Database Objects Window Related pages: Access Database Visibility from Application Monitoring Views Database Visibility Monitor Databases and Database Servers Monitor Database Performance When you detect a problem with database performance, you may be able to correct the problem by adding an index, refusing access to certain users, or creating a new index on a table. You can browse through the database objects to find ways to tune the database, including the indexes that are currently available on the various tables. The contents of the Database Object Browser are updated when you access them or click Refresh. Note: The objects available for browsing are database dependent. Access the Database Objects Window To access the Database Objects window From Home, double-click the name of the database you want to see in detail on the Database Dashboard. Click the Objects tab. Features of the Database Objects Window On the Database Objects window you can: Click an object type in the tree to see more information about it. For Oracle, search for a specific database item. Click the down arrow next to the database name at the top of the page to choose to view the database objects of a different database by either selecting the database from the list or by searching for the database by entering text in the search bar and then clicking the refresh icon to show only databases that meet that search criteria. Page 105


106 The following are some examples of browsable content. Database uptime and version for all platforms Users: who has access to the database for all platforms Supported for Oracle, MySQL Job Status: status of SQL agent job Supported for SQL Server Parameters: database initialization parameters Supported for Oracle Page 106
107 Variables: system variables indicating how the database was configured. Current Statistics: the current value of statistics collected. The various statistics available are database dependent and are a superset of those shown in the Database Monitoring - Metric Browser page. System Waits: SQL waits experienced by the database Database Objects: search for specific objects, and browse through database schemas, tables, columns and indices. Search Page 107
108 Database Reports Window On this page: Access the Database Reports Window Features of the Database Reports Windows Top SQL Report I/O Report Time Series Comparison Report Top Activity Report Top SQL Report Wait State Report Related pages: Access Database Visibility from Application Monitoring Views Database Visibility Monitor Databases and Database Servers Monitor Database Performance The following describes the reports available in Database Visibility on the Database Reports Window. The reports available depend on the database platform being monitored. The reports are listed in alphabetical order and indicate which database platform supports them. Access the Database Reports Window To access the Database Reports window From Home, double-click the name of the database you want to see in detail on the Database Dashboard. Click the Reports tab. Features of the Database Reports Windows To view the database reports of different databases, click the down arrow next to the database name at the top of the page. From the list, select the database you want to view, or search for the database in the search bar. Click the refresh icon to show only databases that meet that search criteria. The reports available are described below. The reports available are database-dependent. The reports are listed in alphabetical order and indicate which database platform supports them. The reports will only show 10 days of data, which is the Events Service limit. Top SQL Report Description: This report displays the top 10 SQL statements for the specified statistic in a time-series view. Relevance: Use this report to see which SQL statements are using the most database resources. This helps to determine the impact of specific SQL statements on overall system performance, allowing you to focus your tuning efforts on the statements that have the most impact on database performance. You can choose from a list of statistics one statistic to base your report on. Platform: IBM DB2, Microsoft SQL Server, Oracle Page 108
109 I/O Report Description: This report gives information on physical I/O performed by the database instance. Relevance: Your physical disk I/O may be affecting database performance. Poor response times may mean that you're doing too much physical I/O or that you're for example scanning tables or indexes when you should be doing seeks. Poor response times may also indicate that your SQL may need to be tuned or that the database tables are missing indexes. It may also mean that you need to adjust your I/O capacity. Platform: Microsoft SQL Server, Oracle Page 109

110 Time Series Comparison Report Description: This report allows compares the performance of two databases during the same time period based on a specific statistic type. Relevance: You may want to compare the performance of your development and production databases before and after you tune the SQL queries or add an index or join. This report can help you determine the effectiveness of any performance tuning procedures you have implemented. Platform: IBM DB2, Microsoft SQL Server, MySQL, Oracle, PostgreSQL, Sybase and Sybase IQ Top Activity Report Page 110

111 Description: Display the top time in database SQL statements in a time-series view. This report also displays data in a table and highlights the time spent in the database for each of 10 top SQL statements. Relevance: Use this report to see which SQL statements are using the most database time. This helps to determine the impact of specific SQL statements on overall system performance allowing you to focus your tuning efforts on the statements that have the most impact on database performance. Platform: IBM DB2, Microsoft SQL Server, MySQL, Oracle, PostgreSQL, Sybase and Sybase IQ Top SQL Report Description: This report displays the top 10 SQL statements for the specified statistic in a time-series view. Relevance: Use this report to see which SQL statements are using the most database resources. This helps to determine the impact of specific SQL statements on overall system performance allowing you to focus your tuning efforts on the statements that have the most impact on database performance. You can choose one of many statistics to base the report on. Platform: IBM DB2, Microsoft SQL Server, Oracle Page 111
112 Wait State Report Description: This report displays time-series data on Wait Events (states) within the database. Each distinct wait is color-coded, and the Y-axis displays time in seconds. This report also displays data in a table and highlights the time spent in each wait state for each SQL statement. Relevance: The wait states consuming the most time may point to performance bottlenecks. For example, db file sequential reads may be caused by segment header contention on indexes or by disk contention. Platform: IBM DB2, Microsoft SQL Server, MySQL, Oracle, PostgreSQL, Sybase and Sybase IQ Page 112
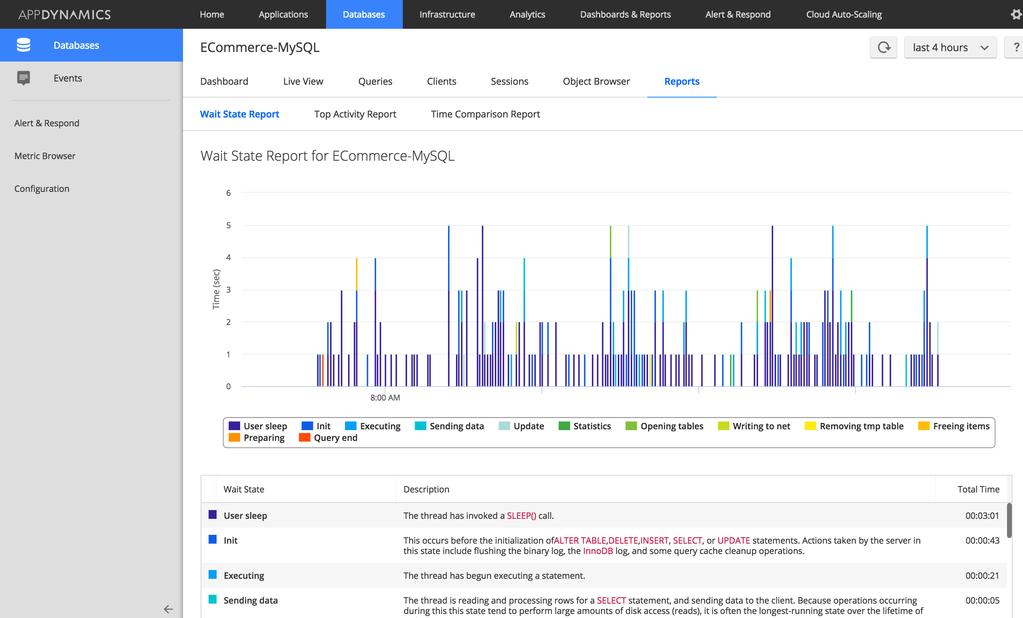
113 Page 113
114 Monitor Database Server Hardware On this page: Access the Database Server Hardware Metrics Window Features of the Hardware Metrics graphs Comparing Server and Database Metrics Watch the video: Access the Database Server Hardware Metrics Window To access the Hardware Metrics Hardware metrics are reported on: The Database Dashboard window. The Database Live window. The Metric Browser Features of the Hardware Metrics graphs On the hardware metrics graphs you can: Click anywhere on the graphs to get details about activity at that point in time. Double-click on KPI points in the graph to display the Metric Browser showing the selected metric. Metrics are collected by the agent and reported once a minute. Comparing Server and Database Metrics You can view and compare hardware and database metrics in the Metric Browser. This can help you visualize the effect of server performance on database performance. Page 114
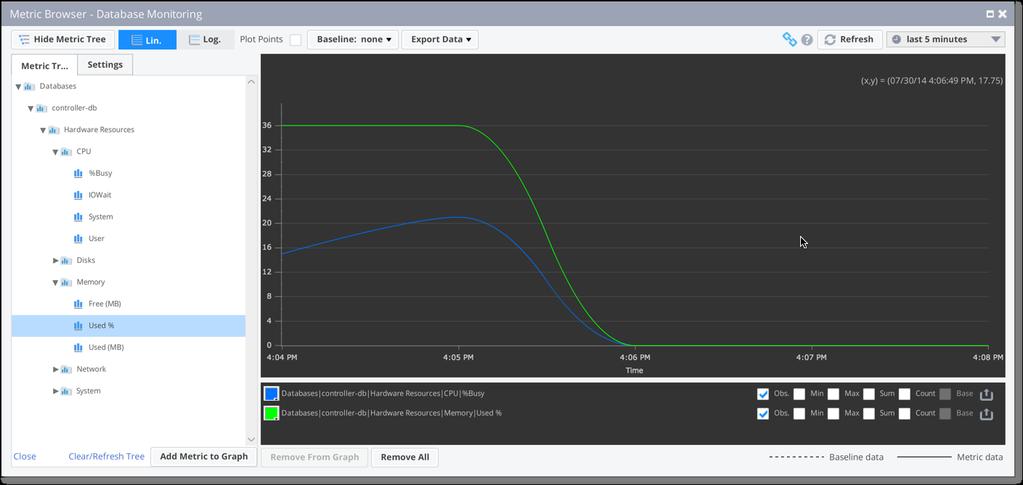
115 Page 115
Database Visibility. AppDynamics Application Intelligence Platform. Version Page 1
 Database Visibility AppDynamics Application Intelligence Platform Version 4.2.5 Page 1 Database Monitoring............................................................................ 3 Database Monitoring
Server Monitoring. AppDynamics Pro Documentation. Version 4.1.x. Page 1
 Server Monitoring AppDynamics Pro Documentation Version 4.1.x Page 1 Server Monitoring......................................................... 4 Standalone Machine Agent Requirements and Supported Environments............
End User Experience Management
 End User Experience Management AppDynamics Pro Documentation Version 4.0.x Page 1 End User Experience Management........................................... 4 The Overview Geo Dashboard............................................
Installing and Configuring VMware Identity Manager Connector (Windows) OCT 2018 VMware Identity Manager VMware Identity Manager 3.
 OCT 2018 VMware Identity Manager VMware Identity Manager 3.") Installing and Configuring VMware Identity Manager Connector 2018.8.1.0 (Windows) OCT 2018 VMware Identity Manager VMware Identity Manager 3.3 You can find the most up-to-date technical documentation on
Installing and Configuring VMware Identity Manager Connector 2018.8.1.0 (Windows) OCT 2018 VMware Identity Manager VMware Identity Manager 3.3 You can find the most up-to-date technical documentation on
VIRTUAL GPU LICENSE SERVER VERSION , , AND 5.1.0
 VIRTUAL GPU LICENSE SERVER VERSION 2018.10, 2018.06, AND 5.1.0 DU-07754-001 _v7.0 through 7.2 March 2019 User Guide TABLE OF CONTENTS Chapter 1. Introduction to the NVIDIA vgpu Software License Server...
Contents Overview... 5 Downloading Primavera Gateway... 5 Primavera Gateway On-Premises Installation Prerequisites... 6
 Gateway Installation and Configuration Guide for On-Premises Version 17 September 2017 Contents Overview... 5 Downloading Primavera Gateway... 5 Primavera Gateway On-Premises Installation Prerequisites...
Teradici PCoIP Connection Manager 1.8 and Security Gateway 1.14
 Teradici PCoIP Connection Manager 1.8 and Security Gateway 1.14 TER1502010/A-1.8-1.14 Contents Document History 4 Who Should Read This Guide? 5 PCoIP Connection Manager and PCoIP Security Gateway Overview
StreamSets Control Hub Installation Guide
 StreamSets Control Hub Installation Guide Version 3.2.1 2018, StreamSets, Inc. All rights reserved. Table of Contents 2 Table of Contents Chapter 1: What's New...1 What's New in 3.2.1... 2 What's New in
VMware AirWatch Content Gateway for Linux. VMware Workspace ONE UEM 1811 Unified Access Gateway
 VMware AirWatch Content Gateway for Linux VMware Workspace ONE UEM 1811 Unified Access Gateway You can find the most up-to-date technical documentation on the VMware website at: https://docs.vmware.com/
Assuming you have Icinga 2 installed properly, and the API is not enabled, the commands will guide you through the basics:
 Icinga 2 Contents This page references the GroundWork Cloud Hub and the Icinga 2 virtualization environment. 1.0 Prerequisites 1.1 Enable the API The Icinga 2 system you run needs to have the API feature
Contents Overview... 5 Upgrading Primavera Gateway... 7 Using Gateway Configuration Utilities... 9
 Gateway Upgrade Guide for On-Premises Version 17 August 2017 Contents Overview... 5 Downloading Primavera Gateway... 5 Upgrading Primavera Gateway... 7 Prerequisites... 7 Upgrading Existing Gateway Database...
VMware AirWatch Product Provisioning and Staging for Windows Rugged Guide Using Product Provisioning for managing Windows Rugged devices.
 VMware AirWatch Product Provisioning and Staging for Windows Rugged Guide Using Product Provisioning for managing Windows Rugged devices. AirWatch v9.2 Have documentation feedback? Submit a Documentation
Aware IM Version 8.1 Installation Guide
 Aware IM Version 8.1 Copyright 2002-2018 Awaresoft Pty Ltd CONTENTS 1 INSTALLATION UNDER WINDOWS OPERATING SYSTEM... 3 1.1 HARDWARE AND SOFTWARE REQUIREMENTS... 3 1.2 USING THE INSTALLATION PROGRAM...
Installing the Management Software
 To install the software for the first time, or if you want to update or reinstall the software, access the supervisor module with a web browser. Click the Install links on the web page that is displayed.
Migrating vrealize Automation 6.2 to 7.1
 Migrating vrealize Automation 6.2 to 7.1 vrealize Automation 7.1 This document supports the version of each product listed and supports all subsequent versions until the document is replaced by a new edition.
IBM Maximo Anywhere Version 7 Release 6. Planning, installation, and deployment IBM
 IBM Maximo Anywhere Version 7 Release 6 Planning, installation, and deployment IBM Note Before using this information and the product it supports, read the information in Notices on page 65. This edition
Configuring the Oracle Network Environment. Copyright 2009, Oracle. All rights reserved.
 Configuring the Oracle Network Environment Objectives After completing this lesson, you should be able to: Use Enterprise Manager to: Create additional listeners Create Oracle Net Service aliases Configure
Enabling Secure Sockets Layer for a Microsoft SQL Server JDBC Connection
 Enabling Secure Sockets Layer for a Microsoft SQL Server JDBC Connection Secure Sockets Layer (SSL) is the standard security technology for establishing an encrypted link between a web server and a browser.
Professional Edition User Guide
 Professional Edition User Guide Pronto, Visualizer, and Dashboards 2.0 Birst Software Version 5.28.6 Documentation Release Thursday, October 19, 2017 i Copyright 2015-2017 Birst, Inc. Copyright 2015-2017
Installing and Configuring VMware vcenter Orchestrator
 Installing and Configuring VMware vcenter Orchestrator vcenter Orchestrator 4.2.1 This document supports the version of each product listed and supports all subsequent versions until the document is replaced
VMware Identity Manager Connector Installation and Configuration (Legacy Mode)
") VMware Identity Manager Connector Installation and Configuration (Legacy Mode) VMware Identity Manager This document supports the version of each product listed and supports all subsequent versions until
VMware Identity Manager Connector Installation and Configuration (Legacy Mode) VMware Identity Manager This document supports the version of each product listed and supports all subsequent versions until
MARWATCH INSTALLATION AND UPGRADE GUIDE
 MARWATCH INSTALLATION AND UPGRADE GUIDE For Service Providers RELEASE 5.0 Introduction Notice The information contained in this document is believed to be accurate in all respects but is not warranted
Oracle WebLogic Server 12c: Administration I
 Oracle WebLogic Server 12c: Administration I Duration 5 Days What you will learn This Oracle WebLogic Server 12c: Administration I training teaches you how to install and configure Oracle WebLogic Server
8.0 Help for Community Managers Release Notes System Requirements Administering Jive for Office... 6
 for Office Contents 2 Contents 8.0 Help for Community Managers... 3 Release Notes... 4 System Requirements... 5 Administering Jive for Office... 6 Getting Set Up...6 Installing the Extended API JAR File...6
Cloud Help for Community Managers...3. Release Notes System Requirements Administering Jive for Office... 6
 for Office Contents 2 Contents Cloud Help for Community Managers...3 Release Notes... 4 System Requirements... 5 Administering Jive for Office... 6 Getting Set Up...6 Installing the Extended API JAR File...6
INSTALLING ADOBE LIVECYCLE WORKBENCH 11
 INSTALLING ADOBE LIVECYCLE WORKBENCH 11 Legal notices Legal notices For legal notices, see http://help.adobe.com/en_us/legalnotices/index.html. iii Contents Chapter 1: About This Document 1.1 Who should
Dell Wyse Management Suite. Version 1.1 Deployment Guide
 Dell Wyse Management Suite Version 1.1 Deployment Guide Notes, cautions, and warnings NOTE: A NOTE indicates important information that helps you make better use of your product. CAUTION: A CAUTION indicates
VMware AirWatch Content Gateway Guide for Linux For Linux
 VMware AirWatch Content Gateway Guide for Linux For Linux Workspace ONE UEM v9.7 Have documentation feedback? Submit a Documentation Feedback support ticket using the Support Wizard on support.air-watch.com.
Storage Manager 2018 R1. Installation Guide
 Storage Manager 2018 R1 Installation Guide Notes, Cautions, and Warnings NOTE: A NOTE indicates important information that helps you make better use of your product. CAUTION: A CAUTION indicates either
MMS Backup Manual Release 1.4
 MMS Backup Manual Release 1.4 MongoDB, Inc. Jun 27, 2018 MongoDB, Inc. 2008-2016 2 Contents 1 Getting Started with MMS Backup 4 1.1 Backing up Clusters with Authentication.................................
Server Installation Guide
 Server Installation Guide Server Installation Guide Legal notice Copyright 2018 LAVASTORM ANALYTICS, INC. ALL RIGHTS RESERVED. THIS DOCUMENT OR PARTS HEREOF MAY NOT BE REPRODUCED OR DISTRIBUTED IN ANY
1Integrate for ArcGIS Installation Guide. Server Edition
 1Integrate for ArcGIS Installation Guide Server Edition Product version: v 2.1 Document version: v 1.9 Document date: 03/08/2018 Copyright 2018 1Spatial plc and its affiliates. All rights reserved. Other
Central Administration Console Installation and User's Guide
 IBM Tivoli Storage Manager FastBack for Workstations Version 7.1.1 Central Administration Console Installation and User's Guide SC27-2808-04 IBM Tivoli Storage Manager FastBack for Workstations Version
VMware Workspace ONE UEM VMware AirWatch Cloud Connector
 VMware AirWatch Cloud Connector VMware Workspace ONE UEM 1811 You can find the most up-to-date technical documentation on the VMware website at: https://docs.vmware.com/ If you have comments about this
APAR PO06620 Installation Instructions
 IBM Corporation APAR PO06620 Installation Instructions IBM Counter Fraud Management 1.5.0.5 IBM Counter Fraud Development 3-31-2017 Table of Contents 1 Fix readme... 1 2 Abstract... 1 3 Contents... 1 4
Installing and Configuring Cisco Unified Real-Time Monitoring Tool
 CHAPTER 2 Installing and Configuring Cisco Unified Real-Time Monitoring Tool You can install Cisco Unified Real-Time Monitoring Tool (RTMT), which works for resolutions 800*600 and above, on a computer
Using the vrealize Orchestrator Operations Client. vrealize Orchestrator 7.5
 Using the vrealize Orchestrator Operations Client vrealize Orchestrator 7.5 You can find the most up-to-date technical documentation on the VMware website at: https://docs.vmware.com/ If you have comments
VMware Horizon JMP Server Installation and Setup Guide. 13 DEC 2018 VMware Horizon 7 7.7
 VMware Horizon JMP Server Installation and Setup Guide 13 DEC 2018 VMware Horizon 7 7.7 You can find the most up-to-date technical documentation on the VMware website at: https://docs.vmware.com/ If you
CA LISA. Installation and Configuration Guide. Version 7.0.2
 CA LISA Installation and Configuration Guide Version 7.0.2 This Documentation, which includes embedded help systems and electronically distributed materials, (hereinafter referred to as the Documentation
Version 11 Release 0 May 31, IBM Contact Optimization Installation Guide IBM
 Version 11 Release 0 May 31, 2018 IBM Contact Optimization Installation Guide IBM Note Before using this information and the product it supports, read the information in Notices on page 39. This edition
Internet Script Editor
 ISE Application, page 1 ISE Functionality, page 1 ISE Requirements, page 2 TLS Requirements for ISE, page 2 ISE Installation and Upgrades, page 5 Troubleshooting Tools for, page 7 ISE Application You can
Edge Device Manager Quick Start Guide. Version R15
 Edge Device Manager Quick Start Guide Version R15 Notes, cautions, and warnings NOTE: A NOTE indicates important information that helps you make better use of your product. CAUTION: A CAUTION indicates
Using the VMware vrealize Orchestrator Client
 Using the VMware vrealize Orchestrator Client vrealize Orchestrator 7.0 This document supports the version of each product listed and supports all subsequent versions until the document is replaced by
LifeSize Control Installation Guide
 LifeSize Control Installation Guide January 2009 Copyright Notice 2005-2009 LifeSize Communications Inc, and its licensors. All rights reserved. LifeSize Communications has made every effort to ensure
Working with Database Connections. Version: 7.3
 Working with Database Connections Version: 7.3 Copyright 2015 Intellicus Technologies This document and its content is copyrighted material of Intellicus Technologies. The content may not be copied or
Installing and Configuring Cisco Unified Real-Time Monitoring Tool
 CHAPTER 2 Installing and Configuring Cisco Unified Real-Time Monitoring Tool You can install Cisco Unified Real-Time Monitoring Tool (RTMT), which works for resolutions 800*600 and above, on a computer
Dell Storage Manager 2016 R3 Installation Guide
 Dell Storage Manager 2016 R3 Installation Guide Notes, Cautions, and Warnings NOTE: A NOTE indicates important information that helps you make better use of your product. CAUTION: A CAUTION indicates either
VMware Enterprise Systems Connector Installation and Configuration. JULY 2018 VMware Identity Manager 3.2 VMware Identity Manager VMware AirWatch 9.
 VMware Enterprise Systems Connector Installation and Configuration JULY 2018 VMware Identity Manager 3.2 VMware Identity Manager VMware AirWatch 9.3 You can find the most up-to-date technical documentation
Installation Guide Savision iq
 Installation Guide Savision iq Contents 1. Introduction... 3 1.1 About This Guide... 3 1.2 Supported Integrations... 3 1.3 Software Components... 3 2. Installing Savision iq... 4 2.1 Upgrading from Savision
Dell Wyse Management Suite. Version 1.0 Quick Start Guide
 Dell Wyse Management Suite Version 1.0 Quick Start Guide Notes, cautions, and warnings NOTE: A NOTE indicates important information that helps you make better use of your product. CAUTION: A CAUTION indicates
Dell EMC ME4 Series vsphere Client Plug-in
 Dell EMC ME4 Series vsphere Client Plug-in User's Guide Regulatory Model: E09J, E10J, E11J Regulatory Type: E09J001, E10J001, E11J001 Notes, cautions, and warnings NOTE: A NOTE indicates important information
McAfee Cloud Identity Manager Installation Guide For McAfee Cloud Identity Manager v3.1 August 2012
 McAfee Cloud Identity Manager Installation Guide For McAfee Cloud Identity Manager v3.1 August 2012 Order Number: 326712-005US COPYRIGHT Copyright 2012 McAfee, Inc. Do not copy without permission. TRADEMARK
VMware Application Proxy v Guide. vrealize Operations Manager 6.7
 VMware Application Proxy v1.0.0.1 Guide vrealize Operations Manager 6.7 You can find the most up-to-date technical documentation on the VMware website at: https://docs.vmware.com/ If you have comments
VMware AirWatch Cloud Connector Guide ACC Installation and Integration
 VMware AirWatch Cloud Connector Guide ACC Installation and Integration Workspace ONE UEM v1810 Have documentation feedback? Submit a Documentation Feedback support ticket using the Support Wizard on support.air-watch.com.
CA Agile Central Installation Guide On-Premises release
 CA Agile Central Installation Guide On-Premises release 2016.2 Agile Central to Go 2017.1 rallysupport@rallydev.com www.rallydev.com 2017 CA Technologies (c) 2017 CA Technologies Version 2016.2 (c) Table
VMware Workspace ONE UEM Product Provisioning for Windows Rugged Documentation. VMware Workspace ONE UEM 1811
 VMware Workspace ONE UEM Product Provisioning for Windows Rugged Documentation VMware Workspace ONE UEM 1811 You can find the most up-to-date technical documentation on the VMware website at: https://docs.vmware.com/
PrinterOn Print Delivery Station
 PrinterOn Print Delivery Station Installation and Administration Guide Version 4.0.2 Contents Chapter 1: Introduction... 5 About the Print Delivery Station software... 5 PDS instances... 5 Print Delivery
Metasploit. Installation Guide Release 4.4
 Metasploit Installation Guide Release 4.4 TABLE OF CONTENTS About this Guide Target Audience...1 Organization...1 Document Conventions...1 Support...2 Support for Metasploit Pro and Metasploit Express...2
Cloud & Smarter Infrastructure Professional Certification Program
 Cloud & Smarter Infrastructure Professional Certification Program Study Guide Series Exam C2010-654 - IBM Tivoli Application Dependency Discovery Manager V7.2.1.3 Implementation Purpose of Exam Objectives...
HySecure Quick Start Guide. HySecure 5.0
 HySecure Quick Start Guide HySecure 5.0 Last Updated: 25 May 2017 2012-2017 Propalms Technologies Private Limited. All rights reserved. The information contained in this document represents the current
Import Data Connection from an SAP Universe
 Import Data Connection from an SAP Universe SAP Analytics Cloud allows you to connect to SAP Universe and import your data. NOTE: It is recommended that the SAP Cloud Platform Cloud Connector (SAP CP CC)
Working with Database Connections. Version: 18.1
 Working with Database Connections Version: 18.1 Copyright 2018 Intellicus Technologies This document and its content is copyrighted material of Intellicus Technologies. The content may not be copied or
Horizon Cloud with On-Premises Infrastructure Administration Guide. VMware Horizon Cloud Service Horizon Cloud with On-Premises Infrastructure 1.
 Horizon Cloud with On-Premises Infrastructure Administration Guide VMware Horizon Cloud Service Horizon Cloud with On-Premises Infrastructure 1.3 Horizon Cloud with On-Premises Infrastructure Administration
Enabling Microsoft Outlook Calendar Notifications for Meetings Scheduled from the Cisco Unified MeetingPlace End-User Web Interface
 Enabling Microsoft Outlook Calendar Notifications for Meetings Scheduled from the Cisco Unified MeetingPlace End-User Web Interface Release 7.1 Revised: March 5, 2013 1:53 pm This document describes the
CA Agile Central Administrator Guide. CA Agile Central On-Premises
 CA Agile Central Administrator Guide CA Agile Central On-Premises 2018.1 Table of Contents Overview... 3 Server Requirements...3 Browser Requirements...3 Access Help and WSAPI...4 Time Zone...5 Architectural
Policy Manager for IBM WebSphere DataPower 7.2: Configuration Guide
 Policy Manager for IBM WebSphere DataPower 7.2: Configuration Guide Policy Manager for IBM WebSphere DataPower Configuration Guide SOAPMDP_Config_7.2.0 Copyright Copyright 2015 SOA Software, Inc. All rights
Installing and Configuring VMware vrealize Orchestrator
 Installing and Configuring VMware vrealize Orchestrator vrealize Orchestrator 6.0.1 This document supports the version of each product listed and supports all subsequent versions until the document is
SafeConsole On-Prem Install Guide. version DataLocker Inc. July, SafeConsole. Reference for SafeConsole OnPrem
 version 5.2.2 DataLocker Inc. July, 2017 SafeConsole Reference for SafeConsole OnPrem 1 Contents Introduction................................................ 2 How do the devices become managed by SafeConsole?....................
StreamServe Persuasion SP4 StreamStudio
 StreamServe Persuasion SP4 StreamStudio Administrator s guide Rev A StreamServe Persuasion SP4 StreamStudio Administrator s guide Rev A 2001-2009 STREAMSERVE, INC. ALL RIGHTS RESERVED United States patent
Progress DataDirect Hybrid Data Pipeline
 Progress DataDirect Hybrid Data Pipeline Installation Guide Release 4.3 Copyright 2018 Progress Software Corporation and/or one of its subsidiaries or affiliates. All rights reserved. These materials
IBM Security Identity Governance and Intelligence. SDI-based IBM Security Privileged Identity Manager adapter Installation and Configuration Guide IBM
 IBM Security Identity Governance and Intelligence SDI-based IBM Security Privileged Identity Manager adapter Installation and Configuration Guide IBM IBM Security Identity Governance and Intelligence
SAS Event Stream Processing 4.3: Visualizing Event Streams with Streamviewer
 SAS Event Stream Processing 4.3: Visualizing Event Streams with Streamviewer Overview Streamviewer provides a user interface that enables you to subscribe to window event streams from one or more event
Akana API Platform: Upgrade Guide
 Akana API Platform: Upgrade Guide Version 8.0 to 8.2 Akana API Platform Upgrade Guide Version 8.0 to 8.2 November, 2016 (update v2) Copyright Copyright 2016 Akana, Inc. All rights reserved. Trademarks
vrealize Suite Lifecycle Manager 1.0 Installation and Management vrealize Suite 2017
 vrealize Suite Lifecycle Manager 1.0 Installation and Management vrealize Suite 2017 vrealize Suite Lifecycle Manager 1.0 Installation and Management You can find the most up-to-date technical documentation
Installing and Configuring vcloud Connector
 Installing and Configuring vcloud Connector vcloud Connector 2.6.0 This document supports the version of each product listed and supports all subsequent versions until the document is replaced by a new
Accessing clusters 2. Accessing Clusters. Date of Publish:
 2 Accessing Clusters Date of Publish: 2018-09-14 http://docs.hortonworks.com Contents Cloudbreak user accounts... 3 Finding cluster information in the web UI... 3 Cluster summary... 4 Cluster information...
Perceptive SOAPBridge Connector
 Perceptive SOAPBridge Connector Installation and Setup Guide Version: 1.0.x Written by: Product Knowledge, R&D Date: June 2017 2016 Lexmark. All rights reserved. Lexmark is a trademark of Lexmark International,
Bitnami Re:dash for Huawei Enterprise Cloud
 Bitnami Re:dash for Huawei Enterprise Cloud Description Re:dash is an open source data visualization and collaboration tool. It was designed to allow fast and easy access to billions of records in all
VMware AirWatch Content Gateway Guide For Linux
 VMware AirWatch Content Gateway Guide For Linux AirWatch v9.2 Have documentation feedback? Submit a Documentation Feedback support ticket using the Support Wizard on support.air-watch.com. This product
vcenter Chargeback Manager Installation and Upgrade Guide
 vcenter Chargeback Manager Installation and Upgrade Guide vcenter Chargeback Manager 2.6.0 This document supports the version of each product listed and supports all subsequent versions until the document
Installing on WebLogic Server
 155 Chapter 11 Installing on WebLogic Server This chapter provides instructions for performing a new installation of TIBCO Collaborative Information Manager on WebLogic Application Server in a non-clustered
vrealize Suite Lifecycle Manager 1.1 Installation, Upgrade, and Management vrealize Suite 2017
 vrealize Suite Lifecycle Manager 1.1 Installation, Upgrade, and Management vrealize Suite 2017 You can find the most up-to-date technical documentation on the VMware website at: https://docs.vmware.com/
Conceptual - Cross-cloud management
 1 Conceptual - Cross-cloud management Dell Cloud Manager (DCM) uses a powerful, open source abstraction layer called Dasein Cloud. Dasein abstracts the different behaviors and capabilities of each cloud.
This is a known issue (SVA-700) that will be resolved in a future release IMPORTANT NOTE CONCERNING A VBASE RESTORE ISSUE
 that will be resolved in a future release IMPORTANT NOTE CONCERNING A VBASE RESTORE ISSUE") SureView Analytics 6.1.1 Release Notes ================================= --------- IMPORTANT NOTE REGARDING DOCUMENTATION --------- The Installation guides, Quick Start Guide, and Help for this release
SureView Analytics 6.1.1 Release Notes ================================= --------- IMPORTANT NOTE REGARDING DOCUMENTATION --------- The Installation guides, Quick Start Guide, and Help for this release
Administering vrealize Log Insight. 12-OCT-2017 vrealize Log Insight 4.5
 Administering vrealize Log Insight 12-OCT-2017 4.5 You can find the most up-to-date technical documentation on the VMware website at: https://docs.vmware.com/ If you have comments about this documentation,
Installing and Configuring VMware vcenter Orchestrator
 Installing and Configuring VMware vcenter Orchestrator vcenter Orchestrator 5.5.2 This document supports the version of each product listed and supports all subsequent versions until the document is replaced
Extended Search Administration
 IBM Lotus Extended Search Extended Search Administration Version 4 Release 0.1 SC27-1404-02 IBM Lotus Extended Search Extended Search Administration Version 4 Release 0.1 SC27-1404-02 Note! Before using
CA XCOM Data Transport Gateway
 CA XCOM Data Transport Gateway Product Guide Release 11.6 This Documentation, which includes embedded help systems and electronically distributed materials, (hereinafter referred to as the Documentation
Migrating vrealize Automation 6.2 to 7.2
 Migrating vrealize Automation 6.2 to 7.2 vrealize Automation 7.2 This document supports the version of each product listed and supports all subsequent versions until the document is replaced by a new edition.
FUSION REGISTRY COMMUNITY EDITION SETUP GUIDE VERSION 9. Setup Guide. This guide explains how to install and configure the Fusion Registry.
 FUSION REGISTRY COMMUNITY EDITION VERSION 9 Setup Guide This guide explains how to install and configure the Fusion Registry. FUSION REGISTRY COMMUNITY EDITION SETUP GUIDE Fusion Registry: 9.2.x Document
Oracle Enterprise Manager. 1 Before You Install. System Monitoring Plug-in for Oracle Unified Directory User's Guide Release 1.0
 Oracle Enterprise Manager System Monitoring Plug-in for Oracle Unified Directory User's Guide Release 1.0 E24476-01 October 2011 The System Monitoring Plug-In for Oracle Unified Directory extends Oracle
Zmanda Cloud Backup FAQ
 Zmanda Cloud Backup 2.0.1 FAQ The first sections of this document cover general questions regarding features, cloud, and support; the last section lists error messages and what to do about them. Terminology
High Availability Enabling SSL Database Migration Auto Backup and Auto Update Mail Server and Proxy Settings Support...
 Quick Start Guide Table of Contents Overview... 4 Deployment... 4 System Requirements... 4 Installation... 6 Working with AD360... 8 Starting AD360... 8 Launching AD360 client... 9 Stopping AD360... 9
Central Administration Console Installation and User's Guide
 IBM Tivoli Storage Manager FastBack for Workstations Version 7.1 Central Administration Console Installation and User's Guide SC27-2808-03 IBM Tivoli Storage Manager FastBack for Workstations Version
IDOL Site Admin. Software Version Installation Guide
 IDOL Site Admin Software Version 12.0 Installation Guide Document Release Date: June 2018 Software Release Date: June 2018 Legal notices Copyright notice Copyright 2015-2018 Micro Focus or one of its affiliates.
DBTuna 2.x Quick Start Guide 12 September 2012
 DBTuna 2.x Quick Start Guide 12 September 2012 This guide describes basic steps for starting the DBTuna server software, and configuring and running DBTuna monitoring Agents. The guide is intended for
Configuring SAML-based Single Sign-on for Informatica Web Applications
 Configuring SAML-based Single Sign-on for Informatica Web Applications Copyright Informatica LLC 2017. Informatica LLC. Informatica, the Informatica logo, Informatica Big Data Management, and Informatica
Client Installation and User's Guide
 IBM Tivoli Storage Manager FastBack for Workstations Version 7.1.1 Client Installation and User's Guide SC27-2809-04 IBM Tivoli Storage Manager FastBack for Workstations Version 7.1.1 Client Installation
SC-T35/SC-T45/SC-T46/SC-T47 ViewSonic Device Manager User Guide
 SC-T35/SC-T45/SC-T46/SC-T47 ViewSonic Device Manager User Guide Copyright and Trademark Statements 2014 ViewSonic Computer Corp. All rights reserved. This document contains proprietary information that
VMware AirWatch Content Gateway for Windows. VMware Workspace ONE UEM 1811 Unified Access Gateway
 VMware AirWatch Content Gateway for Windows VMware Workspace ONE UEM 1811 Unified Access Gateway You can find the most up-to-date technical documentation on the VMware website at: https://docs.vmware.com/