Table of Contents HOL-SDC-1635
|
|
|
- Brianna Lilian Simpson
- 5 years ago
- Views:
Transcription
1 Table of Contents Lab Overview - - vrealize Log Insight... 2 Lab Guidance... 3 Module 1 - Log Management with vrealize Log Insight - (45 Minutes)... 7 Overview of vrealize Log Insight... 8 Video Overview of Log Insight Working with Log Insight Log Insight Agents Integrating Log Insight with vrealize Operations - Better Together...43 Conclusion Page 1
2 Lab Overview - HOL- SDC vrealize Log Insight Page 2
3 Lab Guidance - vrealize Log Insight: This lab will investigate how to use Log Insight Dashboards and Interactive Analytics to discover the best way to troubleshoot and perform root cause analysis on unstructured log information. The lab will also walk through how to configure Log Insight to identify fields, generate alerts, and integrate with vrealize Operations. A Readme.txt file is included on the desktop with authentication information. This lab will investigate how to use Log Insight Dashboards and Interactive Analytics to discover to troubleshoot issues hidden in log information. It will also show you how to configure Log Insight to identify fields, generate alerts, and integrate with vrealize Operations. This lab consists of only 1 module which you should be able to finish it in one sitting. Over all the labs can be taken in any order. A more comprehensive lab covering entire vrealize Suite is HOL-SDC If you are more interested in the vsphere with Operations Management track, please try HOL-SDC vsphere with Operation Management 6: Virtualization 101 and HOL-SDC vsphere with operations Management 6: Advanced Topics. This lab manual can be downloaded from the Hands-on Labs Document site found here: This lab may be available in other languages. To set your language preference and have a localized manual deployed with your lab, you may utilize this document to help guide you through the process: Activation Prompt or Watermark When first starting the lab, you may notice a watermark on the desktop indicating that Windows is not activated. One of the major benefits of virtualization is that virtual machines can be moved and run on any platform. The Hands-on Labs utilizes this benefit and we are able to run the labs out of multiple datacenters. However, these datacenters may not have identical processors, which triggers a Microsoft activation check through the Internet. Rest assured, VMware and the Hands-on Labs are in full compliance with Microsoft licensing requirements. The lab that you are using is a self-contained pod and does not have full access to the Internet, which is required for Windows to verify the activation. Page 3

4 Without full access to the Internet, this automated process fails and you see this watermark. This cosmetic issue has no effect on your lab. If you have any questions or concerns, please feel free to use the support made available to you either at VMworld in the Hands-on Labs area, in your Expert-led Workshop, or online via the survey comments as we are always looking for ways to improve your hands on lab experience. Page 4
5 Disable Remember Passwords in Firefox 1. Open the Firefox menu. 2. Click Options Page 5
6 Disable Remember Passwords continued 1. Click the Security tab. 2. Click to uncheck Remember passwords for sites. 3. Click OK Disclaimer This session may contain product features that are currently under development. This session/overview of the new technology represents no commitment from VMware to deliver these features in any generally available product. Features are subject to change, and must not be included in contracts, purchase orders, or sales agreements of any kind. Technical feasibility and market demand will affect final delivery. Pricing and packaging for any new technologies or features discussed or presented have not been determined. These features are representative of feature areas under development. Feature commitments are subject to change, and must not be included in contracts, purchase orders, or sales agreements of any kind. Technical feasibility and market demand will affect final delivery. Page 6
7 Module 1 - Log Management with vrealize Log Insight - (45 Minutes) Page 7
8 Overview of vrealize Log Insight vrealize Log Insight delivers real-time log management for VMware environments, with machine learning-based Intelligent Grouping, high performance search and better troubleshooting across physical, virtual, and cloud environments. High Performance Ingestion vrealize Log Insight can process any type of log or machine generated data. vrealize Log Insight supports very high throughput rates and low latency. vrealize Log Insight possesses a collection framework which accepts data agentlessly through syslog, a Windows or Linux agent, and via a RESTful Ingestion API. Scalability vrealize Log Insight can scale out by using multiple virtual appliance instances. This enables linear scaling of the ingestion throughput, increases query performance and allows for ingestion high availability. In cluster mode, vrealize Log Insight provides master and worker nodes. Both master and worker nodes are responsible for a subset of data. Master nodes can query all subsets of data and aggregate the results. vrealize Log Insight provides an internal Load Balancer allowing you to load balance and scale out with out additional infrastructure requirements. Real-Time Search Data ingested by vrealize Log Insight is available for search within seconds. Also, historical data can be searched from the same interface with the same low latency. vrealize Log Insight supports complete keyword queries. Keywords are defined as any alpha-numeric, hyphen, or underscore characters. In addition to the complete keyword queries, vrealize Log Insight supports glob queries (for example, erro?, vm*) and field based filtering (for example, hostname does NOT match test*, IP contains "10.64"). Furthermore, log message fields that contain numeric values can be used to define selection filters (for example, CPU>80, 10<threads<100, and so on). Search results are presented as individual events. Each event comes from a single source, but search results may come from multiple sources. You can use vrealize Log Insight to correlate the data on one or multiple dimensions (for example, time and request identifiers) providing a coherent view across the stack. This way, root cause analysis becomes much easier. vrealize Log Insight Agent vrealize Log Insight provides optional Windows and Linux agents to gather log data from Windows and Linux servers as well as desktops. You can collect events from Windows event channels and log files, then forward them to the vrealize Log Insight server. Agents are not required, as Log Insight can also act as a Syslog server, but Page 8
9 agents provide several benefits such as centralized configuration, ease of use, data compression, and encryption. 3rd party agents are supported as well, but those benefits listed previously provide unique advantages of using our Log Insight agents. Intelligent Grouping vrealize Log Insight uses a new machine learning technology. Intelligent Grouping scans incoming unstructured data and quickly groups messages together by problem type in order to give you the ability to rapidly understand issues that may span your physical, virtual, and hybrid cloud environments. The Event Trends tab in the Interactive Analytics page provides automatic analysis of your events with context around new insights and anomaly detection. We can now see how events are trending in a specified time interval and easily detect ones that are potentially affecting the health of your environment or application. Aggregation Fields that are extracted from log data can be used for aggregation. This is similar to the functionality that GROUP-BY queries provide in relational databases or pivot-tables in Microsoft Excel. The difference is that there is no need for extract, transform, and load (ETL) processes and vrealize Log Insight scales to any size of data. You can generate aggregate views of the data and identify specific events or errors without having to access multiple systems and applications. For example, while viewing an important system metric, for example the number of errors per minute, you can drill down to a specific time-range of events and examine the errors that occurred in the environment. Runtime Field Extraction Raw log data is not always easy to understand, and you might need to process some data to identify the fields that are important for searching and aggregation. vrealize Log Insight extracts most fields automatically, and you can dynamically extract a new field from the data. It is as easy as double-clicking the message text and selecting Extract Field. The regex is provided automatically based on your selection. The extracted fields can be used for selection, projection, and aggregation. Dashboards You can create dashboards of useful log metrics that you want to monitor closely. Any query can be turned into a dashboard widget and summarized for any range in time. You can view a breakdown of errors by for the last five minutes, hour, or day and observe the trends in log events. Content Packs While not covered in depth within this lab, Content Packs contain predefined Fields, Queries, Dashboards and Alerts for specific systems or applications. A good example would be the Content Pack for Brocade or the Content Pack for Microsoft SQL Server. Page 9
10 Both content subject matter specific definitions for their focus area. The Brocade Content Pack will contain Fields, Dashboards and Alerts specific to Brocade and the Content pack for Microsoft SQL Server will do likewise for Microsoft SQL. This will allow you to bring in log messages from these systems and not have to create the Fields, Queries, Dashboards or Alerts from scratch. Content Packs for Log Insight are free and can be installed into Log Insight after the initial configuration is complete. To see a full list of management packs please connect to store after this lab. Security Considerations IT decision makers, architects, administrators, and others who must familiarize themselves with the security components of vrealize Log Insight must read the VMware vrealize Log Insight Security Guide. For more information, you can visit the vrealize Log Insight Documentation found at The Security Guide contains concise references to the security features of vrealize Log Insight. Topics include the product external interfaces, ports, authentication mechanisms, and options for configuration and management of security features. Page 10

11 Dashboards Overview Dashboards Think of the dashboards page as an overview section. Dashboards provide the ability to quickly visualize log data and determine potential issues within an environment. Log Insight provides two different types of widgets inside a dashboard: charts and queries. Charts are a visual representation of data and the most commonly used widget. Queries are saved pieces of information that provide both a visual and textual representation of data on the Interactive Analytics page, but they are listed only by a defined name on the dashboards page. Query widgets are typically used when a chart widget does not provide enough useful information. Interactive Analytics Allows administrators and engineers to perform searches using plain language or REGEX strings and view log message detail to determine problem areas and perform root cause analysis. Interactive Analytics Overview The Interactive Analytics page allows administrators and engineers to drill down into log messages, to determine problem areas, and to perform root cause analysis. At the top of the page, just below the navigation bar, you will notice a section with a black background. This section gives you a visual representation of your log data. Page 11
12 The chart in this section should look similar to the chart widgets that you saw on the Dashboards page. By default, the overview chart is a bar chart that displays the count of all events over time for the log messages seen over the last five minutes. Log Insight refers to ingested data as events. The events visually represented on the overview chart can be manipulated in a variety of ways, but most commonly are changed through the use of functions and groupings. There are many options available once you have created a custom query in the Interactive Analytics page: Add current query to favorites - You can save your current query and time range in Log Insight to view it later. Saved queries can only be loaded from the Interactive Analytics page. Add current query to dashboard - You can save lists of search queries to your custom dashboards by creating query list widgets. Export or share current query - In addition to saving a dashboard you can also choose to save a query. NOTE: A saved query stores the time range in addition to the query. This is different then how all other pieces of information are saved in Log Insight (i.e. everything else you can save does not include the time range.) Create or Manage Alerts - When you find a query you care about you might want to configure an alert when that query returns one or more results. Log Insight allows for alerts to be sent via or vcenter Operations. Manage Extracted Fields - This is important if you wish to find an extracted field that does not appear on the current query page.a Page 12
13 Page 13

14 Content Packs Overview Content packs provide a powerful way to extend Log Insight through pre-defined knowledge about particular events. To browse to the Content Packs section, select the three bars icon in the navigation bar and select Content Packs. Alternatively from any browser (when not in the lab) you can go to for a list of all the Content Packs available for Log Insight. An example of that web page is above. A content pack is made up of various components. These components can include: Dashboards the dashboard groups (i.e. pages) that make up the selected dashboard Queries Chart widgets Saved queries located under Saved Searches Alerts remember always disabled when exported Agent Groups - contain configuration for monitoring, parsing, and tagging event to be sent to Log Insight Fields labeled as Extracted Fields Page 14
15 Video Overview of Log Insight One issue we have come across regularly with headphones and the ThinClients used at the HOL events, is the headphones don't always get plugged in all the way. Please make sure your headphones are seated all the into the device. A short 8 minute overview video of Log Insight Page 15

16 Working with Log Insight In this section we will use Log Insight explore the logs of a vsphere environment. Often, without a log analysis tools such as Log Insight, log errors are not viewed until production workloads have degraded or failed and the business is impacted. With Log Insight we can uncover log events and patterns that may ultimately lead to problems so we can take action before hand. In this section we will focus on log analysis and dashboards, though you can use these same principles to create alerts and forward them to vrealize Operations or via SMTP. Log Insight Bookmark 1. If you are not already logged into Log Insight server loginsight-01a, click the Log Insight folder and select loginsight-01a Page 16

17 Login to Loginsight-01a User: admin Password: VMware1! Click Login -or- Press Enter Log Insight's Dashboard General Overview If you have successfully connected to a vcenter, earlier in this module, the first screen you will see is the vsphere - General Overview dashboard. 1. If you are not already at this screen click the Dashboards button. 2. This is the dashboard category tile, it tells you the source of the dashboards that are available (to see a complete list of installed dashboards click the down arrow next to the category title). Dashboards are either created within Log Insight or come as part of a Content Pack. By default the vsphere Content Pack comes preinstalled. Dashboards from any other content pack that you install can be found by clicking that arrow. 3. Section 3 is a list of actual dashboards for the current category - The image above shows the dashboards from the VMware - vsphere Content Pack. 4. Section 4 of the screen allows you to apply a date/time range filter to limit the data you are viewing within the dashboard. Keeping this to a minimal range Page 17


18 improves the performance of the UI due to the system only needing to query that limited set of data. 5. Section 5 shows the filters which are available as part of this dashboard. The filters allow you to quickly focus the dashboard on a specific object/item of interest. 6. Widgets, the widget in Log Insight are configured to query the consolidated log database and show specific areas of regular interest. In this case, the widget is showing a graphical representation of all the vsphere log messages and when they were generated. Widgets can be arranged in multiple way and sizes. Interactive Analytics 1. Click Interactive Analytics Page 18
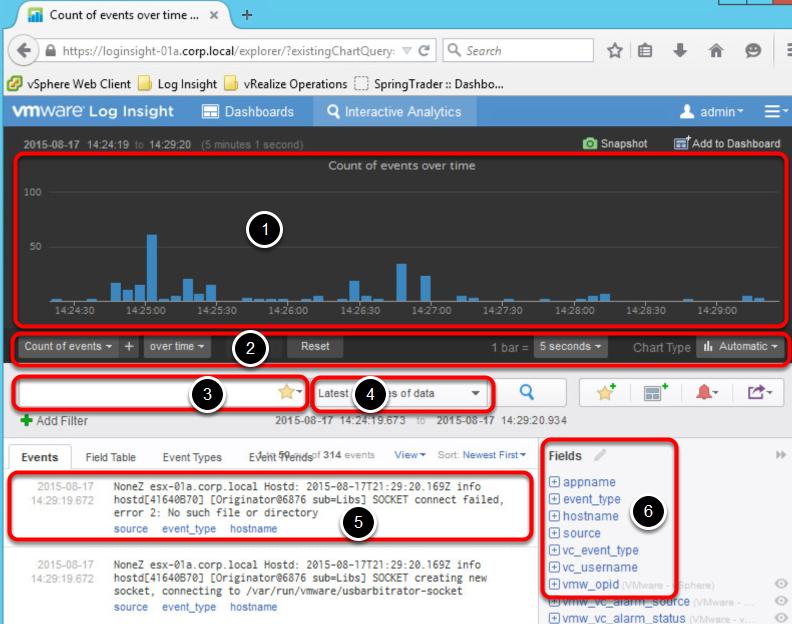
19 The Interactive Analytics Screen The following describes the different sections of the Interactive Analytics Screen: 1. This area show the graphical representation of the current Query, because we have not specified anything as a query or filter all the events are being shown. 2. This section modifies how the graph displays the data. 3. The Search box, you can enter anything here you would like to search for within the logs on file. for example this could be a host name, error message or number 4. Data Range, Log Insight auto-correlates all log data, in this field you can specify a specific time range you would like to search for log entries. By default the time range field is set to Latest 5 minutes of data. Be advised: large date ranges will take a longer time to return the complete set of data, but that data will stream in as the query result is returned. In this lab we have only just connected to the vcenter thus we have a limited time range where data is available. 5. Events are the log entries which match the query and will be displayed here. The key words (Fields) contained in each of the log messages will be called out in blue below the log message. By default Log Insight understands all the Syslog defined fields. As as part of content packs Fields are added which are specific to their domain. In this case all the vsphere and Syslog Fields are available. 6. Field List, all the defined fields from all the log messages which are part of the result set from the query, are listed here. You can click on any one of them and they will show you a graphical representation of the number of log messages which are associated to that field. The default defined fields are from vsphere and Syslog. Additional Fields are added when Content Packs (later in this lesson) are added or can be user defined and saved (later in this lesson). Page 19
20 Page 20

21 Searching Log Events You can query events in an english like manor. 1. type in firewall in the query line 2. select All time from the time range drop down. Note: In a production environment this would not be advisable since it would involved searching though all the the log event know to Log Insight this could take longer than expected. Our lab only has a limited amount of data so it will not effect the lab. 3. Click the Search button 4. Note that we have 10 different event categories and over 15 thousand actual events (log messages) that Log insight has already sorted into categories (more of this in the next few steps) Note: Log Events are very dynamic the actual number of Events or categories shown may differ in your console. More information leads to more specific respones 1. Change the Query line to firewall configuration Page 21

22 2. Click on the search button 3. Note: that the number of event types is down and the number of actual events is also greatly reduced. Now the result only show events directly related to firewall configuration. Page 22
23 Searching Log Events and Extracting Fields As you enter keyword searches inside the search box, Log Insight will provide auto complete options as you type. 1. In the search field type latency* (remember to type in the asterisk since we are looking for latency or any message with the word latency as a part of it), in this case we are looking for all messages which are related to latency. In English, simply type in the word or phrase you are looking for and we added an asterisk as the wildcard. 2. If not already showing All time, click the down arrow to open the data range drop down, in this case please select All time. In a production environment this would not be advisable since it could involved searching though millions of events. 3. Press Enter or click the search Icon. Event Types Event Types are used when troubleshooting to quickly narrow down the resulting set of log messages into pattern matched clusters. This capability allows you to quickly eliminate irrelevant log messages. 1. If its not selected already Click the Event Types tab. This will sort the result set of log messeges by Event Type 2. Event Types will provide the count of messages in the pattern matched type Page 23


24 3. When you hover over the number of messages a delete (x) and setting (*) buttons will appear. Hover over any of the user latencey messages and Click the x to remove this message type from the result set and automatically creates a filter for that messege type. Do not delete the I/O latency messeges. Note: the log messages are not deleted from Log Insight but a filter is created to exclude that message type for this Interactive Analytics session, see the next step for more information on filters. Note: The lab you are taking is a live dynamic environment. What you see may differ from what is captured in the screenshot. Please choose any event in the window and proceed to the next step. Filters After deleting the Event Type (the log messages are retained they are only removed from this query), the system automatically creates a filter or constraint excluding that specific event type. Page 24

25 Creating a Filter Now we will create a new filter to only include log messages based on the text SCSI. This will show the number of SCSI latency events in the logs. 1. Click Add Filter Set Filter Constraints 1. You can run filters against any defined field or plain text within a log message, were going to use text for this step but you can click the down arrow to explore the Fields know to Log Insight in this lab. 2. Set the Operator to contains by clicking the down arrow and selecting it 3. Type scsi 4. Click the search button At this point the result list will only show log messages related to the text scsi that are not the specific event_type we deleted. Now we have narrowed down our results to only 1 event types (prior to adding filters there were over a dozen different event types). Dynamic Field Extraction Fields provide a powerful way to sort and construct queries in Log Insight. A custom Field for SCSI Latency in vsphere already exists; Page 25

26 1. This shows the pre-defined Field vmw_esxi_scsi_latency 2. Click on the small '+' in front of vmw_esxi_scsi_latency, 3. This shows the number of log messages received that specifically meet that field criteria. 4. Click the edit Icon Page 26

27 Checking a Field's properties After Clicking the edit Icon the Extracted Field chooser will pop up with a list of all the Extracted Fields known to the Log Insight at this time. Note: you can add field automatically by installing a Log Insight Content Pack. 1. Type vmw_esxi_scsi_ and stop there. As you typed Log Insight automatically started filtering the extracted field to the only the ones that match what you are typing. Page 27


28 vmw_esxi_scsi_latency 1. Add the lower case letter L to the end of what you typed. 2. At this point you have a unique Field Name and only that field is being shown in the list. 3. Click the Field Name vmw_esxi_scsi_latency Exploring the Field's settings 1. All the Field's defined propertied are displayed, but it is marked Read only because this field was created by the vsphere Content Pack which is by default pre-installed into Log Insight. 2. You can close this Field and modify it's setting by clicking the Duplicate button (no action required in this step) 3. Close the Fields properties Page 28
29 Clear the Query and Filters Since scsi latency already has an Extracted Field defined for it, we're going to use another example to illustrate how to create one. But first we need to clear the query and filters; 1. Click the blue 'X' next to both filters to delete the filters 2. delete the the word latency* from the query line 3. Hit the search Icon or hit return At this point what is showing is all the log messages in the Log Insight system. Page 29

30 Creating a Dynamic Field Extraction Extracted fields provide a powerful way to construct queries in Log Insight. You can also create you own custom extracted fields. Since scsi latency already has an Extracted Field we're going to use another example to illustrate how to create one. 1. Type in api invocations into the query line 2. Click the search Button 3. Click the Events tab. 4. Highlight the value next to "API invocations:". In the example above, its listed as 2, but this number could be different. 5. A pop up window appears, select Extract field. Page 30

31 Fields Pane 1. The extracted value is also pre-filled for you with the data type and regular expression to validate the data. 2. The one-click Dynamic Field Extraction automatically populates the Fields pane with the pre and post context regular expressions. Page 31


32 Fields Pane configuration A Fields configuration will appear on the right side of your screen. We now need to name the extracted field, determine who can use the field, then save the field for use in the future. You will use this extracted field later in this module when we integrate with vrealize Operations Manager. Note that the Extracted value 1. In the Field Name input box, type vmw_vc_api. 2. Under Available for drop down, you have the option to make this extracted field available to just yourself or all users. Leave this as Me Only. 3. Click Save. Extracted Field Complete Notice that we now have a new field called vmw_vc_api. Now we will move to the next step. Grouping Events We've primarily been working with the query section of Interactive Analysis now we're going to focus on the Graphing Now we want to group events which adds some additional data into our graph. Page 32
 and vmw_vc_auth_user")

33 1. Select over time drop down. 2. Place a check next to vmw_vc_auth_source (VMware - vsphere) and vmw_vc_auth_user (VMware - vsphere) 3. Select Apply. Legend Created Notice that a legend has been created on the right side of the graph to display the IP address and the username for who was connecting to the vcenter appliance. Page 33


34 Add Query to Dashboard Now we will create a new dashboard called API Invocation Events based on our search results. 1. Click Add to Dashboard. Add Chart to Dashboard 1. Enter API Invocation Events in the Name field 2. Ensure the Dashboard 1 is selected, you could change the dashboard you are adding this query to to any dashboard you have right to modify or create a new dashboard. 3. Click Add Page 34


35 Navigate to the Dashboards page 1. Click Dashboards Select My Dashboards 1. Click the drop down arrow for the dashboard list. 2. Select My Dashboards. Page 35

36 Observe the Modified Dashboard Observe that a new widget named API Invocation Events is now included with Dashboard 1. Page 36
37 Log Insight Agents The Log Insight Agent collects events from log files on Windows or Linux operating sytems and forwards them to the vrealize Log Insight server. On a Linux system, when syslog forwarding is not sufficient, the agent can be installed in the VM OS and configured to collect events then forward them to Log Insight. Some applications store log data in flat text files on the file system, the agent can collect and forward these. The Log Insight Linux Agent runs as a daemon and starts immediately after installation. Since windows does not natively support syslog, Log Insight Windows Agent collects events from Windows event channels and log files then forwards them to Log Insight. A Windows event channel is a pool for collecting related events in a Windows system. By default the Log Insight Windows Agent collects events from the Application, System, and Security channels. The Log Insight Windows Agent also can collect data from flat text files on the file system. It runs as a Windows service and starts immediately after installation. For this lab, we installed and configured the Windows Agent on one of the Windows servers in this lab environment. Installation of the vrealize Operations Manager Agent is not part of this lab, but it is as easy as copying the installer file to the target system, executing it and giving the installer the DNS or IP address of Log Insight system. The agent will automatically start at the completion of the install. Both agents can monitor directories and collect events from flat text files During and after installation, you can configure the following options for the Log Insight Windows Agent: Select the target Log Insight server to which the Log Insight Windows Agent forwards events. Select the communication protocol and port that the Log Insight Windows Agent uses. Add additional Windows event channels from which the Log Insight Windows Agent collects events to. Select Windows directories to monitor and add flat log files to collection. 3rd party agents are also supported, but our own native agents (for Windows and Linux) offer advantages, such as easy/central configuration through the Log Insight UI, data compression, and encryption over SSL (available in version 3.0 or higher). Navigating to the Administration Page Note: Ensure that you are on the Log Insight browser tab. Page 37

38 1. On the upper right, of either the Dashboard Tab or Interactive Analytics page click the configuruation drop down. 2. Select Administration. Page 38
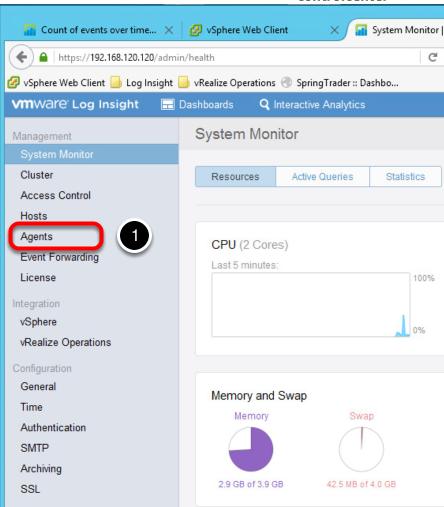
39 Administration Page From the Administration Page you can configure the properties of how Log Insight works. Some of the key items you can configure: Log Insight Cluster Configuration - Where you can manage the number of server in you Log Insight cluster for increase scaleability. Access Control - Who has access right to Log Insight Events Forwarding - If you need to forward the events from Log Insight to another Log Insight, Syslog or storage system. Licensing Integration - with both vsphere and vrealize Operations Time - Having everything on the same time services is very important for log event correlation. Archiving - Allows you to archive out older log data for long term storage and easy ingestion back into Log Insight for historical troubleshooting. 1. Click on the Agents option. Page 39
40 Page 40
 2.")
41 Agents Page This page shows any agents that are installed and forwarding data to this Log Insight instance. 1. In this case we have one Windows agent that was just installed. (no action required in this step) 2. The agents all have a default configuration when installed, once connected to the Log Insight server (or cluster) they will upload any configuration changes from this section. (no action required in this step) 3. A complete list of agents configuration options are covered in the administration portion of the Online Help, under agent configuration. (no action required in this step) 4. (Optional) If you cannot see the Agent Configuration section, select the scroll bar in the far right of the window and drag it down. Page 41
42 Centralized Agent Configuration From the Agent page you can also download all the agents to be copied or delivered to the systems needing agents. 1. After clicking this link there will be a pop up that asks which agent package you wish to download. (no action required in this step) Page 42
43 Integrating Log Insight with vrealize Operations - Better Together Note: One regular issue issue we have come across with headphones and the ThinClients used at the HOL events is the headphones don't always get plugged in all the way. Please make sure that your headphone plug is completely seated within the device. 5 minute video demonstrating the integration of Log Insight with vrealize Operations Manager Page 43
44 Conclusion Thank you for completing the vrealize Log Insight focus lab! Page 44
45 Conclusion Thank you for participating in the VMware Hands-on Labs. Be sure to visit to continue your lab experience online. Lab SKU: Version: Page 45
Using vrealize Log Insight
 vrealize Log Insight 4.3 This document supports the version of each product listed and supports all subsequent versions until the document is replaced by a new edition. To check for more recent editions
Using vrealize Log Insight. April 12, 2018 vrealize Log Insight 4.6
 Using vrealize Log Insight April 12, 2018 vrealize Log Insight 4.6 You can find the most up-to-date technical documentation on the VMware website at: https://docs.vmware.com/ If you have comments about
Using vrealize Log Insight. 08-SEP-2017 vrealize Log Insight 4.5
 08-SEP-2017 vrealize Log Insight 4.5 You can find the most up-to-date technical documentation on the VMware Web site at: https://docs.vmware.com/ The VMware Web site also provides the latest product updates.
Using vrealize Log Insight
 vrealize Log Insight 3.6 This document supports the version of each product listed and supports all subsequent versions until the document is replaced by a new edition. To check for more recent editions
Using vrealize Log Insight. Update 1 Modified on 03 SEP 2017 vrealize Log Insight 4.0
 Using vrealize Log Insight Update 1 Modified on 03 SEP 2017 vrealize Log Insight 4.0 You can find the most up-to-date technical documentation on the VMware website at: https://docs.vmware.com/ If you have
Using vrealize Log Insight
 vrealize Log Insight 4.0 This document supports the version of each product listed and supports all subsequent versions until the document is replaced by a new edition. To check for more recent editions
Table of Contents HOL-1701-CHG-5
 Table of Contents Lab Overview: vrealize Operations Application Monitoring: Challenge Lab... 2 Lab Overview... 3 Lab Guidance... 5 Module 1 - Configuring a Custom Application (15 minutes)... 10 Introduction...
Table of Contents HOL-1710-SDC-6
 Table of Contents Lab Overview - - What's New: vsphere with Operations Management.. 2 Lab Guidance... 3 Module 1 - What's New in vsphere (90 minutes)... 9 vcenter Server Appliance (VSCA)... 10 vcenter
Table of Contents HOL-PRT-1463
 Table of Contents Lab Overview - - vcenter Operations Manager Management Pack for Oracle Enterprise Manager... 2 Lab Guidance... 3 Module 1 - Oracle Enterprise Manager Management Pack Introduction (15
Table of Contents HOL-SDC-1317
 Table of Contents Lab Overview - Components... 2 Business Critical Applications - About this Lab... 3 Infrastructure Components - VMware vcenter... 5 Infrastructure Components - VMware ESXi hosts... 6
Table of Contents HOL CMP
 Table of Contents Lab Overview - - Monitor and Troubleshoot Your Infrastructure and Applications with vrealize Operations and vrealize Log Insight... 2 Lab Guidance... 3 Module 1 - Troubleshoot Infrastructure
Installing and Configuring vcloud Connector
 Installing and Configuring vcloud Connector vcloud Connector 2.6.0 This document supports the version of each product listed and supports all subsequent versions until the document is replaced by a new
Getting Started. 05-SEPT-2017 vrealize Log Insight 4.5
 05-SEPT-2017 vrealize Log Insight 4.5 You can find the most up-to-date technical documentation on the VMware Web site at: https://docs.vmware.com/ The VMware Web site also provides the latest product updates.
Administering vrealize Log Insight. September 20, 2018 vrealize Log Insight 4.7
 Administering vrealize Log Insight September 20, 2018 4.7 You can find the most up-to-date technical documentation on the VMware website at: https://docs.vmware.com/ If you have comments about this documentation,
VMware vrealize Log Insight Getting Started Guide
 VMware vrealize Log Insight Getting Started Guide vrealize Log Insight 2.5 This document supports the version of each product listed and supports all subsequent versions until the document is replaced
Getting Started. Update 1 Modified on 03 SEP 2017 vrealize Log Insight 4.0
 Update 1 Modified on 03 SEP 2017 vrealize Log Insight 4.0 You can find the most up-to-date technical documentation on the VMware website at: https://docs.vmware.com/ If you have comments about this documentation,
Getting Started. April 12, 2018 vrealize Log Insight 4.6
 April 12, 2018 vrealize Log Insight 4.6 You can find the most up-to-date technical documentation on the VMware website at: https://docs.vmware.com/ If you have comments about this documentation, submit
Getting Started. vrealize Log Insight 4.3 EN
 vrealize Log Insight 4.3 This document supports the version of each product listed and supports all subsequent versions until the document is replaced by a new edition. To check for more recent editions
VMware vrealize Operations for Horizon Installation
 VMware vrealize Operations for Horizon Installation vrealize Operations for Horizon 6.4 Installation vrealize Operations for Horizon 6.4 This document supports the version of each product listed and supports
vrealize Operations Management Pack for NSX for vsphere 2.0
 vrealize Operations Management Pack for NSX for vsphere 2.0 This document supports the version of each product listed and supports all subsequent versions until the document is replaced by a new edition.
Using vrealize Operations Tenant App as a Service Provider
 Using vrealize Operations Tenant App as a Service Provider Using vrealize Operations Tenant App as a Service Provider You can find the most up-to-date technical documentation on the VMware Web site at:
VMware vrealize Operations for Horizon Installation. VMware vrealize Operations for Horizon 6.5
 VMware vrealize Operations for Horizon Installation VMware vrealize Operations for Horizon 6.5 You can find the most up-to-date technical documentation on the VMware website at: https://docs.vmware.com/
Table of Contents HOL-HBD-1301
 Table of Contents Lab Overview... 2 - vcloud Hybrid Service Jump Start for vsphere Admins...3 Module 1 - vcloud Hybrid Service: Architecture and Consumption Principles...5 vcloud Hybrid Service... 6 vcloud
Installing and Configuring vcloud Connector
 Installing and Configuring vcloud Connector vcloud Connector 2.5.0 This document supports the version of each product listed and supports all subsequent versions until the document is replaced by a new
vrealize Operations Management Pack for NSX for vsphere 3.0
 vrealize Operations Management Pack for NSX for vsphere 3.0 This document supports the version of each product listed and supports all subsequent versions until the document is replaced by a new edition.
vrealize Automation Management Pack 2.0 Guide
 vrealize Automation Management Pack 2.0 Guide This document supports the version of each product listed and supports all subsequent versions until the document is replaced by a new edition. To check for
VMware AirWatch: Directory and Certificate Authority
 Table of Contents Lab Overview - HOL-1857-06-UEM - VMware AirWatch: Directory and Certificate Authority Integration... 2 Lab Guidance... 3 Module 1 - Advanced AirWatch Configuration, AD Integration/Certificates
Table of Contents HOL-1757-MBL-6
 Table of Contents Lab Overview - - VMware AirWatch: Technology Partner Integration... 2 Lab Guidance... 3 Module 1 - F5 Integration with AirWatch (30 min)... 8 Getting Started... 9 F5 BigIP Configuration...
VMware vrealize Operations for Horizon Installation. VMware vrealize Operations for Horizon 6.3
 VMware vrealize Operations for Horizon Installation VMware vrealize Operations for Horizon 6.3 VMware vrealize Operations for Horizon Installation You can find the most up-to-date technical documentation
Table of Contents HOL-PRT-1467
 Table of Contents Lab Overview - - Virtual Volumes with Dell EqualLogic... 2 Lab Guidance... 3 Pre-flight Instructions... 5 Module 1 - Working with Dell EqualLogic and VVOLs (60 Mins)... 11 Creating a
vrealize Hyperic Monitoring and Management Guide vrealize Hyperic 5.8.4
 vrealize Hyperic Monitoring and Management Guide vrealize Hyperic 5.8.4 You can find the most up-to-date technical documentation on the VMware website at: https://docs.vmware.com/ If you have comments
F5 Analytics and Visibility Solutions
 Agility 2017 Hands-on Lab Guide F5 Analytics and Visibility Solutions F5 Networks, Inc. 2 Contents: 1 Class 1: Introduction to F5 Analytics 5 1.1 Lab Environment Setup.......................................
OpenManage Management Pack for vrealize Operations Manager Version 1.1. Installation Guide
 OpenManage Management Pack for vrealize Operations Manager Version 1.1 Installation Guide Notes, cautions, and warnings A NOTE indicates important information that helps you make better use of your product.
Pure Storage FlashArray Management Pack for VMware vrealize Operations Manager User Guide. (Version with Purity 4.9.
 Pure Storage FlashArray Management Pack for VMware vrealize Operations Manager User Guide (Version 1.0.139 with Purity 4.9.x or higher) Sunday, November 27, 2016 16:13 Pure Storage FlashArray Management
Table of Contents HOL-1703-SDC-4
 Table of Contents Lab Overview - - VMware NSX: Installation and Configuration...2 Lab Guidance... 3 Module 1 - NSX Manager Installation and Configuration (15 Minutes)... 6 Introduction... 7 Hands-on Labs
Table of Contents. VMware AirWatch: Technology Partner Integration
 Table of Contents Lab Overview - HOL-1857-08-UEM - Workspace ONE UEM - Technology Partner Integration... 2 Lab Guidance... 3 Module 1 - F5 Integration with Workspace ONE UEM (30 min)... 9 Introduction...
VMware vrealize Operations for Horizon Administration
 VMware vrealize Operations for Horizon Administration vrealize Operations for Horizon 6.3 This document supports the version of each product listed and supports all subsequent versions until the document
vcenter Hyperic Monitoring and Management Guide
 vcenter Hyperic Monitoring and Management Guide vcenter Hyperic 5.8 This document supports the version of each product listed and supports all subsequent versions until the document is replaced by a new
Table of Contents HOL-SDC-1415
 Table of Contents Lab Overview - - IT Outcomes Security Controls Native to Infrastructure. 2 Lab Guidance... 3 Module 1 - Policy-Based Compliance... 5 Introduction... 6 Manage vcenter Server Virtual Machines...
vrealize Operations Management Pack for NSX for vsphere 3.5.0
 vrealize Operations Management Pack for NSX for vsphere 3.5.0 This document supports the version of each product listed and supports all subsequent versions until the document is replaced by a new edition.
Table of Contents HOL CMP
 Table of Contents Lab Overview - - vrealize Suite Standard: Automated, Proactive Management... 2 Lab Guidance... 3 Module 1 - Automated workload placement and predictive DRS (30 minutes)...9 Workload Balancing
Centralized Log Hosting Manual for User
 Centralized Log Hosting Manual for User English Version 1.0 Page 1 of 31 Table of Contents 1 WELCOME...3 2 WAYS TO ACCESS CENTRALIZED LOG HOSTING PAGE...4 3 YOUR APPS IN KSC CENTRALIZED LOG HOSTING WEB...5
VMware vrealize Operations Federation Management Pack 1.0. vrealize Operations Manager
 VMware vrealize Operations Federation Management Pack 1.0 vrealize Operations Manager VMware vrealize Operations Federation Management Pack 1.0 You can find the most up-to-date technical documentation
VMware AirWatch - Workspace ONE, Single Sign-on and VMware Identity Manager
 VMware AirWatch - Workspace ONE, Single Sign-on and VMware Identity Table of Contents Lab Overview - HOL-1857-03-UEM - Workspace ONE UEM with App & Access Management... 2 Lab Guidance... 3 Module 1 - Workspace
Administering vrealize Log Insight. April 12, 2018 vrealize Log Insight 4.6
 Administering vrealize Log Insight April 12, 2018 4.6 You can find the most up-to-date technical documentation on the VMware website at: https://docs.vmware.com/ If you have comments about this documentation,
vrealize Suite Lifecycle Manager 1.1 Installation, Upgrade, and Management vrealize Suite 2017
 vrealize Suite Lifecycle Manager 1.1 Installation, Upgrade, and Management vrealize Suite 2017 You can find the most up-to-date technical documentation on the VMware website at: https://docs.vmware.com/
VMware vrealize Operations for Horizon Administration
 VMware vrealize Operations for Horizon Administration vrealize Operations for Horizon 6.2 This document supports the version of each product listed and supports all subsequent versions until the document
vrealize Operations Manager User Guide Modified on 17 AUG 2017 vrealize Operations Manager 6.6
 vrealize Operations Manager User Guide Modified on 17 AUG 2017 vrealize Operations Manager 6.6 vrealize Operations Manager User Guide You can find the most up-to-date technical documentation on the VMware
Table of Contents HOL CMP
 Table of Contents Lab Overview - - vrealize Orchestrator - Advanced... 2 Lab Guidance... 3 Module 1 - Creating Advanced vrealize Orchestrator Workflows (45 min)...9 Introduction... 10 Prompting User Input
vcenter Operations Manager for Horizon View Administration
 vcenter Operations Manager for Horizon View Administration vcenter Operations Manager for Horizon View 1.5 vcenter Operations Manager for Horizon View 1.5.1 This document supports the version of each product
Azure 209x Practical Exercises Overview
 Azure 209x Practical Exercises Overview This course includes optional exercises where you can try out the techniques demonstrated in the course for yourself. This guide lists the steps for the individual
VMware vrealize Log Insight Getting Started Guide
 VMware vrealize Log Insight Getting Started Guide vrealize Log Insight 3.3 This document supports the version of each product listed and supports all subsequent versions until the document is replaced
Using the Horizon vrealize Orchestrator Plug-In
 Using the Horizon vrealize Orchestrator Plug-In VMware Horizon 6 version 6.2.3, VMware Horizon 7 versions 7.0.3 and later Modified on 4 JAN 2018 VMware Horizon 7 7.4 You can find the most up-to-date technical
vfabric Hyperic Monitoring and Management
 vfabric Hyperic Monitoring and Management VMware vfabric Hyperic 5.0 This document supports the version of each product listed and supports all subsequent versions until the document is replaced by a new
vrealize Operations Manager User Guide 11 OCT 2018 vrealize Operations Manager 7.0
 vrealize Operations Manager User Guide 11 OCT 2018 vrealize Operations Manager 7.0 You can find the most up-to-date technical documentation on the VMware website at: https://docs.vmware.com/ If you have
NetScaler Analysis and Reporting. Goliath for NetScaler Installation Guide v4.0 For Deployment on VMware ESX/ESXi
 NetScaler Analysis and Reporting Goliath for NetScaler Installation Guide v4.0 For Deployment on VMware ESX/ESXi (v4.0) Document Date: October 2016 www.goliathtechnologies.com 1 Legal Notices Goliath for
Netwrix Auditor for SQL Server
 Netwrix Auditor for SQL Server Quick-Start Guide Version: 9.5 10/25/2017 Legal Notice The information in this publication is furnished for information use only, and does not constitute a commitment from
VMWARE VREALIZE OPERATIONS MANAGEMENT PACK FOR. Nagios. User Guide
 VMWARE VREALIZE OPERATIONS MANAGEMENT PACK FOR Nagios User Guide TABLE OF CONTENTS 1. Purpose...3 2. Introduction to the Management Pack...3 2.1 How the Management Pack Collects Data...3 2.2 Data the Management
Eloqua Insight Intro Analyzer User Guide
 Eloqua Insight Intro Analyzer User Guide Table of Contents About the Course Materials... 4 Introduction to Eloqua Insight for Analyzer Users... 13 Introduction to Eloqua Insight... 13 Eloqua Insight Home
vrealize Operations Management Pack for vsan 1.0 Guide
 vrealize Operations Management Pack for vsan 1.0 Guide This document supports the version of each product listed and supports all subsequent versions until the document is replaced by a new edition. To
Using the vrealize Orchestrator Operations Client. vrealize Orchestrator 7.5
 Using the vrealize Orchestrator Operations Client vrealize Orchestrator 7.5 You can find the most up-to-date technical documentation on the VMware website at: https://docs.vmware.com/ If you have comments
vrealize Operations Manager User Guide
 vrealize Operations Manager User Guide vrealize Operations Manager 6.5 This document supports the version of each product listed and supports all subsequent versions until the document is replaced by a
BIG-IP Analytics: Implementations. Version 13.1
 BIG-IP Analytics: Implementations Version 13.1 Table of Contents Table of Contents Setting Up Application Statistics Collection...5 What is Analytics?...5 About HTTP Analytics profiles... 5 Overview:
vrealize Suite Lifecycle Manager 1.0 Installation and Management vrealize Suite 2017
 vrealize Suite Lifecycle Manager 1.0 Installation and Management vrealize Suite 2017 vrealize Suite Lifecycle Manager 1.0 Installation and Management You can find the most up-to-date technical documentation
vrealize Operations Manager User Guide
 vrealize Operations Manager User Guide vrealize Operations Manager 6.2 This document supports the version of each product listed and supports all subsequent versions until the document is replaced by a
Windows Intune Trial Guide Getting the most from your Windows Intune trial. Simplify PC management. Amplify productivity.
 Windows Intune Trial Guide Getting the most from your Windows Intune trial. Simplify PC management. Amplify productivity. CONTENTS 2 Overview 2 Trial Setup 3 Getting Started with the Administration Console
VMware vcenter Log Insight Administration Guide
 VMware vcenter Log Insight Administration Guide vcenter Log Insight 2.0 This document supports the version of each product listed and supports all subsequent versions until the document is replaced by
Veriato Recon / 360. Version 9.0.3
 Veriato Recon / 360 Version 9.0.3 1/3/2018 Upgrade Guide January 3, 2018 Table of Contents Before You Begin... 1 What's New... 1 How the System Works... 1 Upgrade Support... 6 Update Antivirus Exclusions...
Deploying VMware Identity Manager in the DMZ. JULY 2018 VMware Identity Manager 3.2
 Deploying VMware Identity Manager in the DMZ JULY 2018 VMware Identity Manager 3.2 You can find the most up-to-date technical documentation on the VMware website at: https://docs.vmware.com/ If you have
vcenter Operations Management Pack for NSX-vSphere
 vcenter Operations Management Pack for NSX-vSphere vcenter Operations Manager 5.8 This document supports the version of each product listed and supports all subsequent versions until the document is replaced
vcenter Operations Manager 5.8 (vcops)
") vcenter Operations Manager 5.8 (vcops) Firstly what is vcenter Operations Manager, also known as vcops? VMware describe it as follows.. "vcenter Operations Manager (vcops) automates operations management
vcenter Operations Manager 5.8 (vcops) Firstly what is vcenter Operations Manager, also known as vcops? VMware describe it as follows.. "vcenter Operations Manager (vcops) automates operations management
CloudHealth. AWS and Azure On-Boarding
 CloudHealth AWS and Azure On-Boarding Contents 1. Enabling AWS Accounts... 3 1.1 Setup Usage & Billing Reports... 3 1.2 Setting Up a Read-Only IAM Role... 3 1.3 CloudTrail Setup... 5 1.4 Cost and Usage
VMware vrealize Operations for Horizon Administration. 20 SEP 2018 VMware vrealize Operations for Horizon 6.6
 VMware vrealize Operations for Horizon Administration 20 SEP 2018 VMware vrealize Operations for Horizon 6.6 You can find the most up-to-date technical documentation on the VMware website at: https://docs.vmware.com/
VMware vrealize Operations for Horizon Administration. Modified on 3 JUL 2018 VMware vrealize Operations for Horizon 6.4
 VMware vrealize Operations for Horizon Administration Modified on 3 JUL 2018 VMware vrealize Operations for Horizon 6.4 You can find the most up-to-date technical documentation on the VMware website at:
vrealize Operations Manager Customization and Administration Guide vrealize Operations Manager 6.4
 vrealize Operations Manager Customization and Administration Guide vrealize Operations Manager 6.4 vrealize Operations Manager Customization and Administration Guide You can find the most up-to-date technical
Disclaimer This presentation may contain product features that are currently under development. This overview of new technology represents no commitme
 MMC1532BE Using VMware NSX Cloud for Enhanced Networking and Security for AWS Native Workloads Percy Wadia Amol Tipnis VMworld 2017 Content: Not for publication #VMworld #MMC1532BE Disclaimer This presentation
Connection Broker Advanced Connections Management for Multi-Cloud Environments
 Connection Broker Advanced Connections Management for Multi-Cloud Environments Using Leostream with the VMware Horizon View Direct- Connection Plug-in Version 8.2 December 2017 Contacting Leostream Leostream
Hands-on Lab Session 9909 Introduction to Application Performance Management: Monitoring. Timothy Burris, Cloud Adoption & Technical Enablement
 Hands-on Lab Session 9909 Introduction to Application Performance Management: Monitoring Timothy Burris, Cloud Adoption & Technical Enablement Copyright IBM Corporation 2017 IBM, the IBM logo and ibm.com
vrealize Operations Management Pack for OpenStack 5.0
 vrealize Operations Management Pack for 5.0 You can find the most up-to-date technical documentation on the VMware website at: https://docs.vmware.com/ If you have comments about this documentation, submit
VMware vrealize Operations for Horizon Administration
 VMware vrealize Operations for Horizon Administration vrealize Operations for Horizon 6.4 vrealize Operations Manager 6.4 This document supports the version of each product listed and supports all subsequent
vrealize Operations Management Pack for NSX for Multi-Hypervisor
 vrealize Operations Management Pack for This document supports the version of each product listed and supports all subsequent versions until the document is replaced by a new edition. To check for more
BIG-IP Analytics: Implementations. Version 12.1
 BIG-IP Analytics: Implementations Version 12.1 Table of Contents Table of Contents Setting Up Application Statistics Collection...5 What is Analytics?...5 About HTTP Analytics profiles...5 Overview: Collecting
Goliath Performance Monitor v11.7 POC Install Guide
 Goliath Performance Monitor v11.7 POC Install Guide Goliath Performance Monitor Proof of Concept Limitations Goliath Performance Monitor Proof of Concepts (POC) will be limited to monitoring 5 Hypervisor
VMware Validated Design Monitoring and Alerting Guide
 VMware Validated Design Monitoring and Alerting Guide VMware Validated Design for Software- Defined Data Center 2.0 This document supports the version of each product listed and supports all subsequent
Workspace Administrator Help File
 Workspace Administrator Help File Table of Contents HotDocs Workspace Help File... 1 Getting Started with Workspace... 3 What is HotDocs Workspace?... 3 Getting Started with Workspace... 3 To access Workspace...
Deploying VMware Identity Manager in the DMZ. SEPT 2018 VMware Identity Manager 3.3
 Deploying VMware Identity Manager in the DMZ SEPT 2018 VMware Identity Manager 3.3 You can find the most up-to-date technical documentation on the VMware website at: https://docs.vmware.com/ If you have
Administering vrealize Log Insight. 12-OCT-2017 vrealize Log Insight 4.5
 Administering vrealize Log Insight 12-OCT-2017 4.5 You can find the most up-to-date technical documentation on the VMware website at: https://docs.vmware.com/ If you have comments about this documentation,
Administering vrealize Log Insight. 05-SEP-2017 vrealize Log Insight 4.3
 Administering vrealize Log Insight 05-SEP-2017 4.3 You can find the most up-to-date technical documentation on the VMware website at: https://docs.vmware.com/ If you have comments about this documentation,
Understanding the Relationship with Domain Managers
 4 CHAPTER Understanding the Relationship with Domain Managers Prime Central for HCS reports the events generated by underlying domain managers. Domain managers may also discover topology and relationships
Colligo Engage Outlook App 7.1. Offline Mode - User Guide
 Colligo Engage Outlook App 7.1 Offline Mode - User Guide Contents Colligo Engage Outlook App 1 Benefits 1 Key Features 1 Platforms Supported 1 Installing and Activating Colligo Engage Outlook App 3 Checking
vrealize Operations Management Pack for NSX for vsphere Release Notes
 vrealize Operations Management Pack for NSX for vsphere 3.1.1 Release Notes Build: 4247401 Last document update: 24 August 2016 Contents: Upgrading from the Management Pack for NSX for vsphere 2.0 What's
Cisco Unified Serviceability
 Cisco Unified Serviceability Introduction, page 1 Installation, page 5 Introduction This document uses the following abbreviations to identify administration differences for these Cisco products: Unified
Secure Web Appliance. Basic Usage Guide
 Secure Web Appliance Basic Usage Guide Table of Contents 1. Introduction... 1 1.1. About CYAN Secure Web Appliance... 1 1.2. About this Manual... 1 1.2.1. Document Conventions... 1 2. Description of the
Proofpoint Threat Response
 Proofpoint Threat Response Threat Response Auto Pull (TRAP) - Installation Guide Proofpoint, Inc. 892 Ross Drive Sunnyvale, CA 94089 United States Tel +1 408 517 4710 www.proofpoint.com Copyright Notice
Learning vrealize Orchestrator in action V M U G L A B
 Learning vrealize Orchestrator in action V M U G L A B Lab Learning vrealize Orchestrator in action Code examples If you don t feel like typing the code you can download it from the webserver running on
USER GUIDE Summer 2015
 USER GUIDE Summer 2015 Copyright and Disclaimer This document, as well as the software described in it, is furnished under license of the Instant Technologies Software Evaluation Agreement and may be used
Introduction to Virtualization
 Introduction to Virtualization Module 2 You Are Here Course Introduction Introduction to Virtualization Creating Virtual Machines VMware vcenter Server Configuring and Managing Virtual Networks Configuring
Runecast Analyzer User Guide
 Runecast Analyzer User Guide V1.0 Copyright 2014-2017 Runecast Solutions Ltd. All rights reserved. 2 P a g e Contents 1 Installation and Setup... 5 1.1 System requirements... 5 1.2 Deployment... 6 1.3
VMware Validated Design Monitoring and Alerting Guide
 VMware Validated Design Monitoring and Alerting Guide VMware Validated Design for Software- Defined Data Center 3.0 This document supports the version of each product listed and supports all subsequent
NetBackup 7.6 Replication Director A Hands On Experience
 NetBackup 7.6 Replication Director A Hands On Experience Description Through this hands on lab you can test drive Replication Director and experience for yourself this easy to use, powerful feature. Once