CIS 611: ENTERPRISE DATABASE AND DATA WAREHOUSING. Project: Multidimensional OLAP Cube using Adventure Works Data Warehouse
|
|
|
- Mervyn Stokes
- 5 years ago
- Views:
Transcription
1 CIS 611: ENTERPRISE DATABASE AND DATA WAREHOUSING Project: Multidimensional OLAP Cube using Adventure Works Data Warehouse
2 Overview: A data warehouse is a centralized repository that stores data from multiple sources and converts those data into a cube/multidimensional data, which are very efficient for querying and analysing the data. This Multidimensional cube has two uses such as OLAP and Data Mining which are two technologies that are been used for Business Intelligence. OLAP database are divided into cubes (depending on the requirement, per se: user can keep entire database in a single cube, or they can keep each record in per cube like financial data, sales, production, etc like that). Using this it is used to analyse the data and predict the future based on the existing data. The data s that are store in the cube are all pre-aggregated, so even if it retrieves millions of information from the database, it will still be efficient and fast. Likewise, Data mining will also do prediction by analysing the data and generates who all are the possible buyers. This prediction is done by using few algorithms such as Microsoft clustering, Microsoft Decision Trees, Microsoft Linear Regression, Microsoft Linear Regression, Microsoft Naïve Bayes, Microsoft Time Series, Microsoft Sequence Clustering, Microsoft Logistic Regression (These are some most commonly and popular data mining algorithms used for analysing data and predicting data). Tools required: 1. Microsoft SQL Server 2016 or latest 2. Microsoft SQL Server Management Studio 2017 or latest 3. Microsoft Visual Studio SSDT 2017 or latest The database used in this project is Adventure Works 2014 (Data warehouse). 1. Adventure Works Database: This is a fictional multinational bicycle company, with their headquarters located in Bothell, Washington and consists around 300 employees, 29 as sales representatives. The company s sales are done via two methods (i). Online sales and, (ii). Reseller sales. The company mainly focuses on United States, United Kingdom, Canada, Australia, France (Europe) and few more places. The products that are sold by this company are: o Bikes - They have many bike types but their preferences on bike products are narrowed down to 3 bikes (Mountain, Road and, Touring) based sales. o Clothing The clothing products that are sold are short, jerseys, socks, etc. o Components They sell all the components that are required for repairing and spares for their manufactured bikes only. o Accessories They sell products like bike stand, rack stand, peddles, handle bar rods, etc. The database contains all the details relating to sales, production, geography, etc. The sales database contains more information like mode of sales: internet or reseller. We can analyse the sales based on the Geography (country, city, state, region), Promotions (reseller, old products, excess products, no discount, etc), etc.
 \MSSQL\Backup\ Then Open SQL Server and connect to Database Engine.")

3 2. Build Database for Data mining, Multidimensional: Firstly, we will need DW (Data warehouse) database. To get the database that is used here: 1. Extract the downloaded database to C:\Program Files\Microsoft SQL Server\MSSQL13. (username) \MSSQL\Backup\ Then Open SQL Server and connect to Database Engine. Now, right click on database engine and select restore option and in that go to the specified path where we stored/saved the extracted file. Or, you can use the query to import the database: USE [master] RESTORE DATABASE [AdventureWorksDW2014] FROM DISK = N'C:\Program Files\Microsoft SQL Server\MSSQL13.(username) \MSSQL\Backup\AdventureWorksDW2014.bak' WITH FILE = 1, NOUNLOAD, STATS = 5 GO 3. Building Cube: 3.1) Open Visual studio SSDT, click new project -> new project. Then, in new project in installed look for Business Intelligence and in that select Analysis Services Multidimensional and Data Mining and, give any name. After clicking, it will look like this.


4 3.2) Data Source: Data source is used to import data from multiple sources and store it. Use the data s stored here we will build the cube. Steps to create data source: 1. Right click on data source and click new, then click next on that page. 2. In this page Click create a data source based on an existing or new creation (if you use it for the first time), now a dialog box like this pop up. In this pop up, under server name: write your server name mentioned from SQL server or you can just keep a. And keep authentication to windows then click Test Connection which will show if it was success or not.


5 After this is done, next important thing is to select the database that you want to use. Then click ok.


6 Impersonation Information will pop up in that select Use a specific Windows user name and password, in that type your windows ID and password then click next Then give data source a name and click finish. 2.3) Data Source View:

7 Now right click on data source view and click new Data source view, then click next on the page that that pops up. In this it will show relational data sources that are available from data source, select the appropriate database and click next. Then a new page called as select tables and views will come. Select necessary tables but I have imported all the data and click ok. In the next page give a name and finish it.
 Cube: Star Schema: This is the simplest way to see how each table to related to other tables and by which column.")
8 Once it is done, a star schema will be formed where it will point to the relationships between each table. Star Schema, Fact Tables and Dimension Tables: 3.4) Cube: Star Schema: This is the simplest way to see how each table to related to other tables and by which column. It is called as star schema as the table in centre points to other tables gives a look like star. Fact Table: It contains pre-aggregated data (especially with numeric data, and fact table is otherwise also known as Measures.) Dimension table: This contains all kinds of data in it, but it does not have pre-aggregated data for numeric like Fact Table. This table allows the user to create hierarchy for each table as per the requirement. OLAP Cube is used to storage MDX (Multidimensional) data, by using this we will analyse the data and predic the data patterns. Steps for Building and Deploying a Cube:

9 Right click on the cube and select New Cube and a wizard pops up in that click next. Select Creation Method: In this cube select Use existing table and click next. Select Measures Group Tables: Measures is not but data that are used for calculation and in this process, it will collect all the data and pre-aggregate it. -> Select data that should be selected, or you can also click suggest (by default, it will select all the tables that contains numeric data type fields.) If it missed any data that needs to be measured, we can select that or go with that. Select Measures: By default, everything will be selected. Just click Next. Select New Dimensions: By default, all the dimension tables will be select. Just click next.


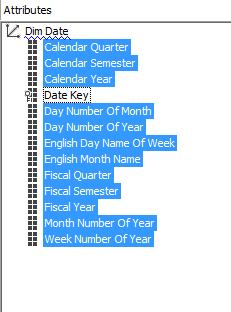
10 Completing the Wizard: Give the cube a name and click finish. After it is completed, this is how it will look. Creating Hierarchies: In dimensions, double Dim Date.dim it will open a new tab like this: In the right most column Data Source View, select dates that are required. (I have selected everything in that except French and
11 Spanish related and FullDateAlternateKey) After selecting the data, drag and drop them in Attributes.
12

13 Now create hierarchies using attributes, select data from attributes and drop in hierarchy column. This will create a new table like this. In that rename the hierarchy, how it is required. Now, rename English month name to month, so it is easier to understand. Attention symbol next to calendar is seen because it does not have any relationship within the hierarchy created. To create it, go to Attribute Relationships you will see like this In this, we can see that data key is hierarchy for everything that is the reason for us to get the attention symbol. Now what we will do is,
14 select the first key and point it to the next. Point it like this. Once this is done Click save and a dialog box will pop us, click proceed. Follow this procedure for everything and create hierarchies. Deploy the Cube: After clicking on save all, go to Solution Explorer, right click the project name (AdventureWorksDW2014) and select build first and see if you get any error or else it will say it is succeeded. Then, right click the project name again and deploy it now.
. To process.., right click on the project name and click process. While deployment, we will get two types of error: 1.")
15 If you are editing in Dimensions after the deployment, you should not deploy it again, without doing process (in case you forget to do so, while deploying even it will ask: if you want to process, click proceed for it process.). To process.., right click on the project name and click process. While deployment, we will get two types of error: 1. Security: Enter correct windows name and password, if it is correct then it will work. If it was not given at the time of creating follow then follow this: Double-click on data source

16 In this, click on Impersonation Information: In that select windows authentication and then enter the details. 2. SQL SERVER Server Agent is turned off. To Turn it on by going to the database in SQL Server Management Studio and connect it, then in the Object Explorer open click the + then, it will show up like this.


17 Right click on, SQL Server Agent and click start. Then a pop like this will come, click YES in it. If you deploy it now, then it will get deployed. Now open the SQL Server Management Studio and before connecting the database to database engine, click on database engine a drop-down list will come in that select Analysis service and then click connect.

![Show Product wise sales by both internet sales amount and Reseller Sales amount for the fiscal quarter and month/ year. Query: SELECT NON EMPTY {[Measures].](/docs-images/89/98088348/images/18-1.jpg "[Internet Sales Amount],[Measures].[Reseller Sales Amount], [Measures].[Sales Amount]} on columns, non empty crossjoin ([Product].[Category].[Category],[Date].[Fiscal Quarter of Year].")
18 4. MDX Querying: After having connected the server type with Analysis Services. Go to Object Explorer, in that click plus symbol on Databases and select the deployed database. Now right click on the deployed database and go to New Query -> MDX. This is how it will look: Now we will do the prediction using MDX Queries: 1. Show Product wise sales by both internet sales amount and Reseller Sales amount for the fiscal quarter and month/ year. Query: SELECT NON EMPTY {[Measures].[Internet Sales Amount],[Measures].[Reseller Sales Amount], [Measures].[Sales Amount]} on columns, non empty crossjoin ([Product].[Category].[Category],[Date].[Fiscal Quarter of Year].[Fiscal Quarter of Year],[Date].[Calendar].[Month]) on rows from [Adventure Works]; Output:

19 Pivot Chart: $60,000, $50,000, $40,000, $30,000, $20,000, Reseller Sales Amount Internet Sales Amount $10,000, $0.00 Australia Canada France Germany United Kingdom United States Prediction: We can see the highest Promotional sales were reseller sales, assuming this we can add more products for Sale in reseller sales than on internet sales. (Hint: normally we can not add more tables with different dimension, so if we can use crossjoin to add multiple tables)
20 2. Show the cities in United States where the total sales amount is more than (5 Million) for all the product. (Using VisualTotals and without VisualTotals) Query: select [Geography].[City].[City] on columns, order(visualtotals (filter([product].[category].members, [Measures].[Sales Amount] > )),[Measures].[Sales Amount], basc) on rows from [Adventure Works] where [Geography].[Country].&[United States]; Output: Without VisualTotals:
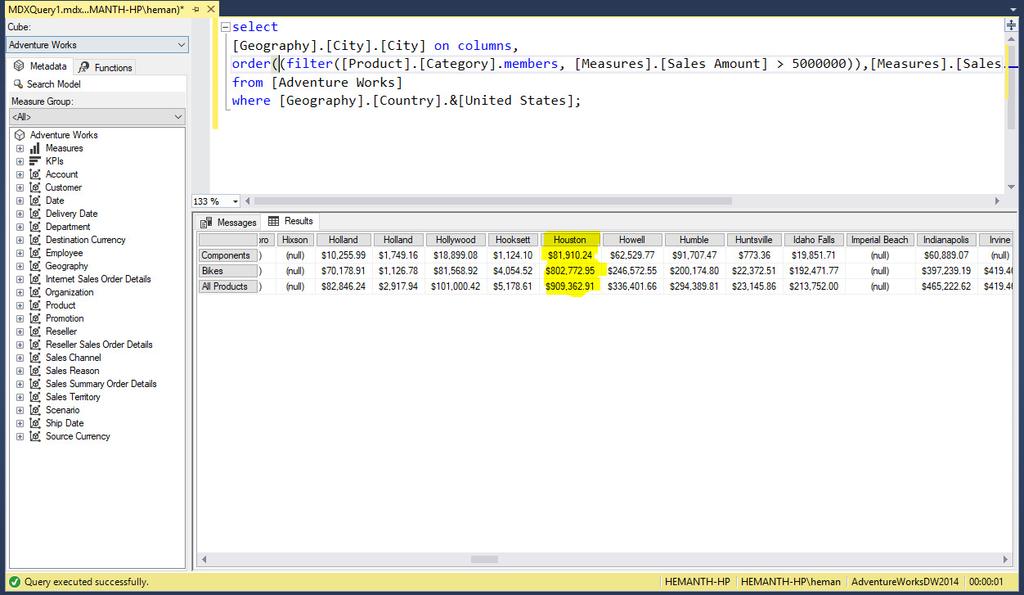

21 Using VisualTotals:
22 Prediction: Houston had the highest sales and will also have the highest sales for the next year. (Hint: Without visualtotals-> When we filter the data and list hets filtered and displays list that meets our requirements and the final result/value will not match the value that because the total is not calculated as it is listed, it fetches the value from cube where all the details are pre-aggregated. Using VisualTotals-> In this It calculates the final result and displays.) 3. What is the total reseller order count and reseller amount for the products (Chains, Breaks, Crank set, Handle Bars, Road Bikes, Pumps, Locks, Helmets, Cleaners, Bottles ad Cages, Bike Stand and Racks), with promotional offers such (i). Seasonal Discount, (ii). Excess Inventory,, where the customer is Male, Year (2012,2013,2014) in all State-Province. Query: SELECT NON EMPTY {[Measures].[Reseller Order Count],[Measures].[Reseller Sales Amount]} ON COLUMNS, NON EMPTY {([Date].[Calendar Year].[Calendar Year].ALLMEMBERS,[Geography].[Geography].[State- Province].ALLMEMBERS)}ON ROWS FROM (SELECT ({[Promotion].[Promotion Type].&[Seasonal Discount],[Promotion].[Promotion Type].&[Excess Inventory]}) ON COLUMNS FROM (SELECT ({[Product].[Product Categories].[Subcategory].&[26],[Product].[Product Categories].[Subcategory].&[27],[Product].[Product Categories].[Subcategory].&[29],[Product].[Product Categories].[Subcategory].&[34],[Product].[Product Categories].[Subcategory].&[36],[Product].[Product Categories].[Subcategory].&[2],[Product].[Product Categories].[Subcategory].&[31],[Product].[Product Categories].[Subcategory].&[28],[Product].[Product Categories].[Subcategory].&[4],[Product].[Product Categories].[Subcategory].&[8],[Product].[Product Categories].[Subcategory].&[6],[Product].[Product Categories].[Subcategory].&[7]}) ON COLUMNS FROM (SELECT ({[Customer].[Gender].&[M]}) ON COLUMNS FROM (SELECT
![( {[Date].[Calendar Year].&[2014],[Date].[Calendar Year].&[2013],[Date].](/docs-images/89/98088348/images/23-0.jpg "[Calendar Year].")
23 ( {[Date].[Calendar Year].&[2014],[Date].[Calendar Year].&[2013],[Date].[Calendar Year].&[2012]} ) ON COLUMNS FROM [Adventure Works]) ) ) ) Output:

24 Prediction: California has the highest reseller sales along with promotions, where men has bought bike along with multiple accessories and components, based on this we can that California only will have highest reseller sales, so we can provide them more stock during that offer.
25 References: Create tables and followed procedure from this website: Code Project: First-Time ServerAnalysis-Serv
Implementing a Data Warehouse with SQL Server 2014
 Training Handbook Implementing a Data Warehouse with SQL Server 2014 Some elements of this workshop are subject to change. This workshop is for informational purposes only. Module 2: Creating Multidimensional
Designing and Building a Data Mining Project with Cube and OLAP
 Designing and Building a Data Mining Project with Cube and OLAP Project Description Buding a Business Analytic Data Mining Model using Microsoft BI Data Mining Tool and Data Warehouse and OLAP Cubes. Preparation
SQL Server Analysis Services
 DataBase and Data Mining Group of DataBase and Data Mining Group of Database and data mining group, SQL Server 2005 Analysis Services SQL Server 2005 Analysis Services - 1 Analysis Services Database and
In this task, you specify formatting properties for the currency and percentage measures in the Analysis Services Tutorial cube.
 AL GHURAIR UNIVERSITY College of Computing CIS 303 Data Mining Week 3: Modifying Measures, Attributes and Hierarchies After defining, deploying, and processing your initial cube, and then reviewing dimension
Hands-On Lab. Lab: Developing BI Applications. Lab version: Last updated: 2/23/2011
 Hands-On Lab Lab: Developing BI Applications Lab version: 1.0.0 Last updated: 2/23/2011 CONTENTS OVERVIEW... 3 EXERCISE 1: USING THE CHARTING WEB PARTS... 5 EXERCISE 2: PERFORMING ANALYSIS WITH EXCEL AND
Building a Data Mining Model Using MS Data Integration Service for Business Intelligence
 Cleveland State University Building a Data Mining Model Using MS Data Integration Service for Business Intelligence SS Chung 14 Sunnie S Chung IST 734 Build a Data Mining Model using Data Warehouse and
SSAS 2008 Tutorial: Understanding Analysis Services
 Departamento de Engenharia Informática Sistemas de Informação e Bases de Dados Online Analytical Processing (OLAP) This tutorial has been copied from: https://www.accelebrate.com/sql_training/ssas_2008_tutorial.htm
Implementing and Maintaining Microsoft SQL Server 2008 Analysis Services
 Course 6234A: Implementing and Maintaining Microsoft SQL Server 2008 Analysis Services Course Details Course Outline Module 1: Introduction to Microsoft SQL Server Analysis Services This module introduces
Deccansoft Software Services Microsoft Silver Learning Partner. SSAS Syllabus
 Overview: Analysis Services enables you to analyze large quantities of data. With it, you can design, create, and manage multidimensional structures that contain detail and aggregated data from multiple
SQL Server 2005 Analysis Services
 atabase and ata Mining Group of atabase and ata Mining Group of atabase and ata Mining Group of atabase and ata Mining Group of atabase and ata Mining Group of atabase and ata Mining Group of SQL Server
BI4Dynamics Customization Manual
 BI4Dynamics NAV Customization Manual Page 1 BI4Dynamics Customization Manual Last update: August 2017 BI4Dynamics NAV version 5.6.0 Revision 2 BI4Dynamics NAV Customization Manual Page 2 1 SETTING UP INSTANCE...
COURSE 20466D: IMPLEMENTING DATA MODELS AND REPORTS WITH MICROSOFT SQL SERVER
 ABOUT THIS COURSE The focus of this five-day instructor-led course is on creating managed enterprise BI solutions. It describes how to implement multidimensional and tabular data models, deliver reports
Hands-On Lab. Developing BI Applications. Lab version: Last updated: 2/23/2011
 Hands-On Lab Developing BI Applications Lab version: 1.0.0 Last updated: 2/23/2011 CONTENTS OVERVIEW... 3 EXERCISE 1: USING THE CHART WEB PART... 4 Task 1 Add the Chart Web Part to the page... 4 Task 2
Getting Started enterprise 88. Oracle Warehouse Builder 11gR2: operational data warehouse. Extract, Transform, and Load data to
 Oracle Warehouse Builder 11gR2: Getting Started 2011 Extract, Transform, and Load data to operational data warehouse build a dynamic, Bob Griesemer 1 enterprise 88 orotessionol expertise distilled PUBLISHING
A Case Study Building Financial Report and Dashboard Using OBIEE Part I
 A Case Study Building Financial Report and Dashboard Using OBIEE Part I This is a 1 st document in the series of building financial reports and dashboard taking Essbase as Data Source. This document briefs
Lesson 3: Building a Market Basket Scenario (Intermediate Data Mining Tutorial)
") From this diagram, you can see that the aggregated mining model preserves the overall range and trends in values while minimizing the fluctuations in the individual data series. Conclusion You have learned
From this diagram, you can see that the aggregated mining model preserves the overall range and trends in values while minimizing the fluctuations in the individual data series. Conclusion You have learned
Implementing Data Models and Reports with Microsoft SQL Server Exam Summary Syllabus Questions
 70-466 Implementing Data Models and Reports with Microsoft SQL Server Exam Summary Syllabus Questions Table of Contents Introduction to 70-466 Exam on Implementing Data Models and Reports with Microsoft
20466C - Version: 1. Implementing Data Models and Reports with Microsoft SQL Server
 20466C - Version: 1 Implementing Data Models and Reports with Microsoft SQL Server Implementing Data Models and Reports with Microsoft SQL Server 20466C - Version: 1 5 days Course Description: The focus
Aggregating Knowledge in a Data Warehouse and Multidimensional Analysis
 Aggregating Knowledge in a Data Warehouse and Multidimensional Analysis Rafal Lukawiecki Strategic Consultant, Project Botticelli Ltd rafal@projectbotticelli.com Objectives Explain the basics of: 1. Data
Quality Gates User guide
 Quality Gates 3.3.5 User guide 06/2013 1 Table of Content 1 - Introduction... 4 2 - Navigation... 5 2.1 Navigation tool bar... 5 2.2 Navigation tree... 5 2.3 Folder Tree... 6 2.4 Test history... 7 3 -
6234A - Implementing and Maintaining Microsoft SQL Server 2008 Analysis Services
 6234A - Implementing and Maintaining Microsoft SQL Server 2008 Analysis Services Course Number: 6234A Course Length: 3 Days Course Overview This instructor-led course teaches students how to implement
IMPLEMENTING STATISTICAL DOMAIN DATABASES IN POLAND. OPPORTUNITIES AND THREATS. Central Statistical Office in Poland
 IMPLEMENTING STATISTICAL DOMAIN DATABASES IN POLAND. OPPORTUNITIES AND THREATS. Central Statistical Office in Poland Agenda 2 Background Current state The goal of the SDD Architecture Technologies Data
SAS Data Integration Studio 3.3. User s Guide
 SAS Data Integration Studio 3.3 User s Guide The correct bibliographic citation for this manual is as follows: SAS Institute Inc. 2006. SAS Data Integration Studio 3.3: User s Guide. Cary, NC: SAS Institute
Unit 7: Basics in MS Power BI for Excel 2013 M7-5: OLAP
 Unit 7: Basics in MS Power BI for Excel M7-5: OLAP Outline: Introduction Learning Objectives Content Exercise What is an OLAP Table Operations: Drill Down Operations: Roll Up Operations: Slice Operations:
Implementing Data Models and Reports with SQL Server 2014
 Course 20466D: Implementing Data Models and Reports with SQL Server 2014 Page 1 of 6 Implementing Data Models and Reports with SQL Server 2014 Course 20466D: 4 days; Instructor-Led Introduction The focus
UNIT
 UNIT 3.1 DATAWAREHOUSING UNIT 3 CHAPTER 1 1.Designing the Target Structure: Data warehouse design, Dimensional design, Cube and dimensions, Implementation of a dimensional model in a database, Relational
Implementing and Maintaining Microsoft SQL Server 2005 Analysis Services
 Implementing and Maintaining Microsoft SQL Server 2005 Analysis Services Introduction Elements of this syllabus are subject to change. This three-day instructor-led course teaches students how to implement
After completing this course, participants will be able to:
 Designing a Business Intelligence Solution by Using Microsoft SQL Server 2008 T h i s f i v e - d a y i n s t r u c t o r - l e d c o u r s e p r o v i d e s i n - d e p t h k n o w l e d g e o n d e s
4 Introduction to Web Intelligence
 4 Introduction to Web Intelligence Web Intelligence enables you to create documents for reporting, data analysis, and sharing with other users using the BI Launch Pad environment. Querying The required
An Overview of Data Warehousing and OLAP Technology
 An Overview of Data Warehousing and OLAP Technology CMPT 843 Karanjit Singh Tiwana 1 Intro and Architecture 2 What is Data Warehouse? Subject-oriented, integrated, time varying, non-volatile collection
Training 24x7 DBA Support Staffing. MCSA:SQL 2016 Business Intelligence Development. Implementing an SQL Data Warehouse. (40 Hours) Exam
 Exam") MCSA:SQL 2016 Business Intelligence Development Implementing an SQL Data Warehouse (40 Hours) Exam 70-767 Prerequisites At least 2 years experience of working with relational databases, including: Designing
MCSA:SQL 2016 Business Intelligence Development Implementing an SQL Data Warehouse (40 Hours) Exam 70-767 Prerequisites At least 2 years experience of working with relational databases, including: Designing
Getting Started Guide. ProClarity Analytics Platform 6. ProClarity Professional
 ProClarity Analytics Platform 6 ProClarity Professional Note about printing this PDF manual: For best quality printing results, please print from the version 6.0 Adobe Reader. Getting Started Guide Acknowledgements
Overview of Reporting in the Business Information Warehouse
 Overview of Reporting in the Business Information Warehouse Contents What Is the Business Information Warehouse?...2 Business Information Warehouse Architecture: An Overview...2 Business Information Warehouse
Matière : System décisionnel
 UNIVERSITÉ ANTONINE Faculté d ingénieurs en Informatique, Multimédia, Réseaux & Télécommunications Data Mining Implementation of Sequence Clustering Matière : System décisionnel Effectué par : NOM Prénom
DATA MINING TRANSACTION
 DATA MINING Data Mining is the process of extracting patterns from data. Data mining is seen as an increasingly important tool by modern business to transform data into an informational advantage. It is
Recently Updated Dumps from PassLeader with VCE and PDF (Question 1 - Question 15)
") Recently Updated 70-467 Dumps from PassLeader with VCE and PDF (Question 1 - Question 15) Valid 70-467 Dumps shared by PassLeader for Helping Passing 70-467 Exam! PassLeader now offer the newest 70-467
Recently Updated 70-467 Dumps from PassLeader with VCE and PDF (Question 1 - Question 15) Valid 70-467 Dumps shared by PassLeader for Helping Passing 70-467 Exam! PassLeader now offer the newest 70-467
Deltek Vision 7.1. Installation and Configuration Guide for Performance Management. (Analysis Cubes and Performance Dashboards)
") Deltek Vision 7.1 Installation and Configuration Guide for Performance (Analysis Cubes and Performance Dashboards) April 3, 2014 While Deltek has attempted to verify that the information in this document
Deltek Vision 7.1 Installation and Configuration Guide for Performance (Analysis Cubes and Performance Dashboards) April 3, 2014 While Deltek has attempted to verify that the information in this document
Reporting With SAP Crystal Reports
 Reporting With SAP Crystal Reports MOTIVATION This material is an introduction to how to develop report utilizing SAP Crystal Reports. It is aimed at students at universities, universities and other educational
Upgrade: Transition Your MCITP SQL Server 2005 BI Developer to MCITP SQL Server 2008 BI Developer
 Microsoft 70-455 Upgrade: Transition Your MCITP SQL Server 2005 BI Developer to MCITP SQL Server 2008 BI Developer Version: 5.0 QUESTION NO: 1 your computer. Now you use SQL Server 2008 to create a SQL
Basics of Dimensional Modeling
 Basics of Dimensional Modeling Data warehouse and OLAP tools are based on a dimensional data model. A dimensional model is based on dimensions, facts, cubes, and schemas such as star and snowflake. Dimension
SAS Web Report Studio 3.1
 SAS Web Report Studio 3.1 User s Guide SAS Documentation The correct bibliographic citation for this manual is as follows: SAS Institute Inc. 2006. SAS Web Report Studio 3.1: User s Guide. Cary, NC: SAS
Creating a target user and module
 The Warehouse Builder contains a number of objects, which we can use in designing our data warehouse, that are either relational or dimensional. OWB currently supports designing a target schema only in
Cube Designer User Guide SAP BusinessObjects Financial Consolidation, Cube Designer 10.0
 Cube Designer User Guide SAP BusinessObjects Financial Consolidation, Cube Designer 10.0 Copyright 2011 SAP AG. All rights reserved.sap, R/3, SAP NetWeaver, Duet, PartnerEdge, ByDesign, SAP BusinessObjects
DEVELOPING SQL DATA MODELS
 20768 - DEVELOPING SQL DATA MODELS CONTEÚDO PROGRAMÁTICO Module 1: Introduction to Business Intelligence and Data Modeling This module introduces key BI concepts and the Microsoft BI product suite. Introduction
exam.105q Microsoft Implementing Data Models and Reports with Microsoft SQL Server 2014
 70-466.exam.105q Number: 70-466 Passing Score: 800 Time Limit: 120 min File Version: 1 Microsoft 70-466 Implementing Data Models and Reports with Microsoft SQL Server 2014 Question Set 1 QUESTION 1 DRAG
SAMPLE. Preface xi 1 Introducting Microsoft Analysis Services 1
 contents Preface xi 1 Introducting Microsoft Analysis Services 1 1.1 What is Analysis Services 2005? 1 Introducing OLAP 2 Introducing Data Mining 4 Overview of SSAS 5 SSAS and Microsoft Business Intelligence
IDU0010 ERP,CRM ja DW süsteemid Loeng 5 DW concepts. Enn Õunapuu
 IDU0010 ERP,CRM ja DW süsteemid Loeng 5 DW concepts Enn Õunapuu enn.ounapuu@ttu.ee Content Oveall approach Dimensional model Tabular model Overall approach Data modeling is a discipline that has been practiced
1 Dulcian, Inc., 2001 All rights reserved. Oracle9i Data Warehouse Review. Agenda
 Agenda Oracle9i Warehouse Review Dulcian, Inc. Oracle9i Server OLAP Server Analytical SQL Mining ETL Infrastructure 9i Warehouse Builder Oracle 9i Server Overview E-Business Intelligence Platform 9i Server:
CertifyMe. CertifyMe
 CertifyMe Number: 070-452 Passing Score: 800 Time Limit: 120 min File Version: 8.0 http://www.gratisexam.com/ CertifyMe 070-452 Exam A QUESTION 1 You design a Business Intelligence (BI) solution by using
A Journey to Power BI
 A Journey to Power BI A Guide to use Self-service BI Leila Etaati 28/02/2015 Leila Etaati Our Sponsors AN ACP GROUP COMPANY 2 28/02/2015 Leila Etaati About Leila Etaati 10 years experience in SQL server
Jet Data Manager 2014 Product Enhancements
 Jet Data Manager 2014 Product Enhancements Table of Contents Overview of New Features... 3 New Standard Features in Jet Data Manager 2014... 3 Additional Features Available for Jet Data Manager 2014...
Microsoft SQL Server Training Course Catalogue. Learning Solutions
 Training Course Catalogue Learning Solutions Querying SQL Server 2000 with Transact-SQL Course No: MS2071 Two days Instructor-led-Classroom 2000 The goal of this course is to provide students with the
PASS4TEST. IT Certification Guaranteed, The Easy Way! We offer free update service for one year
 PASS4TEST IT Certification Guaranteed, The Easy Way! \ http://www.pass4test.com We offer free update service for one year Exam : BI0-130 Title : Cognos 8 BI Modeler Vendors : COGNOS Version : DEMO Get
HYPERION ESSBASE INITIAL EXERCISE
 DSV, KTH / SU PETIA WOHED IS5/2I1224 HYPERION ESSBASE 020417 HYPERION ESSBASE INITIAL EXERCISE In this exercise, you will learn the basic navigation in MS Excel as an interface tool to DB2 OLAP server.
Chapter 3. The Multidimensional Model: Basic Concepts. Introduction. The multidimensional model. The multidimensional model
 Chapter 3 The Multidimensional Model: Basic Concepts Introduction Multidimensional Model Multidimensional concepts Star Schema Representation Conceptual modeling using ER, UML Conceptual modeling using
Business Analytics in the Oracle 12.2 Database: Analytic Views. Event: BIWA 2017 Presenter: Dan Vlamis and Cathye Pendley Date: January 31, 2017
 Business Analytics in the Oracle 12.2 Database: Analytic Views Event: BIWA 2017 Presenter: Dan Vlamis and Cathye Pendley Date: January 31, 2017 Vlamis Software Solutions Vlamis Software founded in 1992
BI4Dynamics AX/NAV Integrate external data sources
 BI4Dynamics AX/NAV Last update: November 2018 Version: 2.1 Abbreviation used in this document: EDS: External Data Source(s) are data that are not a part of Microsoft Dynamics AX/NAV. It can come from any
OLAP Introduction and Overview
 1 CHAPTER 1 OLAP Introduction and Overview What Is OLAP? 1 Data Storage and Access 1 Benefits of OLAP 2 What Is a Cube? 2 Understanding the Cube Structure 3 What Is SAS OLAP Server? 3 About Cube Metadata
Development of an interface that allows MDX based data warehouse queries by less experienced users
 Development of an interface that allows MDX based data warehouse queries by less experienced users Mariana Duprat André Monat Escola Superior de Desenho Industrial 400 Introduction Data analysis is a fundamental
BUSINESS INTELLIGENCE. SSAS - SQL Server Analysis Services. Business Informatics Degree
 BUSINESS INTELLIGENCE SSAS - SQL Server Analysis Services Business Informatics Degree 2 BI Architecture SSAS: SQL Server Analysis Services 3 It is both an OLAP Server and a Data Mining Server Distinct
Venezuela: Teléfonos: / Colombia: Teléfonos:
 CONTENIDO PROGRAMÁTICO Moc 20761: Querying Data with Transact SQL Module 1: Introduction to Microsoft SQL Server This module introduces SQL Server, the versions of SQL Server, including cloud versions,
to-end Solution Using OWB and JDeveloper to Analyze Your Data Warehouse
 An End-to to-end Solution Using OWB and JDeveloper to Analyze Your Data Warehouse Presented at ODTUG 2003 Dan Vlamis dvlamis@vlamis.com Vlamis Software Solutions, Inc. (816) 781-2880 http://www.vlamis.com
InfoSphere Warehouse V9.5 Exam.
 IBM 000-719 InfoSphere Warehouse V9.5 Exam TYPE: DEMO http://www.examskey.com/000-719.html Examskey IBM 000-719 exam demo product is here for you to test the quality of the product. This IBM 000-719 demo
Module 2: Creating Multidimensional Analysis Solutions
 Module 2: Creating Multidimensional Analysis Solutions Overview Developing Analysis Services Solutions Creating Data Sources and Data Source Views Creating a Cube Lesson 1: Developing Analysis Services
Designing SQL Server 2012 Analysis Services Cubes using Samsclub_Star Dataset
 Designing SQL Server 2012 Analysis Services Cubes using Samsclub_Star Dataset Updated May 18, 2012 Edited by G. Davis (RMU) February 16, 2016 Using Microsoft s Business Intelligence Suite to Design Cubes
1. Attempt any two of the following: 10 a. State and justify the characteristics of a Data Warehouse with suitable examples.
 Instructions to the Examiners: 1. May the Examiners not look for exact words from the text book in the Answers. 2. May any valid example be accepted - example may or may not be from the text book 1. Attempt
Developing SQL Data Models
 Developing SQL Data Models 20768B; 3 Days; Instructor-led Course Description The focus of this 3-day instructor-led course is on creating managed enterprise BI solutions. It describes how to implement
Data Warehousing. Overview
 Data Warehousing Overview Basic Definitions Normalization Entity Relationship Diagrams (ERDs) Normal Forms Many to Many relationships Warehouse Considerations Dimension Tables Fact Tables Star Schema Snowflake
MICROSOFT EXAM QUESTIONS & ANSWERS
 MICROSOFT 70-466 EXAM QUESTIONS & ANSWERS Number: 70-466 Passing Score: 1000 Time Limit: 120 min File Version: 46.6 http://www.gratisexam.com/ MICROSOFT 70-466 EXAM QUESTIONS & ANSWERS Exam Name: Implementing
Accurate study guides, High passing rate! Testhorse provides update free of charge in one year!
 Accurate study guides, High passing rate! Testhorse provides update free of charge in one year! http://www.testhorse.com Exam : 70-467 Title : Designing Business Intelligence Solutions with Microsoft SQL
Partner Presentation Faster and Smarter Data Warehouses with Oracle OLAP 11g
 Partner Presentation Faster and Smarter Data Warehouses with Oracle OLAP 11g Vlamis Software Solutions, Inc. Founded in 1992 in Kansas City, Missouri Oracle Partner and reseller since 1995 Specializes
DATA WAREHOUSE EGCO321 DATABASE SYSTEMS KANAT POOLSAWASD DEPARTMENT OF COMPUTER ENGINEERING MAHIDOL UNIVERSITY
 DATA WAREHOUSE EGCO321 DATABASE SYSTEMS KANAT POOLSAWASD DEPARTMENT OF COMPUTER ENGINEERING MAHIDOL UNIVERSITY CHARACTERISTICS Data warehouse is a central repository for summarized and integrated data
OSR Administration 3.7 User Guide. Updated:
 OSR Administration 3.7 User Guide Updated: 2013-01-31 Copyright OneStop Reporting AS www.onestopreporting.com Table of Contents Introduction... 1 Who should read this manual... 1 What s included in this
Guide Users along Information Pathways and Surf through the Data
 Guide Users along Information Pathways and Surf through the Data Stephen Overton, Overton Technologies, LLC, Raleigh, NC ABSTRACT Business information can be consumed many ways using the SAS Enterprise
Convert Point of Sale Enterprise database to Point of Sale Professional database
 Convert Point of Sale Enterprise database to Point of Sale Professional database As Reckon has stopped releasing POS Enterprise from 2017 onwards, we have prepared the following guidance to help you convert
EXAMGOOD QUESTION & ANSWER. Accurate study guides High passing rate! Exam Good provides update free of charge in one year!
 EXAMGOOD QUESTION & ANSWER Exam Good provides update free of charge in one year! Accurate study guides High passing rate! http://www.examgood.com Exam : 70-460 Title : Transition Your MCITP: Business Intelligence
A case study to introduce Microsoft Data Mining in the database course
 A case study to introduce Microsoft Data Mining in the database course ABSTRACT Mohammad Dadashzadeh Oakland University The content of the database management systems course in the business curriculum
DATA MINING AND WAREHOUSING
 DATA MINING AND WAREHOUSING Qno Question Answer 1 Define data warehouse? Data warehouse is a subject oriented, integrated, time-variant, and nonvolatile collection of data that supports management's decision-making
Kyubit Business Intelligence OLAP analysis - User Manual
 Using OLAP analysis features of Kyubit Business Intelligence www.kyubit.com Kyubit Business Intelligence OLAP analysis - User Manual Using OLAP analysis features of Kyubit Business Intelligence 2017, All
Pentaho Aggregation Designer User Guide
 Pentaho Aggregation Designer User Guide This document is copyright 2012 Pentaho Corporation. No part may be reprinted without written permission from Pentaho Corporation. All trademarks are the property
The strategic advantage of OLAP and multidimensional analysis
 IBM Software Business Analytics Cognos Enterprise The strategic advantage of OLAP and multidimensional analysis 2 The strategic advantage of OLAP and multidimensional analysis Overview Online analytical
MICROSOFT BUSINESS INTELLIGENCE (MSBI: SSIS, SSRS and SSAS)
") MICROSOFT BUSINESS INTELLIGENCE (MSBI: SSIS, SSRS and SSAS) Microsoft's Business Intelligence (MSBI) Training with in-depth Practical approach towards SQL Server Integration Services, Reporting Services
MICROSOFT BUSINESS INTELLIGENCE (MSBI: SSIS, SSRS and SSAS) Microsoft's Business Intelligence (MSBI) Training with in-depth Practical approach towards SQL Server Integration Services, Reporting Services
Data warehouses Decision support The multidimensional model OLAP queries
 Data warehouses Decision support The multidimensional model OLAP queries Traditional DBMSs are used by organizations for maintaining data to record day to day operations On-line Transaction Processing
Business Intelligence Tutorial
 IBM DB2 Universal Database Business Intelligence Tutorial Version 7 IBM DB2 Universal Database Business Intelligence Tutorial Version 7 Before using this information and the product it supports, be sure
CS 1655 / Spring 2013! Secure Data Management and Web Applications
 CS 1655 / Spring 2013 Secure Data Management and Web Applications 03 Data Warehousing Alexandros Labrinidis University of Pittsburgh What is a Data Warehouse A data warehouse: archives information gathered
Open source business analytics. William D. Back Nicholas Goodman Julian Hyde MANNING SAMPLE CHAPTER
 Open source business analytics William D. Back Nicholas Goodman Julian Hyde SAMPLE CHAPTER MANNING Mondrian in Action by William D. Back Nicholas Goodman and Julian Hyde Chapter 2 Copyright 2014 Manning
Foundations of SQL Server 2008 R2 Business. Intelligence. Second Edition. Guy Fouche. Lynn Lang it. Apress*
 Foundations of SQL Server 2008 R2 Business Intelligence Second Edition Guy Fouche Lynn Lang it Apress* Contents at a Glance About the Authors About the Technical Reviewer Acknowledgments iv xiii xiv xv
Microsoft.Visualexams v by.saveq.70q
 Microsoft.Visualexams.70-467.v2013-12-07.by.saveq.70q Number: 70-467 Passing Score: 700 Time Limit: 1200 min File Version: 16.5 http://www.gratisexam.com/ Exam Code: 70-467 Exam Name: Designing Business
Visit our Web site at or call to learn about training classes that are added throughout the year.
 S a gee RPAc c pa ci nt e l l i ge nc e Ana l y s i s ST UDE NTWORKBOOK Notice This document and the Sage Accpac ERP software may be used only in accordance with the accompanying Sage Accpac ERP End User
Microsoft Developing SQL Data Models.
 Microsoft 70-768 Developing SQL Data Models https://killexams.com/pass4sure/exam-detail/70-768 QUESTION: 34 You are building a Microsoft SQL Server Analysis Services multidimensional model over a SQL Server
REPORTING AND QUERY TOOLS AND APPLICATIONS
 Tool Categories: REPORTING AND QUERY TOOLS AND APPLICATIONS There are five categories of decision support tools Reporting Managed query Executive information system OLAP Data Mining Reporting Tools Production
Data Warehousing. Jens Teubner, TU Dortmund Winter 2015/16. Jens Teubner Data Warehousing Winter 2015/16 1
 Jens Teubner Data Warehousing Winter 2015/16 1 Data Warehousing Jens Teubner, TU Dortmund jensteubner@cstu-dortmundde Winter 2015/16 Jens Teubner Data Warehousing Winter 2015/16 40 Part IV Modelling Your
Data Warehousing and OLAP
 Data Warehousing and OLAP INFO 330 Slides courtesy of Mirek Riedewald Motivation Large retailer Several databases: inventory, personnel, sales etc. High volume of updates Management requirements Efficient
Hyperion Interactive Reporting Reports & Dashboards Essentials
 Oracle University Contact Us: +27 (0)11 319-4111 Hyperion Interactive Reporting 11.1.1 Reports & Dashboards Essentials Duration: 5 Days What you will learn The first part of this course focuses on two
Using the Palladium Business Intelligence Functionality
 Using the Palladium Business Intelligence Functionality This document will assist in using Palladium s Business Intelligence Module. The function of the module is to allow you a view into your data with
SAS Information Map Studio 3.1: Tips and Techniques
 SAS Information Map Studio 3.1: Tips and Techniques The correct bibliographic citation for this manual is as follows: SAS Institute Inc. 2006. SAS Information Map Studio 3.1: Tips and Techniques. Cary,
Management Reports Centre. User Guide. Emmanuel Amekuedi
 Management Reports Centre User Guide Emmanuel Amekuedi Table of Contents Introduction... 3 Overview... 3 Key features... 4 Authentication methods... 4 System requirements... 5 Deployment options... 5 Getting
Project management integrated into Outlook
 Project management integrated into Outlook InLoox PM 7.x off-line operation An InLoox Whitepaper Published: November 2011 Copyright: 2011 InLoox GmbH. You can find up-to-date information at http://www.inloox.com
Page 1. Oracle9i OLAP. Agenda. Mary Rehus Sales Consultant Patrick Larkin Vice President, Oracle Consulting. Oracle Corporation. Business Intelligence
 Oracle9i OLAP A Scalable Web-Base Business Intelligence Platform Mary Rehus Sales Consultant Patrick Larkin Vice President, Oracle Consulting Agenda Business Intelligence Market Oracle9i OLAP Business
Implementing Data Models and Reports with Microsoft SQL Server 2012
 Implementing Data Models and Reports with Microsoft SQL Server 2012 Module 1: Introduction to Business Intelligence and Data Modeling Introduction to Business Intelligence The Microsoft Business Intelligence