DigiVis 500 Operations. Operators Manual
|
|
|
- Marilyn Singleton
- 5 years ago
- Views:
Transcription

1 DigiVis 500 Operations Operators Manual
2
3 DigiVis 500 Operations Operators Manual Version 1.0 SP1
4
5 NOTICE The information in this document is subject to change without notice and should not be construed as a commitment by ABB. ABB assumes no responsibility for any errors that may appear in this document. In no event shall ABB be liable for direct, indirect, special, incidental or consequential damages of any nature or kind arising from the use of this document, nor shall ABB be liable for incidental or consequential damages arising from use of any software or hardware described in this document. This document and parts thereof must not be reproduced or copied without written permission from ABB, and the contents thereof must not be imparted to a third party nor used for any unauthorized purpose. The software or hardware described in this document is furnished under a license and may be used, copied, or disclosed only in accordance with the terms of such license. Copyright 2012 ABB All rights reserved. Release: January 2012 Document number: 2PAA104346R0201 TRADEMARKS All rights to copyrights and trademarks reside with their respective owners.
6
7 2PAA104346R0201 Table of Contents 1 Table of Contents A About DigiVis 500 Operations...A-1 A 1 Visual Orientation Hints...A-5 A 2 General Hints for Operating DigiVis 500 Operations...A-6 B 1 Installing DigiVis 500 Operations...A-6 C Operating Philosophy...C-1 C 1 What is DigiVis 500 Operations?...C-5 C 2 Using DigiVis 500 Operations to Operate the Process...C-5 C 3 Structure of the User Interface in DigiVis 500 Operations...C-12 C 4 User Identification...C-17 C 5 Process Visualization...C-19 C 6 The DigiVis 500 Operations Menu: An Overview...C-23 C 7 Display Selection...C-40 D Messages...D-1 D 1 General Description Messages...D-5 D 2 Message Line...D-15 D 3 Message List...D-20 E Overview Display...E-1 E 1 General Description Overview Display...E-5 E 2 Calling up an Overview Display...E-5 E 3 Operation in the Overview Display...E-7 E 4 Symbols for Individual Display Types...E-9 F Group Display... F-1 F 1 General Description Group Display... F-5 F 2 Calling up the Group Display... F-6 F 3 Operating Procedures in the Group Display... F-7 G Graphic Display... G-1 G 1 General Description Graphic Display... G-5 G 2 Calling up a Graphic Display... G-6 G 3 Displaying a Graphic Display... G-8 G 4 Operating Procedures in the Graphic Display... G-9 G 5 Dynamic Display Elements... G-11 H Trend Display...H-1 H 1 General Description Trend Display...H-5 H 2 Calling up a Trend Display...H-8 H 3 Defining the Trend Display...H-10 H 4 Operations in the Trend Display...H-18 I Faceplates... I-1 I 1 General Description Faceplates... I-5 I 2 Calling up a Faceplate... I-7 I 3 Structure and Operation of Faceplates... I-9 I 4 Faceplates for AC500 Function Blocks... I-18 K Reports...K-1 K 1 General Description Reports...K-4 K 2 Calling up Reports...K-6 K 3 Operating...K-10 L Logs... L-1
8 Table of Contents 2 L 1 General Description - Logs... L-5 L 2 Calling up Logs... L-8 L 3 Operating... L-12 L 4 Operation Log... L-19 L 5 Signal Sequence Log... L-22 M Information Display... M-1 M 1 General Description Information Display... M-5 M 2 Calling up the Information Display... M-5 M 3 Operating Procedures in the Information Display... M-5 N WEB Display...N-1 N 1 General Description WEB Display...N-5 N 2 Calling up the WEB display...n-5 N 3 Operating Procedures in the WEB Display...N-7 V System Messages...V-1 W Glossary...W-1 2PAA104346R0201

9 A B About DigiVis 500 Operations DigiVis 500 Operations Installation
10
11 Sections A and B About DigiVis / DigiVis Installation Contents A 1 Visual Orientation Hints... A-5 A 2 General Hints for Operating DigiVis 500 Operations... A-6 B 1 Installing DigiVis 500 Operations... A-6 2PAA104346R0201 A-3
12
13 Sections A and B About DigiVis / DigiVis Installation A 1 Visual Orientation Hints To grant direct access to information, we have used different types of scripts and symbols. Script Italics SMALL CAPITALS boldface Meaning Representation for (selectable) menu items or parameters. Inputs to be made via the keyboard, also via virtual keys. Highlights important information, also as an orientation hint. Symbols Meaning Selection with mouse. The various instruction steps are separated by arrows. Example: Display Logfile list In this example, the menu item "Display" is to be selected followed by the menu item "Logfile list". Information on operation with the keyboard, inasmuch as it differs from the Windows Standard. Example: Select log file ALT D L.... Selected the module via keyboard, the keys ALT, D and L must be pressed successively. If two keys are to be pressed simultaneously:... SHIFT + INSERT.... Hints 2PAA104346R0201 A-5
14 Sections A and B About DigiVis / DigiVis Installation Special hints, must be observed! Preconditions Preconditions which must be fulfilled to implement commands or for satisfactory results. A 2 General Hints for Operating DigiVis 500 Operations Operation of DigiVis 500 Operations is based on the Windows Standard. Therefore knowledge of general operation under Windows is strongly recommended, see Windows Manual. The "typical Windows operation" will therefore not be dealt with in detail when describing the various operations. B 1 Installing DigiVis 500 Operations For information on how to install DigiVis 500 Operations please refer to the Getting Started manual. A-6 2PAA104346R0201
15 Sections A and B About DigiVis / DigiVis Installation Index I Installing DigiVis 500 Operations...A-6 O Operating DigiVis 500 Operations General hints...a-6 V Visual orientation hints...a-5 2PAA104346R0201 A-7

16 C Operating Philosophy
17
18 Section C Operating Philosophy Contents C 1 What is DigiVis 500 Operations?... C-5 C 2 Using DigiVis 500 Operations to Operate the Process... C-5 C 2.1 Mouse operation... C-6 C 2.2 Keyboard operation... C-9 C 3 Structure of the User Interface in DigiVis 500 Operations... C-12 C 3.1 Operation Using the Context Menu... C-15 C 4 User Identification... C-17 C 5 Process Visualization... C-19 C 5.1 Overview Display... C-19 C 5.2 Group Display... C-19 C 5.3 Graphic Display... C-19 C 5.4 Trend Display... C-20 C 5.5 Faceplate... C-20 C 5.6 Logs... C-21 C 5.7 Reports... C-21 C 5.8 Information Display... C-21 C 5.9 WEB Display... C-21 C 6 The DigiVis 500 Operations Menu: An Overview... C-23 C 6.1 Operation... C-25 C 6.2 Message List... C-25 C 6.3 View... C-25 C 6.4 Display... C-28 C 6.5 Tools... C-32 C 6.6 Print... C-38 C 6.7 Help... C-38 C 7 Display Selection... C-40 C 7.1 Display Selection via Icons in the Toolbar or via Menu Item Display... C-40 C 7.2 Display Selection Using the Context Menu... C-42 C 7.3 Display Selection from the Overview Display... C-43 2PAA104346R0201 C-3
19 Section C Operating Philosophy C 7.4 Display Selection from a Graphic Display...C-46 C 7.5 Display Selection with Default Display...C-46 C 7.6 Quick Select Window...C-47 C Calling up the Quick Select Window...C-49 C Exiting the Quick Select Window...C-50 C Scope of the Quick Select Window...C-51 C Saving the Configuration of the Quick Select Window...C-51 C Functions of the Quick Select Window...C-52 C Functions of a Specific Button...C-54 C-4 2PAA104346R0201
20 Section C Operating Philosophy C 1 What is DigiVis 500 Operations? The software running on the operator station PC in the DigiVis 500 system is known as DigiVis 500 Operations. It offers a user-friendly graphical user interface in accordance with the MS-Windows standard. In the DigiVis 500 system up to 10 operator stations can be connected per OPC server for process operation and observation. Among other things, DigiVis 500 Operations offers the following features: Standard displays such as overview display, group display, faceplate, trend display and WEB display Customized graphic displays, Customized faceplates Simple process operation using the mouse or keyboard, Quick and direct access to tags for operation, Message management, Trend displaying and trend archiving, Logging, System diagnostics in the Information display. Reports C 2 Using DigiVis 500 Operations to Operate the Process Under DigiVis 500 Operations the automated process can be operated either with mouse or keyboard. This ensures that in the unlikely event of either device failing the other can be used for all operator actions. 2PAA104346R0201 C-5
21 Section C Operating Philosophy C 2.1 Mouse operation Tag selection A tag is selected by clicking the left mouse button in one of the following selected areas: Faceplate in a group display, Message in message line, message list, Dynamic object in a graphic display, Menu item Display Faceplates, Trend in a trend display, Faceplate By double-clicking the left mouse button in one of these areas, the faceplate for the function is displayed and can be operated. Moving the faceplate A faceplate can be moved freely around the display area of the screen by clicking on the header. See also C-6 2PAA104346R0201
22 Section C Operating Philosophy Structure of the User Interface in DigiVis Page C-12 Executing actions in the graphic display Depending on the configuration, by selecting a dynamic graphic object in a graphic display one of the following actions can be performed: Calling up a display Operating a process variable Acknowledging messages The configured action is initiated by a single click of the left mouse button. Default display The default display allocated to the selected tag appears as the first menu item in the context menu of the corresponding faceplate and can be easily called up by clicking the left mouse button, due to its exposed position. Context menu You can call up the context menu at any time by right-clicking with the mouse. The context menu contains menu items for the most important operations and directly selectable displays, depending on the element on which the cursor is currently positioned. See also 2PAA104346R0201 C-7
23 Section C Operating Philosophy Operation Using the Context Menu, Page C-15. C-8 2PAA104346R0201
24 Section C Operating Philosophy C 2.2 Keyboard operation Tag selection After selection of the appropriate focus a tag can be selected in the display in different ways: Use the TAB KEY to select a faceplate in a group display, a dynamic object in a graphic display. Use the CURSOR KEYS ( ) to select a message in message list, an entry from a display list, a trend in a trend display, The selected area of a display is indicated by a frame. Faceplate By pressing ENTER after selecting the desired tag name the relevant faceplate appears, enabling the function to be operated. Moving a faceplate A selected faceplate can be moved freely around the display area of the screen. You can move it in the appropriate direction, either by one pixel using CTRL + CURSOR KEYS or by a 30x4 grid units by pressing CTRL + SHIFT + CURSOR KEYS. Default display 2PAA104346R0201 C-9
25 Section C Operating Philosophy You can call up a default display by using the F11 function key, provided that this has been configured accordingly in DigiVis 500 Graphics Builder. Display Explorer The Display Explorer shows a tree view of the displays available on the operator station. You can select and call up the appropriate display as required. The Display Explorer is called up by selection of the corresponding display via the menu or by a combined keystroke involving the following function keys: Combination of keys Tag list Graphic display Group display Trend display Log file list (incl. Reports) CTRL + F5 CTRL + F6 CTRL + F7 CTRL + F8 CTRL + F9 In the Display Explorer you can select a display or tag by either pressing the CURSOR KEYS or by typing the name or first characters and then confirming with ENTER. Display selection After having selected a tag you can directly call up the allocated displays by using the function keys F6...F9. C-10 2PAA104346R0201
26 Section C Operating Philosophy Focus In DigiVis 500 Operations more than one window is visible on the screen at a time. Which of these areas is active, i.e. which one can be currently operated using the keyboard, is indicated by the symbol on the left side of the status line: the green area is active! In order to toggle between display areas, press the ALT key together with a CURSOR KEY ( ) for the faceplate display area. Possible focus areas are the message line (top), display area (bottom left), faceplate (bottom right). Function keys The following function keys are used in DigiVis 500 Operations with non-display dependent actions after installation: F1 F12 Calls up help. Acknowledges the control room horn, same function as HORN button in the message line. SHIFT + F10 Calls up the context menu. (See Operation Using the Context Menu, Page C-15.) 2PAA104346R0201 C-11

27 Section C Operating Philosophy C 3 Structure of the User Interface in DigiVis 500 Operations vh_c0062_us.bmp Message line The message line is always visible and cannot be overlapped by other displays. As seen in the example, it may consist of several message items with tag names and message point details, plus the following items: Field for overflow area Field for indicating the total number of all messages on that operator station Button for the acknowledgment or visual acknowledgment of the displayed messages Button for the acknowledgment of the control room horn. The horn gets colored a soon as the control room horn becomes active. See Display, Page C-28. C-12 2PAA104346R0201
28 Section C Operating Philosophy Title line In this line, the type of display, the display name, and, if available, the configured short or long text are displayed. Menu line The menu line is always visible. This means you can perform the actions available in the menu in any operating situation. Toolbar You can use not only the menu line, but also the toolbar buttons to perform actions. A tooltip is available for each icon. The toolbar can contain various buttons or icons, depending on the currently shown display. Display area This screen area accommodates displays selected by the user. In some displays, the display area is further subdivided into three sub-areas. Status line vh_c0006_us.bmp On the left hand side of the status line there is a small icon, the keyboard focus indicator. Useful information for operation is shown in the middle of the status line. The 10 most recent messages can be viewed. Select the respective icon and hold down the left mouse button. In the right section of the status line the number of hardcopies to be processed is indicated. If the Security Lock software package has been installed, the user name is indicated. Else, "NOLOCK" is shown. 2PAA104346R0201 C-13
29 Section C Operating Philosophy The current date and time of day are displayed in the status line on the right hand side. The character "S" to the right of the time indicates daylight saving time. C-14 2PAA104346R0201
30 Section C Operating Philosophy C 3.1 Operation Using the Context Menu Right-click within selected display or on tag SHIFT + F10 The context menu appears. It contains menu items for the most important operations and directly selectable displays. The illustration below shows an example of a context menu: vh_c061_us.bmp The External Aspect is a display allocation function which can be used for allocating any document or Windows program to a tag using DigiVis 500 Graphics Builder. With this, it is possible to link documents to a tag or open Excel spreadsheets for a tag. The External Aspect in this example a "Readme" file. This is always the last menu item of the context menu. 2PAA104346R0201 C-15
31 Section C Operating Philosophy If you are using this option, the program configured for the External Aspect may provide access to the operating system. C-16 2PAA104346R0201
32 Section C Operating Philosophy C 4 User Identification The software package Security Lock provides user access control both in DigiVis 500 Graphics Builder and DigiVis 500 Operations. A separate license must be optained for the Secutity Lock for each system. Security Lock can be used to manage a maximum of 16 groups and 1,000 users. See also the Security-Lock Manual. Until a user-id license is detected, the menu items for logging in and out and for changing the password are not active. This means that each user can call up and operate any of the displays. After Security Lock has been installed, users must log in under DigiVis 500 Operations. Until a user has logged in, the rights assigned to the user GUEST are applied. Tools Login Enter user name TAB KEY Enter password ENTER When using Security Lock, each display will indicate whether or not the logged-in user has operating rights for this display by means of an open or a closed padlock: For each display and tag (faceplate) it is possible to define for each user group one of the following three access levels: No access Observation only Observation and operation At the operator station (DigiVis 500 Operations) you will see the following concerning access control: The user name is displayed permanently in the status line. If an appropriate signal sequence log has been configured, all control actions along with user names are documented in it. 2PAA104346R0201 C-17
33 Section C Operating Philosophy Standard users: NOLOCK GUEST SYSTEM No Security Lock license. No user is logged in, e.g. when DigiVis 500 Operations starts. Control action performed by the system (may appear in the log). C-18 2PAA104346R0201
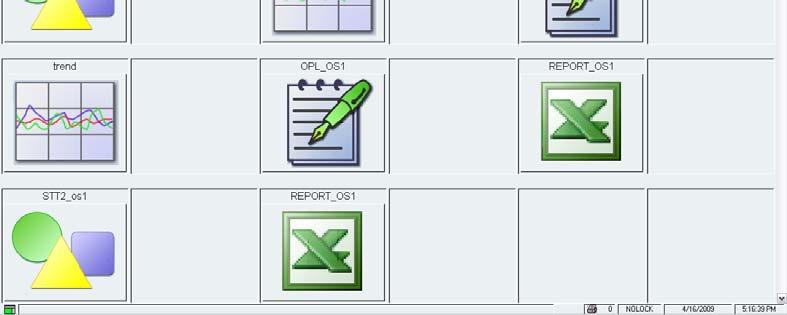
34 Section C Operating Philosophy C 5 Process Visualization Standard and free display types are available for presentation of process information. Standard displays are fixed in appearance. During configuration, only the names of tags to be shown in the display need to be entered. Free displays are graphic displays or user-defined faceplates both created in DigiVis 500 Graphics Builder using the graphic editor or the faceplate editor during configuration. C 5.1 Overview Display For any DigiVis 500 operator station one overview display can be configured. A standard overview display consists of 16 rows of 6 columns. A maximum of 96 displays can be represented and selected via symbols. These displays can be group displays, trend displays, graphic displays, logs, reports and WEB displays. The displays can be called up with a left mouse click on the corresponding symbol. Instead of using the standard overview display it is possible to define a graphic display to be used as overview display in the operator station. C 5.2 Group Display A group display is a configured collection of several faceplates. It offers the user the possibility of presenting related functions in one display. The functions or tags can be operated directly. C 5.3 Graphic Display In addition to the standard displays described above, customized graphic displays can also be created. These graphic displays can comprise a combination of static and dynamic elements and are designed according to the requirements of the user. The static section can be used for the schematic representation of the plant structure as a background. In the foreground, the dynamic elements of the displays can be used to present the current values and states of the process variables to the operator. 2PAA104346R0201 C-19
35 Section C Operating Philosophy C 5.4 Trend Display The trend display is the virtual presentation of a trend recorder. Binary and analog values from the process can be plotted against time. Up to 6 process variables can be graphically represented per trend display. This allows the user to zoom, fade out and scroll curves. The recorded curves can be archived on the DigiVis 500 Operations PC. Trend files (archives) can also be exported to another PC. The software package DigiBrowse can be used to view these exported trend files as well as to convert them into CSV format for further processing with other programs, e.g. MS-Excel. Trend displays can both be configured in DigiVis 500 Graphics Builder and defined by an operator station user. Loading data from DigiVis 500 Graphics Builder into the operator station may delete the operator-defined trend displays. It is, thus, recommended to export operator-defined displays and then re-import them if required. C 5.5 Faceplate Faceplates are used for operation and observation of tags. They show the current state of the associated process. Faceplates can be called up from other displays. They are always positioned on top of other displays. A selected tag is always operable via its faceplate. A maximum of 5 faceplates can be displayed simultaneously on the screen. Even with the Dual Monitor DigiVis 500 Operations option not more than a total of 5 faceplates are available on both screens. If you open an additional faceplate, the system will automatically close the faceplate which had not been activated for the longest period. You can fix faceplates by using the pin button in the title line of each faceplate. A fixed faceplate can be moved, but it will not be closed automatically. You can fix a maximum of 4 faceplates. You can either tile or cascade the faceplates on the screen. See Display, Page C-28. C-20 2PAA104346R0201
36 Section C Operating Philosophy C 5.6 Logs Logs provide the documentation of events, states and sequences from the process. The data can be stored on the operator station hard disk, output to a printer or displayed on the screen. Log files can also be exported to another PC. The software package DigiBrowse can be used to view these exported log files as well as to convert them into CSV format for further processing with other programs, e.g. MS-Excel. Three types of logs are available: Signal sequence log (SSL1, SSLN) Operation log (OPL) C 5.7 Reports Reports are used to acquire and store data in user defined MS Excel templates. C 5.8 Information Display This display provides access to all the other displays configured in the DigiVis 500 system Menu options for diagnostic mode and OPC server diagnostics are provided in this display. C 5.9 WEB Display If you call up a WEB display in DigiVis 500 Operations, the local Internet Explorer will be started and the link to the configured URL will be activated. With this, it is possible, for example, to call up into DigiVis 500 Operations the video display from a process monitoring camera. 2PAA104346R0201 C-21
37 Section C Operating Philosophy The WEB display starts the local WEB browser. With this, DigiVis 500 Operations users may access files on the local machine or other machines in the intranet or global internet. Mind the risks and dangers associated with this. C-22 2PAA104346R0201
38 Section C Operating Philosophy C 6 The DigiVis 500 Operations Menu: An Overview vh_c0010_gr.bmp Operate This menu item includes all operations for the currently active display. You can find a detailed description in the relevant chapter of each type of display. Message list! Calls up the message list. View Provides several view options for the message line and the faceplates. Display Allows for selection of a display or tag via the Display Explorer. Tools Exits DigiVis 500 Operations (via the security dialog). Login, logout and change password, if Security Lock has been installed. Opens the Quick Select dialog box. Allows you to define trend displays. Opens the Options dialog box. 2PAA104346R0201 C-23
39 Section C Operating Philosophy Print Outputs hardcopies to the connected printer. Help Calls the DigiVis 500 Operations help system. Calls the DigiVis 500 Operations context help system. Displays the DigiVis 500 Operations version. Many menu items can also be selected via the icons in the toolbar. In such cases, the icons are shown next to the menu items in the following text. C-24 2PAA104346R0201

40 Section C Operating Philosophy C 6.1 Operation Depending on the selected display, you can carry out different actions via this menu item. You can find a detailed description in the chapters describing the individual displays. Basically, this menu option is intended for keyboard operation. All operator actions can usually be carried out directly in the display or its context, respectively, using the mouse. C 6.2 Message List This menu item calls up the message list without any further input. In the message list messages sent from the process stations to this operator station are sorted and displayed. Either the DigiVis 500 system or the automated process can produce the messages. Messages can be filtered for this display according to specific criteria. In the message list one or more messages can be selected and acknowledged, or the displays assigned to a particular tag can be called up via the display selection dialog. The operator can rapidly gain information on the selected message. C 6.3 View vh_c0011_us.bmp Here you can select different views for the message line and the faceplates: us.bmp 2PAA104346R0201 C-25
41 Section C Operating Philosophy Standard view of message line Area view of message line You will get the standard view of the message line several message items with tag names and message item information. Depending on the configuration, visual acknowledgement (only within the same operator station) or point acknowledgement (can be realized throughout the system by acknowledging the alarm point in the process station) are possible with this message line view. You will get the area-specific view of the message line. In the message line there is a fixed position for each plant area. The number of associated, present messages is displayed for each plant area. The plant area is displayed in the priority color of the most important message. The most important message is detailed in the tooltip. Selecting a plant area button opens a plant area specific message list. With this message line view, no acknowledgement is possible, as the DigiVis 500 system is based on the principle that only visible messages can be acknowledged. vh_c0047_us.bmp C-26 2PAA104346R0201
42 Section C Operating Philosophy List view of message line You will get the list view of the message line. The 4 most important messages are displayed in the same format as on the message page. Depending on the configuration, either the eldest or the latest message is displayed as the first list item. Controlled scrolling in the mini list is not possible. Double-click to open the faceplate associated to the message. Depending on the configuration, visual acknowledgement (only within the same operator station) or point acknowledgement (can be realized throughout the system by acknowledging the alarm point in the process station) are possible with this message line view. vh_c0048_us.bmp Tile Faceplates The faceplates are basically arranged side by side. This holds for both the faceplates already displayed and for those to be called up. If some user-defined faceplates are oversized, it is possible that not all faceplates can be arranged side by side. In this case, the first nonfitting faceplate appears rightaligned and may overlap other faceplates. Cascade Faceplates The faceplates are basically arranged overlapping each other. This holds for both the faceplates already displayed and for those to be called up. 2PAA104346R0201 C-27

43 Section C Operating Philosophy C 6.4 Display vh_c0017_us.bmp This menu is used for selecting a display from a list of all those available, or for selecting a tag. Except for overview display, message list as well as system display, all of which only exist once per operator station, the Display Explorer is started for all other menu items, which include the names of all tags, displays, reports and logs. The displays of the selected type are already expanded. Faceplates Opens the Display Explorer with expanded tags. C-28 2PAA104346R0201
44 Section C Operating Philosophy Graphic Opens the Display Explorer with expanded graphic displays. Group Opens the Display Explorer with expanded group displays. Trend Opens the Display Explorer with expanded trend displays. Log Opens the Display Explorer with expanded logs. WEB... Opens the Display Explorer with expanded WEB displays. Overview display Opens the overview display. Message list Opens the message list. Back/Forward DigiVis 500 Operations stores the five most recently called displays in a ring buffer. The Back and Forward controls replace the current display with the corresponding display from the ring buffer, with no other input. 2PAA104346R0201 C-29
45 Section C Operating Philosophy vc0630us.bmp Pressing Back and Forward leaves the content of the display memory unchanged, i. e. after calling one of these menu items five times, the initial display will re-appear. A new entry is recorded in the display memory each time a display is called up via the menu, the context menu or a dynamic graphic object. The BACK/FORWARD buttons do not create an entry in the graphic memory! When a new display is called up, this replaces the stored display that would be reached by the next Forward! command. The ring buffer can be switched on or off in the Tools Options menu under Cyclic back/forward display switch. When the ring buffer is switched off, the 5 display entries are managed in a linear fashion, i.e. after Back! is called for the fourth time, the end of the buffer is reached. The first display is not called again as when the ring buffer is switched on. Once the last displays have been called using Back!, the current pointer can be shifted back to the front memory locations using Forward! C-30 2PAA104346R0201
46 Section C Operating Philosophy vc0631us.bmp 2PAA104346R0201 C-31

47 Section C Operating Philosophy C 6.5 Tools vh_c0018_us.bmp System... Here you can terminate DigiVis 500 Operations after entering the password, which has been defined in DigiVis 500 Graphics Builder. The following menu items can only be selected if the additional software package Security Lock has been installed. When entering the user name and password the pattern of upper-case and lower-case characters must be correct. Login / Log over Here you can log in using your user name and password. Specific access rights are assigned to each user, depending on the configuration. C-32 2PAA104346R0201
48 Section C Operating Philosophy Logout Here you can log out. Only the rights for the user "GUEST" are active then. If the user wants to execute a function that is not available to the GUEST, he must log in again. Change Password Here, users may change the passwords they need to identify themselves. First the old valid password must be entered, followed by the new password (twice). The changed password is only valid for this DigiVis 500 Operations PC. If the user is authorized to log in on another DigiVis 500 Operations PC, the previous password is still valid on that DigiVis 500 Operations PC. We recommend to successively change the password on all relevant DigiVis 500 Operations PCs to ensure the same password is valid on all of them. Run Security Lock Starts the add-on program Security Lock after entering your password, provided that you are authorized to use Security Lock. See the Security Lock Manual for details. Using the Security Lock program, users can be added or deleted, or access rights can be changed. The following menu items are always available: Quick Select Opens the Quick Select dialog box for userdefined display calls (see Calling up the Quick Select Window, Page C-49). Define Displays Trend Opens the dialog box for definition of trend displays by the user (see Section Trend Display). 2PAA104346R0201 C-33

49 Section C Operating Philosophy vh_c0019_us.bmp Options Opens the Options dialog box that has the following settings: General Cyclic back/forward display switch Linear management of display memory as ring buffer memory, or linear management (see back/forward - C-34 2PAA104346R0201
50 Section C Operating Philosophy Tools, Page. Faceplate always on top Enables the faceplates to remain constantly displayed on top when switching to other Windows applications. Show display selection list Here you can select whether the Display Explorer shall appear on the right or left hand side of the screen. 2PAA104346R0201 C-35
51 Section C Operating Philosophy Graphic display Clip A full width graphic display will be visualized in the available graphic area. Since with scaling the page ratio is not modified, the lower side of the display can be cut. Fully visible A full height graphic display will be visualized in the available graphic area. Since with scaling the page ratio is not modified, the right section of the display can be left unused. Centered The graphic display is completely arranged and centrally aligned in the available graphic area. Message list Here you can select whether a set priority filter shall be used the next time an area message list is called up. use last When calling up an area-related message list, the messages will be filtered according to priority filters last used. select all Messages of all priorities will be displayed when invoking an area-related message list. Signal sequence log Here you can configure the text and background colors for the signal sequence logs so that you get alternating line colors which give you a better overview of the table, as shown in the example. C-36 2PAA104346R0201

52 Section C Operating Philosophy vh_c0049_us.bmp Trend display Here you can select for trend displays whether the operating field shall be arranged above or below the curve. 2PAA104346R0201 C-37
53 Section C Operating Philosophy C 6.6 Print vh_c0020_us.bmp Screen Outputs a copy of the entire screen currently displayed to the printer. Display Outputs only the display area of the screen to the printer, without the menu or dialog area. Region Prints a selected section of the screen. To do so, you need to define the area to be printed. Press the left mouse button and move the focus to the appropriate section of the display. The selected section will be printed once you release the left mouse button. C 6.7 Help vh_c0021_us.bmp DigiVis 500 Help Calls the DigiVis 500 Operations help. It includes all the important parts of this manual. You can read the help texts and graphics directly at the operator station PC. C-38 2PAA104346R0201
54 Section C Operating Philosophy Context Help Helpful information about the current display. About... Information about the DigiVis 500 Operations software version. 2PAA104346R0201 C-39
55 Section C Operating Philosophy C 7 Display Selection A good, straightforward system of display selection is particularly important for a control system. Thus you will arrive as quickly as possible at the appropriate place in order to take the necessary steps and control the process safely. C 7.1 Display Selection via Icons in the Toolbar or via Menu Item Display You can access all displays, tags and logs of this operator station. There are different options. Via the toolbar Left-click toolbar icon (here e.g. GRAPHIC DISPLAYS) In Display Explorer double-click appropriate graphic display Via the menu Display Graphic (e.g.) In Display Explorer double-click appropriate graphic display Via a shortcut CTRL + F5 to CTRL + F9 Use CURSOR KEYS to select appropriate display ENTER For further details concerning the display types see C-40 2PAA104346R0201
56 Section C Operating Philosophy Tools, Page C-32. In all cases the Display Explorer with the names of all available displays comes up. Double clicking the required display name selects the display. In the Display Explorer, a quick selection is possible by entering the first letter of the tag or of the display name. 2PAA104346R0201 C-41
57 Section C Operating Philosophy C 7.2 Display Selection Using the Context Menu The Display selection via the context menu is a fast alternative for calling up displays. In addition to general displays, it is also possible to directly select the displays assigned to the tag. Select tag Call up context menu Select appropriate display vh_c0042_us.bmp In the context menu, you will find the following displays: General displays (Overv.) (Sys.) (Msg.) Overview display System display Message list Other displays C-42 2PAA104346R0201
58 Section C Operating Philosophy (Graphic) (GRP) (Trend) (SSL) (OPL) (REP) (Web) Graphic display Group display Trend display Signal sequence log Operation log Reports WEB Display This list describes the order and possible entries. Only those entries will be displayed which have been assigned to the selected tag. For details concerning the context menu see Operation Using the Context Menu, Page C-15. C 7.3 Display Selection from the Overview Display Alternatively you can select displays via the overview display. 2PAA104346R0201 C-43


59 Section C Operating Philosophy vh_c0057_us.bmp In order to select e.g. the following graphic display, proceed as follows: C-44 2PAA104346R0201
60 Section C Operating Philosophy Left-click appropriate graphic symbol Use TAB KEY to select appropriate graphic symbol ENTER 2PAA104346R0201 C-45
61 Section C Operating Philosophy C 7.4 Display Selection from a Graphic Display In order to be able to call up a display from a graphic display, you must first select a graphic object for which the Show display action with the display has been configured in DigiVis 500 Graphics Builder. Left-click appropriate graphic symbol Use TAB KEY to select appropriate graphic object ENTER C 7.5 Display Selection with Default Display It is possible to specify during the display access configuration in the DigiVis 500 Graphics Builder for each tag a so-called default display which, can be selected particularly fast for operation and observation in order to quickly receive information concerning the status of the plant, e. g. in case of emergency. After selecting the tag, this display will be listed in top position of the context menu so that you can call it up with both the mouse and the keyboard: Call up context menu Left-click default display F11 Only one default display can be configured per tag. The following types are available: Graphic display Trend display Group display Operation log Signal sequence log Reports WEB display C-46 2PAA104346R0201
62 Section C Operating Philosophy C 7.6 Quick Select Window The Quick Select window allows you to configure a quick access to your favorite displays, trends, logs and so on, thus optimizing DigiVis 500 Operations for your way of working. The Quick Select window can be called up as an additional dialog box on the screen. This dialog box contains a set of buttons. Each of these buttons can be configured to call up any display. In the following text, the term display is used as generic term for all displays that can be selected in DigiVis 500 Operations: graphic, group, WEB, and trend displays, logs as well as the overview or system display, the message list and all faceplates. For each button in the Quick Select window it is also possible to assign any keystroke from the keyboard to each function. Therefore, the function keys F1 to F12 are available for configuration - as single keystroke as well as in combination with the CTRL, SHIFT or ALT key. Furthermore, the ASCII keys with or without the SHIFT key - can be used in combination with the CTRL or ALT key. In the following text, all these keystroke combinations are called shortcuts. For key assignment purposes it is also possible to define those combined keystrokes, which are normally pre-assigned to the system (F1 for Help, CTRL+F5 for the Tag list), thus deleting the pre-assignments. There will be no system warning in such cases! Configuration of the Quick Select window is performed in DigiVis 500 Operations. Each Security Lock user selects their own favorite display. Existing configurations can be imported and exported. 2PAA104346R0201 C-47

63 Section C Operating Philosophy vh_c0043_us.bmp Each display that is assigned to a button is represented by a symbol and text on the corresponding button. C-48 2PAA104346R0201
64 Section C Operating Philosophy C Calling up the Quick Select Window There are several ways to call up the Quick Select window. See also 2PAA104346R0201 C-49
65 Section C Operating Philosophy Print, Page C-38. Via the toolbar Left-click toolbar icon Via the menu Tools Quick Select Via a shortcut CTRL + Q This window is displayed in the operating area, and can be moved freely by the operator over the whole operating area below the message line. C Exiting the Quick Select Window The Quick Select window is closed with each call of a display. You can also select the Close menu option or click outside this window in order to close the Quick Select window. C-50 2PAA104346R0201
66 Section C Operating Philosophy C Scope of the Quick Select Window The configuration of the Quick Select window is according to the current Security Lock user. If Security Lock has not been installed, the user NOLOCK is used. The Quick Select window is not part of a special project, but rather belongs to an operator station. In this way there will be no modifications when loading a new project or a whole station from DigiVis 500 Graphics Builder. C Saving the Configuration of the Quick Select Window Every time the dialog box is closed, the Quick Select window configuration is automatically saved in the file <user name>.qck. This file is stored in the default project directory: <DigiVis 500_installation_folder>\proj. 2PAA104346R0201 C-51

67 Section C Operating Philosophy C Functions of the Quick Select Window All functions described for the Quick Select window can be called up from its context menu: Right-click on any position in the dialog box (do not position mouse pointer on buttons!) vh_c0044_us.bmp Clear function keys All assignments of the function keys (shortcuts) will be deleted. All functions of the soft buttons remain unchanged. Delete all All user-made assignments for the buttons and shortcuts will be deleted. If you select Clear function keys or Delete all, all standard keyboard assignments of the function keys, which had been pre-assigned for the use of the menu and the display, will then be available again. C-52 2PAA104346R0201

68 Section C Operating Philosophy Size The Quick Select window includes up to 6x6 buttons. Proceed as described below to configure the size of the button field: The default size is 6x4. The buttons are consecutively numbered from 1 to 36. Export To make the configuration available for other PCs, this menu item can be used to store configuration data on floppy disk as file: a:<username>.qck. Import The file a:<username>.qck will be imported. If a configuration is already available on the operator station for the Quick Select window, a security dialog will ask you if you really want to delete the current configuration. 2PAA104346R0201 C-53

69 Section C Operating Philosophy C Functions of a Specific Button Proceed as follows to open the context menu for a button: Right-click appropriate button SHIFT + F10 vh_c0045_us.bmp Undo The last button configuration will be undone. Assign current display The display currently shown is assigned to the selected button. Assign current faceplate The currently shown faceplate is assigned to the selected button. C-54 2PAA104346R0201

70 Section C Operating Philosophy Delete The assignment of the selected button is deleted. Pressing this button will no longer call up a display. Cut The configuration of the selected button is deleted and stored in the clipboard. Copy The configuration of the selected button is stored in the clipboard. Paste The content of the clipboard is assigned to the selected button. Properties A new dialog box with the characteristic data of a Quick Select button will be opened where you can specify additional properties. vh_c0051_us.bmp 2PAA104346R0201 C-55

71 Section C Operating Philosophy Display name Enter the name of the display or a tag in the edit field. With the check box you have to indicate whether the name should be interpreted as a display or a tag name. Some displays e.g. system display, message list do not have any name. Such a display can only be linked to a Quick Select button by opening it and then calling up the Assign current display menu. If the specified display is not found, a dialog box will be displayed: vh_c0052_us.bmp By confirming this dialog with Yes it is possible to specify a Quick Select Window for future use or e.g. another operator station. Button text Any text can be entered to be shown on the selected button. Short cut Instead of using the Quick Select buttons, the linked display can also be called up via the keyboard. By pressing an appropriate combination of keys from the keyboard, this key combination is entered as the short cut of this button. You can call up the assigned display at any time using this combined keystroke. C-56 2PAA104346R0201
72 Section C Operating Philosophy Caution! For key assignment purposes it is also possible to define those combined keystrokes, which are normally pre-assigned to the system (F1 for Help, CTRL + F5 for Tag list), thus deleting the pre-assignments. There will be no system warning in such cases! ToolTip text You can enter any text in the edit field. ToolTip only Tooltip text will be displayed as follows <Display name>, <Shortcut> <Tooltip text> e.g. <Reactor> <ALT + F8> <Plant display> only the entered tooltip text will be displayed. 2PAA104346R0201 C-57
73
74 Section C Operating Philosophy Index B Back C-31 C Context menu C-16 D Default display C-9 DigiVis 500 Operations Operating philosophy C-5 DigiVis 500 Operations Menu C-24 Display selection Default display C-48 Menu item Display C-42 Overview display C-45 Toolbar C-42 F Faceplate C-21 Forward C-31 G Graphic display C-20 Group display C-20 I Information Display C-22 K Keyboard C-9 2PAA104346R0201 C-59
75 Section C Operating Philosophy L Log C-22 Log files Export C-22 M Menu Display C-30 Help C-40 Message list C-26 Operation C-26 Print C-40 Tools C-34 Mouse C-6 O Operation Context menu C-16 Keyboard C-9 Mouse C-6 Overview display C-20 P Process visualization C-20 Q Quick Select C-50 Assign current display C-58 Assign current faceplate C-58 Button properties C-59 Button text C-60 C-60 2PAA104346R0201
76 Section C Operating Philosophy Export configuration C-56 Functions C-55 Import configuration C-56 Save configuration C-54 Short cut C-60 Size C-56 Tooltip C-61 R Reports C-22 S Security Lock C-18 T Tag selection C-9 Trend display C-21 Trend files Export C-21 U User identification C-18 W WEB Display C-23 2PAA104346R0201 C-61

77 D Messages
78
79 Section D Messages Contents D 1 General Description Messages... D-5 D 1.1 Message Types... D-5 D 1.2 Priority Levels... D-7 D 1.3 Acknowledgment of Messages... D-7 D Types of Acknowledgment... D-7 D Acknowledgment Levels... D-9 D Acknowledgment in the Message Line and Message List... D-10 D 1.4 Messages with Sound Files... D-12 D 2 Message Line... D-15 D 2.1 Structure... D-15 D Standard View... D-16 D Area View... D-18 D List View... D-18 D 2.2 Operating the Message Line... D-18 D Selecting a Message... D-18 D Calling up Faceplates... D-19 D Calling up Assigned Displays... D-19 D Point Acknowledging- or Visually Acknowledging Messages... D-19 D Switching off the Control Room Horn... D-20 D 3 Message List... D-20 D 3.1 Calling up the Message List... D-22 D 3.2 Structure... D-23 D Header... D-23 D List with Messages... D-25 D Operate Menu... D-27 D Operating Element Area... D-27 D Display of Different Priority Levels... D-28 2PAA104346R0201 D-3
80 Section D Messages D Display of the Incoming / Outgoing Status...D-28 D 3.3 Operation...D-29 D Calling up Faceplates...D-29 D Calling up Assigned Displays...D-30 D Acknowledge Messages by Page...D-30 D Acknowledge Messages by Block...D-30 D-4 2PAA104346R0201
81 Section D Messages D 1 General Description Messages Errors and certain state deviations in the DigiVis 500 system are signaled by visual and acoustic messages. The DigiVis 500 system makes available the message types system message, fault message and switch message. These message types are sorted according to their importance to the process into different priority levels, one system level (divided into the three groups S1 S3) and four user levels (1 4). Messages are displayed in the message line and message list, and can be acknowledged from the respective location, except for the area view. In addition, the messages can be acknowledged via the context menu of the assigned faceplate and in a graphic display. D 1.1 Message Types In the DigiVis 500 system, messages are divided into the following message types according to their importance to the process: System messages System messages have the highest priority level and are subdivided into three message groups S1 to S3. These messages cannot be configured or changed by the user. System messages are used to indicate fault states of the system (hardware) itself. Fault messages Fault messages are at priority levels 1 to 3. Messages of this priority level are used, for example, to signal that a limit value has been exceeded. Switch messages 2PAA104346R0201 D-5
82 Section D Messages Switch messages are at priority level 4. Messages of this type are used to indicate switch events, e.g. Valve open/closed. D-6 2PAA104346R0201
83 Section D Messages D 1.2 Priority Levels Messages generated by the process stations can be of varying importance for the smooth operation of a process. The DigiVis 500 system provides five different priority levels for messages. Four display colors are assigned to these priority levels: Priority level Message type Display color S1, S2, S3 System message blue 1 Fault message red 2 Fault message orange 3 Fault message yellow 4 Switch message yellow The same color is used to indicate the priority level of a message in the message line, message list as well as faceplates. D 1.3 D Acknowledgment of Messages Types of Acknowledgment Two types of message acknowledgment are possible: visual acknowledgment and point acknowledgment. Visual acknowledgment does not replace point acknowledgment; it is an additional function. Visual acknowledgment With visual acknowledgment the message are marked as "viewed". This type of acknowledgment has no effect on the current state of the message in the process station. It is available in the message line. 2PAA104346R0201 D-7
84 Section D Messages By visual acknowledgment in the message line all listed entries are deleted. However, they are still present in the message list. Visual acknowledgement is limited to the operator station where it has been performed. D-8 2PAA104346R0201
85 Section D Messages Point acknowledgment This type of acknowledgment is available in the message list, faceplates, and graphic displays. If configured accordingly, it is also available in the message line. It performs an acknowledgment of the message in the process station. This changes the status of the message. Point acknowledgement has an effect throughout the system, as it is broadcast from the process station to all operator stations connected. D Acknowledgment Levels The acknowledgment strategy encompasses three different acknowledgment levels (acknowledgment levels 1 3). Level 1 This is the highest acknowledgment level. Messages with this acknowledgement level must be acknowledged for incoming and outgoing messages. Level 2 Message of this level must only be acknowledged if they are incoming. Level 3 These messages need not be acknowledged. A message is labeled incoming when the situation that caused it has just occurred. The message is newly added to the message line and the message list. Example: A message generated when a process value exceeds its limit will be considered as incoming until the value returns to the "normal range." 2PAA104346R0201 D-9
86 Section D Messages A message is labeled outgoing when the situation that caused it is no longer active. In some cases, acknowledgment must be used to remove these messages from the message line and the message list. Example: A message generated when a process value exceeds its limit is considered as outgoing when the associated is in the "normal range". D Acknowledgment in the Message Line and Message List Depending on the configuration, visual acknowledgment or point acknowledgment are available in the message line. The active acknowledgement type can be recognized by the following symbols: Visual acknowledgement of message Point acknowledgement of message The messages in the message list can only be point acknowledged. The appropriate buttons can be found in the operation line. D-10 2PAA104346R0201
87 Section D Messages This type of acknowledgment affects the message status. Possible combinations are: Acknowledgement level Message incoming not acknowl. Message incoming acknowl. once Message outgoing not acknowl. Message outgoing acknowl. once Message outgoing acknowl. twice 1 Full symbol flashing Full symbol static Empty symbol flashing Empty symbol static Not visible 2 Full symbol flashing Full symbol static Empty symbol flashing Not visible Not visible 3 Full symbol flashing Not visible Not visible Not visible Not visible An incoming message is active in the OPC server. An outgoing message is no longer active in the OPC server. The full symbol is displayed at the left in the message list. It is displayed as white or black text on a colored background. The background color depends on the priority. The empty symbol is also displayed at the left in the message list. It is displayed as colored text on a gray background. The text color (number and sign) depends on the priority. 2PAA104346R0201 D-11
88 Section D Messages D 1.4 Messages with Sound Files One or more sound file can be configured for each message priority. These sound files are played one after another without any interval, and are therefore treated as a single sound file. The sound files for a message priority can be played when the status changes from inactive to active and vice versa. The sound file for a specific process message is triggered when the message status changes from inactive to active. There are three different options for processing the sound files in the operator station: priority-controlled, oldest message, priority-controlled, newest message, chronological order. One of the above options is chosen in DigiVis 500 Graphics Builder during the configuration process. The following section provides more information about the processing of sound files: Priority-controlled, Oldest or Newest Message As well as being added to the message list, for the period of time during which the sound file of a message is being played back all messages received at the operator station are stored in a cache. When the playback of the sound file is completed, the newly-received messages are checked and the next sound file to be played as per configuration is determined. If there is no "more important" message in the cache, the last sound file is played back again. Once the sound file has been played, the message entry is deleted from the cache and the sound file from the next message to appear is output. D-12 2PAA104346R0201
89 Section D Messages The current sound file is rejected in favor of the sound file of a newly-received message in the operator station if the latter is "more important" according to the following criteria: A) Incoming message status An incoming message (state transition from inactive to active) is more important than an outgoing message (changing from active to inactive). B) Higher message priority The message priorities in order of increasing "importance": 4, 3, 2, 1, S3, S2, S1. C) Customized sound file An individually configured sound file is more important than the ones configured for the priority. D) Time newest message: a new message is more important than an existing message. oldest message: in the event of the same importance according to criteria A C, the sound file of the oldest message is played again. The HORN OFF button or F12 key can be used to terminate output of the current sound file and to clear the sound cache. Chronological order In addition to being added to the message list, all incoming messages (message status changed from inactive to active) are stored in a cache in the correct chronological order. Outgoing messages are not processed. The configured sound file of a message from the cache is output once. Once the sound file has been played, the message entry is deleted from the cache and the sound file from the next message to appear is output. This sequence of sound files, which is determined by the system, can be interrupted through an operator action. You can select a message in the message list and start the configured sound file. After the current sound file has finished playing, this user-chosen file is played without any effect on the sound cache. Once the sound file has been played, the next file to play is then determined according to the configured algorithm. 2PAA104346R0201 D-13
90 Section D Messages The sound files are not loaded by DigiVis 500 Graphics Builder. The files must be copied into the following predefined folder on the DigiVis 500 Graphics Builder PC: <DigiVis 500_Installation_Folder>\wave D-14 2PAA104346R0201
91 Section D Messages D 2 Message Line The message line indicates any process problem as a message. The message line is at the top of the screen. This display area cannot be overlaid by other displays and, thus, is always visible. D 2.1 Structure The messages occurring can be displayed in three different view types. The view is changed via the toolbar. The following three symbols are available on the right hand side of the toolbar: The desired view can also be selected via the View menu. The range of available views may be limited by settings made in DigiVis 500 Graphics Builder. Standard view Indicates each message in a separate field. Area view Displays for each plant area the associated number of messages. List view Shows the four most important messages of the message list. Message fields These fields show the following information: 2PAA104346R0201 D-15
92 Section D Messages Standard view: the received messages Area view: the plant areas and their number of messages List view: a list with the four most important messages If more messages than can be displayed on the screen exist, this field is highlighted yellow. This field is not available in the area view. The number indicated is the total count of all messages in this operator station. This field is not shown in the area view. Visual acknowledgment or normal acknowledgment, depending on the configuration. This button is not available in the area view. The control room horn is enabled with a redcross mark when it is in operation. It can be switched off using this button. The next sections provide more information about the different views. D Standard View vh_d0012_us.bmp Each alarm is indicated in a separate field. The tooltip for this field contains the same information as the message list. By default, this message line view shows fourteen fields for the indication of messages. All fields are identical in size. The message field display provides two lines: The first line contains the name and the second line the short text. Moreover, the message line contains the field for the display of the message line overflow, the field with the number of all messages in the message list, the button for acknowledging the dis- D-16 2PAA104346R0201
93 Section D Messages played messages (i.e. the button for visual acknowledgment or the button for point acknowledgment, depending on the configuration), and the button to switch off the signal horn. It is recommended to use visual acknowledgment for this view. This allows you to empty the message line upon a quick check of the alarm priority and to recognize newly occurring alarms immediately. If you choose point acknowledgment for the message line, you should use the type of configuration where the latest alarms appear in the top left corner. This also allows you to quickly recognize newly occurring alarms. 2PAA104346R0201 D-17
94 Section D Messages D Area View vh_d0013_us.bmp Each plant area is displayed in a separate field. In addition to that, a plant area called No Area is displayed. All messages of those tags which have not been assigned to a specific plant area are assigned to this area. There is also a field called System, where all system messages can be found. Information about the most important messages is shown as a tooltip for each area. The most important message also determines the color and blinking state of the message field. When you click a plant area, the display area shows the message list of this plant area. D List View vh_d0014_us.bmp This view shows a list of the four most important alarm messages. The information about the messages corresponds to the information in the message list. Moreover, the message line contains the field for the display of the message line overflow, the field with the number of all messages in the message list, the button for acknowledging the displayed messages, and the button to switch off the signal horn. D 2.2 D Operating the Message Line Selecting a Message Left-click message D-18 2PAA104346R0201
95 Section D Messages D Calling up Faceplates Double-click message Call up context menu of message Left-click associated faceplate Select message ENTER (only possible in the standard view) D Calling up Assigned Displays Right-click message Left-click appropriate display D Point Acknowledging- or Visually Acknowledging Messages Selecting the button Point-acknowledge message or Visually acknowledge message in the standard view point-acknowledges or visually acknowledges all messages in the message line. In the list view, there are two possibilities: If a message has been selected, only this message is acknowledged. Otherwise, all visible messages are acknowledged. If the overflow field is displayed with a yellow background, the subsequent messages are displayed after operating button Point-acknowledge message or Visually acknowledge message. Left-click or 2PAA104346R0201 D-19
96 Section D Messages Set focus to message line with ALT + Press key A or ALT + A Visual acknowledgment has no effect on messages in the message list! D Switching off the Control Room Horn Left-click Operate Horn off Set focus to message line with ALT + Press key O, ALT + O, or F12 D 3 Message List The message list contains all messages of priority levels 1 to 4 and system messages S1-S3. Dependent upon the parameters set for the message configuration in DigiVis 500 Graphics Builder, the oldest message can be shown either at the top or the bottom of the list. Additionally, the DigiVis 500 Graphics Builder configuration defines whether the message display from certain OPC server or plant areas or messages of a specific priority is to be suppressed. The maximum number of messages depends upon the parameter for the length of the message list. It can be between 10 and 2000 messages. In order to be able to call the individual message lists (for different plant areas) you can change the priority filter default setting. Once you have changed the priority filter settings in a message list, you can select if this new setting is to be used again when you call up the message list the next time or if you want the settings to be reset. D-20 2PAA104346R0201
97 Section D Messages Tools Options ALT T P In the following dialog you determine which priority filter pre defined setting is to be valid. You can choose between the settings use last and select all. vh_d0015_us.bmp 2PAA104346R0201 D-21
98 Section D Messages D 3.1 Calling up the Message List Left-click toolbar icon Display Message list Call up context menu Message List (Msg.) Clicking this symbol always calls up the entire message list with all messages from all plant areas. Additionally, it is possible to call up the plant-specific message lists. They can be called from the message line of the respective Area view, only. The plant area filters are set accordingly to ensure that only that plant area is selected. The priority pre defined settings are used for invoking different message lists. D-22 2PAA104346R0201


99 Section D Messages D 3.2 Structure The message list consists of a header, the list with the actual messages, and the operating element area with four buttons and a 3 checkboxes. vh_d0016_us.bmp D Header The header contains information about the message list. The total number of messages is indicated on the left hand side. On the right hand side, colored boxes indicate if any messages exist outside the currently displayed page. If a box is highlighted with its priority color, messages of that priority are not visible on the screen. 2PAA104346R0201 D-23
100 Section D Messages Several checkboxes are available to filter the messages. When you select a checkbox, the associated messages are shown. If you check or uncheck the non-indented checkbox on top of a list, all indented checkboxes under it are at the same time checked/unchecked. D-24 2PAA104346R0201
101 Section D Messages The following options are available: Priority System message Area Apart from selecting all messages, messages assigned to a certain priority level can be hidden. Apart from selecting all messages, messages assigned to certain system messages can be hidden. Apart from selecting all messages, messages assigned to a certain plant area can be hidden. The messages are filtered as follows: Left-click appropriate option Operate Select filter Select level ALT O Use CURSOR KEYS to select filter ENTER Use CURSOR KEYS or appropriate NUMBER KEYS to select level Focus in display area Use TAB KEY to select checkbox Use SPACE BAR to toggle checkbox If there are more messages than can be displayed in the display area, this is indicated by a scroll bar on the right edge of the area. The assigned priorities or assigned system messages of the messages in the non visible display area is shown under Further messages by a color code. The color corresponds to the priority level. D List with Messages Messages can be displayed in value format, long format or long/limit format. The check box for the long/limit format is checked by default. The formats differ in the type of information presented to the operator. Display formats for the system messages are as per the configuration in DigiVis 500 Graphics Builder. 2PAA104346R0201 D-25
102 Section D Messages The following overview shows the explanations for the individual formats. The terms used are explained below the overview table. Value format Long format Long.li mit format Priority Time Plant area Priority Time Plant area Priority Time Plant area Tag name S-Text ST-Text Type Date Tag name S-Text L-Text Date Tag name S-Text L-Text Type Date System message Group Time Plant area Tag name Fault Text Date Priority Group Time Plant area Tag name S-Text L-Text ST-Text Measured value Type Date Priority of the message with sign for incoming (+) or outgoing ( ). Indicates the priority level by appropriate digit and associated color. System message group, specified by system (S1 S3). Time of occurrence of the message. The resolution is 1/1000s. Plant area to which the tag name is allocated. Description of the tag which triggered this message. Short text for the tag. Long text for the tag. Status text of the message. Measured value registered when the message was generated, e.g. limit value. Every message has a message type. For limit values, the message type is the limit value type (e.g. HH for the second high limit value). Only shown with the first message and after a date change. A date change is indicated by a horizontal red line. D-26 2PAA104346R0201
103 Section D Messages D Operate Menu The Operate menu for the message list contains the following menu items: Operate Priority filter System message filter Area filter Acknowledge block Acknowledge page Play sound file Stop sound file Horn off Long format D Operating Element Area The operating element area contains the followings buttons: Acknowledge page: Point-acknowledges all messages visible in the display area. Acknowledge block: Point-acknowledges all messages that are selected in the display area. Play sound file: Plays the sound file configured for a message. The button PLAY SOUND FILE can only be activated when 2PAA104346R0201 D-27
104 Section D Messages an sound file has been configured for the selected message. Once the button has been pressed, the selected sound file is played cyclically. Stop sound file: Stops playing the sound file. Via the Long format checkbox the tags are displayed in long format. See also List with Messages, Page D-25. When the format is toggled, any empty lines in the list are deleted. Via the Value format checkbox the tags are displayed in long format. See also List with Messages, Page D-25. When the format is toggled, any empty lines in the list are deleted. Via the Long / Limit format checkbox the tags are displayed in long format. See also List with Messages, Page D-25. When the format is toggled, any empty lines in the list are deleted. D Display of Different Priority Levels The different priority levels are displayed at the beginning of each list entry. The following symbols are used: The priority levels differ in background color and the appropriate digit. D Display of the Incoming / Outgoing Status The priority level of a message is indicated with a sign. The sign indicates the incoming (+) or outgoing ( ) status of the message. D-28 2PAA104346R0201
105 Section D Messages Incoming messages can also be recognized by their colored background. Outgoing messages are marked by colored text on a gray background. The symbol of unacknowledged messages is shown in color and is flashing. D 3.3 D Operation Calling up Faceplates After selecting the message of a tag, the associated faceplate can be called up. Double-click message Call up context menu of message Left-click associated faceplate Set focus to message list with ALT + Use CURSOR KEYS to select message Use SPACE BAR to select message ENTER 2PAA104346R0201 D-29
106 Section D Messages D Calling up Assigned Displays After selecting the message of a tag via the context menu, the displays assigned to this tag can be called up. Call up context menu of message Left-click appropriate display Use CURSOR KEYS to select message Use Space bar to select message SHIFT + F10 Select display D Acknowledge Messages by Page All messages on the current page of the message list will be point-acknowledged. In operating element area: Left-click Operate Acknowledge page ALT O C D Acknowledge Messages by Block All selected messages are point-acknowledged. Select messages In operating element area: Left-click D-30 2PAA104346R0201
107 Section D Messages Select messages Operate Acknowledge block Select messages ALT O B To provide a better overview, the gaps of the outgoing or deleted message in the display area are only filled when the message list is scrolled. You can also press the button to refresh the currently seen list. All gaps are closed then. 2PAA104346R0201 D-31
108
109 Section D Messages Index M Message line, D-11 Area view, D-14 List view, D-14 Standard view, D-12 Structure, D-11 Message list, D-16 Calling up, D-17 Header, D-19 Operation, D-23 Structure, D-19 Message types, D-4 Messages Acknowledgment, D-5 Acknowledgment level, D-6 Audio files, D-9 Priority levels, D-5 P Point acknowledgment, D-6 V Visual acknowledgment, D-5 2PAA104346R0201 D-33

110 E Overview Display
111
112 Overview Display Section E Contents E Overview Display...E-1 E 1 General Description Overview Display...E-5 E 2 Calling up an Overview Display...E-5 E 2.1 Calling up an Overview Display via the Toolbar...E-5 E 2.2 Calling up an Overview Display via the Display Menu Item...E-5 E 2.3 Calling up an Overview Display via the Context Menu...E-6 E 2.4 Calling up an Overview Display via the Graphic Display...E-7 E 3 Operation in the Overview Display...E-7 E 3.1 Display Selection from the Overview Display...E-8 E 4 Symbols for Individual Display Types...E-9 2PAA104346R0201 E-3
113
114 Overview Display Section E E 1 General Description Overview Display The process information from the whole plant can be presented in concentrated form in the overview display. One overview display can be configured for each DigiVis 500 operator station. When configuring the operator station, you can specify whether the default display or a user-configured display is to be used as the overview display. In the standard overview display the following display types can be selected: group display, trend display, graphic display and WEB-display. Logs and reports can also be called up directly from the overview display. An overview display comprises 16 lines of 6 columns; therefore up to 96 entries can be configured. E 2 E 2.1 Calling up an Overview Display Calling up an Overview Display via the Toolbar Left-click toolbar icon E 2.2 Calling up an Overview Display via the Display Menu Item Display Overview display Alt + D V 2PAA104346R0201 E-5
115 Section E Overview Display E 2.3 Calling up an Overview Display via the Context Menu Call up context menu Select Overview display E-6 2PAA104346R0201

116 Section E Overview Display E 2.4 Calling up an Overview Display via the Graphic Display Left-click accordingly configured graphic object Use TAB KEY to select appropriate graphic object ENTER E 3 Operation in the Overview Display vh_e0002_us.bmp If you want to see an area of the overview display currently not shown, move the scrollbar on the right hand side of the screen. 2PAA104346R0201 E-7
117 Section E Overview Display E 3.1 Display Selection from the Overview Display Left-click a display type symbol (group display, trend display, etc.) Use CURSOR KEYS to select a display type symbol ENTER E-8 2PAA104346R0201


118 Section E Overview Display E 4 Group display Symbols for Individual Display Types Graphic display Trend display Logs WEB display Report 2PAA104346R0201 E-9
119 Section E Overview Display Index O Overview display... E-5 Call-up... E-5 Display selection... E-7 Display type symbols... E-9 E-10 2PAA104346R0201
120 F Group Display
121
122 Section F Group Display Contents F Group Display...F-1 F 1 General Description Group Display...F-5 F 2 Calling up the Group Display...F-6 F 2.1 Calling up a Group Display via the Toolbar...F-6 F 2.2 Calling up a Group Display via the Display Menu Item...F-6 F 2.3 Calling up a Group Display via the Context Menu...F-6 F 2.4 Group Display Selection from the Overview Display...F-7 F 2.5 Calling up a Group Display via the Graphic Display...F-7 F 3 Operating Procedures in the Group Display...F-7 2PAA104346R0201 F-3
123

124 Section F Group Display F 1 General Description Group Display A group display is a collection of several faceplates. It offers the user the opportunity of displaying related functions in one display. After selecting one of the displayed faceplates the corresponding function is operable. The group display is assembled during configuration with DigiVis 500 Graphics Builder. In the group display, the faceplates are arranged in a grid. If it should not be possible to show all available faceplates at the same time in the display area, a horizontal scrollbar appears under the group display. vh_f0005_us.bmp 2PAA104346R0201 F-5
125 Section F Group Display F 2 F 2.1 Calling up the Group Display Calling up a Group Display via the Toolbar Left-click toolbar icon In Display Explorer double-click appropriate group display F 2.2 Calling up a Group Display via the Display Menu Item Display Group In Display Explorer double-click appropriate group display Ctrl + F7 Use cursor keys to select appropriate group display Enter F 2.3 Calling up a Group Display via the Context Menu In order to be able to call up a group display via the context menu, you must first select a tag to which a group display has been allocated in DigiVis 500 Graphics Builder using the Display access function. Select tag Call up context menu Select appropriate group display F-6 2PAA104346R0201
126 Section F Group Display F 2.4 Group Display Selection from the Overview Display Left-click appropriate graphic symbol Use CURSOR or TAB KEYS to select appropriate group display symbol ENTER F 2.5 Calling up a Group Display via the Graphic Display In order to be able to call up the group display using the graphic display you must first select a graphic object for which the Show display action with the group display has been configured in DigiVis 500 Graphics Builder. Left-click appropriate graphic symbol Use TAB KEY to select appropriate graphic object ENTER F 3 Operating Procedures in the Group Display You can directly operate the tags shown in the group display by clicking the appropriate faceplate. All user actions can be performed as required, provided that this has been enabled. Additionally, all tags of the group display are listed in the Operate menu and can be operated in the faceplate using the hotkeys ALT + B and the CURSOR KEYS. 2PAA104346R0201 F-7
127 Section F Group Display Further details can be found under Faceplates. F-8 2PAA104346R0201
128 Section F Group Display Index G Group display...f-5 Call-up...F-6 Operation...F-7 2PAA104346R0201 F-9
129 G Graphic Display
130
131 Section G Graphic Display Contents G 1 General Description Graphic Display... G-5 G 2 Calling up a Graphic Display... G-6 G 2.1 Calling up a Graphic Display via the Toolbar... G-6 G 2.2 Calling up a Graphic Display via the Display Menu Item... G-6 G 2.3 Calling up a Graphic Display via the Context Menu... G-6 G 2.4 Calling up a Graphic Display via the Overview Display... G-7 G 2.5 Calling up a Graphic Display from Another Graphic Display... G-7 G 3 Displaying a Graphic Display... G-8 G 3.1 Clipping Graphic Displays... G-8 G 3.2 Fully Visible Graphic Display... G-8 G 3.3 Graphic Display Centered... G-8 G 4 Operating Procedures in the Graphic Display... G-9 G 4.1 Selecting a Display in the Graphic Display... G-9 G 4.2 Selecting a Faceplate... G-9 G 4.3 Writing Process Variables... G-10 G 4.4 Acknowledging Messages... G-10 G 5 Dynamic Display Elements... G-11 G 5.1 Displaying Analog Values... G-11 G 5.2 Displaying Binary Signals... G-13 G 5.3 Trend Window in the Graphic Display... G-13 2PAA104346R0201 G-3
132

133 Section G Graphic Display G 1 General Description Graphic Display In addition to standard displays such as overview display, group displays or trend displays it is possible to create customized graphic displays. These graphic displays can contain static and dynamic display elements and can be designed as per the requirements of the plant operator. The static part can be, for example, the schematic structure of the plant as background display. vh_g0021_us.bmp Current process data and process state information can be presented in digital or analog form (e.g. bar graph, fill level or trend) in the required position as a dynamic foreground display Depending on the process status the graphic symbols can be alternated, the colors or positions in the display can be changed or colors can flash. With configurable display selection buttons and areas, a selection hierarchy for operation can be created within the free graphic displays. The graphic display shown here, together with a faceplate called up in addition,is a possible way of displaying current process data in plant-specific form in the DigiVis 500 system. 2PAA104346R0201 G-5
134 Section G Graphic Display G 2 G 2.1 Calling up a Graphic Display Calling up a Graphic Display via the Toolbar Left-click toolbar icon In Display Explorer double-click appropriate graphic display G 2.2 Calling up a Graphic Display via the Display Menu Item Display Graphic In Display Explorer double-click appropriate graphic display CTRL + F6 Use CURSOR KEYS to select appropriate graphic display ENTER CTRL + F6 Enter first characters of graphic display name ENTER G 2.3 Calling up a Graphic Display via the Context Menu In order to be able to call up a graphic display via the context menu, you must first select a tag to which a graphic display has been allocated in DigiVis 500 Graphics Builder using the Display access function. Select tag Call up context menu Select appropriate graphic display G-6 2PAA104346R0201

135 Section G Graphic Display G 2.4 Calling up a Graphic Display via the Overview Display Left-click appropriate graphic symbol Use CURSOR or TAB KEYS to select appropriate graphic symbol ENTER G 2.5 Calling up a Graphic Display from Another Graphic Display In order to be able to call up the graphic display using another graphic display you must first select a graphic object for which the Show display action with the graphic display has been configured in DigiVis 500 Graphics Builder. Left-click appropriate graphic symbol Use TAB KEY to select appropriate graphic object ENTER 2PAA104346R0201 G-7
136 Section G Graphic Display G 3 Displaying a Graphic Display The display of a graphic can be configured according to the monitor screen resolution. The available area for display of a graphic varies, for example, with different heights of the menu and status bars. A configured graphic display designed for another resolution is scaled for display, keeping the ratio of the sides constant. Thus, either the full height or the full width of the available area can be utilized. These settings are available under Tools in the Graphic group of the Options dialog box. G 3.1 Clipping Graphic Displays Tools Options Clip. The full width of the graphic is displayed in the available graphics area. Since the ratio of the sides is not changed by scaling, the lower area of the image may be clipped. G 3.2 Fully Visible Graphic Display Tools Options Fully visible The full height of the graphic is displayed in the available graphics area. Since the ratio of the sides is not changed by scaling, the right side of the screen may be unused. G 3.3 Graphic Display Centered Tools Options Centered The graphic display is centered on the screen. G-8 2PAA104346R0201
137 Section G Graphic Display G 4 Operating Procedures in the Graphic Display In addition to the visualization of process data, each dynamic graphic object can be configured with an action. This action is executed by a single click. Four types of action are available for each dynamic graphic object alternatively: Display or log selection Faceplate selection Writing of process variables with acknowledgement of writing actions as well as cancelation of writing actions Message acknowledgement G 4.1 Selecting a Display in the Graphic Display It is possible to jump to other graphic displays using a configured dynamic graphic object. This display change is initiated by left-clicking the graphic object. G 4.2 Selecting a Faceplate It is possible to call up any faceplate using a configured dynamic graphic object. This faceplate is called up by double-clicking the graphic object. 2PAA104346R0201 G-9
138 Section G Graphic Display G 4.3 Writing Process Variables Additionally, each dynamic graphic object in the graphic display offer the facility for manipulating analog and binary process variables. There are different options to manipulate process variables: You can write a new process variable in an edit field. Confirm the writing action with OK or ENTER. You can cancel the writing action at any time with ESC. You can continuously manipulate process variables by permanently clicking graphic elements (e.g. arrow keys). You can manipulate process variables within a certain range by shifting a graphic element (e.g. a cursor in a bargraph). You can write values to a set of variables (e.g. into variables linked to a button) If any OPC server is not accessible or if any controller linked to a particular OPC server is down and if the user tries to write a value into a variable, then the write operation is not possible for the entire set of variables. This feature is built in to ensure consistancy of data. G 4.4 Acknowledging Messages As configured a single left mouse click will process an acknowledgement to a set of messages. G-10 2PAA104346R0201
139 Section G Graphic Display G 5 Dynamic Display Elements vh_g0022_us.bmp User defined Macros are used to ease the creation of graphics and to create dynamic display elements. Macros are a combination of existing standard graphic elements as available in the Graphics editor. If graphics using macros are imported the dependent macros are imported as well. G 5.1 Displaying Analog Values Analog values can be displayed using bar graphs, fill levels, graphic object positioning and, of course, alphanumeric displays. Bar graph Display of analog values by filling a rectangular form, where the rectangle can be filled horizontally or vertically. Fill area Similar to a bar graph, but the area to be filled may be of any shape. Object position Symbols can be moved continuously in response to an analog value. dis- Alphanum. play Display of analog values in numerical form, in different sizes and colors. 2PAA104346R0201 G-11
140 Section G Graphic Display Changing values Left-click a numerical value Change value Controllable values can also be changed by scrolling the appropriate cursor. Subsequently confirm with. Use TAB KEY to select appropriate numerical value ENTER Change value ENTER G-12 2PAA104346R0201
141 Section G Graphic Display G 5.2 Displaying Binary Signals If configured, the color of graphic objects will change depending on the values of binary signals; depending on binary states, graphic objects may also be displayed in different positions. G 5.3 Trend Window in the Graphic Display The temporal progression of up to six measurement values can be tracked in a trend window. Unlike the trend display, the trend window in the graphic display does not include a history. This means that the trend window does not start displaying curves until the graphic display is called up. vh_g0023_us.bmp Operations in the trend window can always be executed via the context menu, and in some cases via the toolbar icons however the toolbar icons are only visible if this has been con- 2PAA104346R0201 G-13
 is clicked, the respective track is selected and can be operated in the Operate selected track menu.")
142 Section G Graphic Display figured in DigiVis 500 Graphics Builder! Below you can see the toolbar icons next to the menu items. Call up context menu vh_g0006_us.bmp Select When the button with the variable name (LI704 in the example) is clicked, the respective track is selected and can be operated in the Operate selected track menu. G-14 2PAA104346R0201
 change colors depending on the track selected in the upper left section of the trend window in the example red for track LI704.")
143 Section G Graphic Display Call up context menu Operate selected track Here you will find all operating options of a track. The associated five buttons (bottom left corner in the trend window ) change colors depending on the track selected in the upper left section of the trend window in the example red for track LI704. vh_g0004_us.bmp Up Shifts the selected trend upwards. Down Scrolls the selected trend downwards. Zoom + Halves the measurement range displayed for the selected trend (curve increases). Zoom Doubles the measurement range displayed for the selected trend (curve decreases). 2PAA104346R0201 G-15

144 Section G Graphic Display Show Select color The track selected in the context window or marked in the symbol is displayed in the trend window - in the example track LI704. Here you can modify the trend color. Call up context menu Operate time axis Here you can find all operating features of the time axis. These buttons (bottom right corner in the trend window) always remain the same. vh_g0005_us.bmp Time scroll right >> Scrolls the selected trend to the right (more towards the present time). << Time scroll left Scrolls the selected trend to the left (past). G-16 2PAA104346R0201
145 Section G Graphic Display Zoom X+ Halves the time displayed span. (spreads the curve horizontally) Zoom X- Doubles the time displayed span. (squeezes the curve horizontally) The trend window in the graphics display does not save the settings specified in the operating dialog. Each time it is called up the display commences with the originally configured settings. 2PAA104346R0201 G-17
146 Section G Graphic Display Index G Graphic display Bar graph...g-13 Call-up...G-7 Clipping...G-9 Display...G-9 Dynamic display elements...g-13 Fill area...g-13 Full view...g-9 Object position...g-13 Operation...G-11 Structure...G-5 Trend window...g-15 G-18 2PAA104346R0201

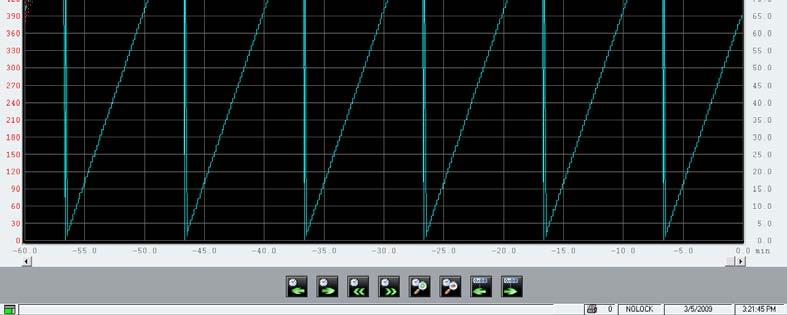
147 H Trend Display
148
149 Section H Trend Display Table of Contents H 1 General Description Trend Display... H-5 H 1.1 Operate Menu... H-7 H 2 Calling up a Trend Display... H-8 H 2.1 Calling up a Trend Display via the Toolbar... H-8 H 2.2 Calling up a Trend Display via the Display Menu Item... H-8 H 2.3 Calling up a Trend Display via the Context Menu... H-8 H 2.4 Calling up a Trend Display from the Overview Display... H-9 H 2.5 Calling up a Trend Display via the Graphic Display... H-10 H 3 Defining the Trend Display... H-10 H 3.1 Opening the Operation Dialog for User-defined Trend Displays... H-11 H 3.2 Creating a New Trend Display... H-13 H 3.3 Saving a User-defined Trend Display... H-16 H 3.4 Editing a Trend Display... H-16 H 3.5 Deleting a Trend Display... H-17 H 3.6 Exporting a Trend Display... H-17 H 3.7 Importing a Trend Display... H-17 H 4 Operations in the Trend Display... H-18 H 4.1 Value Area and Dialog Area... H-19 H Selecting a Trend in the Value Area... H-20 H Switching the Cursor On and Off... H-21 H Setting the Color of the Trend Curve... H-21 H Zooming the Trend Curve In/Out... H-21 H Scrolling the Trend Curve Vertically... H-22 H Showing/hiding the Trend Curve... H-22 H Calling up Assigned Displays... H-23 H 4.2 Trend Area... H-24 H Cursor Adjustment... H-25 H Scrolling the Displayed Time Range in the Trend Display... H-26 2PAA104346R0201 H-3
150 Section H Trend Display H 4.3 Scaling the Displayed Time Range in the Trend Display...H-27 H 4.4 Trend Display Options...H-27 H Opening the Trend Display Options Dialog...H-28 H Setting and Changing Options...H-29 H Resetting all Settings...H-33 H Saving the Trend File...H-33 H-4 2PAA104346R0201
151 Section H Trend Display H 1 General Description Trend Display A trend display is the visual representation of a trend recorder. It shows the temporal progression of analog and binary process variables as trend curves in an X-Y coordinate system, where up to six process variables can be graphically represented in a display. Trend displays can be configured in DigiVis 500 Graphics Builder and also defined by the user at the operator station. In a trend display, the operator can zoom in and out, show and hide, and scroll the display of the measured values. The OPC server is used for the acquisition of any variable. The minimum acquisition time for this is 1 second. Trend Archiving The trend values are archived based on the configuration in DigiVis 500 Graphics Builder. The process data is read in the configured cycle time and archived as per the configured duration. These archives are stored on the operator station. The archives can also be copied by FTP (File Transfer Protocol) to an FTP server. The target can also be a disk drive of an operator station. Using the DigiBrowse add-on, files can later be displayed and converted into CSV format for further processing. The number or size of trend archives is not limited by configuration, it depends on the PC s performance capacity. Missing parts of tracks or a sluggish response from DigiVis 500 Operations even as far as reaching inoperability may indicate that the system is overloaded. In this case, it is recommended to reduce the number of trend archives or increase the archiving cylce (acquisition cycle). Start-up Characteristics After changes have been made in DigiVis 500 Graphics Builder and downloaded to DigiVis 500 Operations, the trend display appears with the configured values. Previous changes if any to the display characteristicsmade by the user are lost. The default setting is used instead. Changes made by the operator after the download in DigiVis 500 Operations for visualization are stored. The next time it is called up, the trend display appears again with these settings until the next download to the same trend. 2PAA104346R0201 H-5
152 Section H Trend Display If the system time is set back by a time greater than the trend acquisition cycle (i.e. task cycle time * scan-down factor), the current trend archive file is closed and a new one is created. H-6 2PAA104346R0201
153 Section H Trend Display H 1.1 Operate Menu The Operate menu for the trend display contains the following menu items: Operate Select Operate selected track Up Down Zoom + Zoom - Show Select color Select marker Operate time axis Time scroll right >> Time scroll right > < Time scroll left << Time scroll left Zoom + Zoom - Cursor > < Cursor Options... Reset File transfer 2PAA104346R0201 H-7
154 Section H Trend Display H 2 H 2.1 Calling up a Trend Display Calling up a Trend Display via the Toolbar Left-click toolbar icon In Display Explorer double-click appropriate trend display H 2.2 Calling up a Trend Display via the Display Menu Item Display Trend In Display Explorer double-click appropriate trend display CTRL + F8 Use CURSOR KEYS to select appropriate trend display ENTER H 2.3 Calling up a Trend Display via the Context Menu To be able to call up a trend display via the context menu, you must first select a tag to which a trend display has been allocated in DigiVis 500 Graphics Builder using the Display access function. Select tag Call up context menu Select appropriate trend display H-8 2PAA104346R0201

155 Section H Trend Display H 2.4 Calling up a Trend Display from the Overview Display Left-click appropriate graphic symbol Use CURSOR or TAB KEYS to select appropriate trend display symbol ENTER 2PAA104346R0201 H-9
156 Section H Trend Display H 2.5 Calling up a Trend Display via the Graphic Display To be able to call up a trend display using the graphic display you must first select a graphic object for which the Show display action with the trend display has been configured in DigiVis 500 Graphics Builder. Left-click appropriate graphic symbol Use TAB KEY to select appropriate graphic object ENTER H 3 Defining the Trend Display In DigiVis 500 Operations, the operator can define up to 20 trend displays. Every display can comprise of up to six freely definable variables of the project. User-defined trend displays are intended for short-term records / analyses or optimization related to a specific situation. If you should need the trend for a longer time period, please contact your configuration engineer and let him configure the trend in DigiVis 500 Graphics Builder. User-defined trend displays can be changed, exported, or deleted at any time. A trend display that was previously exported can be imported again as new display. All these operations are carried out in the operation dialog for user-defined trend displays. In this dialog, all existing user-defined trends are displayed. When data is loaded from DigiVis 500 Graphics Builder to an operator station, it may happen that user-defined trend displays are deleted. It is, therefore, recommended to export your user-defined trend displays prior to this data loading process and then re-import them if required. H-10 2PAA104346R0201
157 Section H Trend Display H 3.1 Opening the Operation Dialog for User-defined Trend Displays Left-click toolbar icon Tools Define trend displays The operation dialog is opened. The list of the existing user-defined trend displays and all operating options are displayed. 2PAA104346R0201 H-11

158 Section H Trend Display vh_h0008_us.bmp H-12 2PAA104346R0201
 Long text Max.")
159 Section H Trend Display H 3.2 Creating a New Trend Display Open the operation dialog for user-defined trend displays. Tools Define trend display INSERT The new trend display is defined in the subsequent dialogs: vh_h0003_us.bmp Name Max. 12 characters (without spaces) Long text Max. 30 characters for free-form text 2PAA104346R0201 H-13

160 Section H Trend Display Acquisition Tab Display cycle time This cycle time is used for refreshing the trend display. Sample time Cycle time for the acquisition of new trend values. Variable Name of the variable whose values are acquired in the trend. Pressing function key F2 displays the list of variables known in the system for selection. Name, short text, dimension These texts are displayed at the trend curve in the display. After a variable is selected from the list, the variable name is used as name and the first 12 characters of the variable comment as short text. The text can be modified freely. Allocated tag Each trend curve may have a tag allocated to it. Using the F2 function key the available tags are displayed in a list for selection. Archive Tab On this tab you define whether and how trend data is to be archived. vh_h0004_us.bmp H-14 2PAA104346R0201
161 Section H Trend Display Enable archiving Delete old archive Archive name Archive duration Disk space req. The trend data is archived. The old archive is deleted when the operator station is rebooted (DigiVis 500 Operations restarted). If no active archiving has been set up, a single archive file (in the form of a ring buffer) of fixed size is created for each trend display on the operator station. In the event that archives do not match following a reboot, for instance if the number of trend curves has changed in the interim period, the old archive is saved as a file. The old archive files are given consecutive extensions from 001 to 999. The name of the trend is entered as the archive name. This name cannot be changed. Enter the archive duration according to the IEC time format. The period can be entered in days, hours, minutes and seconds. Minimum value 1 s, maximum value: 1d = 1 day. Examples: T#1d or T#20h31m23s The archive duration of the long-term archive determines the size of the trend file. This size can never exceed that of the trend file since the data is stored in a ring buffer. This means that once the archival period has been reached the current data always overwrites the oldest data. User-defined trend displays are intended for shortterm records/analyses and optimzation related to a specific situation. If you should need the trend for a longer time period, please contact your configuration engineer and let him configure the trend in DigiVis 500 Graphics Builder. Adjacent to the edit field for the archive duration the space required for the archive is automatically displayed in kilobytes. 2PAA104346R0201 H-15
162 Section H Trend Display H 3.3 Saving a User-defined Trend Display After all dialogs are edited, the definitions are saved with OK. The data that has been entered is checked and tested for plausibility. If any errors are encountered, these will be displayed. When data is loaded from DigiVis 500 Graphics Builder to an operator station, it may happen that user-defined trend displays are deleted. It is, therefore, recommended to export your user-defined trend displays prior to this data loading process and then re-import them if required. H 3.4 Editing a Trend Display Open the operation dialog for user-defined trend displays. Select appropriate trend display EDIT The same dialogs as for creating a trend display are shown. All entries can be changed. Save changes with OK. H-16 2PAA104346R0201
163 Section H Trend Display H 3.5 Deleting a Trend Display Open the operation dialog for user-defined trend displays. Select appropriate trend display DELETE The selected trend display is deleted without security dialog. H 3.6 Exporting a Trend Display Open the operation dialog for user-defined trend displays. Select appropriate trend display EXPORT vh_h0019_us.bmp You can change the displayed folder and file name. The definition of the selected trend display is stored in a *.UTR file. H 3.7 Importing a Trend Display Open the operation dialog for user-defined trend displays. IMPORT 2PAA104346R0201 H-17

164 Section H Trend Display vh_h0005_us.bmp In the displayed path, enter the name of the file to be imported and click OK. The system checks whether a trend display already exists on the DigiVis 500 Operations station with the same name as the import file. If a trend display exists you can decide whether to overwrite the existing trend with the imported data or whether to create a new trend display with a new name. H 4 Operations in the Trend Display vh_h0007_us.bmp H-18 2PAA104346R0201
165 Section H Trend Display After switching to the trend display, three new icons are shown in the toolbar on the right hand side. H 4.1 Value Area and Dialog Area The value area lists all variables with trends in this display and the associated information: Name Name of the variable. SCS Scale start for this trend on the Y axis. SCE Scale end for this trend on the Y axis. Actual The current value of the process variables. Cursor The present value of the process variable at the position of the cursor. Unit Unit of the process variable. Short text Configured short text for this trend. Allocated tag Name of the assigned tag. 2PAA104346R0201 H-19
166 Section H Trend Display The operation buttons are located on the left hand side in the dialog area: Switches cursor on/off. Selects color for trend curve. Zooms in trend curve (value range). Zooms out trend curve (value range). Scrolls trend curve downward. Scrolls trend curve upward. Shows/hides trend curve. H Selecting a Trend in the Value Area Left-click the appropriate trend in the value area Use TAB KEY to go to value area list Use CURSOR KEYS to select appropriate trend H-20 2PAA104346R0201
167 Section H Trend Display When the trend is selected in the trend area, the scaling configured for the trend is displayed to the left of the X-Y coordinate system. The scaling is shown with the same color as the trend. H Switching the Cursor On and Off In the dialog area, left-click Use TAB KEY to select Toggle with SPACE BAR H Setting the Color of the Trend Curve In the dialog area, left-click Use TAB KEY to select Toggle with SPACE BAR The color selection dialog is opened. This dialog window shows all available colors in a list. The colors are sorted by usage groups that can be shown/hidden. The individual color groups can be selected (keyboard: TAB key and ENTER) by left-click to the switches STATIC, MESSAGE, SIGNAL, MEDIA, and FREE. To reduce the number of colors displayed in the list, mark only the color groups that should be shown. Left-click appropriate color in color selection list OK Use CURSOR KEYS to select appropriate color ENTER H Zooming the Trend Curve In/Out The zoom function affects the scaling of the Y axis. 2PAA104346R0201 H-21
168 Section H Trend Display In dialog area: Left-click or This has the same effect as changing the band start and band end. See also page H-30, RESET in Setting and Changing Options. H Scrolling the Trend Curve Vertically In dialog area: Left-click or The zero point of the trend is moved upward or downward along the Y axis. This has the same effect as simultaneously increasing or decreasing band start and band end. See also page H-30, RESET in Setting and Changing Options. H Showing/hiding the Trend Curve In dialog area: Left-click or The trend curve is shown or hidden. H-22 2PAA104346R0201
169 Section H Trend Display H Calling up Assigned Displays If the appropriate tag are assigned, a trend can be selected in the value area and the displays assigned to this tag can be called up via the context menu. Select appropriate trend in value area Call up context menu Select display To open the faceplate of the assigned tag: Double-click selected trend in value area Select appropriate trend in value area Call up context menu 2PAA104346R0201 H-23
170 Section H Trend Display H 4.2 Trend Area The individual trends are displayed as curves in an X-Y coordinate system. There are two scale settings for the Y axis: on the right hand side it is always 0%...100%. On the left hand side, the scaling of a selected trend is in physical units. The scaling is displayed in the same color as the trend curve. The X axis represents the time axis. Depending on configuration or operation, the time display can be relative or absolute. See also page H-30, Current values in Setting and Changing Options. Below the coordinate system is a horizontal scroll bar, to adjust the visible time window backward in time for analyzing the trends. By using an adjustable cursor, past behavior of trends can be evaluated and compared to one another. The trend values are always acquired with OPC server time. The displayed time axis, however, is labeled with the current time. Times in the daylight saving time period are marked with S. As a result, no time gaps or double curves in the trend display result from the changeover from normal time to daylight saving time or vice versa. Time gaps within a trend curve are displayed by vertical red lines at the beginning and end. The size of a gap can be configured in the parameter definition mask of the trend display (see Engineering Manual, Operator Station, Standard Display, Trend Display). If no time gap detection is configured, the threefold cycle time is displayed as gap. Example: With a cycle time of 10 seconds, a data gap of 30 seconds is shown as gap in the trend, even if no gap detection is configured. H-24 2PAA104346R0201


171 Section H Trend Display vh_h0020_us.bmp H Cursor Adjustment vh_h0021.bmp 2PAA104346R0201 H-25
172 Section H Trend Display After calling up a trend display the cursor appears at the top of the right side Y axis. The timeof-day or the deviation to local time is shown in the cursor area. In trend area, left-click the X-Y coordinate system at the height of appropriate time Repeat left-click to switch or until cursor is positioned at appropriate time Repeat pressing ALT + < or ALT + > until cursor is positioned at appropriate time H Scrolling the Displayed Time Range in the Trend Display The time window for the trend display can be scrolled by the horizontal scroll bars or switches below the X-Y coordinate system. When the trend display is opened, the zero point (current time) is always located at the right edge of the time axis. The time window can also be scrolled with the buttons below the X-Y coordinate system: Function ALT + T Scroll time window in small steps to the left (step width one scale unit) ALT + E Scroll time window in small steps to the right (step width one scale unit) ALT + I Scroll time window in large steps to the left (step width one screen) H-26 2PAA104346R0201
173 Section H Trend Display ALT + M Scroll time window in large steps to the right (step width one screen) When the time window is scrolled to the left, the time display on the X axis changes automatically from relative to absolute. H 4.3 Scaling the Displayed Time Range in the Trend Display To facilitate better viewing, the X axis (time axis) can be expanded or compressed. This alters the resolution of the time axis. Effect ALT + + Expands the time axis (each click doubles the display width, which means that the time segment is cut in half) ALT + Compresses the time axis (each click cuts the display width in half, which means that the time segment is doubled) H 4.4 Trend Display Options In the Trend Display Options dialog you can make the settings for the displayed trend. The settings are related to the general layout of the trend display as well as to settings for individual trends. 2PAA104346R0201 H-27
174 Section H Trend Display H Opening the Trend Display Options Dialog After switching to the trend display, a new icon is shown in the toolbar on the right side. Left-click toolbar icon Operate Options ALT + O O H-28 2PAA104346R0201

175 Section H Trend Display H Setting and Changing Options vh_h0006_us.bmp Trend-independent Settings Time interval Duration Position at SET Range of the time window on the X axis for the trend display. Enter point in time (for positioning window at a specified time on the trend curve). Sets the window to the specified position. 2PAA104346R0201 H-29
176 Section H Trend Display Current values The right side of the trend shows the current process values. The X axis shows relative time values. Value window All lines Max. 3 lines All configured trends. A maximum of three trends displayed in text form. Colors You can adjust the colors for Foreground, Background and Window of the trend display. A click on the appropriate color field opens the color selection list. A click on RESET restores the default colors. Archive status Archive status display On Idle Emergency stop Off Archive is running. Archive status is controlled by function block input SEN from the allocated trend data acquisition. Internal emergency stop. No archive. OK CANCEL RESET All inputs are taken over and checked for plausibility. All entries are discarded and the dialog window is closed. All settings are reset to the configured values: - Trend display colors - Trend curve colors - Values window settings H-30 2PAA104346R0201

177 Section H Trend Display - Band start, band end, - Time range (with jump to present = current time). Trend-specific Settings Product <A> >> This button label is an example for Produkt <A>. The number of buttons corresponds to the number of trends configured for this trend display. These buttons are used to open the respective dialog for the trend specific settings: vh_h0017_us.bmp 2PAA104346R0201 H-31
178 Section H Trend Display Y-scaling The options Band start and Band end define the scaling of the Y axis for this trend. The position on the Y axis of the band start and band end can be set between 0% and 100% using band start % and band end %. The band start setting must always be less than the band end. This also applies to the band start % and band end %. The percentage values can be less than 0% and more than 100%. In this case the part of the trend not between 0% and 100% will be displayed as a line above 100% or below 0%. Band start and band end must be entered as real values. The value range is between 0.0 and ± The percentage values for band start and band end must be entered as integer values. The value range must be between and +5000%. Interpolation Marker Select None, Linear, or Steps. Select None, Point/Pixels, or Rectangle for the display of the cursors. If you select both for Interpolation and Marker the None option, the trend curve is not visible! di0559us.bmp H-32 2PAA104346R0201
179 Section H Trend Display Trend color The color for the display of the trend curve is defined as described earlier in this chapter. For further details see Setting the Color of the Trend Curve Page, H-21. RESET This button resets all settings for this trend curve to the default values. This applies, for example, to the Y-scaling, the markers, the interpolation, and the color. H Resetting all Settings The changes made in the settings of all trends can be reset to the default values. Left-click toolbar icon Operate Options Reset H Saving the Trend File A copy of the trend archive file can be saved on the configured disk drive. Left-click toolbar icon Operate File transfer 2PAA104346R0201 H-33
180 Section H Trend Display Index T Trend display Archive status...h-30 Call-up...H-8 Changing the time axis...h-27 Changing Y axis...h-21 Configuration in DigiVis 500 Operations...H-5 Cursor adjustment...h-26 Defining...H-10 Delete...H-17 Dialog area...h-19 Dimension...H-14 Display cycle time...h-14 Duration...H-29 Edit...H-16 Enable archiving...h-14 Export...H-17 Import...H-17 Interpolation...H-32 Moving Y axis...h-26 Name...H-14 Options...H-28 Reset...H-33 Rest settings...h-30 Sample time...h-14 Save...H-15 H-34 2PAA104346R0201
181 Section H Trend Display Saving the trend file... H-33 Scrolling the time window... H-26 Scrolling the trend curve vertically... H-22 Setting the color of the trend curve... H-21 Setting the cursor display shape... H-32 Short text... H-14 Showing/hiding the trend curve... H-22 Switch cursor on/off... H-21 Tag name... H-14 Transfer trend file... H-33 Trend area... H-24 Trend selection... H-20 User-defined trend displays... H-11 Value area... H-19 Variable... H-14 Y-scaling... H-31 Zooming... H-27 Zooming the trend curve in/out... H-21 Zooming Y axis... H-21 2PAA104346R0201 H-35
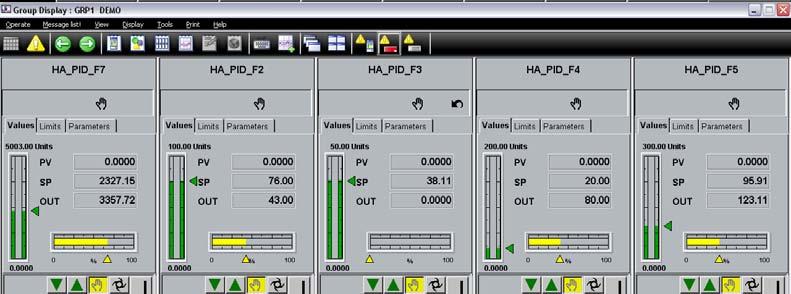
182 I Faceplates
183
184 Section I Faceplates Contents I 1 General Description Faceplates...I-5 I 2 Calling up a Faceplate...I-7 I 2.1 Calling up a Faceplate via the Toolbar...I-7 I 2.2 Calling up a Faceplate via the Display Menu Item...I-7 I 2.3 Calling up a Faceplate via the Context Menu...I-7 I 2.4 Calling up a Faceplate via a Group Display...I-8 I 2.5 Calling up a Faceplate via a Graphic Display...I-8 I 2.6 Calling up a Faceplate via the Message List...I-8 I 3 Structure and Operation of Faceplates...I-9 I 3.1 Basic Structure and Operation of Faceplates...I-9 I 3.2 Title Line and Faceplate Header...I-10 I 3.3 Message Area...I-11 I 3.4 Graphic Field...I-12 I Display and Operation in the Graphic Field...I-13 I Symbols and Abbreviations in the Graphic Field...I-15 I 3.5 Operating Element Area...I-16 I Operating the Switches in the Operating Element Area...I-16 I Continuous Change of Controller Output and Set Point...I-16 I Buttons in the Faceplates Operating Element Area...I-17 I 3.6 Display Selection...I-17 I 4 Faceplates for AC500 Function Blocks...I-18 I 4.1 Standard Library...I-18 I Timer, TP...I-18 I On-delay Timer, TON...I-19 I Off-delay Timer, TOFF...I-20 I Up Counter, CTU...I-21 I Down Counter, CTUD...I-22 I Up/Down Counter, CTD...I-23 2PAA104346R0201 I-3
185 Section I Faceplates I LIMITALARM... I-24 I 4.2 Utility Library... I-24 I PD... I-25 I PID... I-26 I PID_FIXCYCLE... I-28 I GEN... I-29 I RAMP_INT... I-30 I RAMP_REAL... I-31 I HYSTERESIS... I-32 I CLOCK Setting/ reading the clock and date... I-33 I HA_CONTROL... I-34 I HA_CS31_DIAG... I-35 I-4 2PAA104346R0201

186 Section I Faceplates I 1 General Description Faceplates In a faceplate you can observe and operate the associated tag. The information shown in the faceplate is cyclically polled and updated. This means, the faceplates always indicate the current state of the connected process. Faceplates provide both overview and detail information on tags. They can appear on the screen combined with either pre-configured or freely configurable displays. Each Tag type in the AC500 Tag Type library has a pre-configured faceplate. vh_i0008_us.bmp 2PAA104346R0201 I-5
187 Section I Faceplates A faceplate can be moved freely around the display area of the screen. For safety reasons, however, it cannot overlap the alarm line. When using two monitors, you cannot move the faceplate from one monitor to the other. Instead, you have to move the cursor to the second monitor and invoke the desired faceplate from there. A displayed faceplate stays on the screen until it is closed or replaced by another faceplate. A faceplate will thus remain on screen even when the display in the background is changed, such as during a change from an overview display to the message list. A maximum of 5 faceplates can be displayed simultaneously on the screen. If you open an additional faceplate, the system simultaneously closes the faceplate which had not been activated for the longest period. For additional hints about handling faceplates refer to Operating Philosophy. I-6 2PAA104346R0201
188 Section I Faceplates I 2 Calling up a Faceplate A faceplate can be displayed by several methods. When the appropriate tag is selectable on the screen (e. g. in a graphic display), the associated faceplate can be called up directly via the context menu. In every operating situation a tag in the tag list of the graphic display explorers can be selected and displayed in its faceplate (see Operating Philosophy). I 2.1 Calling up a Faceplate via the Toolbar Left-click toolbar icon In Display Explorer double-click appropriate tag I 2.2 Calling up a Faceplate via the Display Menu Item Display Faceplates In Display Explorer double-click appropriate tag CTRL + F5 Enter significant first character of tag and/or select appropriate tag with CURSOR KEYS ENTER I 2.3 Calling up a Faceplate via the Context Menu In order to call up a faceplate via the context menu, first select a tag. Right-click the tag or an area in the current display to which a tag has been assigned Left-click tag name in context menu 2PAA104346R0201 I-7
189 Section I Faceplates I 2.4 Calling up a Faceplate via a Group Display The group display is a configured collection of several faceplates (see Group Display). Double-click appropriate faceplate ALT + D Use CURSOR KEYS to select appropriate faceplate ENTER I 2.5 Calling up a Faceplate via a Graphic Display To be able to call up the faceplate using the graphic display you must first select a graphic object for which the Open faceplate action with the group display has been configured in DigiVis 500 Graphics Builder. Double-click appropriate graphic object Use TAB KEY to select appropriate graphic object ENTER I 2.6 Calling up a Faceplate via the Message List Double-click appropriate message Use CURSOR KEYS to select appropriate message ENTER I-8 2PAA104346R0201

190 Section I Faceplates I 3 I 3.1 Structure and Operation of Faceplates Basic Structure and Operation of Faceplates All faceplates have an identical basic structure. This provides important information about the displayed tags which can be instantly recognized. The width of a faceplate is 1/5 of the total screen width. All faceplates have the following structure: vh_i0009_us.bmp 2PAA104346R0201 I-9
191 Section I Faceplates I 3.2 Title Line and Faceplate Header vh_i00101_us The faceplate's title line contains the tag type and the function block class description (e.g. PID_FC1). On the right edge, the pin button to fixate the display and the Close button are located. When a faceplate is selected, the title line and the entire frame around the faceplate have a dark gray background. The tag name is displayed in the faceplate header, below it the short text is displayed. An icon shows the summary alarm state of the function block. For messages the faceplate header is displayed with a colored background according to the configured priority and a Caution icon. This colored background flashes as long as the message has not been acknowledged, just as the message line does (see Messages ). In each faceplate you can acknowledge all present messages of a tag by left-clicking the caution icon. I-10 2PAA104346R0201
192 Section I Faceplates I 3.3 Message Area vh_i00102_us.bmp In the message area all configured messages of the tag, to which a message priority has been assigned, are displayed as icons. In the event of an alarm the color changes or flashes according to the priority. Here, too, for every icon there is a tooltip that shows the configured message texts. In addition to the messages, tag states like the track mode can be visualized in the message area. The messages for the tag are always shown in the faceplate, even if these messages are not visible in the message line and message page because of the filters that have been configured for the station. The following table lists all icons in the message area of faceplates. The designations of the limit value types are shown in the message list. Change table (only 4 icons: get icons and description) Icon Meaning Limit value Process value is greater than configured limit value H Process value is smaller than configured limit value Process value is greater than configured limit value/ important L HH Process value is smaller than configured limit value/ important LL 2PAA104346R0201 I-11

193 Section I Faceplates Icon Meaning Limit value Monitoring of maximum control difference H_XD Monitoring of minimum control difference Monitoring of maximum control difference/important Monitoring of minimum control difference/important Monitoring of the size of control difference Monitoring of the maximum change rate Monitoring of the minimum change rate Monitoring a maximum change rate/high priority Monitoring a minimum change rate/important Monitoring of a ratio limit L_XD HH_XD LL_XD LH_XD DHs, DHm, DHh DLs, DLm, DLh DHHs, DHHm, DHHh DLLs, DLLm, DLLh H_V, L_V, HH_V, LL_V I 3.4 Graphic Field I-12 2PAA104346R0201
194 Section I Faceplates vh_i00103_us.bmp The graphic field of a faceplate has three tabs Values, Limits and Parameters. The Values tab displays the current values and states of the function block. The most important analog variables of a function block are displayed in engineering units and with corresponding markers. The changing actual value is generally framed within the usually static set point. If the operator can change the value associated with the outer bargraph, a green triangle is shown to the right of the bargraph. You can shift this triangle along the bargraph as required using the mouse. With this, you can set the displayed process variable to a new value. For blocks with discrete current states, texts for identifying the current state are displayed in the graphic field instead of the bargraphs. A current state is denoted by flashing red color Depending on the function block, the displayed process variables are arranged in the graphic field of up to three tabs called Values, Limits and Parameters. I Display and Operation in the Graphic Field All numerical values that can be changed or set by the operator (operator-controllable values) are denoted by gray highlighting. Selecting Tabs Left-click appropriate tab (Values, Limits, etc.) Use TAB KEY to select current tab Use CURSOR KEY to select appropriate tab Changing Values in the Graphic Field Left-click an operable numerical value Change value 2PAA104346R0201 I-13
195 Section I Faceplates Some values can also be operated by moving the slider symbol with the mouse. Subsequently confirm with. Use TAB KEY to select appropriate numerical value ENTER Change value ENTER If the button for confirmation of the entries is not actuated within 5 seconds, the input field is closed automatically and the previous value is restored. For further operations refer to Operating Element Area, Page I-16. I-14 2PAA104346R0201
196 Section I Faceplates I Symbols and Abbreviations in the Graphic Field The display of actual value of the graphic field uses the same symbols as the message area (see Message Area, Page I-11). The used abbreviations and their meanings are listed in the following table. Abbreviation Description CD IN PV RV RV S Sec Scale end Scale start SI SP ST T T TC TD TR Type Derivative gain Function block input Process value (actual value) Reset value Current ratio value Shut-off value Time scheduler sections High scale limit Low scale ID Step index Set point Status register, Current state Current test step duration Runtime since start resp. configured time in time scheduler Time, current value Derivative action Reset time Configured TIMER type 2PAA104346R0201 I-15
197 Section I Faceplates I 3.5 Operating Element Area vh_i0104_us.bmp The current operating modes of the function block are displayed in the operating element area and can be switched over. The PID (example) blocks can be reset by pressing a button. All operable buttons are marked with black icons, those that cannot be operated with gray icons. Current states are denoted by yellow buttons. I Operating the Switches in the Operating Element Area Left-click appropriate button Use TAB KEY to select appropriate button ENTER I Continuous Change of Controller Output and Set Point The controller function block allow for continuous adjustment of the set point and output. For this purpose, buttons with three colored triangles are provided. The colors correspond to the associated bargraphs: green for the setpoint, and yellow for the output. I-16 2PAA104346R0201
198 Section I Faceplates Left-click appropriate button Hold left mouse button down or repeat clicking until the appropriate value is reached The current value is shown as tooltip. A value change made with these buttons is directly written into the process station. No confirmation (with ENTER) is required. While the button is being pressed, the changes are written cyclically into the operation log. I Buttons in the Faceplates Operating Element Area Button Description Toggle manual/automatic Reset (yellow) (green) Decrease/increase output value Decrease/increase set point I 3.6 Display Selection At the time of this writing the buttons in the display selection area have no function. 2PAA104346R0201 I-17
199 Section I Faceplates I 4 I 4.1 Faceplates for AC500 Function Blocks Standard Library I Timer, TP Display Faceplate header Name, short text. Message area Not used Numerical display ON ON TP.bmp ET PT Elapsed time Pre-set time OFF OFF When OUT is true, ON is filled with yellow background color and when OUT is false, OFF is filled with yellow background color. Operator interventions none I-18 2PAA104346R0201

200 Section I Faceplates I On-delay Timer, TON Display Faceplate header Name, short text. Message area Not used Numerical display ON ON TON.bmp ET PT Elapsed time Pre-set time OFF OFF When OUT is true, ON is filled with yellow background color and when OUT is false, OFF is filled with yellow background color. Operator interventions none 2PAA104346R0201 I-19
201 Section I Faceplates I Off-delay Timer, TOFF Display Faceplate header Name, short text. Message area Not used Numerical display ON ON TOFF.bmp ET PT Elapsed time Pre-set time OFF OFF When OUT is true, ON is filled with yellow background color and when OUT is false, OFF is filled with yellow background color. Operator interventions none I-20 2PAA104346R0201
202 Section I Faceplates I Up Counter, CTU Display Faceplate header Name, short text Message area None Numerical display Q CV PV Output Counter actual value Preset value Operator interventions Reset = 1 will initialize the counter readings and RESET symbol is shown in the indication area. CTU.bmp 2PAA104346R0201 I-21

203 Section I Faceplates I Up/Down Counter, CTUD Display Faceplate header Name, short text Message area None Numerical display CTUD.bmp QU QD CV PV Output Output Counter actual value Preset value Operator interventions Reset = 1 will initialize the counter readings and RESET symbol is shown in the indication area. If LOAD = True, the counter variable CV will be initialized with the upper limit PV and flashing text with LOAD BUTTON ACTIVE will appear on the faceplate. When CounterUp is done (CV = PV), QU is true. When CounterDown is done (CV = 0 ), QD is true. I-22 2PAA104346R0201

204 Section I Faceplates I Down Counter, CTD Display Faceplate header Name, short text Message area None Numerical display Q CV PV Output Counter actual value Preset value Operator interventions Reset = 1 will initialize the counter readings and RESET symbol is shown in the indication area. If LOAD = True, the counter variable CV will be initialized with the upper limit PV. CTD.bmp 2PAA104346R0201 I-23

205 Section I Faceplates I LIMITALARM Display Faceplate header Name, short text. Message area Icon for time message, if a message has been configured for the set output Numerical display LIMIT ALARM.bmp IN HIGH LOW O U IL Input Upper limit Lower limit Output If IN > HIGH, then OUT is true.it is indicated by a red flashing triangle in the message area If IN < LOW, then U is true. It is indicated by a red flashing triangle in the message area. If IN is in between HIGH and LOW, then IL is true. I 4.2 Utility Library I-24 2PAA104346R0201

206 Section I Faceplates I PD Display Faceplate header Name, short text. Message area Icon for time message, if a message has been configured for the set output Numerical display PV Process value Values Tab: SP OUT Setpoint Output Limits Tab: Y_MIN, Y_MAX Output value limiters Parameters Tab: KP TV Gain Derivative time Graphical display SP, PV and OUT values are shown in bargraphs. Vertical bargraph: SP is shown in the outer bargraph and PV is shown in the inner bargraph. Horizontal bargraph: OUT is shown in this bargraph. Operator interventions SP can be altered in Auto and Manual modes (using arrow buttons or slider) OUT can be altered in Manual mode Confirmation button is used to commit the changes PD_1.bmp If reset=1, output is set to logic-0 signal and reset =0 will restore the PD output. 2PAA104346R0201 I-25

207 Section I Faceplates I PID Display Faceplate header Name, short text. Message area Icon for time message, if a message has been configured for the set output Numerical display PV Process value Values Tab: SP OUT Setpoint Output Limits Tab: Y_MIN, Y_MAX Output value limiters Parameters Tab: KP TN TV Gain Integral time Derivative time Graphical display SP, PV and OUT values are shown in bargraphs. Vertical bargraph: SP is shown in the outer bargraph and PV is shown in the inner bargraph. Horizontal bargraph: OUT is shown in this bargraph. Operator interventions SP can be altered in Auto and Manual modes (using arrow buttons or slider) PID_1.bmp OUT can be altered in Manual mode Confirmation button is used to commit the changes If reset =1, output is set to logic-0 signal and reset =0 I-26 2PAA104346R0201
208 Section I Faceplates will restore the PID output. Message acknowledgement 2PAA104346R0201 I-27

209 Section I Faceplates I PID_FIXCYCLE Display Faceplate header Name, short text. Message area Icon for time message, if a message has been configured for the set output Numerical display PV Process value Values Tab: SP OUT Setpoint Output CYCLE Limits Tab: Y_MIN, Y_MAX Output value limiters Parameters Tab: KP TN TV Gain Integral time Derivative time Graphical display SP, PV and OUT values are shown in bargraphs. Vertical bargraph: SP is shown in the outer bargraph and PV is shown in the inner bargraph. Horizontal bargraph: OUT is shown in this bargraph. Operator interventions SP can be altered in Auto and Manual modes (using arrow buttons or slider) OUT can be altered in Manual mode PIDFC.bmp Confirmation button is used to commit the changes I-28 2PAA104346R0201

210 Section I Faceplates If reset =1, output is set to logic-0 signal and reset =0 will restore the PID_FIXCYCLE output. Message acknowledgement I GEN Display Faceplate header Name, short text. Message area None Numerical display GEN.bmp MODE Defines the function to be generated (sine, cosine, ascending-, descending sawtooth, rectangular signal, triangular BASE PERIOD AMPLITUDE gener- CYCLE de OUT functions) Defines the cycle time Defines the amplitude of the ated signal Defines the number of cycles in a fined period of time Output Operator interventions Reset = 1 will set the function generator to 0 and Reset symbol will appear on the message area of the faceplate. 2PAA104346R0201 I-29
211 Section I Faceplates I RAMP_INT Display Faceplate header Name, short text. Message area None Numerical display ASCEND Ascend value (integer) DESCEND Descend value (integer) TIME BASE Base time IN Input OUT Output Operator interventions Reset = 1 will initialize the function block RAMP_INT.bmp I-30 2PAA104346R0201
 DESCEND Descend value (real) TIME BASE Base time IN Input OUT Output Operator interventions")
212 Section I Faceplates I RAMP_REAL Display Faceplate header Name, short text. Message area None Numerical display ASCEND Ascend value (real) DESCEND Descend value (real) TIME BASE Base time IN Input OUT Output Operator interventions Reset = 1 will initialize the function block RAMP_REAL.bmp 2PAA104346R0201 I-31

213 Section I Faceplates I HYSTERESIS Display Faceplate header Name, short text. Message area None Numerical display ON HIGH LOW IN OFF ON Upper limit Low limit Input value OFF When IN < LOW, then OUT is true and the ON indication is filled with yellow background color, When IN > HIGH, then OUT is false and the OFF indication is filled with yellow background color. HYS.bmp I-32 2PAA104346R0201

214 Section I Faceplates I CLOCK Setting/ reading the clock and date Display Faceplate header Name, short text. Message area Icon for time message, if a message has been configured for the set output Numerical display YEAR MONTH DAY HOUR MINUTE SECOND Operator interventions CLOCK.bmp SET and ENABLE buttons. When ENABLE = true then the system values for the parameters in the numerical display are updated in the ACTUAL column. When SET= true, values for the parameters can be specified in the SET column. On confirmation the SET values will be written into the ACTUAL values. When ERR=1, warning symbol with flashing red will appear in the message area. 2PAA104346R0201 I-33

215 Section I Faceplates I HA_CONTROL HA_CONTROL Block handles the AC500 HA Operation such as Change over from Primary to Secondary in case of fault with related diagnostics and also Data transfer between HA CPUs. Display Faceplate header Name, short text. Message area Icon for time message, if a message has been configured for the set output Numerical display EN ETH_SLOT IP_AD_PM1 CPU IP_AD_PM2 CPU ACK_CHG_OVER Enable Block Processing Ethernet Slot Number IP address of the AC500 connected to Line A IP address of the AC500 connected to Line B Acknowledgement of Change Over Event MANUAL_CHG_OVER Manual change over input HA_CONTROL.bmp DONE Completion of the Block Processing ERR Error occurred block proces- sing ERNO Error Number Operator interventions SET and ENABLE buttons. When ENABLE = true then the system values for the parameters in the numerical display are updated in the ACTUAL column. When SET= true, values for the parameters can be specified in the SET column. On confirmation the SET values will be written into the ACTUAL I-34 2PAA104346R0201
216 Section I Faceplates values. When ERR=1, warning symbol with flashing red will appear in the message area. I HA_CS31_DIAG HA_CS31_DIAG Block handles the control and status bytes of each CI590 Module on the CS31 BUS. It is also possible to find information such as Configured and Active CI590 Slaves available on CS31 BUS and related diagnostics. Display Faceplate header Name, short text. Message area Icon for time message, if a message has been configured for the set output Numerical display EN HA_COM Enable Block Processing CS31 Communication Port Number Error occurred block proc- ERR essing ERNO DONE Error Number Completion of the Block Processing HA_CS31.bmp CFG_CI590_COUNT Number of CI590 Slaves configured the PLC configuration ACT_CI590_COUNT Slaves in the CS31 BUS Number of active CI590 ACT_CI590_BITS Each bit of this DWORD represents an active CI590 in the CS31 BUS ERR_MIX_WIRING Error in case of Mix wiring between Line A and Line B of CI590 slaves When ERR=1, warning symbol with flashing red will 2PAA104346R0201 I-35
217 Section I Faceplates appear in the message area. I-36 2PAA104346R0201
218 Section I Faceplates Index A AC500 Tag Type library...i-4 C CLOCK...I-35 CTD...I-22 CTU...I-20 CTUD...I-21 D Down counter...i-21 F Faceplates Abbreviations...I-14 Call-up...I-6 Description...I-4 Structure...I-8 G GEN...I-31 H HA_CONTROL...I-36 HA_CS31_DIAG...I-37 HYSTERESIS...I-34 L Limit Alarm...I-23 LIMITALARM...I-23 2PAA104346R0201 I-37
219 Section I Faceplates P PD... I-25 PID... I-27 PID_FIXCYCLE... I-30 R RAMP_INT... I-32 RAMP_REAL... I-33 S Setting/reading the clock and date... I-35 T Timer... I-17 Timer, Off delay... I-19 Timer, On delay... I-18 TOFF... I-19 TON... I-18 TP... I-17 U Up counter... I-20 Up/Down counter... I-22 I-38 2PAA104346R0201
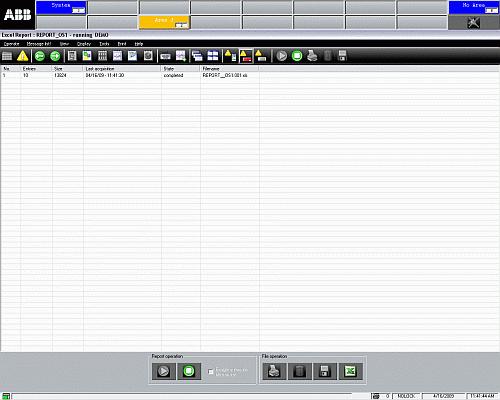
220 K Reports
221
222 Section K Reports Contents K 1 General Description Reports... K-4 K 1.1 File transfer...k-4 K 1.2 Operate Menu...K-6 K 2 Calling up Reports... K-6 K 2.1 Calling up Reports via the Toolbar...K-6 K 2.2 Calling up Reports via the Display Menu Item...K-6 K 2.3 Calling up Reports via the Context Menu...K-8 K 2.4 Calling up Reports from the Overview Display...K-8 K 2.5 Calling up Reports via a Graphic Display...K-8 K 3 Operating... K-10 K 3.1 Starting the Reports...K-11 K 3.2 Stopping the Reports...K-11 K 3.3 Printing a Report File...K-12 K 3.4 Deleting a Report File...K-12 K 3.5 Enabling Automatic File Transfer...K-13 K 3.6 Initiating Manual File Transfer...K-13 K 3.7 Updating report Files...K-14 2PAA104346R0201 K-3
223 Section K Reports K 1 General Description Reports Reports are used to acquire and store data in user defined MS Excel templates. K 1.1 File transfer Using the file transfer function it is possible to transfer a copy of the report file from the local DigiVis 500 Operations PC to another PC. The target PC must have a network communication connection (FTP) to the DigiVis 500 Operations PC. Normally, report files are sent directly to another PC on the network. It is, however, also possible to transfer them to another drive of the local DigiVis 500 Operations PC. The file transfer target is configured in DigiVis 500 Graphics Builder and cannot be changed in DigiVis 500 Operations. After calling up a report, the title line indicates the type of the report plus the report name, short text and long text. A list of the report files available is displayed below the toolbar. The list header contains the following information: Sequential number Number of entries Size of the report Last acquisition State Name of the report States The following States can be indicated for the report: acquiring Indicates that the data for the report is being acquired K-4 2PAA104346R0201

224 Section K Reports completed Indicates the completion of the data acquisition. The report is ready to be viewed. deleted Indicates that the report has been deleted from the database. vh_l0010_us.bmp 2PAA104346R0201 K-5
225 Section K Reports K 1.2 Operate Menu The Operate menu for logs contains the following menu items. Operate Start Stop Print... Delete... File transfer Split Details only File list only K 2 K 2.1 Calling up Reports Calling up Reports via the Toolbar Left-click toolbar icon for logs In Display Explorer double-click appropriate report K 2.2 Calling up Reports via the Display Menu Item Display Log In Display Explorer double-click appropriate report K-6 2PAA104346R0201
226 Section K Reports CTRL + F9 Use CURSOR KEYS to select appropriate report or enter first character of report name ENTER 2PAA104346R0201 K-7
227 Section K Reports K 2.3 Calling up Reports via the Context Menu In order to be able to call up a log via the context menu, you must first select a tag to which a log has been allocated in DigiVis 500 Graphics Builder using the Display access function. Select tag Call up context menu Select REP K 2.4 Calling up Reports from the Overview Display Left-click appropriate report symbol Use CURSOR or TAB KEYS to select appropriate report symbol ENTER K 2.5 Calling up Reports via a Graphic Display In order to be able to call up a report via a graphic display you must first select a graphic object for which the Show display action with the log has been configured in DigiVis 500 Graphics Builder. K-8 2PAA104346R0201
228 Section K Reports Left-click appropriate graphic symbol Use TAB KEY to select appropriate graphic object ENTER 2PAA104346R0201 K-9
229 Section K Reports K 3 Operating Three methods are available for operating the individual reports in the DigiVis 500 system: via the buttons in the toolbar, via menu item Operate (mouse and keyboard operation), via the buttons in the bottom operating element area. K-10 2PAA104346R0201
230 Section K Reports K 3.1 Starting the Reports Logging can be started by user interaction only if Manual starting and stopping has been enabled in DigiVis 500 Graphics Builder during configuration. Logging can be started if: logging has not been started yet, the maximum number of report files has been reached and Automatic delete is enabled. In toolbar or operating element area: Left-click Operate Start Alt O S Do not access the report file when data acquisition is in progress. This will cause the data acquisition to be aborted and will thus lead to loss of data. K 3.2 Stopping the Reports Logging can be stopped by user interaction only if Manual starting and stopping has been enabled in DigiVis 500 Graphics Builder during configuration. In toolbar or operating element area: Left-click Operate Stop Alt O T 2PAA104346R0201 K-11
231 Section K Reports K 3.3 Printing a Report File The contents of the selected log file can be printed only if Manual print was expressly enabled for this log in DigiVis 500 Graphics Builder during configuration. In toolbar or operating element area: Left-click Operate Print Alt O T Call up context menu Print K 3.4 Deleting a Report File The selected report file can be deleted only if Manual delete was expressly enabled for this report in DigiVis 500 Graphics Builder during configuration. In toolbar or operating element area: Left-click Operate Delete Call up context menu Delete Alt O D K-12 2PAA104346R0201
232 Section K Reports K 3.5 Enabling Automatic File Transfer If automatic file transfer is enabled, the report data is copied to the specified target folder either cyclically or after closing a file, depending on the configuration. Automatic file transfer can only be enabled or disabled if Manual enable and disable was expressly enabled in DigiVis 500 Graphics Builder during configuration. In operating element area: Mark checkbox In order to disable automatic file transfer, the checkmark must be removed again. K 3.6 Initiating Manual File Transfer The data of the selected report file is copied to another computer or another folder according to the configuration. With this, it is also possible to transfer report files that have not yet been completed. Manual file transfer can be initiated only if Manual controlled was enabled in DigiVis 500 Graphics Builder during configuration. In toolbar or operating element area: Left-click Operate File transfer 2PAA104346R0201 K-13
233 Section K Reports Alt O F K 3.7 Updating report Files The list of available report files is automatically updated. The contents of the respective log file can be updated manually. In operating element area: Left-click Alt + K K-14 2PAA104346R0201
234
235 Section K Reports Index K-16 2PAA104346R0201
236
237 Section K Reports R Reports... K-4 delete... K-14 Enabling automatic File Transfer... K-15 File transfer... K-4 Initiating manual File Transfer... K-15 Operation... K-7, K-11 print... K-14 start... K-12 stop... K-12 update... K-16 K-18 2PAA104346R0201
238
239 Section K Reports K-20 2PAA104346R0201
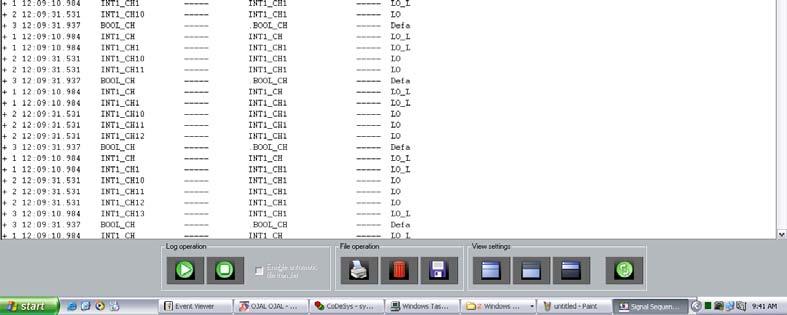
240 L Logs
241
242 Section L Logs Contents L 1 General Description - Logs...L-5 L 1.1 Operate Menu...L-8 L 2 Calling up Logs...L-8 L 2.1 Calling up Logs via the Toolbar...L-8 L 2.2 Calling up Logs via the Display Menu Item...L-8 L 2.3 Calling up Logs via the Context Menu...L-10 L 2.4 Calling up Logs from the Overview Display...L-10 L 2.5 Calling up Logs via a Graphic Display... L-10 L 3 Operating...L-12 L 3.1 Changing the View Settings...L-12 L 3.2 Starting the Logging...L-14 L 3.3 Stopping the Logging...L-14 L 3.4 Printing a Log File...L-16 L 3.5 Deleting a Log File...L-17 L 3.6 Enabling Automatic File Transfer...L-17 L 3.7 Initiating Manual File Transfer...L-18 L 3.8 Updating Log Files...L-18 L 4 Operation Log...L-19 L 4.1 Displaying the Operation Log... L-19 L 4.2 Operating the Operation Log... L-21 L 4.3 Operation Log Format...L-22 L 5 Signal Sequence Log...L-22 L 5.1 Displaying the Signal Sequence Log...L-22 L 5.2 Operating the Signal Sequence Log...L-24 L 5.3 Signal Sequence Log Format...L-26 2PAA104346R0201 L-3
243
244 Section L Logs L 1 General Description - Logs Logs are used to chronologically document historical events, states and sequences from the process and from the DigiVis 500 system. Logs are output to the printer, screen or (by data transfer) to data storage devices. A distinction is made between various types of logs: Event logs These are used for logging events such as messages, faults, switching actions and operator interventions. Logging is performed spontaneously when the event takes place. Protocol type: Signal sequence log State logs These are used for cyclical logging of process states. This includes the cyclical logging of a tag s status or the logging of events in the process. Protocol type: Operation log. Number of logs The following logs can be set up per operator station: Operation log Signal sequence log 1 Signal sequence log N max. four logs max. one log max. three logs 2PAA104346R0201 L-5
245 Section L Logs File transfer Using the file transfer function it is possible to transfer a copy of the log file from the local DigiVis 500 Operations PC to another PC. The target PC must have a network communication connection (FTP) to the DigiVis 500 Operations PC. Normally, log files are sent directly to another PC on the network. It is, however, also possible to transfer them to another drive of the local DigiVis 500 Operations PC. The file transfer target is configured in DigiVis 500 Graphics Builder and cannot be changed in DigiVis 500 Operations. To visualize the exported files, use the add-on program DigiBrowse. This also offers conversion of the files to the standard CSV format, so that an evaluation with other programs (e.g. MS Excel) is then possible. After calling up a log, the title line indicates the log type plus the log name, short text and long text. A list of the available log files is displayed below the toolbar. The contents of the first log file is shown below that list. The list header contains the following information: Sequential number, number of entries Time specified for the start of logging Time specified for the end of logging (if already terminated) Log state States The following States can be indicated for the log: deleted The log file is automatically deleted when the configured maximum number of files that can be archived is reached and automatic deletion has been enabled. When the screen view is changed, these files are deleted from the log list. printed The log file was printed. L-6 2PAA104346R0201

246 Section L Logs printing The log file is currently being printed. in printer queue The log file was entered into the printer queue. vh_l0002_us.bmp You can easily identify the current log file as it already has an entry in the Start column, but no entry in the End column. The operation of the operation log, and signal sequence log is largely identical. Therefore, it is described once for all log types. 2PAA104346R0201 L-7
247 Section L Logs L 1.1 Operate Menu The Operate menu for logs contains the following menu items. Operate Start Stop Print... Delete... File transfer Split Details only File list only L 2 L 2.1 Calling up Logs Calling up Logs via the Toolbar Left-click toolbar icon In Display Explorer double-click appropriate log L 2.2 Calling up Logs via the Display Menu Item Display Logs In Display Explorer double-click appropriate log L-8 2PAA104346R0201
248 Section L Logs CTRL + F9 Use CURSOR KEYS to select appropriate log or enter first character of log name ENTER 2PAA104346R0201 L-9
249 Section L Logs L 2.3 Calling up Logs via the Context Menu In order to be able to call up a log via the context menu, you must first select a tag to which a log has been allocated in DigiVis 500 Graphics Builder using the Display access function. Select tag Call up context menu Select appropriate log L 2.4 Calling up Logs from the Overview Display Left-click appropriate log symbol Use CURSOR or TAB KEYS to select appropriate log symbol ENTER L 2.5 Calling up Logs via a Graphic Display In order to be able to call up a log via a graphic display you must first select a graphic object for which the Show display action with the log has been configured in DigiVis 500 Graphics Builder. L-10 2PAA104346R0201
250 Section L Logs Left-click appropriate graphic symbol Use TAB KEY to select appropriate graphic object ENTER 2PAA104346R0201 L-11
251 Section L Logs L 3 Operating Three methods are available for operating the individual logs in the DigiVis 500 system: via the buttons in the toolbar, via menu item Operate (mouse and keyboard operation), via the buttons in the bottom operating element area. L 3.1 Changing the View Settings The logs can be viewed in various modes: you can split the log, view a detail only, or view a file list only. Split The upper display area shows the list of log files, the lower the contents of the selected log. When a log is called up, the first file of the list is highlighted. Click with the mouse or use the CURSOR KEYS (, )o select a different file from the list. In toolbar or operating element area: Left-click. Operate Split Alt O L Detail only Contents of selected log, only L-12 2PAA104346R0201
252 Section L Logs In toolbar or operating element area: Left-click. Operate Detail only ALT O E File list only List of log files, only In toolbar or operating element area: Left-click. Operate File list only. ALT O O 2PAA104346R0201 L-13
253 Section L Logs L 3.2 Starting the Logging Logging can be started by user interaction only if Manual starting and stopping has been enabled in DigiVis 500 Graphics Builder during configuration. Logging can be started if: logging has not been started yet, the maximum number of log files has been reached and Automatic delete is enabled. In toolbar or operating element area: Left-click. Operate Start Alt O S L 3.3 Stopping the Logging Logging can be stopped by user interaction only if Manual starting and stopping has been enabled in DigiVis 500 Graphics Builder during configuration. In toolbar or operating element area: Left-click Operate Stop L-14 2PAA104346R0201
254 Section L Logs Alt O T 2PAA104346R0201 L-15

255 Section L Logs L 3.4 Printing a Log File The contents of the selected log file can be printed only if Manual print was expressly enabled for this log in DigiVis 500 Graphics Builder during configuration. In toolbar or operating element area: Left-click. Operate Print Alt O T Call up context menu Print In the following dialog you can define what is to be printed: either the Complete selected log file, the Current page or a range of Pages. vh_l0011_us.bmp L-16 2PAA104346R0201
256 Section L Logs L 3.5 Deleting a Log File The selected log file can be deleted only if Manual delete was expressly enabled for this log in DigiVis 500 Graphics Builder during configuration. In toolbar or operating element area: Left-click. Operate Delete Call up context menu Delete Alt O D L 3.6 Enabling Automatic File Transfer If automatic file transfer is enabled, the log data is copied to the specified target folder either cyclically or after closing a file, depending on the configuration. Automatic file transfer can only be enabled or disabled if Manual enable and disable was expressly enabled in DigiVis 500 Graphics Builder during configuration. vh_l0013_us.bmp 2PAA104346R0201 L-17
257 Section L Logs In operating element area: Mark checkbox In order to disable automatic file transfer, the checkmark must be removed again. L 3.7 Initiating Manual File Transfer The data of the selected log file is copied to another computer or another folder according to the configuration. With this, it is also possible to transfer log files that have not yet been completed. Manual file transfer can be initiated only if Route manual file transfer was enabled in DigiVis 500 Graphics Builder during configuration. In toolbar or operating element area: Left-click. Operate File transfer Alt O F L 3.8 Updating Log Files The list of available log files is automatically updated.the contents of the respective log file can be updated manually. In operating element area: Left-click. Alt + K L-18 2PAA104346R0201
258 Section L Logs L 4 Operation Log The operation log is one of the state logs. It is used for logging process variables. To allow for a better understanding, configured texts can be added to the process variables. The operation log can be started manually, cyclically, or by a specific event. L 4.1 Displaying the Operation Log Left-click appropriate log file Use cursor keys to select appropriate log file 2PAA104346R0201 L-19
259 Section L Logs vh_l0017_us.bmp L-20 2PAA104346R0201
260 Section L Logs L 4.2 Operating the Operation Log For details about operating the log refer to Operating, Page L-12. The operation log file may consist of several pages. Once the log file has been opened, the appropriate page can be directly selected. In the bottom operating element area you can find the appropriate edit field. vh_l0018_us.bmp Edit field for the page number and button for scrolling backwards and forwards one page at a time. The numbers of the current page and last page are shown in the window title bar in the format: Current page / Last page Selecting a Page in a Log Left-click in edit field Enter page number Use TAB KEY to select edit field Enter page ENTER Scrolling Backwards and Forwards one Page at a Time Left-click button to scroll backwards and forwards Use TAB KEY to select button ENTER 2PAA104346R0201 L-21
261 Section L Logs The current page number is displayed in the entry field. L 4.3 Operation Log Format The operation log does not have a fixed format because its configuration in DigiVis 500 Graphics Builder allows text to be freely combined with formatted process variable values. L 5 Signal Sequence Log The signal sequence log is used for logging events and operator interventions and is, therefore, classified as an event log. This means, the data (events) are not polled and recorded cyclically, but only when an event occurs. A distinction is made between two types of signal sequence logs: Signal sequence log 1 outputs events to a printer constantly as they occur. This log guarantees that events are printed out in strict chronological order. Signal sequence log N does not output the events to the printer until the end of logging or until an operator intervention initiates printing. L 5.1 Displaying the Signal Sequence Log Left-click appropriate log file Use cursor keys to select appropriate log file L-22 2PAA104346R0201
262 Section L Logs vh_l0019_us.bmp 2PAA104346R0201 L-23
263 Section L Logs L 5.2 Operating the Signal Sequence Log For details about operating the log refer to Operating, Page L-12. The signal sequence log is not divided into separate pages. It is, therefore, not possible to directly specify a page as with the operation log. The color scheme of the text and background can be changed for a better overview when displaying the signal sequence log. Tools Options Alt T P In the following dialog, you can define the color scheme for text and background. L-24 2PAA104346R0201
264 Section L Logs vh_l0020_us.bmp 2PAA104346R0201 L-25
265 Section L Logs L 5.3 Signal Sequence Log Format The format of the signal sequence log is largely identical to the format of the message list. The first and last lines each contain a time marker comprising the date and time of day. The time marker in the first line of the signal sequence log represents the log s start time. The time marker in the last line represents the log s stop time. In addition to this, another time marker is output every hour while a log is being compiled. In between these time markers are the various event entries. Messages can be represented in any of the following four formats: Empty (none), Value, Long text, Long/Limit or All. The definition which event is displayed in which format is made in DigiVis 500 Graphics Builder during configuration. Additionally, the length of the log lines (80 or 132 characters) is specified. The following overview shows the explanations for the individual formats. The abbreviations used are explained on the next page in alphabetical order. Format for all messages No entry (Format Empty) Format for Process Messages M TIME AR TAG S-TEXT M-TEXT TYPE (Format Value) M TIME AR TAG S-TEXT L-TEXT M-TEXT (Format Long text) M TIME AR TAG S-TEXT L-TEXT M-TEXT TYPE (Format All) Format for System Messages M TIME AR TAG SYS-M-TEXT (Format Value, Long, All) L-26 2PAA104346R0201
266 Section L Logs Format for Operator Actions B TIME OPERATOR TAG COMPONENT OLD NEW (Format Value, Long, All) B TIME OPERATOR DISPL VAR-NAME OLD NEW (Format Value, Long, All) Format for Acknowledge Action B TIME OPERATOR TAG TYPE M-TEXT ACK (Format Value, Long, All) Formats for Log Events! TIME L-NAME S-TEXT EVENT (Format Value, Long)! TIME L-NAME S-TEXT L-TEXT EVENT (Format All) 2PAA104346R0201 L-27
267 Section L Logs Abbreviations! Indication of a log event. AR BIN-TEXT COMPONENT DISPLAY EVENT L-NAME L-TEXT M M-TEXT NEW O OLD OPERATOR S-TEXT SYS-M-TEXT TAG TIME TYPE VAR-NAME Plant area. If a line length of 132 characters has been configured, the long names of the plant areas are shown. With a line length of 80 characters the short names A O appear instead Fixed text: Channel xx, sequence of events. Component for the tag being written. Name of the graphic display from which the interaction was initiated. Log event such as Start, Stop, Print, Delete, and Export. Log name. Long text configured for the tag. All messages are displayed with their priority (S1..S3 or 1..5) and a prefix for incoming (+) and outgoing ( ). Acknowledged messages are marked with < or >: < Acknowledgment was carried out in the message list, a graphic display, or a faceplate. > Acknowledgment was carried out in the message line. Message text configured for a message. New value of the process variable. Indication of operator action. Old value of the process variables. If the add-on program DigiLock is installed, this position contains the name of the operator who carried out the operator interaction. In the base version without DigiLock the default user name NOLOCK or SYSTEM is entered. Short text configured for the tag. Text of system message. Name of the tag. Time stamp. Configured message type. Name of the process variable being written. L-28 2PAA104346R0201
268 Section L Logs Index L Logs Changing the view...l-13 File transfer...l-19 Operation...L-13 O Operation log...l-21 Example...L-21 Format...L-24 S Signal sequence log...l-25 Example...L-25 Format...L-29 2PAA104346R0201 L-29
269
270 Section L Logs 2PAA104346R0201 L-31
271 M Information Display
272
273 Section M Information Display Contents M 1 General Description Information Display...M-5 M 2 Calling up the Information Display...M-5 M 2.1 Calling up the Information Display via the Display Menu Item...M-5 M 2.2 Calling up the Infomation Display via the Context Menu...M-5 M 3 Operating Procedures in the Information Display...M-5 2PAA104346R0201 M-3
274
275 Section M Information Display M 1 General Description Information Display Information display contains general information on the DigiVis 500 system and diagnostic optins. M 2 Calling up the Information Display M 2.1 Calling up the Information Display via the Display Menu Item Display Information Display ALT + D I M 2.2 Calling up the Infomation Display via the Context Menu To be able to call up a Information display via the context menu, you must first select a tag to which a Information display has been allocated in DigiVis 500 Graphics Builder using the Display access function. Select tag Call up context menu Select appropriate Information display. M 3 Operating Procedures in the Information Display The following operations are defined in the Information Display. Enter diagnostic mode Leave diagnostic mode 2PAA104346R0201 M-5
276 Section M Information Display Start OPC diagnostic server Stop OPC diagnostic server These options are used for diagnostic purposes and are to be used only by L3 support personnel or under specific instructions from the L3 support personnel. M-6 2PAA104346R0201
277 Section M Information Display Index I Information display...m-5 Diagnostic mode...m-5 Operation...M-5 Start/Stop Diagnostic server...m-6 2PAA104346R0201 M-7
278
279 Section M System Display 2PAA104346R0201 M-9

280 N WEB Display
281
282 Section N WEB display Contents N 1 General Description WEB Display... N-5 N 2 Calling up the WEB display... N-5 N 2.1 Calling up the WEB Display via the Toolbar... N-5 N 2.2 Calling up the WEB Display via the Display Menu Item... N-5 N 2.3 Calling up the WEB Display via the Context Menu... N-6 N 2.4 Calling up the WEB Display from the Overview Display... N-7 N 2.5 Calling up the WEB Display via a Graphic Display... N-7 N 3 Operating Procedures in the WEB Display... N-7 2PAA104346R0201 N-3
283
284 Section N WEB display N 1 General Description WEB Display If you call up a WEB display in DigiVis 500 operations, the local WEB browser will be started and the link to the configured WEB site will be activated. The WEB display starts the local WEB browser. With this, DigiVis 500 operations users may access files on the local machine or other machines in the intranet or global internet. Mind the risks and dangers implied by this. N 2 N 2.1 Calling up the WEB display Calling up the WEB Display via the Toolbar Left-click toolbar icon In Display Explorer double-click appropriate WEB display N 2.2 Calling up the WEB Display via the Display Menu Item Display WEB... In Display Explorer, double-click appropriate WEB display ALT + D W Use CURSOR KEYS to select the appropriate WEB display ENTER 2PAA104346R0201 N-5
285 Section N WEB Display N 2.3 Calling up the WEB Display via the Context Menu To be able to call up a WEB display via the context menu, you must first select a tag to which a WEB display has been allocated in Control Builder F using the Display access function. Select tag Call up context menu Select appropriate WEB display. N-6 2PAA104346R0201
286 Section N WEB display N 2.4 Calling up the WEB Display from the Overview Display Left-click appropriate WEB display icon Use CURSOR or TAB KEYS to select appropriate WEB display icon ENTER N 2.5 Calling up the WEB Display via a Graphic Display In order to be able to call up the WEB display using the graphic display you must first select a graphic object for which the Show display action with the WEB display has been configured in Control Builder F. Left-click appropriate graphic symbol Use TAB KEY to select appropriate graphic object ENTER N 3 Operating Procedures in the WEB Display The operating procedures in the WEB display are given by the activated WEB site. 2PAA104346R0201 N-7
287 Section N WEB Display Index WEB display, N-5 Call-up, N-5 Operation, N-7 N-8 2PAA104346R0201
288 Section N WEB display 2PAA104346R0201 N-9

289 V System Messages
290
291 Section V System Messages Message text: The text is displayed in the message list or the signal sequence log Pr Priority level S1, S2 or S3 MR Message rate: 1 = Message with one state 2 = Message with two states Message text Pr M R Cause of message Remedy Archiving of a trend has been stopped S1 1 An unexpected error occurred while writing trend archive data, e.g. the hard disk is full. Create more space on the disk in question, or switch the storage of log files etc. to a disk with more space available. DigiVis configuration changing failed DigiVis connection to xxx aborted Export failed due to copy file S1 S1 S1 1 An error has occurred while loading new project data to the DigiVis station. 2 The link to station xxx has been disturbed. 1 FTP export: Failure to save export file in temporary storage in the Temp directory of the sending PC. Check available disk space at your DigiVis PC or contact your authorized service engineer. Check that the station in question is functioning correctly, and check its OPC server connection. Increase size of Temp directory or delete unnecessary files from it. 2PAA104346R0201 V-3
292 Section V System Messages Message text Pr M R Cause of message Remedy Export queue full S1 1 The export of log data requires a certain length of time, depending on the type of network connection to the FTP server and on the volume of data The DigiVis station is producing transmit jobs faster than they can be processed. Use a faster network connection to the FTP server, or a more powerful server. Alternatively, reduce the number of transmit tasks per unit of time. Export: FTP connection to xxx failed Export: FTP not accepted by xxx S1 1 No connection could be established to the export target device addressed xxx. S1 1 Access to the export target device addressed xxx was denied due to an incorrect password. Check the target device. Check the password. Export: General FTP error ( xxx ) FTP error xxxx. Create file failed FTP error xxxx. Restart FTP server. S1 1 S1 1 S1 1 A general error has occurred while exporting the archive data. FTP access at target station failed, e.g. the configured path may be wrong. FTP access at target station failed. Check the amount of storage available on the target device. Check te configured archive path of the trend display configuration. Restart the FTP server or contact your authorized service engineer. Hardkey not found S1 2 The hard key required for operating the software was not found. Less than xxx KB free disk space on drive "yyyy": S1 2 Hard disk "yyyy" on the DigiVis PC no longer has sufficient free space (less than xxx ). Check that the hard key is installed, and/or check its connection Otherwise, contact your authorized service engineer. Create more space on the disk in question, or switch the storage of log files etc. to a disk with more space available. V-4 2PAA104346R0201
293 Section V System Messages Message text Pr M R Cause of message Remedy Message overflow list S1 1 The system is producing more messages than the DigiVis message list can accommodate. In the message list configuration, increase the number of messages (up to 2000 are possible). If this parameter is already at the maximum, try reducing the number of messages or changing the acknowledge levels. OPL xxx stopped, all files in use S1 1 The operation log xxx has been halted automatically. The maximum volume of data for this log has been reached, and automatic deletion has not been configured. Delete or export log data and re-start the log. You can also configure automatic deletion. OPL xxx was not printed SSL xxx stopped, all files in use S1 1 The print job for the operation log could not be carried out. Presumably the printer driver is not installed or the printer queue is full. S1 1 The signal sequence log xxx has been halted automatically. The maximum volume of data for this log has been reached, and automatic deletion has not been configured. Check your system installation, or check that the printer is online. Delete or export log data and re-start the log. You can also configure automatic deletion. SSL xxx was not printed S1 1 The print job for the signal sequence log could not be carried out. Presumably the printer driver is not installed or the printer queue is full. Check your system installation, or check that the printer is online. Stop archiving S1 1 An unexpected error occurred while writing archive data, e.g. the hard disk is full. Create more space on the disk in question, or switch the storage of log files etc. to a disk with more space available. 2PAA104346R0201 V-5

294 W Glossary
295 Chapter W Glossary Access Parameters from preconfigured displays that either authorize or prevent certain sizes, values or actions for the user. Acknowledge Operator action whereby one or more messages is/are acknowledged as seen and understood. Every action performed by the logged-in operator can be logged in the signal sequence log. Alphanumeric display A dynamic symbol from the graphic editor for displaying analog values on the operator station. Archive An archive is the file in which the data from a trend display or log are saved. Depending on how data is logged, in this way large volumes of data can be generated under certain circumstances. Authentication key The authentication is a combination of numbers that, comes with the hard key, forms the copy protection for a DigiVis 500 Graphics Builder and/or DigiVis 500 Operations license. The authentication key is to be found on a separate disk among the installation disks. Authorization disk The authorization disk contains the rights conferred by your software license in an encoded format. You will need this authorization disk at installation time in order to be able to utilize all the features of DigiVis 500 Graphics Builder and/or DigiVis 500 Operations that you ordered. Auto Operating mode in which processing is carried out automatically through the program s control settings. The operator is not allowed to do any input in automatic mode. For operator input you must change to manual operating mode. Block acknowledgment Acknowledgment of several selected entries in the message list or hints list Block type Identical to the tag type. The block type forms a short description of the block in the library. Button field See Operating element area. Caption This line shows the name of the current display along with the long text. W-2 2PAA104346R0201
296 Chapter W Glossary Classifying The entry of values (parameters) in a fixed configuration on the engineering station or operator station. Colors The colors that cannot be changed through the Windows interface can be set individually in DigiVis 500 Graphics Builder in the project tree and the program editors. In DigiVis 500 Operations the colors for trends can be selected by the operator. Control Aspect The Control Aspect is an animated representation of a step or transition program of a sequential control or of the program, in which a tag has been configured in DigiVis 500 Graphics Builder, similar to the display of the program in the commissioning program. DigiVis 500 Graphics Builder Software for the engineering station; runs under MS Windows. Engineering station. Control room horn A control room horn can be configured along with the field horn. This is done by entering wav files (requiring a sound board) in the local event processing. When an event, these wav files are executed. Data type Data types are assigned to variables either directly in the program or through a variable declaration in the variable list. Along with the basic data types such as REAL or BOOL, user-defined data types can also be set up (structured variables). Default display The default display is a display with a special significance for the context menu for display allocation. This allows a specific display to be called up for each tag when F11-key is pressed. Demo mode If DigiVis 500 Graphics Builder or DigiVis 500 Operations is installed without a hardkey connected to the PC, the application will automatically start up in demo mode. In this case, the DigiVis 500 software package can be used for 100 days. DigiBrowse DigiBrowse is an add-on package for the PC to view trend and log archives. DigiVis 500 Operations DigiVis 500 software application for the operator station allowing for process operation and observation using various pre-configured and individual functions and displays. W-3 2PAA104346R0201
297 Chapter W Glossary Directory During installation, directories are set up in advance for the storage of DigiVis 500 -specific data. Display Various process displays, e.g. the graphic displays, group displays, trend displays, logs, system displays, the overview display, the WEB displays, and the faceplates of the individual tags can be called up for display via this menu item in the menu line. Display access Through display access DigiVis 500 Graphics Builder can be used to allocate displays to tags; these displays can then be called up through the context menu in DigiVis 500 Operations. Display area In this region of the screen the displays selected by the operator are displayed. Display format The display format determines the format in which a variable s value is displayed in the operation interface. Display scroll bar The hidden area of the overview display can be brought into view using the scroll bar on the right-hand edge. Emergency mode If the hard key cannot be detected during program start up or during normal operation (hard key is missing or defective) the system will enter the emergency mode. In this mode the software is fully operational for 100 days. During this time you have to exchange the defective hard key. Enable For the function blocks to run, an Enabled state must be detected. The enable command should be issued automatically by the program or in the parameter mask. Engineering station PC or laptop with DigiVis 500 Graphics Builder software package and a Windows operating system. Used by the system engineer for configuration, commissioning, and documentation. Ethernet board PC plug-in board for connecting engineering station and operator station to Ethernet system bus. W-4 2PAA104346R0201
298 Chapter W Glossary Event logs Event logs are used for logging events such as messages, faults, switching actions and/or operator actions. Logging is performed automatically when the appropriate event occurs. Faceplate A faceplate is used for operation and observation of a tag. This shows the current states from the related process. It can be incorporated into any other display. Fault message Messages of priority 1 (red), 2 (yellow) and 3 (orange) for showing faults such as violations of limit values in the operation interface. Focus The focus symbol indicating the currently active window is provided for DigiVis 500 Operations keyboard operation. The symbol is displayed at the left-hand end of the status line. Pressing the ALT key together with a cursor key will toggle the focus between the individual windows DigiVis 500 system The sum of all the DigiVis 500 components. DigiVis 500 Graphics Builder, DigiVis 500 operations, add-on packages, hardware components. See also Engineering station, Οperator station. Group display A group display is a combination of several faceplates. It provides the user with the opportunity to display related tags in the same display. After a displayed faceplate has been selected, the corresponding tag can then be operated. Hard disk requirement The amount of hard disk space needed for a trend archive or a log file is calculated, during the configuration. Hard disk space Around 500 MB of free hard disk space are required for installing the DigiVis 500 Operations software, and approximately 500 MB for installing DigiVis 500 Graphics Builder. More disk space again will be required to work with the software: at least 2 GB for DigiVis 500 Operations and 10 GB for DigiVis 500 Graphics Builder. The actual amount of space required is determined by the size of your user program. For archiving trends and log files usually at least 80 GB memory should be available. Hard key A hard key and an authorization disk are needed for using DigiVis 500. Hardcopy Complete or partial printout of the current screen contents. W-5 2PAA104346R0201
299 Chapter W Glossary Help The DigiVis 500 help system enables operators to quickly call up relevant information onto the screen while they are working with the software. Horn A control room horn can be configured which will be switched off once the corresponding message is acknowledged. Host name A name identifying the computer. Each name must be unique within the DigiVis 500 network. No other PC in the DigiVis 500 network may have the same name. Interpolation The trend display and the representation therein between two captured values can appear in three varying forms: with no interpolation (whereby only the data point is shown), as a line connecting two points, or as a staircase. Limit value Limit values form the basis for generating events. Limit values are thus declared in the operation interface and/or in a log, e.g. when a particular value is exceeded. Particular events are specified depending on the type of limit value. The message is generated with, amongst other attributes, a specific priority and a message text. Limit value type The limit value type determines the event triggered by the message. Load Transfer of programs or sections of programs in commissioning that have passed the plausibility check without revealing any errors. In addition the objects or levels in the project tree are selected and transferred automatically to the assigned resource by the load procedure. Log type Three different types of logs are provided: the signal sequence log (SSL) and operation log (OPL). Logs Logs are used for documenting events, states and sequences from the process. The data they capture can be saved on the hard disk in the operator station, printed out on the printer or displayed on the monitor. Long text A text entry up to 30 characters in length for providing a brief description of a Tag or a preconfigured display. W-6 2PAA104346R0201
300 Chapter W Glossary Manual Operating mode in which the tag can be operated from within DigiVis 500 Operations. Menu line A screen region in the DigiVis 500 operation interface. The menu line remains visible at all times. Because of this, actions linked in the background with the menu can be performed in any operating situation. Message Certain process states and/or events can be configured as messages. When that event occurs a message is sent to the operator station. Message box The message boxes in the message line contain the still-to-be-acknowledged messages. Message line The message line forms part of the operation interface and is included above every display on the operator station. Message list In the message list the messages sent from the OPC server to the operator station or may originate in the operator station, where they are displayed and managed. These messages may relate either to the DigiVis 500 system or to the automated process. In the message list a message can be selected and/or acknowledged, the faceplate associated with a tag can be displayed, and the display assigned to a tag can also be called up through the context menu. In this way one can quickly obtain detailed information relating to the selected message. Message overflow box A box in the message line used to indicate that the message line contains more messages than can be displayed. Message text Additional output text of a message in the message box and in the message list. Message types In DigiVis 500 messages are subdivided into the following message types based on their significance for the process: system errors, fault messages and switch messages. Monitor resolution Number of pixels that can be displayed on the monitor, e.g x 768 or 640 x 480. The recommended monitor resolution for DigiVis 500 Operations is 1280 x If the monitor resolution is less then the recommended resolution then it may lead to distortion of the displays. W-7 2PAA104346R0201
301 Chapter W Glossary Monitoring time The length of time after which the transitions/advancing criteria that follow a step but have not been satisfied will be reported. MS-DOS Operating system used for operator station and engineering station. MS-Windows Graphical user interface. Requires MS-DOS. Network board Plug-in Ethernet card for a PC through which connection to the system bus is effected. Offset mode This operating mode is used to determine which offset value is being used in the time scheduler. Offset value Value added to the time scheduler s set point. Operate This menu item allows you to select and execute all specific operating options for the currently shown display. Operate and observe (man machine interface) A general term describing the process-control approach in an industrial process. Operation log Cyclical, manual or event-related logging of up to 200 variables within a configurable text. Operator The person who holds responsibility at any given point in time for controlling process events through the control system. Operator action An operator action is an action on the part of the operator through which a process variable or process value is changed from the operator station. Operator hint box Display field in the message line showing whether or not there are any available hints relating to a message or event. Through the operator hint box or message list one reaches a hint list showing any unacknowledged hints. W-8 2PAA104346R0201
302 Chapter W Glossary Operator interface The operation interface is the sum of all the display objects and operating objects at the operator station. Operator station PC with a MS Windows operating system and the DigiVis 500 Operations software. Used for operation and monitoring, alarms, trends, archives and reports. Overview display Preconfigured display for quick selection of displays and/or logs. A maximum of 96 displays or logs can be included in an overview display. Alternatively, a graphic display can be configured as an overview display. Permanent Scheduler operating mode whereby all sections of the set curve are run through systematically. Preconfigured display Along with the free graphic displays created using the graphic editor there is also a series of preconfigured displays; to display these in DigiVis 500 Operations you only need to configure a tag and a few parameters. The preconfigured displays in DigiVis 500 are the overview display, group displays, trend displays, and system display. The faceplates for each tag and the logs can also be displayed without any need for further configuration. Print job The output of documentation is always controlled by a so-called print job, i.e. there must always be a job selected before printing. The contents of the print task is defined in this job. Priority levels Messages are distinguished by their priority levels. Priority levels S1, S2 and S3 are reserved for system errors, levels 1 to 3 for disturbance messages, level 4 for switching messages and 4 for hint messages. Process message Process messages inform the user about disturbances and specific status changes in the DigiVis 500 system. A distinction is made between fault messages and switch messages. The message types are further subdivided according to their importance for the process and according to the priority levels. Region A selected region of the display is printed. Report printer The report printer is the printer connected to the operating station. A maximum of 2 printers can be connected to one operator station. Scroll bar Used for scrolling through a display that cannot be fully displayed on the screen. The scroll bar is placed at the bottom side or to the right of the display window. W-9 2PAA104346R0201
303 Chapter W Glossary Security Lock Security Lock is a package of the DigiVis 500 Graphics Builder to permit the configuration of user groups. Various access rights can be awarded to user groups. Each user specifies an individual password which the user can only change himself/herself. Selection Operating technique from the operation interface. Selection is used to activate displays or to select tags for operation. Short term archive When a trend display is selected, the short-term archive for the individual signals is displayed first. The short-term archive holds 200 values, i.e. max. 6 x 200 values per trend display. For older values the system will then automatically return to access the archive file. Signal sequence log Configurable logging of system errors, fault messages, switch messages and operator actions. Signal sequence log 1 Logging of system errors, fault messages, switch messages and operator actions with continuous printing. Signal sequence log N Logging of system errors, fault messages, switch messages and operator actions, recording these in a log file. State line At the left of the state line is the keyboard focus indicator. To the right of it system messages are displayed. The 10 most recent messages can be viewed by selecting the pull down symbol. In the center area the symbol for calling up the Quick Select Window is displayed. On the right the number of hard copies still to be produced is displayed, and next to that are the user name, date and time. State log The function of state logs is to record process states cyclically. This includes the cyclical logging of the state of a tag or the logging of sequences in the process. Switch message Priority 4 message (yellow) for reporting switching events such as Pump On; not to be confused with a fault message. System message System errors have the priority S1, S2 or S3. Messages with this priority cannot be either configured or changed by the user. System errors generate messages about error states in the system itself. W-10 2PAA104346R0201
304 Chapter W Glossary Tag A tag is a preconfigured function block. Every function block must be assigned a tag name. Time synchronization Time synchronization of the stations are done as per standard windows time synchronization. OPC server time stamps the messages that originate from it. Title line Trend In this line, the current display name and the text configured for it is displayed. The function of a trend is to provide a graphic representation of values using a time axis. In DigiVis 500 this is done by capturing the values in the OPC server and transferring them to the operator station. Trend display The trend display is used to display values graphically using a time axis. A maximum of 6 trends can be shown in one trend display. Visual acknowledgment Visual acknowledgment marks the messages as viewed. However, this kind of acknowledgment has no effect on the current state of the respective messages in the OPC server, i.e. the messages are still present in the message list and hint list and must be acknowledged separately. WEB display After calling a WEB display in DigiVis 500 Operations, the local Web browser is loaded, and the link to the configured WEB site is activated. W-11 2PAA104346R0201
305 Index 1 Index AC500 Tag Type library, I-5 Back, C-29 CLOCK, I-34 Context menu, C-15 CTD, I-23 CTU, I-21 CTUD, I-22 Default display, C-9 DigiVis 500 Operations Operating philosophy, C-5 DigiVis 500 Operations Menu, C-23 Display selection Default display, C-46 Menu item Display, C-40 Overview display, C-43 Toolbar, C-40 Down counter, I-22 Faceplate, C-20 Faceplates Abbreviations, I-15 Call-up, I-7 Description, I-5 Structure, I-9 Forward, C-29 GEN, I-30 Graphic display, C-19 Bar graph, G-11 Call-up, G-6 Clipping, G-8 Display, G-8 Dynamic display elements, G-11 Fill area, G-11 Full view, G-8 Object position, G-11 Operation, G-9 Structure, G-5 Trend window, G-13 Group display, C-19, F-5 Call-up, F-6 Operation, F-7 HA_CONTROL, I-35 HA_CS31_DIAG, I-36 HYSTERESIS, I-33 Information display, M-5 Diagnostic mode, M-5 Operation, M-5 Start/Stop Diagnostic server, M-6 Information Display, C-21 Installing DigiVis 500 Operations, A-6 Keyboard, C-9 Limit Alarm, I-24 LIMITALARM, I-24 Log, C-21 Log files Export, C-21 Logs Changing the view, L-12 File transfer, L-18 Operation, L-12 Menu Display, C-28 Help, C-38 Message list, C-25 Operation, C-25 Print, C-38 Tools, C-32 Message line, D-15 Area view, D-18 List view, D-18 Standard view, D-16 Structure, D-15 Message list, D-20 Calling up, D-22 Header, D-23 Operation, D-29 Structure, D-23 Message types, D-5 Messages Acknowledgment, D-7 Acknowledgment level, D-9 Audio files, D-12 Priority levels, D-7 Mouse, C-6 Operating DigiVis 500 Operations General hints, A-6 Operation Context menu, C-15 Keyboard, C-9 Mouse, C-6 Operation log, L-19 Example, L-19 Format, L-22 Overview display, C-19, E-5 Call-up, E-5 Display selection, E-8 Display type symbols, E-9 2PAA104346R0201
306 Index 2 PD, I-26 PID, I-27 PID_FIXCYCLE, I-29 Point acknowledgment, D-9 Process visualization, C-19 Quick Select, C-47 Assign current display, C-53 Assign current faceplate, C-53 Button properties, C-54 Button text, C-55 Export configuration, C-52 Functions, C-51 Import configuration, C-52 Save configuration, C-50 Short cut, C-55 Size, C-52 Tooltip, C-56 RAMP_INT, I-31 RAMP_REAL, I-32 Reports, C-21, K-4 delete, K-12 Enabling automatic File Transfer, K-13 File transfer, K-4 Initiating manual File Transfer, K- 13 Operation, K-6, K-10 print, K-12 start, K-11 stop, K-11 update, K-14 Security Lock, C-17 Setting/reading the clock and date, I- 34 Signal sequence log, L-22 Example, L-22 Format, L-26 Tag selection, C-9 Timer, I-18 Timer, Off delay, I-20 Timer, On delay, I-19 TOFF, I-20 TON, I-19 TP, I-18 Trend display, C-20 Archive status, H-30 Call-up, H-8 Changing the time axis, H-27 Changing Y axis, H-21 Configuration in DigiVis 500 Operations, H-5 Cursor adjustment, H-26 Defining, H-10 Delete, H-17 Dialog area, H-20 Dimension, H-14 Display cycle time, H-14 Duration, H-29 Edit, H-16 Enable archiving, H-14 Export, H-17 Import, H-17 Interpolation, H-32 Moving Y axis, H-26 Name, H-14 Options, H-27 Reset, H-33 Rest settings, H-30 Sample time, H-14 Save, H-16 Saving the trend file, H-33 Scrolling the time window, H-26 Scrolling the trend curve vertically, H-22 Setting the color of the trend curve, H-21 Setting the cursor display shape, H-32 Short text, H-14 Showing/hiding the trend curve, H-22 Switch cursor on/off, H-21 Tag name, H-14 Transfer trend file, H-33 Trend area, H-24 Trend selection, H-20 User-defined trend displays, H-11 Value area, H-19 Variable, H-14 Y-scaling, H-32 Zooming, H-27 Zooming the trend curve in/out, H- 22 Zooming Y axis, H-21 Trend files Export, C-20 Up counter, I-21 Up/Down counter, I-23 User identification, C-17 2PAA104346R0201
307 2PAA104346R0201 Index 3 Visual acknowledgment, D-8 Visual orientation hints, A-5 WEB display, N-5 Call-up, N-5 Operation, N-7 WEB Display, C-22
 6221 701 1444 Fax:+49 (0) 6221 701 1382 e-mail : plc.")
308 2PAA104346R0201 Printed in Germany, April 2012 Copyright 2012 ABB, All Rights Reserved Registered Trademark of ABB Trademark of ABB ABB Automation Products GmbH Wallstadter Str Ladenburg Germany Phone:+49 (0) Fax:+49 (0) plc.sales@de.abb.com
Engineering Manual Security Lock
 DigiVis 500 Engineering Manual Security Lock Version 1.0 SP1 DigiVis 500 Engineering Manual Security Lock Version 1.0 SP1 NOTICE The information in this document is subject to change without notice and
MicroSCADA Pro SYS Historian Operation
 SYS 600 9.3 Trace back information: Workspace Main version a10 Checked in 2012-11-12 1MRS757707 Issued: 30.9.2012 Version: A/30.9.2012 SYS 600 9.3 Contents 1 Copyrights... 2 Introduction... 2.1 This manual...
TOF-Watch SX Monitor
 TOF-Watch SX Monitor User manual Version 1.2 Organon (Ireland) Ltd. Drynam Road Swords Co. Dublin Ireland Contents General information... 3 Getting started... 3 File Window... 7 File Menu... 10 File Open
MicroSCADA Pro SYS Operation Manual
 MicroSCADA Pro SYS 600 9.2 1MRS756118 Issued: 28.02.2007 Version: B/28.03.2008 MicroSCADA Pro SYS 600 9.2 Contents Copyrights...7 1. Introduction...9 1.1. This manual...9 1.2. Use of symbols...9 1.3.
MicroSCADA Pro SYS
 MicroSCADA Pro SYS 600 9.2 1MRS756170 Issued: 02.03.2007 Version: B/28.03.2008 MicroSCADA Pro SYS 600 9.2 Contents Copyrights...15 1. Introduction...17 1.1. This Manual...17 1.2. Use of symbols...17 1.3.
SIMATIC. Process Control System PCS 7 OS Process Control (V8.1) Security information 1. Preface 2. Additional documentation 3
 Security information 1. Preface 2. Additional documentation 3") Security information 1 Preface 2 SIMATIC Process Control System PCS 7 Operating Instructions Additional documentation 3 Functions of the PCS 7 OS in process mode 4 PCS 7 OS process mode - user interface
Security information 1 Preface 2 SIMATIC Process Control System PCS 7 Operating Instructions Additional documentation 3 Functions of the PCS 7 OS in process mode 4 PCS 7 OS process mode - user interface
SIMATIC. Process Control System PCS 7 OS Process Control (V8.1) Preface 1. Additional documentation 2. Functions of the PCS 7 OS in process mode 3
 Preface 1. Additional documentation 2. Functions of the PCS 7 OS in process mode 3") Preface 1 Additional documentation 2 SIMATIC Process Control System PCS 7 Operating Instructions Functions of the PCS 7 OS in process mode 3 PCS 7 OS process mode - user interface 4 System operator inputs
Preface 1 Additional documentation 2 SIMATIC Process Control System PCS 7 Operating Instructions Functions of the PCS 7 OS in process mode 3 PCS 7 OS process mode - user interface 4 System operator inputs
Deckblatt. APL Operator Guide SIMATIC PCS 7. Application description June Applikationen & Tools. Answers for industry.
 Deckblatt SIMATIC PCS 7 Application description June 2011 Applikationen & Tools Answers for industry. Industry Automation and Drive Technologies Service & Support Portal This article is taken from the
MicroSCADA Pro SYS
 MicroSCADA Pro SYS 600 9.2 1MRS756117 Issued: 02.03.2007 Version: B/28.03.2008 MicroSCADA Pro SYS 600 9.2 Contents Copyrights...7 1. Introduction...9 1.1. This manual...9 1.2. Use of symbols...10 1.3.
Layout and display. STILOG IST, all rights reserved
 2 Table of Contents I. Main Window... 1 1. DEFINITION... 1 2. LIST OF WINDOW ELEMENTS... 1 Quick Access Bar... 1 Menu Bar... 1 Windows... 2 Status bar... 2 Pop-up menu... 4 II. Menu Bar... 5 1. DEFINITION...
MicroSCADA Pro SYS Historian Monitor Configuration
 SYS 600 9.3 Trace back information: Workspace Main version a10 Checked in 2012-11-12 1MRS757708 Issued: 30.9.2012 Version: A/30.9.2012 SYS 600 9.3 Contents 1 Copyrights... 2 Introduction... 2.1 This manual...
Océ Engineering Exec. Advanced Import and Index
 Océ Engineering Exec Advanced Import and Index Océ-Technologies B.V. Copyright 2004, Océ-Technologies B.V. Venlo, The Netherlands All rights reserved. No part of this work may be reproduced, copied, adapted,
FactoryLink 7. Version 7.0. Client Builder Reference Manual
 FactoryLink 7 Version 7.0 Client Builder Reference Manual Copyright 2000 United States Data Corporation. All rights reserved. NOTICE: The information contained in this document (and other media provided
The first time you open Word
 Microsoft Word 2010 The first time you open Word When you open Word, you see two things, or main parts: The ribbon, which sits above the document, and includes a set of buttons and commands that you use
MicroSCADA Pro SYS Historian Monitor Configuration
 SYS600 9.4 Trace back information: Workspace Main version a26 Checked in 2014-05-16 1MRS758121 Issued: 16.5.2014 Version: A/16.5.2014 SYS600 9.4 Contents 1 Copyrights... 2 Introduction... 2.1 This manual...
Oracle General Navigation Overview
 Oracle 11.5.9 General Navigation Overview 1 Logging On to Oracle Applications You may access Oracle, by logging onto the ATC Applications Login System Status page located at www.atc.caltech.edu/support/index.php
Libraries. Multi-Touch. Aero Peek. Sema Foundation 10 Classes 2 nd Exam Review ICT Department 5/22/ Lesson - 15
 10 Classes 2 nd Exam Review Lesson - 15 Introduction Windows 7, previous version of the latest version (Windows 8.1) of Microsoft Windows, was produced for use on personal computers, including home and
SIMATIC. Process Control PCS 7 V7.0 PCS 7 OS Process Control. Preface, Contents. Additional Documentation 1 Functions of the PCS 7 OS in Process Mode
 s SIMATIC Process Control PCS 7 V7.0 PCS 7 OS Process Control Operating Instructions Preface, Contents Additional Documentation 1 Functions of the PCS 7 OS in Process Mode 2 PCS 7 OS Process Mode - User
System 800xA 800xA for Freelance Product Guide
 System 800xA 800xA for Freelance Product Guide System Version 6.0 Power and productivity for a better world TM System 800xA 800xA for Freelance Product Guide System Version 6.0 NOTICE This document contains
Please note that this process must be repeated if a new PC is used.
 Appendix 2 - Using Smart Client This section of the user guide is relevant to first-time users of Agresso. There are some areas of the Agresso package that initially need to be configured by the individual
MicroSCADA Pro LIB 510 *4.1. Operation Manual
 MicroSCADA Pro LIB 510 *4.1 1MRS755361 Issued: 30.06.2004 Version: B/20.12.2004 MicroSCADA Pro LIB 510 *4.1 1. About this manual...7 1.1. Copyrights...7 1.2. Trademarks...7 1.3. General...7 1.4. Use of
Océ Engineering Exec. Electronic Job Ticket
 Océ Engineering Exec Electronic Job Ticket Océ-Technologies B.V. Copyright 2004, Océ-Technologies B.V. Venlo, The Netherlands All rights reserved. No part of this work may be reproduced, copied, adapted,
Unicon TM CL Series Software REFERENCE MANUAL
 Unicon TM CL Series Software REFERENCE MANUAL Trademarks The following items are trademarks or registered trademarks of Kaba Mas in the United States and/or other countries. Unicon Windows, Windows 2000,
WINDOWS NT BASICS
 WINDOWS NT BASICS 9.30.99 Windows NT Basics ABOUT UNIVERSITY TECHNOLOGY TRAINING CENTER The University Technology Training Center (UTTC) provides computer training services with a focus on helping University
User s Manual CAP 531*1.5 Configuration and Programming tool
 User s Manual CAP 531*1.5 Configuration and Programming tool This manual belongs to: Contents Chapter Page About this manual 1 Introduction 3 Technical descriptions 81 References 177 Customer feedback
SIMATIC HMI. WinCC V7.0 SP1 Setting up a Message System. WinCC Alarm Logging 1. Message System in WinCC 2. Principles of the Message System
 SIMATIC HMI WinCC V7.0 SP1 SIMATIC HMI WinCC V7.0 SP1 WinCC Alarm Logging 1 Message System in WinCC 2 Principles of the Message System 3 Configuring the Message System 4 Printout of the Online Help 11/2008
Aboriginal Information Systems. Per Capita Distribution TOBTAX. User Reference
 Aboriginal Information Systems Per Capita Distribution TOBTAX User Reference Custom Software. Network Services. E-Business. Complete I T Solutions. 2005 - Advanced DataSystems Ltd. Copyright Information
Scope of Functions UNIGYR -VISONIK. PC Software
 8 524 UNIGYR -VISONIK Insight V6 PC Software PPV04.01F01E A personal computer with "Insight" software is a picture-supported operation and indication unit for UNIGYR VISONIK building automation systems.
OpenForms360 Validation User Guide Notable Solutions Inc.
 OpenForms360 Validation User Guide 2011 Notable Solutions Inc. 1 T A B L E O F C O N T EN T S Introduction...5 What is OpenForms360 Validation?... 5 Using OpenForms360 Validation... 5 Features at a glance...
Astra Scheduling Grids
 Astra Scheduling Grids To access the grids, click on the Scheduling Grids option from the Calendars tab. A default grid will be displayed as defined by the calendar permission within your role. Choosing
ME scopeves 5.0. Reference Manual. Volume IIA Basic Operations. (August 2008)
") ME scopeves 5.0 Reference Manual Volume IIA Basic Operations (August 2008) i ME'scope Reference Volume IIA - Basic Operations ii Table Of Contents Notice Information in this document is subject to change
ME scopeves 5.0 Reference Manual Volume IIA Basic Operations (August 2008) i ME'scope Reference Volume IIA - Basic Operations ii Table Of Contents Notice Information in this document is subject to change
One Identity Manager User Guide for One Identity Manager Tools User Interface and Default Functions
 One Identity Manager 8.0.1 User Guide for One Identity Manager Tools User Interface and Default Functions Copyright 2018 One Identity LLC. ALL RIGHTS RESERVED. This guide contains proprietary information
5 Setting Preferences 15 Preferences 15 Configure Chart Colors 16
 CRITERION Vantage 3 Acquire Training Manual Contents 1 Introduction 3 Collecting Data 3 2 Starting the Program 3 Logging In and Logging Out 3 Logging In 3 Logging in as an Administrator 3 Logging in as
Microsoft Excel 2007
 Learning computers is Show ezy Microsoft Excel 2007 301 Excel screen, toolbars, views, sheets, and uses for Excel 2005-8 Steve Slisar 2005-8 COPYRIGHT: The copyright for this publication is owned by Steve
UC for Enterprise (UCE) Emergency On-Site Notification (E-OSN)
 Emergency On-Site Notification (E-OSN)") UC for Enterprise (UCE) Emergency On-Site Notification (E-OSN) User Guide NEC NEC Corporation September 2010 NDA-31083 Issue 2 Liability Disclaimer NEC Corporation reserves the right to change the specifications,
UC for Enterprise (UCE) Emergency On-Site Notification (E-OSN) User Guide NEC NEC Corporation September 2010 NDA-31083 Issue 2 Liability Disclaimer NEC Corporation reserves the right to change the specifications,
Batch and Import Guide
 Batch and Import Guide 06/13/2017 Blackbaud Altru 4.96 Batch and Import US 2017 Blackbaud, Inc. This publication, or any part thereof, may not be reproduced or transmitted in any form or by any means,
System 800xA Engineering
 System 800xA Engineering Engineering and Production Environments System Versions 6.0 Power and productivity for a better world TM System 800xA Engineering Engineering and Production Environments System
SIMATIC. Process control system PCS 7 Operator Station (V9.0 SP1) Security information 1. Preface 2
 Security information 1. Preface 2") SIMATIC Process control system PCS 7 Configuration Manual Valid for PCS 7 as of V9.0 SP1 Security information 1 Preface 2 The PCS 7 Operator Station 3 Introduction to OS configuration 4 Setting the languages
SIMATIC Process control system PCS 7 Configuration Manual Valid for PCS 7 as of V9.0 SP1 Security information 1 Preface 2 The PCS 7 Operator Station 3 Introduction to OS configuration 4 Setting the languages
System 800xA. Engineering and Production Environments. Power and productivity for a better world TM. System Version 5.1
 System 800xA Engineering and Production Environments System Version 5.1 Power and productivity for a better world TM System 800xA System Version 5.1 NOTICE This document contains information about one
1 Ctrl + X Cut the selected item. 2 Ctrl + C (or Ctrl + Insert) Copy the selected item. 3 Ctrl + V (or Shift + Insert) Paste the selected item
 Copy the selected item. 3 Ctrl + V (or Shift + Insert) Paste the selected item") Tips and Tricks Recorder Actions Library XPath Syntax Hotkeys Windows Hotkeys General Keyboard Shortcuts Windows Explorer Shortcuts Command Prompt Shortcuts Dialog Box Keyboard Shortcuts Excel Hotkeys
Tips and Tricks Recorder Actions Library XPath Syntax Hotkeys Windows Hotkeys General Keyboard Shortcuts Windows Explorer Shortcuts Command Prompt Shortcuts Dialog Box Keyboard Shortcuts Excel Hotkeys
DigiVis 500 Getting Started Version 1.0
 DigiVis 500 Getting Started Version 1.0 DigiVis 500 Getting Started Version 1.0 NOTICE The information in this document is subject to change without notice and should not be construed as a commitment
User Guide. Kronodoc Kronodoc Oy. Intelligent methods for process improvement and project execution
 User Guide Kronodoc 3.0 Intelligent methods for process improvement and project execution 2003 Kronodoc Oy 2 Table of Contents 1 User Guide 5 2 Information Structure in Kronodoc 6 3 Entering and Exiting
SASKTEL INTEGRATED BUSINESS COMMUNICATIONS (IBC)
") SASKTEL INTEGRATED BUSINESS COMMUNICATIONS (IBC) DESKTOP CLIENT USER GUIDE Version 4 January 2018 TABLE OF CONTENTS About the SaskTel IBC Desktop Client...3 Requirements...3 How to download and install
SASKTEL INTEGRATED BUSINESS COMMUNICATIONS (IBC) DESKTOP CLIENT USER GUIDE Version 4 January 2018 TABLE OF CONTENTS About the SaskTel IBC Desktop Client...3 Requirements...3 How to download and install
Service Minder Plus Features/Helpful Hints
 Service Minder Plus Features/Helpful Hints This manual covers helpful hints and use of features. Note: These items will be addressed during the training sessions. This document is meant to be used as an
Functional Description DOC01 - Digital Operator Control Version 5.2-0
 Functional Description DOC01 - Digital Operator Control Version 5.2-0 3BTG811792-3021 / A Page 1 NOTICE The information in this document is subject to change without notice and should not be construed
Process Eye Professional. Recall
 Process Eye Professional Recall Process Eye Professional Recall User Manual SP104010.101 August 2005 As part of our continuous product improvement policy, we are always pleased to receive your comments
Working with Mailbox Manager
 Working with Mailbox Manager A user guide for Mailbox Manager supporting the Message Storage Server component of the Avaya S3400 Message Server Mailbox Manager Version 5.0 February 2003 Copyright 2003
Word Getting Started The Word Window u vw. Microsoft QUICK Source. Creating a New Blank Document. Creating a New Document from a Template
 Microsoft QUICK Source Word 2007 Getting Started The Word Window u vw x y z u Quick Access Toolbar contains shortcuts for the most commonly used tools. v Microsoft Office Button contains common file and
System 800xA Multisystem Integration
 System 800xA Multisystem Integration System Version 5.1 Power and productivity for a better world T System 800xA Multisystem Integration System Version 5.1 NOTICE This document contains information about
Word Select New in the left pane. 3. Select Blank document in the Available Templates pane. 4. Click the Create button.
 Microsoft QUICK Word 2010 Source Getting Started The Word Window u v w x z Opening a Document 2. Select Open in the left pane. 3. In the Open dialog box, locate and select the file you want to open. 4.
System 800xA 800xA for Freelance VB Graphics Extension Installation
 System 800xA 800xA for Freelance VB Graphics Extension Installation System Version 6.0 Power and productivity for a better world T System 800xA 800xA for Freelance VB Graphics Extension Installation System
3Com exchange Call Center Administration Guide
 3Com exchange Call Center Administration Guide Version 4.33 http://www.3com.com Part Number 900-0146-01 Rev AA Published May 2004 3Com Corporation, 350 Campus Drive, Marlborough, MA 01752-3064 Copyright
Astra Scheduling Grids
 Astra Scheduling Grids To access the grids, click on the Scheduling Grids option from the Calendars tab. A default grid will be displayed as defined by the calendar permission within your role. Choosing
FLOWgate500. Software Manual. Software Manual FLOWgate500 Release 2.2. Revision number: V2.2. Manufacturer: SICK AG. Erwin-Sick-Str.
 FLOWgate500 Software Manual Software Manual FLOWgate500 Release 2.2 Revision number: V2.2 Manufacturer: SICK AG Erwin-Sick-Str.1 D-79183 Waldkirch Germany Place of manufacture: SICK Engineering GmbH Bergener
Word 2016 Advanced. North American Edition SAMPLE
 Word 2016 Advanced Word 2016 Advanced North American Edition WORD 2016 ADVANCED Page 2 2015 Cheltenham Group Pty. Ltd. All trademarks acknowledged. E&OE. No part of this document may be copied without
Specification Manager
 Enterprise Architect User Guide Series Specification Manager Author: Sparx Systems Date: 30/06/2017 Version: 1.0 CREATED WITH Table of Contents The Specification Manager 3 Specification Manager - Overview
IMAGE STUDIO LITE. Tutorial Guide Featuring Image Studio Analysis Software Version 3.1
 IMAGE STUDIO LITE Tutorial Guide Featuring Image Studio Analysis Software Version 3.1 Notice The information contained in this document is subject to change without notice. LI-COR MAKES NO WARRANTY OF
GX-9100 for Windows Addendum, Configuring the DX LCD Display
 System 9100 Technical Manual 636.4 Programming and Commissioning Section User s Guide Issue Date 0598 GX-9100 for Windows Addendum, Configuring the DX LCD Display General Setup Instructions Page 3 Introduction
Excel Select a template category in the Office.com Templates section. 5. Click the Download button.
 Microsoft QUICK Excel 2010 Source Getting Started The Excel Window u v w z Creating a New Blank Workbook 2. Select New in the left pane. 3. Select the Blank workbook template in the Available Templates
Contents. Batch & Import Guide. Batch Overview 2. Import 157. Batch and Import: The Big Picture 2 Batch Configuration 11 Batch Entry 131
 Batch & Import Guide Last Updated: 08/10/2016 for ResearchPoint 4.91 Contents Batch Overview 2 Batch and Import: The Big Picture 2 Batch Configuration 11 Batch Entry 131 Import 157 Configure Import File
New User Orientation PARTICIPANT WORKBOOK
 New User Orientation PARTICIPANT WORKBOOK INTEGRATED SOFTWARE SERIES New User Orientation PARTICIPANT WORKBOOK Version 2.0 Copyright 2005 2009. Interactive Financial Solutions, Inc. All Rights Reserved.
Unit III: Working with Windows and Applications. Chapters 5, 7, & 8
 Unit III: Working with Windows and Applications Chapters 5, 7, & 8 Learning Objectives In this unit, you will: Launch programs and navigate the Windows task bar. Perform common windows functions. Customize
DANGER indicates that death or severe personal injury will result if proper precautions are not taken.
 Security information 1 Overview of "COMOS Mobile Document Review" 2 COMOS Lifecycle Operating Manual Opening "COMOS Mobile Document Review" 3 Synchronization 4 Managing documents and revisions 5 Change
Specification Manager
 Enterprise Architect User Guide Series Specification Manager How to define model elements simply? In Sparx Systems Enterprise Architect, use the document-based Specification Manager to create elements
Using Open Workbench Version 1.1
 Version 1.1 Second Edition Title and Publication Number Title: Edition: Second Edition Printed: May 4, 2005 Copyright Copyright 1998-2005 Niku Corporation and third parties. All rights reserved. Trademarks
Quick Start Guide. ARIS Architect. Version 9.8 Service Release 2
 ARIS Architect Version 9.8 Service Release 2 October 2015 This document applies to ARIS Version 9.8 and to all subsequent releases. Specifications contained herein are subject to change and these changes
Horizon Launcher Configuration Guide
 Horizon Launcher Configuration Guide Windows NT and Windows 2000 are registered trademarks of Microsoft Corporation. All other product or company names are trademarks or registered trademarks of their
Industrial IT. 800xA - System PLC Connect System Version 4.0. Operation
 Industrial IT 800xA - System PLC Connect System Version 4.0 Operation Industrial IT 800xA - System PLC Connect System Version 4.0 Operation NOTICE The information in this document is subject to change
TAC Vista Webstation. Operating Manual
 TAC Vista Webstation Operating Manual TAC Vista Webstation Operating Manual Copyright 2006 TAC AB. All rights reserved. This document, as well as the product it refers to, is only intended for licensed
Caja File Manager. Desktop User Guide
 Caja File Manager Desktop User Guide Desktop User Guide» Working with Files This chapter describes how to use the Caja file manager. Introduction Spatial Mode Browser Mode Opening Files Searching For Files
Logi Ad Hoc Reporting System Administration Guide
 Logi Ad Hoc Reporting System Administration Guide Version 10.3 Last Updated: August 2012 Page 2 Table of Contents INTRODUCTION... 4 Target Audience... 4 Application Architecture... 5 Document Overview...
Using Sitecore 5.3.1
 Using Sitecore 5.3.1 An End-User s Guide to Using and Administrating Sitecore Author: Sitecore Corporation Date: December 12, 2007 Release: Rev. 1.0 Language: English Sitecore is a registered trademark.
DriveWare. User s Guide DriveBrowser
 DriveWare User s Guide DriveBrowser DriveBrowser User s Guide Code: 3AUA0000024806 EN EFFECTIVE: 31.12.2008 SUPERCEDES 31.01.2008 2008 ABB Oy. All rights reserved. 5 Table of contents Table of contents...
Beyond 20/20. Browser - English. Version 7.0, SP3
 Beyond 20/20 Browser - English Version 7.0, SP3 Notice of Copyright Beyond 20/20 Desktop Browser Version 7.0, SP3 Copyright 1992-2006 Beyond 20/20 Inc. All rights reserved. This document forms part of
Microsoft Excel 2010 Basic
 Microsoft Excel 2010 Basic Introduction to MS Excel 2010 Microsoft Excel 2010 is a spreadsheet software in the new Microsoft 2010 Office Suite. Excel allows you to store, manipulate and analyze data in
Connectivity Packages. User's Guide - ANSI Version
 Connectivity Packages 1MRS756194 Issued: 30.11.2006 Version: A/30.11.2006 Connectivity Packages Contents Copyrights... 5 1. Introduction...... 7 1.1. Intended audience...... 7 1.2. Related documents.........
DataMaster for Windows
 DataMaster for Windows Version 3.0 April 2004 Mid America Computer Corp. 111 Admiral Drive Blair, NE 68008-0700 (402) 426-6222 Copyright 2003-2004 Mid America Computer Corp. All rights reserved. Table
Contents. Launching Word
 Using Microsoft Office 2007 Introduction to Word Handout INFORMATION TECHNOLOGY SERVICES California State University, Los Angeles Version 1.0 Winter 2009 Contents Launching Word 2007... 3 Working with
Excel 2013 for Beginners
 Excel 2013 for Beginners Class Objective: This class will familiarize you with the basics of using Microsoft Excel. Class Outline: Introduction to Microsoft Excel 2013... 1 Microsoft Excel...2-3 Getting
ARIS Architect QUICK START GUIDE. Version Service Release 7
 ARIS Architect QUICK START GUIDE Version 9.8 - Service Release 7 December 2016 This document applies to ARIS Version 9.8 and to all subsequent releases. Specifications contained herein are subject to change
User Guide for Accessing Cisco Unity Connection Voice Messages in an Application
 User Guide for Accessing Cisco Unity Connection Voice Messages in an Email Application Release 9.x Published June, 2013 Americas Headquarters Cisco Systems, Inc. 170 West Tasman Drive San Jose, CA 95134-1706
DCN Synoptic Microphone Control. Software User Manual en LBB 3571
 DCN en LBB 3571 GENERAL CONTENTS Chapter 1-1.1 About 1.2 What is a synoptic layout? 1.3 Controlling microphones Chapter 2 - Getting Started 2.1 Starting 2.2 Using Help Chapter 3 - Preparing for a Conference
Solo 4.6 Release Notes
 June9, 2017 (Updated to include Solo 4.6.4 changes) Solo 4.6 Release Notes This release contains a number of new features, as well as enhancements to the user interface and overall performance. Together
Rooms Management Manual
 Fidelio Suite 7 Rooms Management Manual Front Office Version 7.13 Creation Date: March 2002 Delphi is a trademark of Borland. MSDOS, Windows 95, Windows-NT and Microsoft Word are trademarks of Microsoft
WebStudio User Guide. OpenL Tablets BRMS Release 5.18
 WebStudio User Guide OpenL Tablets BRMS Release 5.18 Document number: TP_OpenL_WS_UG_3.2_LSh Revised: 07-12-2017 OpenL Tablets Documentation is licensed under a Creative Commons Attribution 3.0 United
Preface 1. Main Management System 2. Contact Information 3 SIPLUS CMS. SIPLUS CMS4000 X-Tools - User Manual Main Management System.
 4000 X-Tools - User Manual - 03 - Main Management System Preface 1 Main Management System 2 Contact Information 3 4000 X-Tools User Manual - 03 - Main Management System Release 2011-09 Release 2011-09
COM600 Station Automation Series External OPC Client Access 3.1. User's Guide
 COM600 Station Automation Series External OPC Client Access 3.1 1MRS755564 Issued: 10.03.2005 Version: C/21.12.2007 COM600 Station Automation Series External OPC Client Access 3.1 Contents: 1. About this
Microsoft Dynamics GP. Extender User s Guide Release 9.0
 Microsoft Dynamics GP Extender User s Guide Release 9.0 Copyright Copyright 2005 Microsoft Corporation. All rights reserved. Complying with all applicable copyright laws is the responsibility of the user.
page 1 OU Campus User Guide
 page 1 OU Campus User Guide Logging Into OU Campus page page 2 1. Navigate to a page on your site that you wish to edit. 2. Scroll down to the footer and click the symbol. 3. Enter your OU Campus username
Screen Designer. The Power of Ultimate Design. 43-TV GLO Issue 2 01/01 UK
 Screen Designer The Power of Ultimate Design 43-TV-25-13 GLO Issue 2 01/01 UK 43-TV-25-13 GLO Issue 2 01/01 UK Table of Contents Table of Contents Honeywell Screen Designer - The Power of Ultimate Design
Guide to User Interface 4.3
 Datatel Colleague Guide to User Interface 4.3 Release 18 June 24, 2011 For corrections and clarifications to this manual, see AnswerNet page 1926.37. Guide to User Interface 4.3 All Rights Reserved The
System 800xA Engineering Engineering Studio Function Designer Getting Started
 System 800xA Engineering Engineering Studio Function Designer Getting Started System Version 6.0 Power and productivity for a better world System 800xA Engineering Engineering Studio Function Designer
Products that are referred to in this document may be trademarks and/or registered trademarks of the respective owners.
 2018 GEOVAP, spol. s r. o. All rights reserved. GEOVAP, spol. s r. o. Cechovo nabrezi 1790 530 03 Pardubice Czech Republic +420 466 024 618 http://www.geovap.cz Products that are referred to in this document
Easy Windows Working with Disks, Folders, - and Files
 Easy Windows 98-3 - Working with Disks, Folders, - and Files Page 1 of 11 Easy Windows 98-3 - Working with Disks, Folders, - and Files Task 1: Opening Folders Folders contain files, programs, or other
Ishida Label Editor USER GUIDE
 Ishida Label Editor USER GUIDE ISHIDA CO., LTD Copyright 2000 Ishida Co. Ltd., Japan Copyright 2000 Interface Translation Ltd., New Zealand No part of this manual may be reproduced or transmitted in any
ESFVISU process model editor, version 1.2
 ESFVISU process model editor, version 1.2 Content: 1 TECHNICAL REQUIREMENTS...3 1.1 1.2 1.3 1.4 1.5 HARDWARE...3 SOFTWARE...3 PROCESS INTERFACE...3 IMPORT FROM ETS...3 MICROSOFT INTERNET EXPLORER, VERSION
Fire Scene 6. Tip Sheet
 Fire Scene 6 Tip Sheet Fire Scene 6 All rights reserved. No parts of this work may be reproduced in any form or by any means - graphic, electronic, or mechanical, including photocopying, recording, taping,
BCM 4.0 Personal Call Manager User Guide. BCM 4.0 Business Communications Manager
 BCM 4.0 Personal Call Manager User Guide BCM 4.0 Business Communications Manager Document Status: Beta Document Version: 02 Part Code: N0027256 Date: January 2006 Copyright Nortel Networks Limited 2006
Getting Started Guide. Appendix A Keyboard Shortcuts
 Getting Started Guide Appendix A Keyboard Shortcuts Copyright This document is Copyright 2010 2013 by its contributors as listed below. You may distribute it and/or modify it under the terms of either
Each time you start PastPerfect you will be presented with the main menu.
 2 THE BASICS This chapter will teach you how to use the most common functions of PastPerfect. Detailed instructions for specific sections of the program will be given in later chapters. STARTING PASTPERFECT