INTRODUCTORY PHYSICS LABORATORY MANUAL Part I
|
|
|
- Spencer Kelley
- 6 years ago
- Views:
Transcription
1 INTRODUCTORY PHYSICS LABORATORY MANUAL Part I Fall 2005 Edition by Glenn V. Lo Jesus Urrechaga-Altuna Ryan Picou Jamie Guillot Project e 2 -PALS (Electronically Enhanced Peer-assisted Asynchronous Learning of Science), Department of Physical Sciences, Nicholls State University, Thibodaux, LA Major support for the development of this laboratory manual was provided by Louisiana Board of Regents Distance Education Initiative under contract number LA-DL-DEI-24-03/04.
2 TO THE STUDENT This printed manual provides only an outline of the procedures and principles. Details are provided in the accompanying videos on CD. You should study the videos before coming to the laboratory. The CD should autoplay when loaded into a computer running Windows 95 (or later version). If not, browse the CD using Windows Explorer and double-click on the index.htm file.
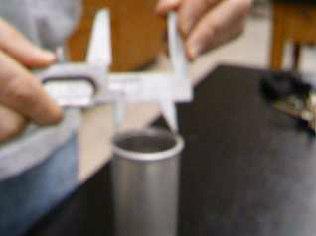
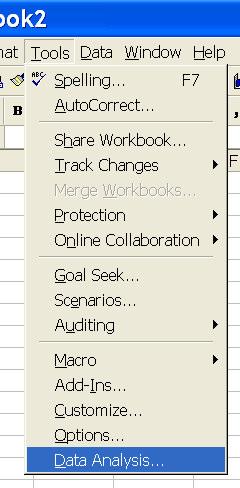
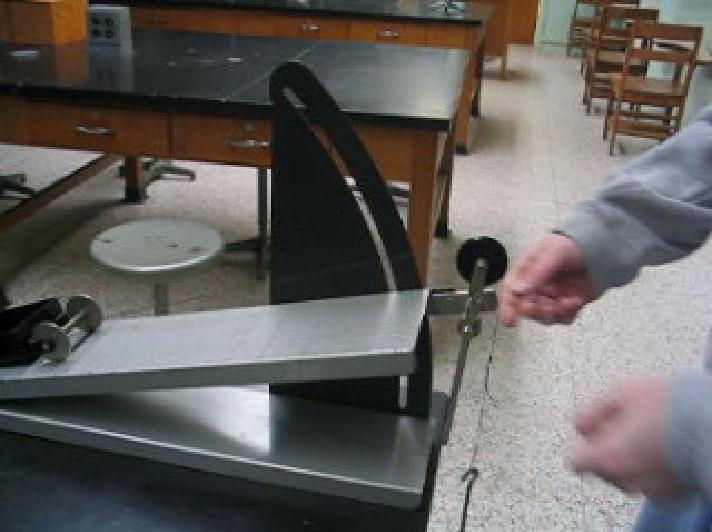
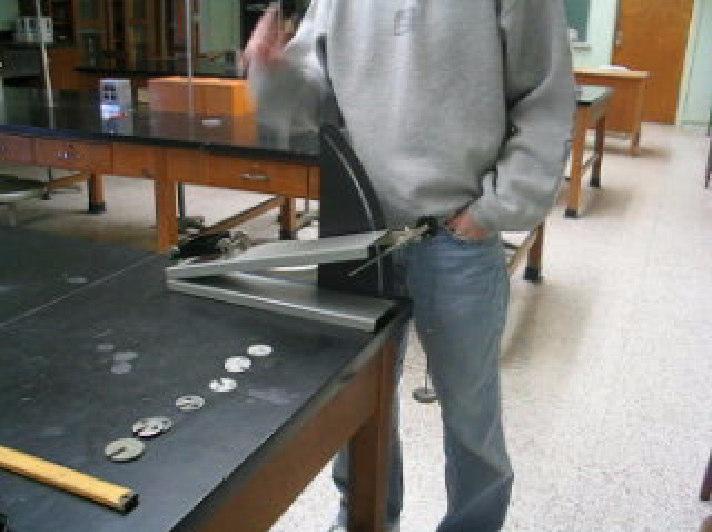
3 Experiments 1. Measurements 2. Graphing 3. Vectors 4. Acceleration due to Gravity 5. Moments of Force: Static Equilibrium 6. Work and Energy 7. Centripetal Force 8. Simple Harmonic Motion 9. Density of Liquid and Solids 10. Standing Waves 11. Linear Expansion 12. Specific Heat Appendix. Graphing with Excel
4 !"#$ % "&'( )* + + $, $, " """ %,",,", ""-( -., $ /01, /(2 3( / (,9*3-0(10(1 /, : ;"," - 4 *"7
5 $"$ 3",*, #< +3 (= #< +>,( /?4 #< +724= #< +7? #< + /4@ #< +754= #< +7 /-8 ) ) 47 ( 3#, " $, % %47 (( * " #:A "( 4 7,
6 %" %(, : / 01/ "" /(",( CD010 1, C,, ",," /("( $(,( >(, +,, *"C BB=-B@E-BF BB=GB@EGBF/<@ <@5B/B@F )( 64) 7)(4)7/,: "C5B,( *( 3(4) 7 + +(,(, )D(: D >( # 3(4)7H +),C BB=-B@E-BF 5B*B@BE B
7 $" %,"C) %,,(C,4)7 %CG) < )< (+,5B,* 4,7-* *BBFB, ):*(, ("4(,7 %"&, )C,A":,,A"-" B E C, ) C/B=@G +C6/G=B B! ", ", -,A" I4G-GB- 7 -,A" I4G-
8 )"," )",,","A*,- " ", ","C,A": ",",", ;** BG=B B * D" H;* ",,"H J FB H ;* ",,"H )",", G-,(" J *," BG, DH ) JCG-G H )/) ",("(C,/G )/5/-8 /4G 87,/G )/5/-8 /4G87 )/0 1-)/0( 1
9 ",! $C,D,DD,, J",G ) /47 G47 /=< ",! >(C),), D), J,"* /G-J/GH ) $ /457 G457 /B@ # ) $ /E-E8 $/BF 4GE87-BFG ",! J,"* /G-J/GH KC/4GJ7 )C GJ/@ ) GJ /47 G47 /=<) GJ /B ) GJ /B5@/B8 GJ/@GB-@4GB87 /4@7/E ) /) G) GJ /47 G4B87 /E4GB87 /EG= =
10 ",! J(, *, G=",EG +CBEGB<EEB B %,CGB B ",!,,L/,4$-M-N7 )""+% %,$)C, 3 " %,>(C, ","3,*"," C G F F
\" %(,\",, \"C #,'9 C*\",")
11 )""+% K, 0, 1(,,",," C / )""+% #-9","( (", )" %(,",, "C #,'9 C*", *H E

")

12 +, *", *C / ; *'9 -** ("H --- / 3(D " L, 6) $(,, "," 6 >*'9( <8,*'9" ( 9*9 C*= 6) %, *" <


,")

13 ) - $,, ","47 $437(4)7 9," "*'9 C'9( 9 $'9), $'93, 5- %"=G4@F747-=<F!"6 + &> '*'*""

14 !"+ +' ", 9*:* 9 &((*, "-*-9, *9"47 &(A",( %O"( : '* B!"(,!'*, 47%", *47 >$.! / +"-*-9, *9$, "A",6 +)),"-*- 9,*9 +(,*9-* )),( +8,*,6
15 >$ %+ +, $, "A", 6 +)),, +(,-* )),( >$ 0% +", $, "A", +)), " +(-* ) ),(
16 !"#$ %! &'( )* +( ( +,- )( (. &+ /(+ ( +,- 0( + *. 1,-21)2 3 4 (5 *6 71#289 /(# *( 71 #28
17 ,- : (; :* *( *; < : (; = :* +(* ;78 :* +>?; 78 Pressure, atm Volume, ml.+0?@ (0 90?9? # + ( + * 0)>?A 7B8?7BA8>@?>?B78 / + Reciprocal pressure (1/atm) Verification of Boyle's Law for air in a syringe at 298K /Pressure = 0.22 Volume Volume, ml ) # 4*. C A * #+0 7 8?7D =B8 7 8?7=EF FB8 )?B?7 # 8?FFB?7 # 8?G=? # # -#0?@? #?? #? Reciprocal pressure (1/atm) Verification of Boyle's Law for air in a syringe at 298K 1/Pressure = 0.22 Volume Volume, ml
18 $ 7 8 "AA(. ( )(6*A *( + +( /(9H$+ 7#8* 5 9+ * *** 7.8 /*(#+91 2* " +* ( # :I**; Length Series1 <


19 &((*+ C+ *( C*+ C+ < ) C A+ = %JJ<+ = F D &((*+ /$ K( K ( + 78 %+ # 78 bob L o R L = L o + R =


20 $ KA74A K $#L A$ KA 4A&M8 4AK / $ L % &M ** + + ( * *+ # 6 + A&M
0ND )04D E@ = F")
21 %* -#0NE )04E )0ND )04D = F
22 !"#$%&! '!" $()* +*,- $. +-/ * +- )0 $ 1*!- #$/* 2. +//-$1 $ $-/ 1$/%
23 . *&!/ $3&3 ϑ/ % &43&35ϑ6 & 43&35ϑ6 3&3 4& 7& 5ϑ64& 8& ϑ 45& 8&6 & ϑ 3&3 & & $ +/*/ $ +/ *- $ '4*- $ $ -* -- '*- --- &. --&&& &-999 &'4&79! :-' '4&79 ' 4& 79 2!-24&797.! 24& & 79 7.
24 , 7,4 ;$-,< 1ϑ, 4ϑ7π --&&&! :!-,5%&6 %&=& (**/-&*!*&!9!.!'!2- - /$-1 &1>?!$7% 91@>?!A /7%.1BA?!> /7% '4&79<-&79 %'4,-&79 24&797.<-&797. %24,-&797. %&* +-$ *&!9!.!'!%'!2!%2! 5$6- /$1 ;$5&6 5$/<96 %5.6 % &!9!. -4$<$4BC8


25 1 & 2. - $$#$1 +//*&9 $$+/*/$ $-$4?<4? +5'6-*$ $:/,5%'6 ;$-'%'; -&!9!'!%'$ :- /$--&!9!'!%' /*1$!!%! % '-&!9!.!2%2 (**/- &-//2 /$,$-*&9 $$<D 7 :!!$< -$ (**/- -,1 5-6$$
26 +& $-,!. -,.$-< -.*/* &1&7975%'6& 79 75%' 6 E1F- $/56 &1&797.75%26 & %2 6
27 "# $%&" ' "# %() '%*% + %,-% %.,,,&,% /0, % %%,4,1" 1")!
28 /0 56%2%"7% 7, 7%4 %8,8 *8,8 x, m time, min / / % ,, %1:;3 < 1< 1%<& 1-9.% =4, / %) %2" -, time, s time, s


29 / %) %2" -,"" x = 5t x = - 7.5t t time, min time, min? %5% >

30 ( 7, ' %% /6,%76% /A/BCD 7E)F 6,%D " %, E$=G(/B+FEG(/B+F=5'?? ( 7, D " 6,% % '-'7H 5?. ' + / % -.,,7 % +-., 71 5I 7" H" G1 "/1 > 1 > 15? >! 1! 15?!
31 + 5 -.,, -."6% %%,,7 1 7 %% % " 1 1!" 1 > 2 > > 1!" > 1 2 1" 1! 2!! 1"! 1 +4?! $%" <I -. 7I,-, & *. I," -.7%%,, 7%" % -%. A % +4? $%" 0 1 2%" % %
32 0 %% 7 %% -7 %%,7%."??! /, % %,?!4 1 2%0, /K 7,?! D,?%8D 7H8-A46 7. A77,? 8 J
33 ! #$ %&'()$ * '+,-.!.!!.'- &! /0 1! *! 1! ! "

34 1! )''! 1! /0253 6/02(3 7"8$+ $+* ''$* 9 6! 1! 1- ' /0 :'1- ;0-20 /3 )'/ '$ /0! -' <0! /0$0 - ;( ''= 6! - ' > '- '! Στ7!


35 6#- 6'- '- )/ '-! / '$'$ - ' '- 1!7= ' +--0 '- /?('-"('2 -'3@ -'- "('0'$; 0 -@' *0"'0'9 '- 6/0 /0!! 9
36 +--0?"'-0"('2 -'- "('$;0-0 0 '0'$-' "'$ / 6/0 /0! +--0 A./0 -'- B'/0;- 2-3 /1" ;-@ 9@9 6/0 2 ' * '32 * 3 7/0@ 7; * 7;2"3$923$293 * 7/0 &'($/0 60/ +--0 A./ B'"('0';'- -/2B"' 0''- -3 6/ ' 7 * ' * '7'- * 7"' * 7"'- 7'- - 7/ &'($ /6! ;
37 "# $% &'# ( )*+,-., ,--#-# ----,.----,.& /0θ1 /- * /-* θ /.+ 0θ1/ θ * ).#0&1. *5. -!
38 6--7!8& * !8 1/&8:7 /0&8:71081 /&!$ 7 +!$-. -*5*!$-. - & ; ;. - /<+ - 3 <+ = >=/<+ /= - & = & ;> / = - > / 9++ & ;> / = > 3 / =2 / /& * -++-> +
39 -- '* *-- 0 =/1; '+ #/ / / /2 / 0 & 15+ /& 0 & 1/& 5 + / 2 // = -- 3 / =2 /& / 0 & 1/ 3 "+/ & ! * -! / =2 /2 0 & 1 /0! 104?@ 10!1 /4?! $ /-. --*-, A 8

40 , ;--+ B #C-C/CC A C7C/CC A >-/µ7#.µ /----, D! + B -9-µ - 7 E- & ; 67-01D! + B-9 -# +- /7#θ/ -/7#θ/!? /4?7#θ/F 7/4?7#θ/4-7 :


41 )++.-,---+ 0! 1.!&,.- +,.- +. (.& #8& #:& #& (.!& 8 ) ( )++.- G " '*
42 ,' + # -> /. 0 15θ/ /. -25θ/4 2ϕ 7/7-/0ϕ15θ/F -/-/A#θ/!? !? ϕ1/ 3 -& 0ϕ1/ 7 - ϕ,' #- > /. 0 15θ/!? /. -25θ/F 2ϕ ϕ 7/7-/0ϕ15θ/4 /-/A5θ/!? 6+ 0!? 12-0!? 120F 2ϕ1/ & 3-20ϕ1/,' + > & -& 0ϕ1/ +.> & & -20ϕ1/ -/-/0 & 1@ 9----> -/µ7 µ /-@757/0ϕ1 '+>-+75/µ
43 ,' E- & ; '+ + + #+ #. #-# '.> B '. + > D + 0 / 1,' E- & ; '+ + +.#+ #. # -# + '.> B '. + > D + 0 / 1 F
44 ! "#$%&! ' $()* +*,)*$$ +,,$, #,-.)*$,* +**/,,/π */π0τ12τ// *,/0τ/,3 /,* τ/ %4!,/ % 56,/0τ/*0π */π,
45 #,- &$,$!,, +**/π /78794:878 /94!τ/0,/07 % 8/./*/π0τ/π,/ 9 0,,)*$$! ; 2 $ &/* 0/7π,8 0/4π, +62 )6 2, <= 7%>$8 /* 0/4π,,$,/, )$,,!2 * #,- &$$,$!,,./*/π0τ/π,/ 9 0 /?40 &! /* 0/4π, /@ 0,! / /9 4 5


46 (**2, +,$ 2$ (**2, &)$ 2, (**2, 9

47 (**2, ' $ $ >,$ 2>$.<A(B( &B.B&B#. AC=D* 2E)F >,$D! $, E#5G(C+FEG(C+F5B' -- (**2, -$,2 $6 BH-$ H H5 &,*!IJ BH +,72K8 /7L878 (**2, A$ * + 2$ $ &$2, 2$,, $ -,, 7,82 ; 4
48 +& *$,$,3,!,/0τ,!*/π,,! /* 0,! / 2$$ 12
49 "# $%&'(# ) &*+, -..&, -.. & +/ # 0 00π3τ π. τ 0..0!3τ 0.4.!


50 5 0 1π3τ & /6 0 /,0'7 178/2 τ01π21372!3 ' 9& 70&3 τ01π21372!3 01π213&2!3 *,,/. -.& :. '790 ' )4.. &1 2 (1!##;#<# &2 & '7 &07 01&372 *,,/ (1!##;#<# &2 & /;' /4# 4.! 0 4,!
51 -( #, 17&2 0 ' 04/ 04/ 0&379&0=3,.7570&395>3 -( - τ0π1372!3 τ 0?<π 37@ τ 0?<π 37@1 A 6. 2 τ 1 2, A 17&2 0τ A 0.17&2 0<π 379,.7 '0?<π 37@ &7&9.0...&9,.. ;
52 ! #$ %&'()$ * '+,- '- ). / 01- / )"' -" "'716"70"'1 0"'1 8 0"" 8 9'1 8 :.-3':- ' ;' '716;'170<8! "


53 !#- /'01 0, 0 637!'- = > ;'1 8 :'- 4 ' ; ' 2 /$ ' / ' $$ *?9 =!
 ),6 '7 637 3' - 8 $ 4 530 8 3067657 0 8 \"'1 80 ' :'30' 069'76B1 70AC 0 '05 ' ' )3' :.0'D5 '.'0'D61!")
54 '-67 2 /50π 0π 1A!/506A187π 8 0π 8 1< ) $,9 3 : :,.9$ -334 ) ),6 ' ' - 8 $ "'1 80 ' :'30' 069'76B1 70AC 0 '05 ' ' )3' :.0'D5 '.'0'D61! 7 '! 0 16(.7 /' A'32 4 6'76"'1 8 7! 00'1 8 6'D A'7! 8

55 ''- EF/! 0 E 16(. E 7! 0 F 16(. F 7 E 1 F 06(. E 716(. F 7 /' A'3 E A' 2'- E 6'D A'7 '0 E 1 : 00B 6'D A'7 ' $ 3' 0G'03' 50-0-' 50-' '03' 0 >/5 '0' ! 1 -'0! 1 ' $- '! 1! 3$ ' ;'1 8 7$ "1 06" "176"' ' ;0<8! A


56 @ H9 3'6 7 > 9 $!' '- & &3- &5 50π 0π 1AG0$0$0' :/9 ' $ 6.73!93- $A3 -G' 3'$A 3 '- 9 ' 0 * ' *! 0 * 0A/ 0 * 6.7I - 0 *!
57 +--3 '- 93 ' 3 93 E (. E 716( '- 393 '! <
58 "! #$ %&'($ ) *+!,-!,!!,!$ -. -! "!,-/ $ 0!!/! -! $!

59 1"!! -/ "!2 345(3ω'64 65π7λ ω 5π7τ 5π-!5λ7τ 5λ-5ω76 λ 5!$τ $!5 (5 $!!- - $!!-! -λ7 53λ74$5$$8$9 :-!/ -; -; <5 "! -! $$ 374!5=7374> :-!! 3$64- -? !5=3?4767>> 7 5@@A7!


60 *!! - :!! B ! 4 *!! - (+! $8$@$$ C, - / ,(!$ λ 5!;5λ7;5< !5-!5=7374> !;!5λ--5!7λ (!!5=7374> 7 5λ- 5λ - 374!λ =7374> 7! 8
61 !"#$ % "&'( )*** **( *** )** * "( +,, -α. -"" -"".-" α-** -/0 1/ # 5 # ( α *2*
62 "(.*** #7 5 # 8,# "",* 9 4 -α. -/ #7 5 # 1/1/51 - :66 ;( ;-β;. ;-"( ; -"(.-" β -**(2 4 # 5 # $3β <α ( 3 ;66;. ;(.*** #7 5 # $ 4 4 "( ; -/1 < - #< < ;-β;. <α;. -</ #7 5 # 1/ #< < 1/51 -= #7 < := #7 < 66 #< <

* %")


63 &( (, * + " * /1! "# $ % & &'( )* % & &'( )* &( (, * $! "# $ &( (, *. * 3! "# $ % & &'( )* <
64 &((,*!,"">,?' "%"/1 %!,,* "'?, '" %"/1 % )$ 4("" ("" 4.** " 4**3 -α. α-/0 1/ 0.1?** *4?4%4 A?*4 9
65 !" #$%&'" ( %)*+,"" " %% ,-,. + -/ %.+ 01%23 1% --- )- %%.-4
66 5678 "71%-"9& : ##.9;*-4 19;# %" 0 %. 171: 0 % 07%7 010 <0 "+- := :1 " :17> 0 $.#> :"#>="#= & :- 01 :"71:0. : 6:81 % %:+ %.71: &0 - " 0?6+8"7?6+@8 - " 0A6%+8"7A6%+@8 B-%%7 -+C % " #= & :7 :D : %.71: 0 01D :& :1&9 :"<9= =+" 016DEFG8<6EFG81&9= 716#>=86&9=81& # H%++7-
67 :1 1 % :'H, B7" %.%-%-C %.:16868@ % 1 1:> % $. #> :>%"# : & % & "#>=>%"#= & % & 71: 01 0 B.1>=>%"9;#>=>%@:.GI#>=>% 4;GD# %7 : F :B CBC 71: 0:17> 0 71;GD#" 01 : :19;#> :"9;#>= : :> :19;#> :"1% 19;#> :>% : : " : 123 % %6" ""8 G
68 ,% 'F%- G#>=>% :- %%- :0 -G : -9;#>=>%"- C F%86G#> :>%86&FF :81&DF# %869;#> :>%86G :81E9# 7 - E7 E7 17 1EGDG# 7 1: 0: 17 > 01GDG#>6G :81#> :,% '% :- %%- :0-9 : #= & "-C %869;#> :>%869 :81E;;# 7 1: 016#> :869 :81ED# 7 - E7 E7 17 1&99G# >6 08 1&99G#>6%86&F9 :8 1I# : & % & -,% 5 ": G( (1;G9#= & & (-.: G86;G9#= & & 8 686DGD9D% & 8 GI#= & % & ' : >1G(> 9
++-,' J( 4 :7 - \"7")


69 )++- J(. 6&G%8 % %-5 -% % $ % 4- )++-,' J( 4 :7 - "7 "%71 0 :7 "%7 - E7 E7 1 :: "%7 1: 0 $4- :7 - "%71 0 :7 "%7 1: 0@: :7 4- "%7 - E7 44- E7 1 : 4- "% %-,% 55 : >1G(> :4:(: 4
70 APPENDIX Graphing with Excel This guide was developed by Glenn Lo, James Beck, and Michael Janusa as part of the project entitled Distance Delivery of Chemistry Laboratory Courses Department of Physical Sciences, Nicholls State University, Thibodaux, LA Project funding provided by Louisiana Board of Regents Distance Education Initiative Contract number LA-DL-DEI-30-02/03
71 Graphing with Excel LESSON OBJECTIVES. Students will be able to Use Excel to create XY graphs that effectively and aesthetically convey the relationship between experimental quantities Calculate slope and intercept of the trend lines for any part of the data Draw linear trend lines based on any part of the data G. Lo, M. Janusa, J. Beck, Department of Physical Sciences, Nicholls State University, 2003 Funds provided by La. Board of Regents Distance Education Initiative, Contract# LA-DL-DEI-02/03 How to create an (x,y)-type plot Enter x and y values in adjacent columns Highlight x and y values Click on Insert, Chart, Standard Types, XY (Scatter) Select first chart subtype (points only, no connecting lines) Click on Finish G. Lo, M. Janusa, J. Beck, Department of Physical Sciences, Nicholls State University, 2003 Funds provided by La. Board of Regents Distance Education Initiative, Contract# LA-DL-DEI-02/03 How to resize the chart Click on the chart area so that eight sizing handles (little black squares appear on the edges.) Hold mouse pointer over these handles and a double-headed arrow appears. When it does, you can hold down the left mouse button and drag it to resize the chart. Release mouse button when you re done. G. Lo, M. Janusa, J. Beck, Department of Physical Sciences, Nicholls State University, 2003 Funds provided by La. Board of Regents Distance Education Initiative, Contract# LA-DL-DEI-02/03 1
72 How to add/change titles Click on the chart. The menu bar should now show Chart. On the menu bar, click on Chart, then click on Chart Options Click on the Titles tab. Enter the title for the axes in the appropriate boxes. Do not enter a title for chart; copy it to Word and use a figure caption to describe it. Click OK. G. Lo, M. Janusa, J. Beck, Department of Physical Sciences, Nicholls State University, 2003 Funds provided by La. Board of Regents Distance Education Initiative, Contract# LA-DL-DEI-02/03 How to format the axes Double click on the axis you want to format Hold mouse pointer over axis until Value (X) axis or Value (Y) axis appears in a yellow box. Then, double click. When window with the current settings will pops up. Click on the Patterns tab to specify how you want your axes and tick marks to be drawn. Click on the Scale tab to specify the range of values for your axes, how far apart the major and minor tick marks should be, and where the axis crosses the other axis. Click on the Font tab to specify the font to use for your labels. Click on the Number tab to specify how the numbers on your axis are displayed. Click on the Alignment tab if you want to rotate the labels on the tick marks. G. Lo, M. Janusa, J. Beck, Department of Physical Sciences, Nicholls State University, 2003 Funds provided by La. Board of Regents Distance Education Initiative, Contract# LA-DL-DEI-02/03 How to format the border and background for the plot area Double click on plot area Hold mouse over plot area until you see Plot Area in a yellow box. Then, double click. Click on the Patterns tab to modify the border and background information Select None for Area in order to have a white background, if you want to save on printer ink. G. Lo, M. Janusa, J. Beck, Department of Physical Sciences, Nicholls State University, 2003 Funds provided by La. Board of Regents Distance Education Initiative, Contract# LA-DL-DEI-02/03 2
73 How to format the way your data is displayed Click on one of the points and the Format Data Series window should pop up. Click on the Pattern tab to specify the shape of the markers for the points and whether or not Excel should connect the dots. Generally, you want to set Line to None (you don t want Excel to connect the dots. ) G. Lo, M. Janusa, J. Beck, Department of Physical Sciences, Nicholls State University, 2003 Funds provided by La. Board of Regents Distance Education Initiative, Contract# LA-DL-DEI-02/03 How to set grid lines Click on the chart. On the menu bar, click on Chart, Chart Options, and then the Gridlines tab. Specify whether you want a gridline for each major tick mark. Specify whether you want a gridline for each minor tick mark. G. Lo, M. Janusa, J. Beck, Department of Physical Sciences, Nicholls State University, 2003 Funds provided by La. Board of Regents Distance Education Initiative, Contract# LA-DL-DEI-02/03 How to change placement of legend Click on the chart. On the menu bar, click on Chart, Chart Options, and then the Legend tab. Select position for legend. Uncheck Show Legend if you do not want it displayed. If you only have one set of (x,y) values, you should not have a legend G. Lo, M. Janusa, J. Beck, Department of Physical Sciences, Nicholls State University, 2003 Funds provided by La. Board of Regents Distance Education Initiative, Contract# LA-DL-DEI-02/03 3
74 How to change text in legend Click on the chart. On the menu bar, click on Chart, Source Data. The Source Data window will pop up. Click on Series tab. Select on the name of the series Series = set of (x,y) values Enter or edit the name for the series G. Lo, M. Janusa, J. Beck, Department of Physical Sciences, Nicholls State University, 2003 Funds provided by La. Board of Regents Distance Education Initiative, Contract# LA-DL-DEI-02/03 How to add another set of (x,y) values to your graph Click on the chart. On the menu bar, click on Chart, Source Data. The Source Data window will pop up. Click on the Series tab, then Add. Click on the icon with the red arrow in the blank for Y values. The Source Data Values window will pop up Highlight the second set of y values. Click on the icon with the red arrow in the Source Data-Values window to bring the Source Data window back up. Click on the icon with the red arrow in the blank for X values. Highlight the second set of X values. Click on the icon with the red arrow in the Source Data- X Values window to bring the Source Data window back up. G. Lo, M. Janusa, J. Beck, Department of Physical Sciences, Nicholls State University, 2003 Funds provided by La. Board of Regents Distance Education Initiative, Contract# LA-DL-DEI-02/03 Formatting numbers Highlight the cell(s) you want to format. On the menu bar, click Format, Cells. The Format Cells window will pop up. To specify the number of decimal places to be displayed, click on the Number tab, click on Number or Scientific, specify the number of decimal places, then click OK. Click on other tabs (Alignment, Font, Border, or Pattern) to change how the numbers are displayed. G. Lo, M. Janusa, J. Beck, Department of Physical Sciences, Nicholls State University, 2003 Funds provided by La. Board of Regents Distance Education Initiative, Contract# LA-DL-DEI-02/03 4
75 How to add the best fit line Click on one of the points. On the menu bar, click on Chart, Add Trendline Click on the Type tab. Select Linear type. Click OK. G. Lo, M. Janusa, J. Beck, Department of Physical Sciences, Nicholls State University, 2003 Funds provided by La. Board of Regents Distance Education Initiative, Contract# LA-DL-DEI-02/03 Formatting the best fit line Double click on the trend line. The Format Trendline window will pop up. Click on the Patterns to set Style, Color, and Weight for the line Click on Options to do extrapolations: in Forecast box, specify how far forward (along the x axis) or back you want to draw the line G. Lo, M. Janusa, J. Beck, Department of Physical Sciences, Nicholls State University, 2003 Funds provided by La. Board of Regents Distance Education Initiative, Contract# LA-DL-DEI-02/03 How to show the trendline equation Double click on the trend line. The Format Trendline window will pop up. Click on the Options tab. Check the box next to Display Equation on Chart, then Click OK. G. Lo, M. Janusa, J. Beck, Department of Physical Sciences, Nicholls State University, 2003 Funds provided by La. Board of Regents Distance Education Initiative, Contract# LA-DL-DEI-02/03 5
76 Formatting the trendline equation Use the mouse to drag the equation to where you want it displayed Double-click on the equation to specify how values of slope and intercept are displayed (font, number format, alignment, background) G. Lo, M. Janusa, J. Beck, Department of Physical Sciences, Nicholls State University, 2003 Funds provided by La. Board of Regents Distance Education Initiative, Contract# LA-DL-DEI-02/03 How to show a linear trend line based on just a part of the data First plot just the part of the data you re interested in Draw a trend line and extrapolate if you wish Add the entire set of data as a second set of (x,y) values. G. Lo, M. Janusa, J. Beck, Department of Physical Sciences, Nicholls State University, 2003 Funds provided by La. Board of Regents Distance Education Initiative, Contract# LA-DL-DEI-02/03 6
Microsoft Word for Report-Writing (2016 Version)
") Microsoft Word for Report-Writing (2016 Version) Microsoft Word is a versatile, widely-used tool for producing presentation-quality documents. Most students are well-acquainted with the program for generating
Microsoft Word for Report-Writing (2016 Version) Microsoft Word is a versatile, widely-used tool for producing presentation-quality documents. Most students are well-acquainted with the program for generating
Chemistry 1A Graphing Tutorial CSUS Department of Chemistry
 Chemistry 1A Graphing Tutorial CSUS Department of Chemistry Please go to the Lab webpage to download your own copy for reference. 1 When you open Microsoft Excel 2003, you will see a blank worksheet: Enter
ENV Laboratory 2: Graphing
 Name: Date: Introduction It is often said that a picture is worth 1,000 words, or for scientists we might rephrase it to say that a graph is worth 1,000 words. Graphs are most often used to express data
Chemistry 30 Tips for Creating Graphs using Microsoft Excel
 Chemistry 30 Tips for Creating Graphs using Microsoft Excel Graphing is an important skill to learn in the science classroom. Students should be encouraged to use spreadsheet programs to create graphs.
MOVING FROM CELL TO CELL
 VCAE: EXCEL Lesson 1 Please send comments to Author: Zahra Siddiqui at zed_ess@hotmail.com Concepts Covered: Cell Address; Cell Pointer; Moving across Cells Constants: Entering, Editing, Formatting Using
Reading: Graphing Techniques Revised 1/12/11 GRAPHING TECHNIQUES
 GRAPHING TECHNIQUES Mathematical relationships between variables are determined by graphing experimental data. For example, the linear relationship between the concentration and the absorption of dilute
BioFuel Graphing instructions using Microsoft Excel 2003 (Microsoft Excel 2007 instructions start on page mei-7)
") BioFuel Graphing instructions using Microsoft Excel 2003 (Microsoft Excel 2007 instructions start on page mei-7) Graph as a XY Scatter Chart, add titles for chart and axes, remove gridlines. A. Select
BioFuel Graphing instructions using Microsoft Excel 2003 (Microsoft Excel 2007 instructions start on page mei-7) Graph as a XY Scatter Chart, add titles for chart and axes, remove gridlines. A. Select
Open a new Excel workbook and look for the Standard Toolbar.
 This activity shows how to use a spreadsheet to draw line graphs. Open a new Excel workbook and look for the Standard Toolbar. If it is not there, left click on View then Toolbars, then Standard to make
Scientific Graphing in Excel 2013
 Scientific Graphing in Excel 2013 When you start Excel, you will see the screen below. Various parts of the display are labelled in red, with arrows, to define the terms used in the remainder of this overview.
Introduction to Excel Workshop
 Introduction to Excel Workshop Empirical Reasoning Center June 6, 2016 1 Important Terminology 1. Rows are identified by numbers. 2. Columns are identified by letters. 3. Cells are identified by the row-column
Microsoft Excel Using Excel in the Science Classroom
 Microsoft Excel Using Excel in the Science Classroom OBJECTIVE Students will take data and use an Excel spreadsheet to manipulate the information. This will include creating graphs, manipulating data,
Scientific Graphing in Excel 2007
 Scientific Graphing in Excel 2007 When you start Excel, you will see the screen below. Various parts of the display are labelled in red, with arrows, to define the terms used in the remainder of this overview.
Microsoft Excel 2007
 Microsoft Excel 2007 1 Excel is Microsoft s Spreadsheet program. Spreadsheets are often used as a method of displaying and manipulating groups of data in an effective manner. It was originally created
Dealing with Data in Excel 2013/2016
 Dealing with Data in Excel 2013/2016 Excel provides the ability to do computations and graphing of data. Here we provide the basics and some advanced capabilities available in Excel that are useful for
= 3 + (5*4) + (1/2)*(4/2)^2.
 + (1/2)*(4/2)^2.") Physics 100 Lab 1: Use of a Spreadsheet to Analyze Data by Kenneth Hahn and Michael Goggin In this lab you will learn how to enter data into a spreadsheet and to manipulate the data in meaningful ways.
Physics 100 Lab 1: Use of a Spreadsheet to Analyze Data by Kenneth Hahn and Michael Goggin In this lab you will learn how to enter data into a spreadsheet and to manipulate the data in meaningful ways.
Reference and Style Guide for Microsoft Excel
 Reference and Style Guide for Microsoft Excel TABLE OF CONTENTS Getting Acquainted 2 Basic Excel Features 2 Writing Cell Equations Relative and Absolute Addresses 3 Selecting Cells Highlighting, Moving
Pre-Lab Excel Problem
 Pre-Lab Excel Problem Read and follow the instructions carefully! Below you are given a problem which you are to solve using Excel. If you have not used the Excel spreadsheet a limited tutorial is given
Excel Primer CH141 Fall, 2017
 Excel Primer CH141 Fall, 2017 To Start Excel : Click on the Excel icon found in the lower menu dock. Once Excel Workbook Gallery opens double click on Excel Workbook. A blank workbook page should appear
0 Graphical Analysis Use of Excel
 Lab 0 Graphical Analysis Use of Excel What You Need To Know: This lab is to familiarize you with the graphing ability of excels. You will be plotting data set, curve fitting and using error bars on the
How to use Excel Spreadsheets for Graphing
 How to use Excel Spreadsheets for Graphing 1. Click on the Excel Program on the Desktop 2. You will notice that a screen similar to the above screen comes up. A spreadsheet is divided into Columns (A,
Introduction to Excel Workshop
 Introduction to Excel Workshop Empirical Reasoning Center September 9, 2016 1 Important Terminology 1. Rows are identified by numbers. 2. Columns are identified by letters. 3. Cells are identified by the
Microsoft Excel 2002 M O D U L E 2
 THE COMPLETE Excel 2002 M O D U L E 2 CompleteVISUAL TM Step-by-step Series Computer Training Manual www.computertrainingmanual.com Copyright Notice Copyright 2002 EBook Publishing. All rights reserved.
Chemistry Excel. Microsoft 2007
 Chemistry Excel Microsoft 2007 This workshop is designed to show you several functionalities of Microsoft Excel 2007 and particularly how it applies to your chemistry course. In this workshop, you will
How to Make Graphs with Excel 2007
 Appendix A How to Make Graphs with Excel 2007 A.1 Introduction This is a quick-and-dirty tutorial to teach you the basics of graph creation and formatting in Microsoft Excel. Many of the tasks that you
Excel 2016 Intermediate for Windows
 1 Excel 2016 Intermediate for Windows Excel Intermediate Training Objective To learn the tools and features of Excel 2016, and gain vital skills to use Excel more efficiently and effectively. What you
HOUR 12. Adding a Chart
 HOUR 12 Adding a Chart The highlights of this hour are as follows: Reasons for using a chart The chart elements The chart types How to create charts with the Chart Wizard How to work with charts How to
Microsoft Excel 2007 Creating a XY Scatter Chart
 Microsoft Excel 2007 Creating a XY Scatter Chart Introduction This document will walk you through the process of creating a XY Scatter Chart using Microsoft Excel 2007 and using the available Excel features
You are to turn in the following three graphs at the beginning of class on Wednesday, January 21.
 Computer Tools for Data Analysis & Presentation Graphs All public machines on campus are now equipped with Word 2010 and Excel 2010. Although fancier graphical and statistical analysis programs exist,
Appendix C. Vernier Tutorial
 C-1. Vernier Tutorial Introduction: In this lab course, you will collect, analyze and interpret data. The purpose of this tutorial is to teach you how to use the Vernier System to collect and transfer
Creating a Basic Chart in Excel 2007
 Creating a Basic Chart in Excel 2007 A chart is a pictorial representation of the data you enter in a worksheet. Often, a chart can be a more descriptive way of representing your data. As a result, those
Creating and Modifying Charts
 Creating and Modifying Charts Introduction When you re ready to share data with others, a worksheet might not be the most effective way to present the information. A page full of numbers, even if formatted
Technology Assignment: Scatter Plots
 The goal of this assignment is to create a scatter plot of a set of data. You could do this with any two columns of data, but for demonstration purposes we ll work with the data in the table below. You
COMPUTER TECHNOLOGY SPREADSHEETS BASIC TERMINOLOGY. A workbook is the file Excel creates to store your data.
 SPREADSHEETS BASIC TERMINOLOGY A Spreadsheet is a grid of rows and columns containing numbers, text, and formulas. A workbook is the file Excel creates to store your data. A worksheet is an individual
Chapter 3: Rate Laws Excel Tutorial on Fitting logarithmic data
 Chapter 3: Rate Laws Excel Tutorial on Fitting logarithmic data The following table shows the raw data which you need to fit to an appropriate equation k (s -1 ) T (K) 0.00043 312.5 0.00103 318.47 0.0018
Department of Chemical Engineering ChE-101: Approaches to Chemical Engineering Problem Solving Excel Tutorial VIII
 Department of Chemical Engineering ChE-101: Approaches to Chemical Engineering Problem Solving Excel Tutorial VIII EXCEL Basics (last updated 4/12/06 by GGB) Objectives: These tutorials are designed to
SUM - This says to add together cells F28 through F35. Notice that it will show your result is
 COUNTA - The COUNTA function will examine a set of cells and tell you how many cells are not empty. In this example, Excel analyzed 19 cells and found that only 18 were not empty. COUNTBLANK - The COUNTBLANK
NUMERICAL COMPUTING For Finance Using Excel. Sorting and Displaying Data
 NUMERICAL COMPUTING For Finance Using Excel Sorting and Displaying Data Outline 1 Sorting data Excel Sort tool (sort data in ascending or descending order) Simple filter (by ROW, COLUMN, apply a custom
Visual Physics - Introductory Lab Lab 0
 Your Introductory Lab will guide you through the steps necessary to utilize state-of-the-art technology to acquire and graph data of mechanics experiments. Throughout Visual Physics, you will be using
Microsoft Excel. Charts
 Microsoft Excel Charts Chart Wizard To create a chart in Microsoft Excel, select the data you wish to graph or place yourself with in the conjoining data set and choose Chart from the Insert menu, or click
Open Excel by following the directions listed below: Click on Start, select Programs, and the click on Microsoft Excel.
 Candy is Dandy Grading Rubric You have been hired to conduct some market research about M&M's. First, you had your team purchase 4 large bags and the results are given for the contents of those bags. You
Excel Core Certification
 Microsoft Office Specialist 2010 Microsoft Excel Core Certification 2010 Lesson 6: Working with Charts Lesson Objectives This lesson introduces you to working with charts. You will look at how to create
Excel for Gen Chem General Chemistry Laboratory September 15, 2014
 Excel for Gen Chem General Chemistry Laboratory September 15, 2014 Excel is a ubiquitous data analysis software. Mastery of Excel can help you succeed in a first job and in your further studies with expertise
Plotting Graphs. Error Bars
 E Plotting Graphs Construct your graphs in Excel using the method outlined in the Graphing and Error Analysis lab (in the Phys 124/144/130 laboratory manual). Always choose the x-y scatter plot. Number
Lab1: Use of Word and Excel
 Dr. Fritz Wilhelm; physics 230 Lab1: Use of Word and Excel Page 1 of 9 Lab partners: Download this page onto your computer. Also download the template file which you can use whenever you start your lab
Models for Nurses: Quadratic Model ( ) Linear Model Dx ( ) x Models for Doctors:
 Linear Model Dx ( ) x Models for Doctors:") The goal of this technology assignment is to graph several formulas in Excel. This assignment assumes that you using Excel 2007. The formula you will graph is a rational function formed from two polynomials,
The goal of this technology assignment is to graph several formulas in Excel. This assignment assumes that you using Excel 2007. The formula you will graph is a rational function formed from two polynomials,
The American University in Cairo. Academic Computing Services. Excel prepared by. Maha Amer
 The American University in Cairo Excel 2000 prepared by Maha Amer Spring 2001 Table of Contents: Opening the Excel Program Creating, Opening and Saving Excel Worksheets Sheet Structure Formatting Text
Creating a Histogram Creating a Histogram
 Creating a Histogram Another great feature of Excel is its ability to visually display data. This Tip Sheet demonstrates how to create a histogram and provides a general overview of how to create graphs,
Activity: page 1/10 Introduction to Excel. Getting Started
 Activity: page 1/10 Introduction to Excel Excel is a computer spreadsheet program. Spreadsheets are convenient to use for entering and analyzing data. Although Excel has many capabilities for analyzing
Excel 2003 Tutorial II
 This tutorial was adapted from a tutorial by see its complete version at http://www.fgcu.edu/support/office2000/excel/index.html Excel 2003 Tutorial II Charts Chart Wizard Chart toolbar Resizing a chart
Total Number of Students in US (millions)
") The goal of this technology assignment is to graph a formula on your calculator and in Excel. This assignment assumes that you have a TI 84 or similar calculator and are using Excel 2007. The formula you
The goal of this technology assignment is to graph a formula on your calculator and in Excel. This assignment assumes that you have a TI 84 or similar calculator and are using Excel 2007. The formula you
SciGraphica. Tutorial Manual - Tutorials 1and 2 Version 0.8.0
 SciGraphica Tutorial Manual - Tutorials 1and 2 Version 0.8.0 Copyright (c) 2001 the SciGraphica documentation group Permission is granted to copy, distribute and/or modify this document under the terms
Microsoft Excel 2000 Charts
 You see graphs everywhere, in textbooks, in newspapers, magazines, and on television. The ability to create, read, and analyze graphs are essential parts of a student s education. Creating graphs by hand
Excel 2013 Intermediate
 Instructor s Excel 2013 Tutorial 2 - Charts Excel 2013 Intermediate 103-124 Unit 2 - Charts Quick Links Chart Concepts Page EX197 EX199 EX200 Selecting Source Data Pages EX198 EX234 EX237 Creating a Chart
Graphing with Microsoft Excel
 Graphing with Microsoft Excel As an AP Physics 1 student, you must be prepared to interpret and construct relationships found in physical laws and experimental data. This exercise is meant to familiarize
Information Technology and Media Services. Office Excel. Charts
 Information Technology and Media Services Office 2010 Excel Charts August 2014 Information Technology and Media Services CONTENTS INTRODUCTION... 1 CHART TYPES... 3 CHOOSING A CHART... 4 CREATING A COLUMN
Visual Physics Introductory Lab [Lab 0]
![Visual Physics Introductory Lab [Lab 0]](/thumbs/74/69956143.jpg "Visual Physics Introductory Lab [Lab 0]") Your Introductory Lab will guide you through the steps necessary to utilize state-of-the-art technology to acquire and graph data of mechanics experiments. Throughout Visual Physics, you will be using
Your Introductory Lab will guide you through the steps necessary to utilize state-of-the-art technology to acquire and graph data of mechanics experiments. Throughout Visual Physics, you will be using
Excel 2010 Worksheet 3. Table of Contents
 Table of Contents Graphs and Charts... 1 Chart Elements... 1 Column Charts:... 2 Pie Charts:... 6 Line graph 1:... 8 Line Graph 2:... 10 Scatter Charts... 12 Functions... 13 Calculate Averages (Mean):...
Graphing Single Subject Research Data. AAC Colloquium October 18 th, 2017
 Graphing Single Subject Research Data AAC Colloquium October 18 th, 2017 Set up the spreadsheet Input the data Graph Harry s data Click and hold, then drag to select Harry s data Just for the top graph
Tricking it Out: Tricks to personalize and customize your graphs.
 Tricking it Out: Tricks to personalize and customize your graphs. Graphing templates may be used online without downloading them onto your own computer. However, if you would like to use the templates
Physics Guide to Excel
 Physics Guide to Excel 5795 Summer 1999 HIGHER STILL Physics Guide to Excel Support Materials qrstuv This publication may be reproduced in whole or in part for educational purposes provided that no profit
Physics 211 E&M and Modern Physics Spring Lab #1 (to be done at home) Plotting with Excel. Good laboratory practices
 Plotting with Excel. Good laboratory practices") NORTHERN ILLINOIS UNIVERSITY PHYSICS DEPARTMENT Physics 211 E&M and Modern Physics Spring 2018 Lab #1 (to be done at home) Lab Writeup Due: Mon/Wed/Thu/Fri, Jan. 22/24/25/26, 2018 Read Serway & Vuille:
NORTHERN ILLINOIS UNIVERSITY PHYSICS DEPARTMENT Physics 211 E&M and Modern Physics Spring 2018 Lab #1 (to be done at home) Lab Writeup Due: Mon/Wed/Thu/Fri, Jan. 22/24/25/26, 2018 Read Serway & Vuille:
Getting Started With Excel
 Chapter 1 Getting Started With Excel This chapter will familiarize you with various basic features of Excel. Specific features which you need to solve a problem will be introduced as the need arises. When
Experiment 1 CH Fall 2004 INTRODUCTION TO SPREADSHEETS
 Experiment 1 CH 222 - Fall 2004 INTRODUCTION TO SPREADSHEETS Introduction Spreadsheets are valuable tools utilized in a variety of fields. They can be used for tasks as simple as adding or subtracting
PRACTICAL EXERCISE 1.1.6b
 PRACTICAL EXERCISE 1.1.6b PLAN, SELECT & USE APPROPRIATE IT SYSTEMS & SOFTWARE 1. Explain the purpose for using IT. EXPLAIN THE PURPOSE FOR USING IT a) Explain the type of document that is to be produced
Project 4 Financials (Excel)
") Project 4 Financials (Excel) Project Objective To offer an introduction to building spreadsheets, creating charts, and entering functions. Part 1 - Financial Projections One of the most important aspects
Project 4 Financials (Excel) Project Objective To offer an introduction to building spreadsheets, creating charts, and entering functions. Part 1 - Financial Projections One of the most important aspects
Introduction to CS graphs and plots in Excel Jacek Wiślicki, Laurent Babout,
 MS Excel 2010 offers a large set of graphs and plots for data visualization. For those who are familiar with older version of Excel, the layout is completely different. The following exercises demonstrate
Activity Graphical Analysis with Excel and Logger Pro
 Activity Graphical Analysis with Excel and Logger Pro Purpose Vernier s Logger Pro is a graphical analysis software that will allow you to collect, graph and manipulate data. Microsoft s Excel is a spreadsheet
Spreadsheet Warm Up for SSAC Geology of National Parks Modules, 2: Elementary Spreadsheet Manipulations and Graphing Tasks
 University of South Florida Scholar Commons Tampa Library Faculty and Staff Publications Tampa Library 2009 Spreadsheet Warm Up for SSAC Geology of National Parks Modules, 2: Elementary Spreadsheet Manipulations
Candy is Dandy Project (Project #12)
") Candy is Dandy Project (Project #12) You have been hired to conduct some market research about M&M's. First, you had your team purchase 4 large bags and the results are given for the contents of those
Candy is Dandy Project (Project #12) You have been hired to conduct some market research about M&M's. First, you had your team purchase 4 large bags and the results are given for the contents of those
Office Excel. Charts
 Office 2007 Excel Charts October 2007 CONTENTS INTRODUCTION... 1 Bold text... 2 CHART TYPES... 3 CHOOSING A CHART... 4 CREATING A COLUMN CHART... 5 FORMATTING A COLUMN CHART... 8 Changing the chart style...
Excel Spreadsheets and Graphs
 Excel Spreadsheets and Graphs Spreadsheets are useful for making tables and graphs and for doing repeated calculations on a set of data. A blank spreadsheet consists of a number of cells (just blank spaces
Introduction to IgorPro
 Introduction to IgorPro These notes provide an introduction to the software package IgorPro. For more details, see the Help section or the IgorPro online manual. [www.wavemetrics.com/products/igorpro/manual.htm]
CAPE. Community Behavioral Health Data. How to Create CAPE. Community Assessment and Education to Promote Behavioral Health Planning and Evaluation
 CAPE Community Behavioral Health Data How to Create CAPE Community Assessment and Education to Promote Behavioral Health Planning and Evaluation i How to Create County Community Behavioral Health Profiles
Excel Tips and FAQs - MS 2010
 BIOL 211D Excel Tips and FAQs - MS 2010 Remember to save frequently! Part I. Managing and Summarizing Data NOTE IN EXCEL 2010, THERE ARE A NUMBER OF WAYS TO DO THE CORRECT THING! FAQ1: How do I sort my
Practical 1P1 Computing Exercise
 Practical 1P1 Computing Exercise What you should learn from this exercise How to use the teaching lab computers and printers. How to use a spreadsheet for basic data analysis. How to embed Excel tables
MICROSOFT EXCEL Working with Charts
 MICROSOFT EXCEL 2010 Working with Charts Introduction to charts WORKING WITH CHARTS Charts basically represent your data graphically. The data here refers to numbers. In Excel, you have various types of
Creating Charts in Office 2007 Table of Contents
 Table of Contents Microsoft Charts... 1 Inserting a Chart in Excel... 1 Tip Shortcut Key to Create a Default Chart in Excel... 2 Activating Your Chart... 2 Resizing an Embedded Chart... 2 Moving a Chart...
To be able to create charts that graphically represent your worksheet data, you will: Create column charts on chart sheets by using the F11 key.
 L E S S O N 1 Creating charts Suggested teaching time 55-65 minutes Lesson objectives To be able to create charts that graphically represent your worksheet data, you will: a b c Create column charts on
Rockefeller College MPA Excel Workshop: Clinton Impeachment Data Example
 Rockefeller College MPA Excel Workshop: Clinton Impeachment Data Example This exercise is a follow-up to the MPA admissions example used in the Excel Workshop. This document contains detailed solutions
Microsoft Office Excel
 Microsoft Office 2007 - Excel Help Click on the Microsoft Office Excel Help button in the top right corner. Type the desired word in the search box and then press the Enter key. Choose the desired topic
Understand and plan a chart Create a chart Move and resize charts and chart objects Apply chart layouts and styles
 Working with Charts Objectives Understand and plan a chart Create a chart Move and resize charts and chart objects Apply chart layouts and styles 2 Objectives Customize chart elements Enhance a chart Create
Intermediate Microsoft Excel (Demonstrated using Windows XP) Using Spreadsheets in the Classroom
 Using Spreadsheets in the Classroom") (Demonstrated using Windows XP) Using Spreadsheets in the Classroom Adapted from Taskstream Word Tutorial (2003) < http://www.taskstream.com > Updated 4/05 by Dr. Bruce Ostertag What Can Microsoft Excel
(Demonstrated using Windows XP) Using Spreadsheets in the Classroom Adapted from Taskstream Word Tutorial (2003) < http://www.taskstream.com > Updated 4/05 by Dr. Bruce Ostertag What Can Microsoft Excel
Lab Activity #2- Statistics and Graphing
 Lab Activity #2- Statistics and Graphing Graphical Representation of Data and the Use of Google Sheets : Scientists answer posed questions by performing experiments which provide information about a given
Using Charts in a Presentation 6
 Using Charts in a Presentation 6 LESSON SKILL MATRIX Skill Exam Objective Objective Number Building Charts Create a chart. Import a chart. Modifying the Chart Type and Data Change the Chart Type. 3.2.3
Gloucester County Library System EXCEL 2007
 Gloucester County Library System EXCEL 2007 Introduction What is Excel? Microsoft E x c e l is an electronic s preadsheet program. I t is capable o f performing many diff e r e n t t y p e s o f c a l
MICROSOFT EXCEL BUILDING GRAPHS
 MICROSOFT EXCEL BUILDING GRAPHS Basic steps for creating graph in Microsoft Excel: 1. Input your data in an Excel file. 2. Choose a type of graph to create. 3. Switch axes if necessary. 4. Adjust your
Tables in Microsoft Word
 Tables in Microsoft Word In this lesson we re going to create and work with Tables in Microsoft Word. Tables are used to improve the organisation and presentation of data in your documents. If you haven
Here is the data collected.
 Introduction to Scientific Analysis of Data Using Spreadsheets. Computer spreadsheets are very powerful tools that are widely used in Business, Science, and Engineering to perform calculations and record,
Excel 2016 Charts and Graphs
 Excel 2016 Charts and Graphs training@health.ufl.edu Excel 2016: Charts and Graphs 2.0 hours This workshop assumes prior experience with Excel, Basics I recommended. Topics include data groupings; creating
San Francisco State University
 San Francisco State University Michael Bar Instructions for Excel 1. Plotting analytical function. 2 Suppose that you need to plot the graph of a function f ( x) = x on the interval [ 5,5]. Step 1: make
Computer Data Analysis and Use of Excel
 Computer Data Analysis and Use o Excel I. Theory In this lab we will use Microsot EXCEL to do our calculations and error analysis. This program was written primarily or use by the business community, so
9 POINTS TO A GOOD LINE GRAPH
 NAME: PD: DATE: 9 POINTS TO A GOOD LINE GRAPH - 2013 1. Independent Variable on the HORIZONTAL (X) AXIS RANGE DIVIDED BY SPACES and round up to nearest usable number to spread out across the paper. LABELED
Content provided in partnership with Que, from the book Show Me Microsoft Office Access 2003 by Steve JohnsonÃÃ
 ,PSURYLQJWKH$SSHDUDQFHRI )RUPVDQGHSRUWV Content provided in partnership with Que, from the book Show Me Microsoft Office Access 00 by Steve JohnsonÃÃ Introduction The objects in a database most on display
Excel 2016 Charting. Course objectives: Student Training and Support. Staff Training (Bookings)
") Excel 2016 Charting Course objectives: Distinguish between Charts and Graphs Creating a basic chart and template Format and configure chart output Represent Time, Frequency and Proportions Combining Charts
Excel 2016 Charting Course objectives: Distinguish between Charts and Graphs Creating a basic chart and template Format and configure chart output Represent Time, Frequency and Proportions Combining Charts
Survey of Math: Excel Spreadsheet Guide (for Excel 2016) Page 1 of 9
 Page 1 of 9") Survey of Math: Excel Spreadsheet Guide (for Excel 2016) Page 1 of 9 Contents 1 Introduction to Using Excel Spreadsheets 2 1.1 A Serious Note About Data Security.................................... 2 1.2
Survey of Math: Excel Spreadsheet Guide (for Excel 2016) Page 1 of 9 Contents 1 Introduction to Using Excel Spreadsheets 2 1.1 A Serious Note About Data Security.................................... 2 1.2
Error Analysis, Statistics and Graphing
 Error Analysis, Statistics and Graphing This semester, most of labs we require us to calculate a numerical answer based on the data we obtain. A hard question to answer in most cases is how good is your
Project 11 Graphs (Using MS Excel Version )
") Project 11 Graphs (Using MS Excel Version 2007-10) Purpose: To review the types of graphs, and use MS Excel 2010 to create them from a dataset. Outline: You will be provided with several datasets and will
Project 11 Graphs (Using MS Excel Version 2007-10) Purpose: To review the types of graphs, and use MS Excel 2010 to create them from a dataset. Outline: You will be provided with several datasets and will
Exercise 5 Animated Excel Charts in PowerPoint
 Exercise 5 Animated Excel Charts in PowerPoint This is a fun exercise to show you how even graphs can become even more interesting if you use multimedia. You will write some slides on your own to summarize
Formatting Values. 1. Click the cell(s) with the value(s) to format.
 with the value(s) to format.") Formatting Values Applying number formatting changes how values are displayed it doesn t change the actual information. Excel is often smart enough to apply some number formatting automatically. For example,
Formatting Values Applying number formatting changes how values are displayed it doesn t change the actual information. Excel is often smart enough to apply some number formatting automatically. For example,
Section 33: Advanced Charts
 Section 33 Advanced Charts By the end of this Section you should be able to: Use Chart Options Add Moving Averages to Charts Change a 3D Chart View Use Data Labels and Markers Create Stacked Bar Charts