FY st Quarter Consolidated Results
|
|
|
- Lawrence Hines
- 5 years ago
- Views:
Transcription

")
1 1 st Quarter Consolidated Results (Fiscal year ended March 31, 2012) August 11,
2 The forecasted results which appear in this report have been prepared based solely on the information which was available to us as of the date on which the report was released. As a result, actual results may differ from the forecasted figures due to a number of factors, such as changes in the business environment in the future. 2 2
3 1. Business Result 3 3
4 Consolidated Results 1 st Quarter (Billions of yen) Q1 Q1 ( 億円 ) Change Sales Gross Profit Operating Income % 3.6% 0.9% -2.7% Ordinary Income Income before income taxes % 1.7% Net Income Exchange Rates (JPY) % 1.3% USD EUR Sales : -6.5 Foreign Exchange Impact -4.0 Operating Income: -2.1 Gross Profit -3.2 Labor Cost decrease +0.4 R & D decrease +0.2 Other cost decrease +0.4 Ordinary Income: -2.2 Operating Income -2.1 Equity method income -0.2 Exchange Gain increase +0.3 Other Non Operating Loss -0.2 Income before income taxes:-1.7 Ordinary Income -2.2 Extraordinary Income increase + Extraordinary Loss decrease
5 Sales by Reported Segments Optical Others Clock (Billion Yen) * (Q1) (Q1) Change Watch Electronics Components ELC Watch Clock Optical Products Others Watch Watch SII ELC SII ELC Clock Optical Others Cons. Ad. Q1 Q2 Q3 Q4 Q1 Cons. Total Exc. Rates (JPY) USD EUR
6 Operating Income by Reported Segments Cons. Ad. Others Optical Clock ELC Watch (Billion yen) * (Q1) (Q1) Change Watch Electronics Components Clock Optical Products Others Business Total Cons. Ad Q1 Q2 Q3 Q4 Q1 Cons. Total
7 Information of Reported Segments 7 7
8 Watch Business (Billi. JPY) 35.0 Sales (Billi. yen) 5.0 Operating Income Q1 Q2 Q3 Q4 Q1 Q2 Q3 Q4 8 8
9 Watch Business (Billi. JPY) SII (incl. watch movements) Retail SWC (For overseas) SWC (For Japan) Q1 Composition Ratio of Sales of SWC Complete Watch by Brand 41% 33% (Incl. Highpriced products) 26% 25.0 Q1 39% 31% (Incl. Highpriced products) 29% SII Retail SWC (for overseas) SWC (for Japan) Q1 Q2 Q3 Q4 33% 10% 32% 24% Q1 Complete Watch Q1 Q4 Q3 Q2 Q1 SEIKO (for Overseas) 43% 38% 35% 38% 43% 17% SEIKO (for Japan) Composition Ratio of Sales of SWC Complete Watch by Area 15% 20% 18% 15% 18% 14% 15% 16% 16% Others 29% 26% 27% 30% 26% 0% 20% 40% 60% 80% 100% Japan America Europe & Africa Asia, Middle East and Oceania 9
10 Watch Business Brand Business - Domestic - - In April, activity was languid due in part to the Great East Japan Earthquake. However, there signs of a potential recovery to take place from May up through June. - In the high-priced product segment, the GRAND SEIKO line, particularly the SEIKO 130th anniversary commemorative model, demonstrated favorable sales performance. Net sales for CREDOR and other high-priced products during the first three-month period ending 30 June 2011 exceeded those during the same period last year. - In the Middle-priced & volume zone, the high-functioning radio wave controlled BRIGHTZ model continued to perform satisfactorily among SEIKO' s Men' s lineup. In the Ladies' lineup, LUKIA and TISSE achieved sales growth due to the favorable performance of new spring models
11 Watch Business Brand Business - Overseas - North America : The reinforcement of low- to mid-priced solar products by SEIKO yielded improved, robust sales in major retail. Europe : The cooling-off of consumption in European markets minus Germany intensified, constricting sales of medium- to highpriced products. Asia : Thailand, China and other Asian markets performed favorably as a whole, causing net sales to greatly exceed those posted last year. Watch Movement Business Net sales continued to grow from the previous year for high value-added models in particular, with the chronograph line performing especially well
12 Electronics Components Business Sales Operating Income (Billi. JPY) (Billi. JPY) Q1 Q2 Q3 Q Q1 Q2 Q3 Q
 50 45 40 35 Composition of Sales Ratio Scientific Instruments & Others System Application Electronics Components Mechatronics 17% 85 % 100% 15 % SII Precision SII Scientific Instruments")

13 Electronics Components Business (Billi. JPY) Composition of Sales Ratio Scientific Instruments & Others System Application Electronics Components Mechatronics 17% 85 % 100% 15 % SII Precision SII Scientific Instruments Measurement and analysis instruments, Radiation detection and measurement Systems, etc. System Applications Network system etc. Order Entry Systems, Electronic dictionaries, Color printers, etc % 13 % Precision Electronics Components Oscillator ICs, etc % 25% Q1 Q2 Q3 Q4 Q % 87 % 34 % SII Precision SII CMOS ICs, Quartz crystals, Micro batteries, LCD devices, etc. Mechatronics Shutters for cameras, Assembly of precision machinary Hard disk component, Precision mechanical devices, Thermal printers units etc. 13
14 Electronics Components Business Mechatronics - HDD components sales fell due to stagnant growth in the laptop PC market as well as customer-side inventory adjustments. - Digital cameras shutter sales declined due to problems in the supply chain for digital single-lens reflex F/P shutters precipitated by the Great East Japan Earthquake. - In others areas, net sales for mall Thermal printers units fell under those posted for last year due to inventory adjustment period commencing particularly in developed countries
15 Electronics Components Business Electronics Components Semiconductors: - Car-mounted EEPROMs in particular were sluggish due to supply chain problems precipitated by the Great East Japan Earthquake. However, orders are currently on a path to recovery. - In the timing IC field, which includes ICs and RTCs for oscillators, a sizeable increase in orders yielded satisfactory sales performance. Others: - Although orders from China for quartz oscillators continued to be brisk, the impact of the appreciated yen prevented net sales from growing
16 Electronics Components Business System Applications - Severe circumstances continued to surround Systems Application business area, mainly due to curbs on investment in order entry system within the food service industry. This situation was further exacerbated by the Great East Japan Earthquake. Despite this, sales of mobile communications modules for security use continued their steady performance from the previous year. - Net sales of digital printing products were also sluggish mainly due to curbs in capital investment as well as the appreciation of the yen. Furthermore, following the Great East Japan Earthquake, sales of repair parts and expendable supplies also declined due to power conservation efforts. However, new products released in March have been well received. Scientific Instruments Amid unfavorable public and private sector demand due to the impact of the Great East Japan Earthquake, sales of radiation counters grew significantly under the weight of the nuclear plant accidents
17 Clock Business (Billi. JPY) Sales Q1 Q2 Q3 Q4 Japanese Market - Sales of luxury products at mostly department stores and specialty shops are experiencing delays in recovery. - Net sales for home improvement stores progressed favorably. - Depressed unit prices resulted in worsened income margins. (Billi. JPY) Operating Income Q1 Q2 Q3 Q4 17 Overseas Market - The North American market drove overseas as a whole with healthy online sales of TVs and net-based sales. - Sales in the Europe and Middle Eastern markets have stagnated mainly due to political instability and fiscal problems. 17
18 Optical Products Business (Billi. JPY) Sales Japanese Market - The unabated single price point shops has perpetuated an ongoing downwards trend in unit sales prices. - Sales amounts continue to decline due to depressed average unit prices. Q1 Q2 Q3 Q4 Overseas Market (Billi. JPY) 0.2 Operating Income Q1 Q2 Q3 Q In the North American and European markets, sales of products for major mass merchandisers and major optical product chains progressed satisfactorily, with net sales exceeding those posted for the previous year on a local currency basis. However, sales growth on a Japanese yen basis slowed down under the appreciation of Euro currency. 18
19 Other Business (Billi. JPY) Sales Q1 Q2 Q3 Q4 Operating Income Retail Business - Low customer traffic during April and May precipitated by the Great East Japan Earthquake yielded decline in sales compared to same quarter last year. Sales are inclining towards recovery since the renewal of Wako main store in June including the opening of Seiko Salon on the 1 st floor. Other Business (Billi. JPY) Withdrawing from the golf business in May 2011 yielded a major decline in net sales. - Architectural clocks performed just about in line with expectations Q1 Q2 Q3 Q4 19
20 Other Business Sales Operating Income (Billi. JPY) Others Fitness products and musical accessories Retail (Billi. JPY) Others Fitness products and musical accessories Retail 0.1 Others 3.0 Others Fitness and Musical products Retail Retail Fitness and Musical products Q1 Q2 Q3 Q4 Q1-0.8 Q1 Q2 Q3 Q4 Q
21 B/S and C/F 21 21
22 Balance Sheet as of 30 Jun, 2011 (Billions of yen) 30 Jun March 2011 (a) 30 Jun 2011 (b) Change (b) (a) A/R Inventories Tangible Fixed assets Loan Payable Net Assets Total Assets Equity Capital Ratio 8.5% 9.3% 8.9% 0.4% Net Debt Equity Ratio Employee Number 18,756 18,442 18,
23 Borrowings Balance (Billi. JPY) Short Term Borrowings Current Portion of Long-Term Borrowings Long Term Borrowings Net borrowed reserve Forecast End of Jun End of Sep. End of Dec. End of Mar. End. of Jun. End of Mar
24 Cash Flow (Billi. JPY) 1 CF from Operating Activities CF from Investing Activities Free CF FY2009 Q1 Q1 (Biili. JPY) Q Income before income tax and minority interests Depreciation and amortization Ohters Net cash provided by (used in) operating activities Purchase of property, plant and equipment Others Net cash provided by (used in) investing activities Net increase (decrease) in borrowings Others Net cash provided by (used in) financing activities FY2009 Q1 Q1 Q1 Cash and cash equivalents at end of period Free cash flow
25 2. Financial Forecast for 25 25
26 Summary of Financial Forecast for (Billions of yen) Forecast 1 st Half Forecast Full year Sales Operating Income % 3.7% 2.7% 3.8% Ordinary Income % 2.1% 1.3% 2.5% Net Income % 0.7% 0.3% 1.3% 26 Exch. Rate (JPY) USD EUR
27 Financial Forecasts for by Segment Sales Operating Income (Billions of yen) (Forecasts) Change (Forecasts) Change Watch Electronics Components Clock Optical Products Others Cons. Total
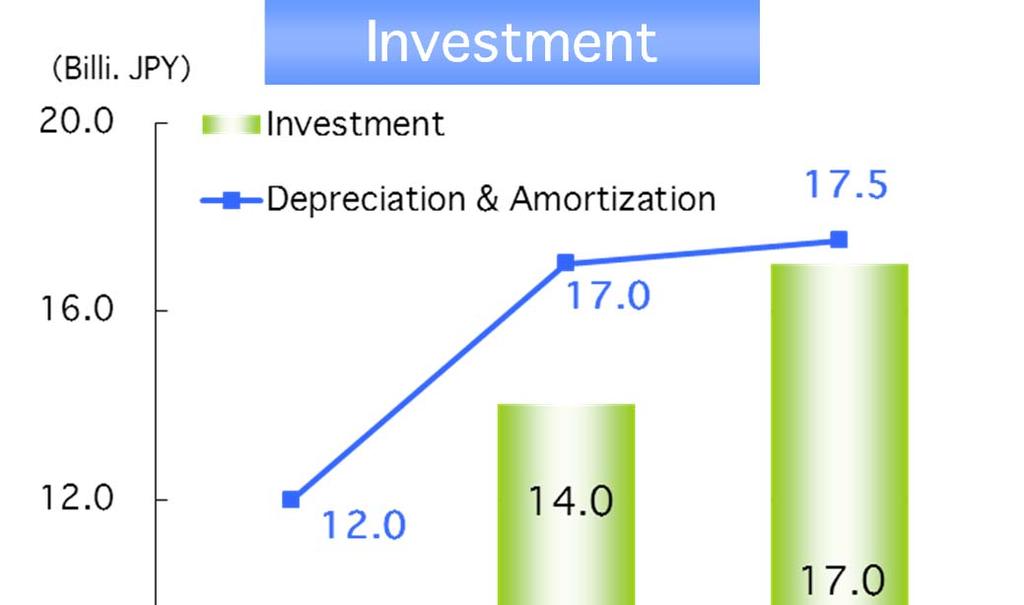

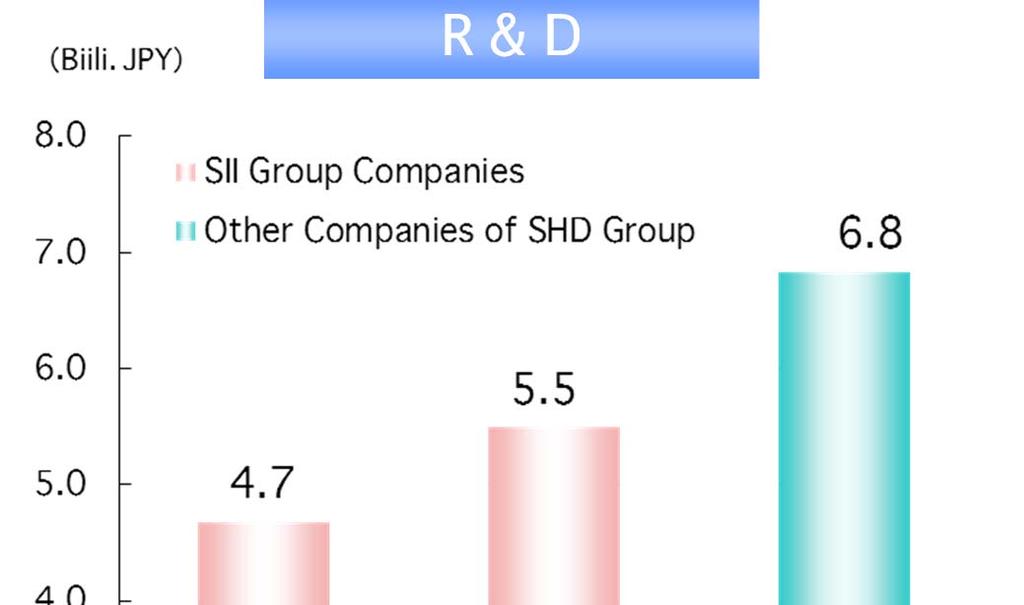

28 Investment / Research and Development Cost Investment R & D 28 28
29 Exchange Rate Sensitivity by Exchange Rate <Period Jul Mar. 2012> (Billions of yen) USD EUR Sales Operating Income (JPY) <Trend of Exchange Rate> Original Budget USD USD USD Original Budget EUR EUR EUR Apr May Jun Jul Aug Sep Oct Nov Dec Jan Feb Mar 29 Sales by Aria Asia, Middle East & Oceania 35% Europe & Africa 10% North & Latine America 8% Japan 47% * Actual data Average Rate Closing Date Q1 Q2 Q3 Q4 (Q1-Q4) Average USD EUR USD EUR Q1 (Q2 Q4) Forecasts Original Budget
30 End 30 30
Consolidated Financial Results for the Second Quarter, Fiscal 2018
 Consolidated Financial Results for the Second Quarter, Fiscal 2018 Ⅰ. Consolidated Financial Results for the First Half, Fiscal 2018 Consolidated Financial Results for Fiscal 2018 Ⅱ. Supplementary Data
the 3-month period ended Jun.30,2011 July 28,
 Financial Highlights the 3-month period ended Jun.30,2011 (Fiscal 2011) July 28, 2011 http://www.hitachi-metals.co.jp E-Mail:hmir@hitachi-metals.co.jpco Performance Overview First Quarter of Fiscal 2011
Hitachi Announces Consolidated Financial Results for the First Quarter of Fiscal 2006
 FOR IMMEDIATE RELEASE Hitachi Announces Consolidated Financial Results for the First Quarter of Fiscal 2006 Tokyo, July 31, 2006 --- Hitachi, Ltd. (NYSE:HIT / TSE:6501) today announced its consolidated
the 6-month period ended Sep.30,2011 October 28,
 Financial Highlights the 6-month period ended Sep.30,2011 (Fiscal 2011) October 28, 2011 http://www.hitachi-metals.co.jp E-Mail:hmir@hitachi-metals.co.jpco Highlights Fiscal2010 Fiscal2011 billion, ( ):
Explanatory Material for Financial Report for Third Quarter of Fiscal 2012 Ending March 31, February 1, 2012 Hitachi Cable, Ltd.
 Explanatory Material for Financial Report for Third Quarter of Fiscal 2012 Ending March 31, 2012 February 1, 2012 Hitachi Cable, Ltd. 2012 Hitachi Cable, Ltd. All rights reserved. 1 Table of Contents 1.
Consolidated Financial Results for the First Quarter Fiscal 2015
 Consolidated Financial Results for the First Quarter Fiscal 2015 Ⅰ. Financial Results for Fiscal 2015 Financial Results for Fiscal 2015 Ⅱ. Information by Product Group Ⅲ. Supplementary Data SHARP CORPORATION
Sony Ericsson continues to invest for future growth
 PRESS RELEASE April 23, 2008 Sony Ericsson continues to invest for future growth Q1 Highlights: Year-on-year volume growth of 2% Income before taxes at higher end of forecast R&D investment continues to
Explanatory Material for Financial Report for Second Quarter of Fiscal 2012 Ending March 31, October 28, 2011 Hitachi Cable, Ltd.
 Explanatory Material for Financial Report for Second Quarter of Fiscal 2012 Ending March 31, 2012 October 28, 2011 Hitachi Cable, Ltd. 2011 Hitachi Cable, Ltd. All rights reserved. 1 Table of Contents
PRESS RELEASE January 16, 2009 Sony Ericsson reports results for fourth quarter and full year 2008
 PRESS RELEASE January 16, 2009 Sony Ericsson reports results for fourth quarter and full year 2008 Highlights: Global economic slowdown leads to contracting consumer demand Previously announced annual
Kyocera Corporation Investor Meeting (November 2, 2009)
") Kyocera Corporation Investor Meeting (November 2, 2009) President and Representative Director, Tetsuo Kuba < Slide 1: Financial results of H1 FY3/2010 - Comparison with H1 FY3/2009 - > As shown in this
Kyocera Corporation Investor Meeting (November 2, 2009) President and Representative Director, Tetsuo Kuba < Slide 1: Financial results of H1 FY3/2010 - Comparison with H1 FY3/2009 - > As shown in this
PRESS RELEASE October 17, 2008
 PRESS RELEASE October 17, 2008 Sony Ericsson reports third quarter results Q3 highlights: Break even results, excluding restructuring charges, as challenging business conditions continued C902 Cyber-shot
Sony Ericsson starts 2007 with strong first quarter
 PRESS RELEASE April 20, 2007 Sony Ericsson starts 2007 with strong first quarter Q1 Highlights: Year-on-year volume & sales growth of 63% and 47% respectively Income before tax rose 139% year-on-year to
Hitachi Metals FY2014 First Quarter Financial Results
 Hitachi Metals FY2014 First Quarter Financial Results July 29, 2014 http://www.hitachi-metals.co.jp FY2014 1Q Performance Overview (April June 2014) Coupled with steady growth in demand, we achieved substantial
PRESS RELEASE April 19, 2011
 PRESS RELEASE April 19, 2011 Sony Ericsson reports first quarter 2011 results Highlights: Shift to Android-based smartphone portfolio drives profitability Smartphone share of total sales more than doubled
Consolidated Financial Highlights 18F First Quarter
 Consolidated Financial Highlights 18F First Quarter 6737 July 31st, 2018 Consolidated Income Statement 17Q1 18Q1 (JPY Million) Amount (%) Amount (%) (%) Net Sales 19,376 100.0 16,540 100.0 85.4 Cost of
Hitachi Metals. Financial Results for the First Nine Months of Fiscal Year Ending March 31, 2016 (April 1, 2015 to December 31, 2015) January 28, 2016
 January 28, 2016") Hitachi Metals Financial Results for the First Nine Months of Fiscal Year Ending March 31, 2016 (April 1, 2015 to December 31, 2015) January 28, 2016 COPYRIGHT 2016 Hitachi Metals, Ltd. 1-1. Overview of
Hitachi Metals Financial Results for the First Nine Months of Fiscal Year Ending March 31, 2016 (April 1, 2015 to December 31, 2015) January 28, 2016 COPYRIGHT 2016 Hitachi Metals, Ltd. 1-1. Overview of
Sony Ericsson sells over 100 million handsets in 2007
 PRESS RELEASE January 16, 2008 Sony Ericsson sells over 100 million handsets in 2007 Q4 Highlights: 2007 Highlights: 18% increase in volume year-on-year Continued market share gains and profitable growth
Sony Ericsson reports second quarter 2010 results
 PRESS RELEASE July 16, 2010 Sony Ericsson reports second quarter 2010 results Q2 Highlights: Income before taxes excl. restructuring charges increases to Euro 63 million Positive cash flow generated from
Business Result for the Second Quarter ended September 30, 2017 Regional Market Environments and Projections
 Business Result for the Second Quarter ended September 3, 217 Regional Market Environments and Projections October 2, 217 Hitachi Construction Machinery Co., Ltd. Executive Vice President and Executive
Financial Results for the Nine Months Ended December 31, 2012
 Financial Results for the Nine Months Ended December 31, 2012 February 6, 2013 The forward-looking statements and projected figures concerning the future performance of NTT and its subsidiaries and affiliates
2015 Annual Results Presentation (Audited results for the year ended 31 December)
") Presentation (Audited results for the year ended 31 December) Agenda 1 Financial Highlights 2 Business Review 3 Outlook TCL X1 Series TV 1. Financial Highlights 3 Financial Highlights (For the year ended
Presentation (Audited results for the year ended 31 December) Agenda 1 Financial Highlights 2 Business Review 3 Outlook TCL X1 Series TV 1. Financial Highlights 3 Financial Highlights (For the year ended
(Revenue by business segment) FY2018 (Nine Months Ended December 31, 2018) PQA Others Mobile. Electronics Infrastructure 53% 28% 19% 24% 8%
 FY2018 (Nine Months Ended December 31, 2018) PQA Others Mobile. Electronics Infrastructure 53% 28% 19% 24% 8%") (No notes here) 1 (No notes here) 2 (No notes here) 3 (Revenue by business segment) FY2018 (Nine Months Ended December 31, 2018) T&M:68% Network PQA Others Mobile Electronics Infrastructure 53% 28% 19%
(No notes here) 1 (No notes here) 2 (No notes here) 3 (Revenue by business segment) FY2018 (Nine Months Ended December 31, 2018) T&M:68% Network PQA Others Mobile Electronics Infrastructure 53% 28% 19%
Hitachi Announces Consolidated Financial Results for the First Half of Fiscal 2006
 FOR IMMEDIATE RELEASE Hitachi Announces Consolidated Financial Results for the First Half of Fiscal 2006 Tokyo, October 31, 2006 --- Hitachi, Ltd. (NYSE:HIT / TSE:6501) today announced its consolidated
Economic Update German American Chamber of Commerce
 Economic Update German American Chamber of Commerce Federal Reserve Bank of Chicago October 6, 2015 Paul Traub Senior Business Economist U.S. Real GDP Billions Chained $2009, % Change Q/Q at SAAR $ Billions
3. Results by Business Segment
 3. Results by Business Segment Information on net sales (including intersegment sales) and operating income for the first half broken out by business segment is presented below. Technology Solutions Net
Consolidated Financial Highlights 17F Third Quarter February 2018
 Consolidated Financial Highlights 17F Third Quarter 6737 February 2018 Consolidated Income Statement (JPY Million) 16Q1-3 17Q1-3 YoY Amount (%) Amount (%) (%) Net Sales 57,837 100.0 61,479 100.0 106.3
Management Plan for FY2018 April 27, 2018 Fuji Electric Co., Ltd.
 Management Plan for April 27, 2018 Fuji Electric Co., Ltd. 1 Corporate Philosophy Corporate Philosophy We, Fuji Electric, pledge as responsible corporate citizens in a global society to strengthen our
As a note, this presentation was released as the dates shown and reflected management views as of these dates. All information in this presentation
 July 2003 1 As a note, this presentation was released as the dates shown and reflected management views as of these dates. All information in this presentation regarding the Company s financial results
Explanatory Material of Group Company for the Fiscal Year Ended March 31, 2018
 -- Explanatory Material of Group Company for the Fiscal Year Ended March, 08 Makino Milling Machine Co., Ltd Apr. 6, 08 Apr. 6, 08 Copyright @ 005 Makino Milling Machine Co.,Ltd. All Rights Reserved Consolidated
2016 Fourth Quarter Earnings. March 2017
 2016 Fourth Quarter Earnings March 2017 Disclaimer The information is provided for informational purposes only, and is not an offer to buy or sell or a solicitation of an offer to buy or sell any security
Consolidated Financial Highlights 18F First Half
 Consolidated Financial Highlights 18F First Half 6737 October 31st, 2018 Consolidated Income Statement (JPY Million) 17F1 18F1 17F1 vs. 18F1 Amount (%) Amount (%) (%) Net Sales 38,330 100.0 34,711 100.0
Interim Report on the First Half of /01/ 2017
 Interim Report on the First Half of 2017 01/01/ 2017 30/06/ 06/30/ 2 ITELLIGENCE KEY FIGURES MEUR Jan 1 June 30, 2017 Jan 1 June 30, 2016 Apr 1 June 30, 2017 Apr 1 June 30, 2016 Total revenues 416.2 357.7
Business Report FY29 Apr Dec. 2011
 Business Report FY29 Apr. 2011-Dec. 2011 Wacom Co., Ltd. (TSE Sec.1 6727) 1 All Rights Reserved. Copyright 2012 Wacom Co., Ltd. Index Slide Page P 3 5 FY29 3Q Result Summary P 6-10 P/L and Operating Expenses
Kyocera Corporation Financial Presentation
 November 2, 2009 Kyocera Corporation Financial Presentation (Six Months Ended September 30, 2009) Tetsuo Kuba President and Representative Director Financial Results of H1 FY3/2010 Comparison with H1 FY3/2009
Kyocera Corporation Financial Presentation
 Kyocera Corporation Financial Presentation (Year Ended March 31, 2007) May 7, 2007 Kyocera Corporation ForwardLooking Statements Certain of the statements made in this document are forwardlooking statements
Micronic Mydata Q4, Peter Uddfors, President and CEO Carl-Johan Blomberg, CFO 1 February, 2011
 Micronic Mydata Q4, 2010 Peter Uddfors, President and CEO Carl-Johan Blomberg, CFO 1 February, 2011 Agenda Brief company presentation Key figures Q4, 2010 Market information Outlook Page 2 Micronic Mydata
Financial Results for 1st quarter of the Fiscal Year ending March 31, 2012
 Financial Results for 1st quarter of the Fiscal Year ending March 31, 2012 July 29th, 2011 Hirokazu Hashimoto President and Group CEO Anritsu Corporation 1 Cautionary Statement All information contained
Micronic Mydata Q1, Peter Uddfors, President and CEO Carl-Johan Blomberg, CFO 28 April, 2011
 Micronic Mydata Q1, 2011 Peter Uddfors, President and CEO Carl-Johan Blomberg, CFO 28 April, 2011 Agenda Brief company presentation Key figures Q1, 2011 Market information Outlook Page 2 Micronic Mydata
Hitachi Announces 2018 Mid-term Management Plan
 FOR IMMEDIATE RELEASE Contacts: Japan: Mickey Takeuchi U.K.: Yuki Maeda Hitachi, Ltd. Hitachi Europe Ltd. +81-3-5208-9324 +44-1628-585714 masayuki.takeuchi.cc@hitachi.com yuki.maeda@hitachi-eu.com Hitachi
Hitachi s History of Transformation
 Management Strategy Hitachi s History of Transformation (Fiscal 2004 Fiscal 2013) Recovery from management crisis and on to a new growth stage. In fiscal 2013, Hitachi achieved new record highs in operating
Hitachi Announces Consolidated Financial Results for Fiscal 2017
 FOR IMMEDIATE RELEASE Hitachi Announces Consolidated Financial Results for Fiscal 2017 Tokyo, April 27, 2018 --- Hitachi, Ltd. (TSE:6501) today announced its consolidated financial results for fiscal 2017,
Group Business Strategies and Management Policy
 Kyocera Corporation Investor Meeting in Hong Kong Kyocera 2006 Group Business Strategies and Management Policy Vice Chairman and Representative Director Masahiro Umemura November 30, 2006 Presentation
Business Report for H1 FY ending March 31, 2019 (April-September 2018)
") Business Report for H1 FY ending March 31, 2019 (April-September 2018) Wacom Chapter 2 Wacom Co., Ltd. (TSE 1st Sec. Code: 6727) Contents Index 3 H1 FY 03/19 (April-September 2018) Results Overview 4-5
Business Report for H1 FY ending March 31, 2019 (April-September 2018) Wacom Chapter 2 Wacom Co., Ltd. (TSE 1st Sec. Code: 6727) Contents Index 3 H1 FY 03/19 (April-September 2018) Results Overview 4-5
Earnings Release Conference First Quarter of FY2012 (April 1, 2012 to June 30, 2012) July 31, 2012 Murata Manufacturing Co., Ltd.
 July 31, 2012 Murata Manufacturing Co., Ltd.") Earnings Release Conference First Quarter of FY2012 (April 1, 2012 to June 30, 2012) July 31, 2012 Murata Manufacturing Co., Ltd. 1. First Quarter of FY2012 From April 1, 2012 to June 30, 2012 Consolidated
Earnings Release Conference First Quarter of FY2012 (April 1, 2012 to June 30, 2012) July 31, 2012 Murata Manufacturing Co., Ltd. 1. First Quarter of FY2012 From April 1, 2012 to June 30, 2012 Consolidated
FOURTH QUARTER AND FULL YEAR 25 JANUARY 2010
 FOURTH QUARTER AND FULL YEAR 25 JANUARY 21 HENRY STÉNSON SENIOR VICE PRESIDENT COMMUNICATIONS FOURTH QUARTER AND FULL YEAR This presentation contains forward looking statements. Such statements are based
Columbus delivers 52% growth in revenue
 Release no. 20, 2018 Interim Management Statement for Q3 YTD 2018 November 7th, 2018 Release no. 20/2018 Interim Management Statement Q3 YTD 2018 Columbus delivers 52% growth in revenue In the first three
Financial Results for the Three Months Ended June 30, August 7, 2018
 Financial Results for the Three Months Ended June 30, 2018 August 7, 2018 Copyright 2018 NIPPON TELEGRAPH AND TELEPHONE CORPORATION 1 This document is a translation of the Japanese original. The Japanese
October Machinery Orders
 Japan's Economy 13 December 2017 (No. of pages: 6) October Machinery Orders Manufacturing industry shows strong growth trend Japanese report: 13 Dec 2017 Economic Research Dept. Kazuma Maeda Shunsuke Kobayashi
Performance Briefings First Half of Fiscal Year March, 2013 TDK Corporation October 31, 2012
 Performance Briefings First Half of Fiscal Year March, 2013 TDK Corporation October 31, 2012 Copyright 2012 TDK Corporation. All rights reserved. Performance Briefings First Half of Fiscal Year March,
Revenues % % Gross operating margin % %
 Revenues 64.0 70.7 +10% 121.5 135.1 +11% Gross operating margin 34.0 34.8 +3% 63.5 69.5 +10% % of revenues 53.1% 49.3% 52.3% 51.5% Income from ordinary operations 7.8 8.7 +11% 16.1 16.7 +4% % of revenues
Business Report April, 2017 to December, 2017 (Q3, FY ending March 31, 2018)
") Business Report April, 2017 to December, 2017 (Q3, FY ending March 31, 2018) Wacom Co., Ltd. (TSE 1st Sec. Code: 6727) Contents Index 3-4 Q3 FY 03/2018 (April, 2017 to November, 2017) Results Overview
Business Report April, 2017 to December, 2017 (Q3, FY ending March 31, 2018) Wacom Co., Ltd. (TSE 1st Sec. Code: 6727) Contents Index 3-4 Q3 FY 03/2018 (April, 2017 to November, 2017) Results Overview
Conference Call Second Quarter 2003 Financial Results. Jorma Ollila Chairman and CEO
 Conference Call Second Quarter 2003 Financial Results Jorma Ollila Chairman and CEO Olli-Pekka Kallasvuo Executive Vice President and CFO Ulla James Vice President, Investor Relations July 17, 2003 15.00
Trend Micro Reports Record First Quarter Revenue & Operating Profit
 Trend Micro Reports Record First Quarter Revenue & Operating Profit Continued strong growth in U.S and Asia highlight quarter Tokyo, Japan April 25, 2006 Trend Micro, Incorporated (TSE: 4704, NASDAQ: TMIC),
FY2017 Financial Results & FY2018 Forecast May, 2018 Hitachi Zosen Corporation
 FY2017 Financial & FY2018 May, 2018 Hitachi Zosen Corporation 2018 Hitachi Zosen Corporation contents 1. Overview of FY2017 Consolidated Financial 2. of FY2018 3. FY2017 Topics 4. Details by Segments 5.
Earnings Release Conference FY2011 (April 2011 to March 2012) April 27, 2012 Murata Manufacturing Co., Ltd.
 April 27, 2012 Murata Manufacturing Co., Ltd.") Earnings Release Conference FY2011 (April 2011 to March 2012) April 27, 2012 Murata Manufacturing Co., Ltd. 1. Financial Results of FY2011 From April 2011 to March 2012 Consolidated basis 2 Financial Results
Earnings Release Conference FY2011 (April 2011 to March 2012) April 27, 2012 Murata Manufacturing Co., Ltd. 1. Financial Results of FY2011 From April 2011 to March 2012 Consolidated basis 2 Financial Results
Trend Micro Reports Second Quarter Results
 Trend Micro Reports Second Quarter Results Technology and service acquisitions and significant growth in networking products highlight quarter Tokyo, Japan August 03, 2005 Trend Micro, Inc. (TSE: 4704,
Optorun Co., Ltd. Earnings Announcement For the Fiscal Year Ended December February 14, 2018
 Optorun Co., Ltd. Earnings Announcement For the Fiscal Year Ended December 2017 February 14, 2018 Financial Highlights (Consolidated) Big increases in sales and earnings Strong sales of coaters in the
Slide title 48 pt 21 july 2011 Slide subtitle 30 pt
 21 july 211 Helena norrman SENIOR VICE PRESIDENT COMMUNICATIONS THIS PRESENTATION CONTAINS FORWARD-LOOKING STATEMENTS. SUCH STATEMENTS ARE BASED ON OUR CURRENT EXPECTATIONS AND ARE SUBJECT TO CERTAIN RISKS
The Group s consolidated order intake increased by 12% year on year to 22.6 billion yen and revenue increased by 8% year on year to 21.0 billion yen.
 (No notes here) 1 (No notes here) 2 (No notes here) 3 (No notes here) 4 The Group s consolidated order intake increased by 12% year on year to 22.6 billion yen and revenue increased by 8% year on year
Business Report. FY25-3Q Apr.-Dec Wacom Co., Ltd. (TSE Sec ) Business Report Q Copyright 2008 Wacom Co., Ltd. All Rights Reserved.
 Business Report Q Copyright 2008 Wacom Co., Ltd. All Rights Reserved.") Business Report FY25-3Q Apr.-Dec. 2007 Wacom Co., Ltd. (TSE Sec.1 6727) Business Report 2007 3Q Copyright 2008 Wacom Co., Ltd. All Rights Reserved. Contents FY07-3Q Consolidated Summary Consolidated P/L
Business Report FY25-3Q Apr.-Dec. 2007 Wacom Co., Ltd. (TSE Sec.1 6727) Business Report 2007 3Q Copyright 2008 Wacom Co., Ltd. All Rights Reserved. Contents FY07-3Q Consolidated Summary Consolidated P/L
1Q17 RESULTS M AY / 2017
 RESULTS M AY / 2017 Positivo Tecnologia recorded a net revenue of R$453.5 million in, an increase of 20.7% Continuous progress in the diversification of the business, with mobile phones reaching 32.6%
Sharp Corporation May 17, 2010
 Sharp Corporation May 17, 2010 Ⅰ. Sharp s achievements in fiscal year 2009 Ⅱ. Action to realize mid-term vision (1) Sharp s business targets (2) Sharp s key businesses - Large-size LCD, LCD TV - Medium
3. FY2014 Earnings Projections
 3. FY2014 Earnings Projections Fujitsu s financial performance in the third quarter exceeded the company s projections owing to the contributions made by improved profitability in the company s Services
Business Report April, 2016 to June, 2016 (Q1 of FY ending March 31, 2017) Wacom Co., Ltd. (TSE Sec )
 Wacom Co., Ltd. (TSE Sec )") Business Report April, 2016 to June, 2016 (Q1 of FY ending March 31, 2017) Wacom Co., Ltd. (TSE Sec.1 6727) Contents Index 3-4 Q1 FY 03/17 (Apr. to Jun. 2016) Results Overview 5-6 Consolidated P/L, Operating
Business Report April, 2016 to June, 2016 (Q1 of FY ending March 31, 2017) Wacom Co., Ltd. (TSE Sec.1 6727) Contents Index 3-4 Q1 FY 03/17 (Apr. to Jun. 2016) Results Overview 5-6 Consolidated P/L, Operating
Earnings Release Conference Second Quarter of FY2017
 Earnings Release Conference Second Quarter of FY2017 (July 1, 2017 to September 30, 2017) October 31,2017 Murata Manufacturing Co., Ltd. http://www.murata.com/ir/library/index.html 1. Second Quarter of
econd Quarter Report
 econd Quarter Report econd Quarter Report HENRY STÉNSON Senior Vice President Communications Safe Harbor Statement This presentation contains forward looking statements. Such statements are based on our
FY2015(Ended Mar. 31 st, 2016) Financial Overview and Mid-term Management Plan
 Financial Overview and Mid-term Management Plan") FY215(Ended Mar. 31 st, 216) Financial Overview and Mid-term Management Plan May 11 th, 216 Hitachi Koki Co., Ltd. 1-1 FY215 (Ended Mar. 31 st, 216) Result and Projection (IFRS) FY214 Revenues 135.8 Adjusted
FY215(Ended Mar. 31 st, 216) Financial Overview and Mid-term Management Plan May 11 th, 216 Hitachi Koki Co., Ltd. 1-1 FY215 (Ended Mar. 31 st, 216) Result and Projection (IFRS) FY214 Revenues 135.8 Adjusted
Business Result for the First Quarter ended June 30, 2018 Regional Market Environments and Projections
 Business Result for the First Quarter ended June 3, 218 Regional Market Environments and Projections July 2, 218 Masafumi Senzaki Executive Officer President, Marketing Div. Hitachi Construction Machinery
SINBON 2016Q4 Results & Prospects. Prepared By Finance Department 2017/1/5
 SINBON 2016Q4 Results & Prospects Prepared By Finance Department 2017/1/5 Safe Harbor Notice This presentation contains forward looking statements and is subject to significant risks and uncertainties.
Forward Looking Statement
 Forward Looking Statement This presentation contains forward-looking statements which are statements that refer to expectations and plans for the future and include, without limitation, statements regarding
hird Q uarter R eport
 hird Quarter Report Safe Harbor Statement This presentation contains forward looking statements. Such statements are based on our current expectations and are subject to certain risks and uncertainties
Lenovo Group Limited. 2007/08 Q1 Results. August 2, Lenovo
 Lenovo Group Limited 2007/08 Q1 Results August 2, 2007 2007 Lenovo Wong Wai Ming Senior Vice President & Chief Financial Officer 2007 Lenovo Lenovo Financial Summary Q1 2007/08 US$mn % Y/Y Q/Q Turnover
Ericsson Second quarter 2018
 Ericsson Second quarter 2018 July 18, 2018 Telefonaktiebolaget LM Ericsson 2018 Second quarter report 2018 July 18, 2018 Page 1 Peter Nyquist Vice President Investor Relations Telefonaktiebolaget LM Ericsson
Business Report April, 2015 to September, 2015 (2Q of FY ending March 31, 2016) Wacom Co., Ltd. (TSE Sec )
 Wacom Co., Ltd. (TSE Sec )") Business Report April, 2015 to September, 2015 (2Q of FY ending March 31, 2016) Wacom Co., Ltd. (TSE Sec.1 6727) Contents Index 3-4 2Q FY 03/16 (Apr. to Sep. 2015) Results Overview 5-6 Consolidated P/L
Business Report April, 2015 to September, 2015 (2Q of FY ending March 31, 2016) Wacom Co., Ltd. (TSE Sec.1 6727) Contents Index 3-4 2Q FY 03/16 (Apr. to Sep. 2015) Results Overview 5-6 Consolidated P/L
Financial Results for the Three Months Ended June 30, 2016
 Financial Results for the Three Months Ended June 30, 2016 August 5, 2016 The forward-looking statements and projected figures concerning the future performance of NTT and its subsidiaries and affiliates
2014 Forecast Results
 214 Forecast Results Duration Forecast Result* Accuracy US GDP 15 $16.98 Trillion $16.345 Trillion 98.5% US Ind. Prod. 13 11.5 (12MMA) 14.2 97.3% EU Ind. Prod. 14 1.6 (12MMA) 11.6 99.% Canada Ind Prod
Highlights 2014 Year of Ramp-Up
 Highlights 2014 Year of Ramp-Up Sales.. Organisational.. Financial.. Sales August NEXT Biometrics Sensors certified by Microsoft Sales August Signing of Distributor Agreement in Brazil DuoDigit Organisation
Net profit remained at the same level as the last fiscal year mainly due to the sale of investment securities during the third quarter.
 Net profit remained at the same level as the last fiscal year mainly due to the sale of investment securities during the third quarter. 1 In SG&A expenses, personnel expenses decreased following a fall
Taiwan Semiconductor Manufacturing Company Ltd. Announces First Quarter Results for the Period Ended March 31, 2000
 Page 1 FOR IMMEDIATE RELEASE CONTACT IN TAIWAN CONTACT IN NEW YORK Derek Tien or Julie Chan Mami Ogawa Finance Division TSMC Thomson Financial Investor Relations invest@tsmc.com.tw mami.ogawa@thomsonir.com
Regarding the Signing of Share Purchase Agreement for the Sale of Shares of Toshiba Visual Solutions Corporation
 November 14, 2017 Toshiba Corporation Regarding the Signing of Share Purchase Agreement for the Sale of Shares of Toshiba Visual Solutions Corporation TOKYO--Toshiba Corporation (TOKYO: 6502) today announced
Sales Volume of LCD TVs in the PRC Market and the Overseas Markets Increased by 4.6% and 18.0% Respectively
 (For Immediate Release) TCL Multimedia Announces 2016 Interim Results * * * * * * Continued Enhancements in Product Mix and Operational Efficiency Gross Profit Margin Further Improved to 17.4% Sales Volume
Financial Results for the Three Months Ended June 30, August 3, 2006
 Financial Results for the Three Months Ended June 30, 2006 August 3, 2006 Disclaimer Information The forward-looking statements and projected figures on the future performance of contained herein or referred
Quarterly Sales (in millions) FY 16 FY 15 FY 14 Q1 $706.8 $731.1 $678.5 Q Q Q
 FY 16 FY 15 FY 14 Q1 $706.8 $731.1 $678.5 Q Q Q") The following represents historical unaudited financial and statistical information regarding MSC s operations. MSC does not undertake any obligation to update any of the information presented below to
The following represents historical unaudited financial and statistical information regarding MSC s operations. MSC does not undertake any obligation to update any of the information presented below to
Hitachi Completes Transfer of Hard Disk Drive Business to Western Digital
 FOR IMMEDIATE RELEASE Contact: Japan: Hajime Kito Hitachi, Ltd. +81-3-5208-9323 hajime.kito.qy@hitachi.com Hitachi Completes Transfer of Hard Disk Drive Business to Western Digital Tokyo, March 9, 2012
Statistical Release Gross Domestic Product First Quarter 2012
 Statistical Release Gross Domestic Product First Quarter 2012 1.0 Economic performance Provisional estimates for the first quarter of 2012 show that the economy exped by 3.5 per cent over a similar quarter
Olli-Pekka Kallasvuo President & CEO Rick Simonson Executive Vice President & CFO. Bill Seymour Head of Investor Relations
 Conference Call Second Quarter 2007 Financial Results August 2, 2007 15.00 Helsinki time 8.00 New York time Olli-Pekka Kallasvuo President & CEO Rick Simonson Executive Vice President & CFO Bill Seymour
Hitachi Announces Consolidated Financial Results for Fiscal 2008
 FOR IMMEDIATE RELEASE Hitachi Announces Consolidated Financial Results for Fiscal 2008 Tokyo, May 12, 2009 --- Hitachi, Ltd. (NYSE:HIT / TSE:6501) today announced its consolidated financial results for
Glaston Interim Report January September 2016
 Glaston Interim Report January September 216 31 October 216 Q3 in brief Markets quiet at the beginning of the quarter, but picked up at the end of the review period Orders received totalled EUR 25.6 (28.2)
CORPORATE PRESENTATION 2014
 CORPORATE PRESENTATION 2014 ABOUT DIGITAL GAMING Digital gaming is everywhere Smartphones & Tablets Feature phones TVs & STBs Smartphones, tablets, smart TVs, STBs, smart watches Installed base of 2 billion
Nokia Conference Call First Quarter 2010 Financial Results
 Nokia Conference Call First Quarter 2010 Financial Results April 22, 2010 15.00 Helsinki time 8.00 New York time Olli-Pekka Kallasvuo CEO Timo Ihamuotila CFO Kristian Pullola Head of Treasury and Investor
SECOND QUARTER REPORT 2007
 SECOND QUARTER REPORT 2007 SECOND QUARTER REPORT HENRY STÉNSON Senior Vice President Communications 2007 Safe Harbor Statement This presentation contains forward looking statements. Such statements are
Second. Quarter Report
 Second Quarter Report Second Quarter Report PIA GIDEON Vice President, Market and External Relations, Ericsson Safe Harbor Statement This presentation contains forward looking statements. Such statements
TCL 多媒體科技控股有限公司 T C L M U LT I M E D I A T E C H N O L O G Y H O L D I N G S L I M I T E D ( S t o c k c o d e : )
") TCL 多媒體科技控股有限公司 T C L M U LT I M E D I A T E C H N O L O G Y H O L D I N G S L I M I T E D ( S t o c k c o d e : 0 1 0 7 0 ) 2017 Q3 Business Update Agenda 1 Business Review 2 Full Year Target Page 2 Business
TCL 多媒體科技控股有限公司 T C L M U LT I M E D I A T E C H N O L O G Y H O L D I N G S L I M I T E D ( S t o c k c o d e : 0 1 0 7 0 ) 2017 Q3 Business Update Agenda 1 Business Review 2 Full Year Target Page 2 Business
F-Secure Corporation - Interim report Q2 2011
 F-Secure Corporation - Interim report Q2 2011 (Unaudited) July 27, 2011 Kimmo Alkio, President & CEO Protecting the irreplaceable f-secure.com Q2 highlights Operator channel performed strongly showing
Nokia Corporation January 24, 2013 at 13:00 (CET +1)
") INTERIM REPORT 1(57) Nokia Corporation Q4 and full year 2012 Interim Report FINANCIAL AND OPERATING HIGHLIGHTS Fourth quarter 2012 highlights: Nokia Group non-ifrs EPS in Q4 2012 was EUR 0.06; reported
INTERIM REPORT 1(57) Nokia Corporation Q4 and full year 2012 Interim Report FINANCIAL AND OPERATING HIGHLIGHTS Fourth quarter 2012 highlights: Nokia Group non-ifrs EPS in Q4 2012 was EUR 0.06; reported
Ericsson First quarter 2018
 Ericsson First quarter 2018 April 20, 2018 Ericsson Internal 2018-02-21 Peter Nyquist Vice President Investor Relations Ericsson Internal 2018-02-21 First quarter 2018 April 20, 2018 This presentation
Lenovo Group Limited
 Lenovo Group Limited Credit Suisse Asia Investment Conference 2010 Hong Kong March 22 26, 2010 2010 Lenovo Financial Review 2010 Lenovo Lenovo FY20 Results Highlights Record high market share for three
Quarterly Bulletin - 1Q17 True Corporation PLC. Executive Summary:
 Executive Summary: True Group delivered another solid performance in the first quarter of 2017 with EBITDA growth of nearly 30% YoY and EBITDA margin increasing to 32% due to strong revenue growth and
Q3 11 Earnings Release. October 27, 2011
 Q3 11 Earnings Release October 27, 2011 Results are preliminary and unaudited. Therefore, the figures in this material are subject to change during the independent auditing process. Please note that statements
April Q 2017 Results Update
 April 2017 1Q 2017 Results Update Maintain Moderate Growth, Asset Quality and Good Earning momentum Moderate Loans Growth with Good Portfolio Quality: Loans growth: 10% (YoY); Deposit growth: 12% (YoY)