STAT 311 (3 CREDITS) VARIANCE AND REGRESSION ANALYSIS ELECTIVE: ALL STUDENTS. CONTENT Introduction to Computer application of variance and regression
|
|
|
- Beryl Henderson
- 5 years ago
- Views:
Transcription
1 STAT 311 (3 CREDITS) VARIANCE AND REGRESSION ANALYSIS ELECTIVE: ALL STUDENTS. CONTENT Introduction to Computer application of variance and regression analysis. Analysis of Variance: one way classification, tests of additivity Random experiments, experiments with one factor, completely randomized designs, randomized block designs, Latin squares designs Two way classification: random and mixed models, expectations of mean squares, test of additivity, model checking Multiple comparison procedures Experiments with more than two factors, fixed random and mixed models Factorial designs, 2 k factorial experiments Confounding and fractional replication Split-plot and nested designs Regression Analysis: least squares method. Multiple regression (2 or more independent variables), stepwise regression. The variances and covariances of regression coefficients, estimation of residuals The variance of estimators Analysis of variance table for regression Test of a general liner hypotheses Lack of fit Regression with dummy variables Nonlinear regression Matrix approach to regression Summary Excel application of variance and regression analyses.
2 Introduction to Computer Application MS Excel Application. Using a spreadsheet A spreadsheet is a computer program used to manipulate data and carry out calculations, or chains of calculations. The information in a spreadsheet is stored in a rectangular array of cell. The content of each cell can be a number, text or formula. The power of a spreadsheet is that a cell s numeric value can be linked to the content of one cell as the sum of the contents of two other cells. Furthermore, if the value of a cell is changed anywhere in the spreadsheet, all values dependent on it are recalculated and the new values are displayed immediately. The usual mathematical symbols of +, -, *(for x), /(for ) and ^ (for raising to a power). Parentheses are used in the usual fashion as grouping symbols Spreadsheets Electronic spreadsheets provide extensive graphing capabilities and their use is widespread. Because Microsoft products are the most widely used software products on a PC, all the examples will be based on the Microsoft spreadsheet for It is expected that all later versions of excel will support the handling characteristics of earlier versions with only a few minor changes.
3 Rows and Columns Every electronic spreadsheet consists of a collection of cells arranged in a rectangular array of columns and rows. To enable the identification of individual cells each cell has an address given by the column label followed by a row label. In excel spreadsheet the columns are labeled alphabetically from A onwards and the row are numbered from 1 onwards. So that the address with address H125 is on the H(8 th ) column of the 125 row as shown below. At any time one particular cell boundary is highlighted with a cursor and this cell is called the active cell Text and number entry Every cell on the spreadsheet is capable of having numbers or text entered into it via the keyboard. Make the cell with the address B10 the active cell and type in the text: Barth and then press Enter Now make cell B15 the active cell and type in the number 12 followed by Enter
4 Formulas As well as text and numbers, each cell is capable of containing a formula. In an excel spreadsheet every formula begins with the = (equal) sign when it is being entered at the keyboard. Move the cursor to cell B16 and enter at the keyboard: =5*B15 followed by Enter. The * represents multiplication (x) and the formula states that the contents of cell B16 will be five times the contents of cell B15
5 Clearing entries To clear an entry, point and click at the cell to be cleared. This makes it the active cell. Click the Home menu to reveal a dropdown menu. Select from this menu the option Clear to reveal a further drop-down menu. In this second menu select All and the cell contents are then cleared as indicated below.
6 Now make sure that all entries on the spreadsheet have been cleared because we want to use spreadsheet to construct a graph. Construction of a Cartesian graph Follow these instructions to plot the graph of y x 2 3 Enter the number 3 in A1 Highlight the cell A1 to A7 by pointing at A1, holding down the mouse button, dragging the pointer to A7 and then releasing the mouse button (all the cells from A2 to A7 turn black to indicate that they have been selected) Select the Fill Series commands from the command Bar as shown below: Now in the series window change the Step value to 1 and click OK button as depicted below.
7 Cell A2 to A7 fill with single place decimals ranging from 3 to 3with step value intervals of 1. These are the x values, where 3 x 3 is the x intervals as shown below. In cell B1, type in the formula =A1^2-3 and then press Enter. The number 6 appears in cell B1 that is (9-3 = 6) where -3 is the content of A1. Activate cell B2 and select the Edit-Copy commands Highlight cells B2 to B7 and select Edit-Paste commands Cells B2 to B7 fill with numbers, each being the number in the adjoining cell minus 3. You have just copied the formula in B1into the cells B2 to B7. These are the corresponding y values

8 Now highlight the two columns of numbers cell A1: B7 Click the Chart Wizard button from the Insert Menu The Chart Wizard appeared, requesting a choice of chart type: Click XY (Scatter) to reveal a further choice of type of XY Scatter charts. Click the type in the top right-hand corner to select it (scatter with data points connected by smooth lines without markers) as indicated below:
9 y =x^ Now produce the graphs of the following equations: a. b. y 2 6 x x in the interval y ( x 2) in the interval 1 5 x step value 0. 5 x step value 0. 3 c. y x 3 6x 2 11x 6 in the interval 1 x 5 step value 0. 3 d. y 2 x 2x e in the interval 1 3 x step value 0. 3
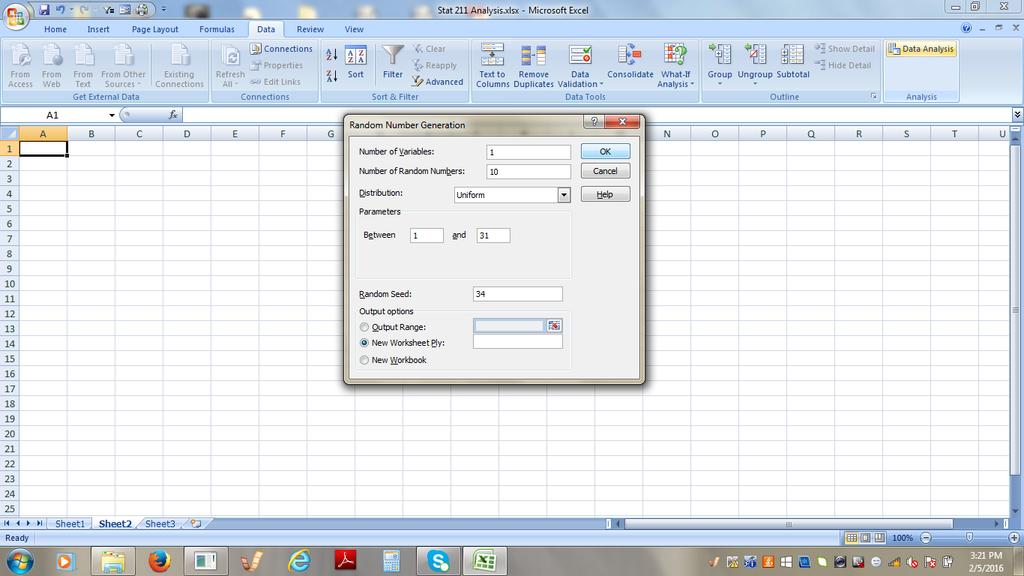
10 Random numbers
11
12
13
14
15 Listing
Microsoft Excel Microsoft Excel
 Excel 101 Microsoft Excel is a spreadsheet program that can be used to organize data, perform calculations, and create charts and graphs. Spreadsheets or graphs created with Microsoft Excel can be imported
Introduction to Excel Workshop
 Introduction to Excel Workshop Empirical Reasoning Center September 9, 2016 1 Important Terminology 1. Rows are identified by numbers. 2. Columns are identified by letters. 3. Cells are identified by the
San Francisco State University
 San Francisco State University Michael Bar Instructions for Excel 1. Plotting analytical function. 2 Suppose that you need to plot the graph of a function f ( x) = x on the interval [ 5,5]. Step 1: make
Dealing with Data in Excel 2013/2016
 Dealing with Data in Excel 2013/2016 Excel provides the ability to do computations and graphing of data. Here we provide the basics and some advanced capabilities available in Excel that are useful for
Basics: How to Calculate Standard Deviation in Excel
 Basics: How to Calculate Standard Deviation in Excel In this guide, we are going to look at the basics of calculating the standard deviation of a data set. The calculations will be done step by step, without
Microsoft Excel Using Excel in the Science Classroom
 Microsoft Excel Using Excel in the Science Classroom OBJECTIVE Students will take data and use an Excel spreadsheet to manipulate the information. This will include creating graphs, manipulating data,
Select the Points You ll Use. Tech Assignment: Find a Quadratic Function for College Costs
 In this technology assignment, you will find a quadratic function that passes through three of the points on each of the scatter plots you created in an earlier technology assignment. You will need the
Total Number of Students in US (millions)
") The goal of this technology assignment is to graph a formula on your calculator and in Excel. This assignment assumes that you have a TI 84 or similar calculator and are using Excel 2007. The formula you
The goal of this technology assignment is to graph a formula on your calculator and in Excel. This assignment assumes that you have a TI 84 or similar calculator and are using Excel 2007. The formula you
Technology Assignment: Scatter Plots
 The goal of this assignment is to create a scatter plot of a set of data. You could do this with any two columns of data, but for demonstration purposes we ll work with the data in the table below. You
Microsoft Word for Report-Writing (2016 Version)
") Microsoft Word for Report-Writing (2016 Version) Microsoft Word is a versatile, widely-used tool for producing presentation-quality documents. Most students are well-acquainted with the program for generating
Microsoft Word for Report-Writing (2016 Version) Microsoft Word is a versatile, widely-used tool for producing presentation-quality documents. Most students are well-acquainted with the program for generating
Pre-Lab Excel Problem
 Pre-Lab Excel Problem Read and follow the instructions carefully! Below you are given a problem which you are to solve using Excel. If you have not used the Excel spreadsheet a limited tutorial is given
Models for Nurses: Quadratic Model ( ) Linear Model Dx ( ) x Models for Doctors:
 Linear Model Dx ( ) x Models for Doctors:") The goal of this technology assignment is to graph several formulas in Excel. This assignment assumes that you using Excel 2007. The formula you will graph is a rational function formed from two polynomials,
The goal of this technology assignment is to graph several formulas in Excel. This assignment assumes that you using Excel 2007. The formula you will graph is a rational function formed from two polynomials,
1. What specialist uses information obtained from bones to help police solve crimes?
 Mathematics: Modeling Our World Unit 4: PREDICTION HANDOUT VIDEO VIEWING GUIDE H4.1 1. What specialist uses information obtained from bones to help police solve crimes? 2.What are some things that can
Chapter 3: Rate Laws Excel Tutorial on Fitting logarithmic data
 Chapter 3: Rate Laws Excel Tutorial on Fitting logarithmic data The following table shows the raw data which you need to fit to an appropriate equation k (s -1 ) T (K) 0.00043 312.5 0.00103 318.47 0.0018
Excel. Spreadsheet functions
 Excel Spreadsheet functions Objectives Week 1 By the end of this session you will be able to :- Move around workbooks and worksheets Insert and delete rows and columns Calculate with the Auto Sum function
Microsoft Excel 2007
 Microsoft Excel 2007 1 Excel is Microsoft s Spreadsheet program. Spreadsheets are often used as a method of displaying and manipulating groups of data in an effective manner. It was originally created
Microsoft Excel Lab: Data Analysis
 1 Microsoft Excel Lab: The purpose of this lab is to prepare the student to use Excel as a tool for analyzing data taken in other courses. The example used here comes from a Freshman physics lab with measurements
Intermediate Microsoft Excel (Demonstrated using Windows XP) Using Spreadsheets in the Classroom
 Using Spreadsheets in the Classroom") (Demonstrated using Windows XP) Using Spreadsheets in the Classroom Adapted from Taskstream Word Tutorial (2003) < http://www.taskstream.com > Updated 4/05 by Dr. Bruce Ostertag What Can Microsoft Excel
(Demonstrated using Windows XP) Using Spreadsheets in the Classroom Adapted from Taskstream Word Tutorial (2003) < http://www.taskstream.com > Updated 4/05 by Dr. Bruce Ostertag What Can Microsoft Excel
Excel R Tips. is used for multiplication. + is used for addition. is used for subtraction. / is used for division
 Excel R Tips EXCEL TIP 1: INPUTTING FORMULAS To input a formula in Excel, click on the cell you want to place your formula in, and begin your formula with an equals sign (=). There are several functions
MOVING FROM CELL TO CELL
 VCAE: EXCEL Lesson 1 Please send comments to Author: Zahra Siddiqui at zed_ess@hotmail.com Concepts Covered: Cell Address; Cell Pointer; Moving across Cells Constants: Entering, Editing, Formatting Using
Three-Dimensional (Surface) Plots
 Plots") Three-Dimensional (Surface) Plots Creating a Data Array 3-Dimensional plots (surface plots) are often useful for visualizing the behavior of functions and identifying important mathematical/physical features
Three-Dimensional (Surface) Plots Creating a Data Array 3-Dimensional plots (surface plots) are often useful for visualizing the behavior of functions and identifying important mathematical/physical features
Activity: page 1/10 Introduction to Excel. Getting Started
 Activity: page 1/10 Introduction to Excel Excel is a computer spreadsheet program. Spreadsheets are convenient to use for entering and analyzing data. Although Excel has many capabilities for analyzing
Microsoft Excel 2007 Creating a XY Scatter Chart
 Microsoft Excel 2007 Creating a XY Scatter Chart Introduction This document will walk you through the process of creating a XY Scatter Chart using Microsoft Excel 2007 and using the available Excel features
SPREADSHEET (Excel 2007)
") SPREADSHEET (Excel 2007) 1 U N I T 0 4 BY I F T I K H A R H U S S A I N B A B U R Spreadsheet Microsoft Office Excel 2007 (or Excel) is a computer program used to enter, analyze, and present quantitative
SPREADSHEET (Excel 2007) 1 U N I T 0 4 BY I F T I K H A R H U S S A I N B A B U R Spreadsheet Microsoft Office Excel 2007 (or Excel) is a computer program used to enter, analyze, and present quantitative
Introduction to Excel Workshop
 Introduction to Excel Workshop Empirical Reasoning Center June 6, 2016 1 Important Terminology 1. Rows are identified by numbers. 2. Columns are identified by letters. 3. Cells are identified by the row-column
Appendix A OPENING AN EXCEL SPREADSHEET: To start working with a blank Excel spreadsheet, you should: 1. Log on to your station s computer.
 Appendix A INTRODUCTION: Microsoft Excel is a popular software package that combines spreadsheet accounting, graphing, and database functions into one program. One can enter data, modify it, and then the
Use of in-built functions and writing expressions
 LECTURE SCHEDULE 9 Use of in-built functions and writing expressions In-built Functions A function is an in-built program, which is used to do a particular task. Functions take the input the input and
Microsoft Excel 2010 Tutorial
 1 Microsoft Excel 2010 Tutorial Excel is a spreadsheet program in the Microsoft Office system. You can use Excel to create and format workbooks (a collection of spreadsheets) in order to analyze data and
How to use Excel Spreadsheets for Graphing
 How to use Excel Spreadsheets for Graphing 1. Click on the Excel Program on the Desktop 2. You will notice that a screen similar to the above screen comes up. A spreadsheet is divided into Columns (A,
Excel 2016: Part 2 Functions/Formulas/Charts
 Excel 2016: Part 2 Functions/Formulas/Charts Updated: March 2018 Copy cost: $1.30 Getting Started This class requires a basic understanding of Microsoft Excel skills. Please take our introductory class,
EXCEL 98 TUTORIAL Chemistry C2407 fall 1998 Andy Eng, Columbia University 1998
 Created on 09/02/98 11:58 PM 1 EXCEL 98 TUTORIAL Chemistry C2407 fall 1998 Andy Eng, Columbia University 1998 Note for Excel 97 users: All features of Excel 98 for Macintosh are available in Excel 97 for
1 Introduction to Using Excel Spreadsheets
 Survey of Math: Excel Spreadsheet Guide (for Excel 2007) Page 1 of 6 1 Introduction to Using Excel Spreadsheets This section of the guide is based on the file (a faux grade sheet created for messing with)
Microsoft Excel Basics Ben Johnson
 Microsoft Excel Basics Ben Johnson Topic...page # Basics...1 Workbook and worksheets...1 Sizing columns and rows...2 Auto Fill...2 Sort...2 Formatting Cells...3 Formulas...3 Percentage Button...4 Sum function...4
Years after US Student to Teacher Ratio
 The goal of this assignment is to create a scatter plot of a set of data. You could do this with any two columns of data, but for demonstration purposes we ll work with the data in the table below. The
Chemistry 30 Tips for Creating Graphs using Microsoft Excel
 Chemistry 30 Tips for Creating Graphs using Microsoft Excel Graphing is an important skill to learn in the science classroom. Students should be encouraged to use spreadsheet programs to create graphs.
Experiment 1 CH Fall 2004 INTRODUCTION TO SPREADSHEETS
 Experiment 1 CH 222 - Fall 2004 INTRODUCTION TO SPREADSHEETS Introduction Spreadsheets are valuable tools utilized in a variety of fields. They can be used for tasks as simple as adding or subtracting
Math 1525 Excel Lab 1 Introduction to Excel Spring, 2001
 Math 1525 Excel Lab 1 Introduction to Excel Spring, 2001 Goal: The goal of Lab 1 is to introduce you to Microsoft Excel, to show you how to graph data and functions, and to practice solving problems with
Math 227 EXCEL / MEGASTAT Guide
 Math 227 EXCEL / MEGASTAT Guide Introduction Introduction: Ch2: Frequency Distributions and Graphs Construct Frequency Distributions and various types of graphs: Histograms, Polygons, Pie Charts, Stem-and-Leaf
Chapter 4. Microsoft Excel
 Chapter 4 Microsoft Excel Topic Introduction Spreadsheet Basic Screen Layout Modifying a Worksheet Formatting Cells Formulas and Functions Sorting and Filling Borders and Shading Charts Introduction A
Data Management Project Using Software to Carry Out Data Analysis Tasks
 Data Management Project Using Software to Carry Out Data Analysis Tasks This activity involves two parts: Part A deals with finding values for: Mean, Median, Mode, Range, Standard Deviation, Max and Min
Physics 251 Laboratory Introduction to Spreadsheets
 Physics 251 Laboratory Introduction to Spreadsheets Pre-Lab: Please do the lab-prep exercises on the web. Introduction Spreadsheets have a wide variety of uses in both the business and academic worlds.
Prepared by: Prof. Dr Bahaman Abu Samah Department of Professional Development and Continuing Education Faculty of Educational Studies Universiti
 Prepared by: Prof. Dr Bahaman Abu Samah Department of Professional Development and Continuing Education Faculty of Educational Studies Universiti Putra Malaysia Serdang MS Access is an application within
Chemistry Excel. Microsoft 2007
 Chemistry Excel Microsoft 2007 This workshop is designed to show you several functionalities of Microsoft Excel 2007 and particularly how it applies to your chemistry course. In this workshop, you will
Let s start by examining an Excel worksheet for the linear programming. Maximize P 70x 120y. subject to
 Excel is a useful tool for solving linear programming problems. In this question we ll solve and analyze our manufacturing problem with Excel. Although this problem can easily be solved graphically or
UW Department of Chemistry Lab Lectures Online
 Introduction to Excel and Computer Manipulation of Data Review Appendix A: Introduction to Statistical Analysis. Focus on the meanings and implications of the calculated values and not on the calculations.
lab MS Excel 2010 active cell
 MS Excel is an example of a spreadsheet, a branch of software meant for performing different kinds of calculations, numeric data analysis and presentation, statistical operations and forecasts. The main
Survey of Math: Excel Spreadsheet Guide (for Excel 2016) Page 1 of 9
 Page 1 of 9") Survey of Math: Excel Spreadsheet Guide (for Excel 2016) Page 1 of 9 Contents 1 Introduction to Using Excel Spreadsheets 2 1.1 A Serious Note About Data Security.................................... 2 1.2
Survey of Math: Excel Spreadsheet Guide (for Excel 2016) Page 1 of 9 Contents 1 Introduction to Using Excel Spreadsheets 2 1.1 A Serious Note About Data Security.................................... 2 1.2
Put the Graphs for Each Health Plan on the Same Graph
 At the conclusion of the technology assignment on graphing the total annual cost, you had a graph of each of health insurance plans you are examining. In this technology assignment, you ll combine those
Using Excel This is only a brief overview that highlights some of the useful points in a spreadsheet program.
 Using Excel 2007 This is only a brief overview that highlights some of the useful points in a spreadsheet program. 1. Input of data - Generally you should attempt to put the independent variable on the
addition + =5+C2 adds 5 to the value in cell C2 multiplication * =F6*0.12 multiplies the value in cell F6 by 0.12
 BIOL 001 Excel Quick Reference Guide (Office 2010) For your lab report and some of your assignments, you will need to use Excel to analyze your data and/or generate graphs. This guide highlights specific
Graphical Analysis of Data using Microsoft Excel [2016 Version]
![Graphical Analysis of Data using Microsoft Excel [2016 Version]](/thumbs/72/67574169.jpg "Graphical Analysis of Data using Microsoft Excel [2016 Version]") Graphical Analysis of Data using Microsoft Excel [2016 Version] Introduction In several upcoming labs, a primary goal will be to determine the mathematical relationship between two variable physical parameters.
Graphical Analysis of Data using Microsoft Excel [2016 Version] Introduction In several upcoming labs, a primary goal will be to determine the mathematical relationship between two variable physical parameters.
INSTRUCTIONS FOR USING MICROSOFT EXCEL PERFORMING DESCRIPTIVE AND INFERENTIAL STATISTICS AND GRAPHING
 APPENDIX INSTRUCTIONS FOR USING MICROSOFT EXCEL PERFORMING DESCRIPTIVE AND INFERENTIAL STATISTICS AND GRAPHING (Developed by Dr. Dale Vogelien, Kennesaw State University) ** For a good review of basic
Open a new Excel workbook and look for the Standard Toolbar.
 This activity shows how to use a spreadsheet to draw line graphs. Open a new Excel workbook and look for the Standard Toolbar. If it is not there, left click on View then Toolbars, then Standard to make
= 3 + (5*4) + (1/2)*(4/2)^2.
 + (1/2)*(4/2)^2.") Physics 100 Lab 1: Use of a Spreadsheet to Analyze Data by Kenneth Hahn and Michael Goggin In this lab you will learn how to enter data into a spreadsheet and to manipulate the data in meaningful ways.
Physics 100 Lab 1: Use of a Spreadsheet to Analyze Data by Kenneth Hahn and Michael Goggin In this lab you will learn how to enter data into a spreadsheet and to manipulate the data in meaningful ways.
Technology Assignment: Limits at Infinity
 The goal of this technology assignment is to find the location of the horizontal asymptote for your model from Technology Assignment: Rational Model. You will produce a graph similar to the one below.
Using Excel for Graphical Analysis of Data
 Using Excel for Graphical Analysis of Data Introduction In several upcoming labs, a primary goal will be to determine the mathematical relationship between two variable physical parameters. Graphs are
Tips for working efficiently with Excel's fill handle
 Tips for working efficiently with Excel's fill handle The fill handle is a remarkably useful Excel tool. Here are some techniques that should be useful to the average Excel user. Excel s fill handle is
Introduction to the workbook and spreadsheet
 Excel Tutorial To make the most of this tutorial I suggest you follow through it while sitting in front of a computer with Microsoft Excel running. This will allow you to try things out as you follow along.
Beginning Excel. Revised 4/19/16
 Beginning Excel Objectives: The Learner will: Become familiar with terminology used in Microsoft Excel Create a simple workbook Write a simple formula Formatting Cells Adding Columns Borders Table of Contents:
Data Analysis Guidelines
 Data Analysis Guidelines DESCRIPTIVE STATISTICS Standard Deviation Standard deviation is a calculated value that describes the variation (or spread) of values in a data set. It is calculated using a formula
Introduction to Microsoft Excel
 Chapter A spreadsheet is a computer program that turns the computer into a very powerful calculator. Headings and comments can be entered along with detailed formulas. The spreadsheet screen is divided
Microsoft Excel 2010 Handout
 Microsoft Excel 2010 Handout Excel is an electronic spreadsheet program you can use to enter and organize data, and perform a wide variety of number crunching tasks. Excel helps you organize and track
1. AUTO CORRECT. To auto correct a text in MS Word the text manipulation includes following step.
 1. AUTO CORRECT - To auto correct a text in MS Word the text manipulation includes following step. - STEP 1: Click on office button STEP 2:- Select the word option button in the list. STEP 3:- In the word
Introduction to Excel 2007
 Introduction to Excel 2007 Excel 2007 is a software program that creates a spreadsheet. It permits the user to enter data and formulas to perform mathematical and Boolean (comparison) calculations on the
Non-linear regression tutorial
 Non-linear regression tutorial The following table shows the raw data for performing nonlinear regression using Polymath (refer Table E7-4.1, Elements of chemical reaction engineering, 5 th edition) Pco
JMP 10 Student Edition Quick Guide
 JMP 10 Student Edition Quick Guide Instructions presume an open data table, default preference settings and appropriately typed, user-specified variables of interest. RMC = Click Right Mouse Button Graphing
Charting Progress with a Spreadsheet
 Charting Progress - 1 Charting Progress with a Spreadsheet We shall use Microsoft Excel to demonstrate how to chart using a spreadsheet. Other spreadsheet programs (e.g., Quattro Pro, Lotus) are similarly
Math 2524: Activity 1 (Using Excel) Fall 2002
 Fall 2002") Math 2524: Activity 1 (Using Excel) Fall 22 Often in a problem situation you will be presented with discrete data rather than a function that gives you the resultant data. You will use Microsoft Excel
Math 2524: Activity 1 (Using Excel) Fall 22 Often in a problem situation you will be presented with discrete data rather than a function that gives you the resultant data. You will use Microsoft Excel
Creating a data file and entering data
 4 Creating a data file and entering data There are a number of stages in the process of setting up a data file and analysing the data. The flow chart shown on the next page outlines the main steps that
Spreadsheet View and Basic Statistics Concepts
 Spreadsheet View and Basic Statistics Concepts GeoGebra 3.2 Workshop Handout 9 Judith and Markus Hohenwarter www.geogebra.org Table of Contents 1. Introduction to GeoGebra s Spreadsheet View 2 2. Record
Spreadsheet Microsoft Excel 2010
 Spreadsheet Microsoft Excel 2010 Prepared by: Teo Siew Copyright 2017 MAHSA UNIVERSITY Faculty of Business, Finance, and Hospitality Spreadsheet A type of application program which manipulates numerical
CHAPTER 1 GETTING STARTED
 CHAPTER 1 GETTING STARTED Configuration Requirements This design of experiment software package is written for the Windows 2000, XP and Vista environment. The following system requirements are necessary
Statistical Good Practice Guidelines. 1. Introduction. Contents. SSC home Using Excel for Statistics - Tips and Warnings
 Statistical Good Practice Guidelines SSC home Using Excel for Statistics - Tips and Warnings On-line version 2 - March 2001 This is one in a series of guides for research and support staff involved in
Lab1: Use of Word and Excel
 Dr. Fritz Wilhelm; physics 230 Lab1: Use of Word and Excel Page 1 of 9 Lab partners: Download this page onto your computer. Also download the template file which you can use whenever you start your lab
Spreadsheet Warm Up for SSAC Geology of National Parks Modules, 2: Elementary Spreadsheet Manipulations and Graphing Tasks
 University of South Florida Scholar Commons Tampa Library Faculty and Staff Publications Tampa Library 2009 Spreadsheet Warm Up for SSAC Geology of National Parks Modules, 2: Elementary Spreadsheet Manipulations
MS Excel Henrico County Public Library. I. Tour of the Excel Window
 MS Excel 2013 I. Tour of the Excel Window Start Excel by double-clicking on the Excel icon on the desktop. Excel may also be opened by clicking on the Start button>all Programs>Microsoft Office>Excel.
Design and Analysis of Experiments Prof. Jhareswar Maiti Department of Industrial and Systems Engineering Indian Institute of Technology, Kharagpur
 Design and Analysis of Experiments Prof. Jhareswar Maiti Department of Industrial and Systems Engineering Indian Institute of Technology, Kharagpur Lecture 59 Fractional Factorial Design using MINITAB
Maximizing the Area of a Garden
 Math Objectives Students will determine the relationship between the width and length of a garden with a rectangular shape and a fixed amount of fencing. The garden is attached to a barn, and exactly three
J. La Favre Calibrating Sharp Distance Sensors July 18, 2018
 GEAR has a number of Sharp brand IR distance sensors that can be used to determine distance to a target object. This type of sensor can be useful for maze robot projects as well as others. Sharp offers
Tutorial 9. Review. Data Tables and Scenario Management. Data Validation. Protecting Worksheet. Range Names. Macros
 Tutorial 9 Data Tables and Scenario Management Review Data Validation Protecting Worksheet Range Names Macros 1 Examine cost-volume-profit relationships Suppose you were the owner of a water store. An
Excel Primer CH141 Fall, 2017
 Excel Primer CH141 Fall, 2017 To Start Excel : Click on the Excel icon found in the lower menu dock. Once Excel Workbook Gallery opens double click on Excel Workbook. A blank workbook page should appear
KINETICS CALCS AND GRAPHS INSTRUCTIONS
 KINETICS CALCS AND GRAPHS INSTRUCTIONS 1. Open a new Excel or Google Sheets document. I will be using Google Sheets for this tutorial, but Excel is nearly the same. 2. Enter headings across the top as
How to use FSBforecast Excel add in for regression analysis
 How to use FSBforecast Excel add in for regression analysis FSBforecast is an Excel add in for data analysis and regression that was developed here at the Fuqua School of Business over the last 3 years
Step 3: Type the data in to the cell
 Simple Instructions for using Microsoft Excel The goal of these instructions is to familiarize the user with the basics of Excel. These directions will cover data entry, formatting, formulas and functions,
Agenda. Spreadsheet Applications. Spreadsheet Terminology A workbook consists of multiple worksheets. By default, a workbook has 3 worksheets.
 Agenda Unit 1 Assessment Review Progress Reports Intro to Excel Learn parts of an Excel spreadsheet How to Plan a spreadsheet Create a spreadsheet Analyze data Create an embedded chart in spreadsheet In
Excel tutorial Introduction
 Office button Excel tutorial Introduction Microsoft Excel is an electronic spreadsheet. You can use it to organize your data into rows and columns. You can also use it to perform mathematical calculations
Data Should Not be a Four Letter Word Microsoft Excel QUICK TOUR
 Toolbar Tour AutoSum + more functions Chart Wizard Currency, Percent, Comma Style Increase-Decrease Decimal Name Box Chart Wizard QUICK TOUR Name Box AutoSum Numeric Style Chart Wizard Formula Bar Active
Statistics with a Hemacytometer
 Statistics with a Hemacytometer Overview This exercise incorporates several different statistical analyses. Data gathered from cell counts with a hemacytometer is used to explore frequency distributions
Appendix A. HINTS WHEN USING EXCEL w
 Appendix A HINTS WHEN USING EXCEL w This appendix provides hints when using Microsoft Excel. Appendix A includes general features that are useful in all the applications solved with Excel in this book.
Applied Regression Modeling: A Business Approach
 i Applied Regression Modeling: A Business Approach Computer software help: SPSS SPSS (originally Statistical Package for the Social Sciences ) is a commercial statistical software package with an easy-to-use
Using a spreadsheet to make predictions USING A SPREADSHEET TO MAKE PREDICTIONS
 USING A SPREADSHEET TO MAKE PREDICTIONS 1 QTP 3.2 Using Learning Technologies In English, PDHPE, HSIE and Primary Printed January 2003 Published by Quality Teacher Program (QTP) Bridge St Sydney NSW Australia
EXCEL SPREADSHEET TUTORIAL
 EXCEL SPREADSHEET TUTORIAL Note to all 200 level physics students: You will be expected to properly format data tables and graphs in all lab reports, as described in this tutorial. Therefore, you are responsible
Graphing on Excel. Open Excel (2013). The first screen you will see looks like this (it varies slightly, depending on the version):
. The first screen you will see looks like this (it varies slightly, depending on the version):") Graphing on Excel Open Excel (2013). The first screen you will see looks like this (it varies slightly, depending on the version): The first step is to organize your data in columns. Suppose you obtain
Graphing on Excel Open Excel (2013). The first screen you will see looks like this (it varies slightly, depending on the version): The first step is to organize your data in columns. Suppose you obtain
Lab 7 Statistics I LAB 7 QUICK VIEW
 Lab 7 Statistics I This lab will cover how to do statistical calculations in excel using formulas. (Note that your version of excel may have additional formulas to calculate statistics, but these formulas
COMPUTER TECHNOLOGY SPREADSHEETS BASIC TERMINOLOGY. A workbook is the file Excel creates to store your data.
 SPREADSHEETS BASIC TERMINOLOGY A Spreadsheet is a grid of rows and columns containing numbers, text, and formulas. A workbook is the file Excel creates to store your data. A worksheet is an individual
Functions in Excel. Structure of a function: Basic Mathematical Functions. Arithmetic operators: Comparison Operators:
 Page1 Functions in Excel Formulas (functions) are equations that perform calculations on values in your spreadsheet. A formula always starts with an equal sign (=). Example: =5+2*7 This formula multiples
Activity 1 Creating a simple gradebook
 Activity 1 Creating a simple gradebook 1 Launch Excel to start a new spreadsheet a. Click on the Excel icon to start a new workbook, either from the start menu, Office Toolbar, or an Excel icon on the
Intermediate Excel 2016
 Intermediate Excel 2016 Relative & Absolute Referencing Relative Referencing When you copy a formula to another cell, Excel automatically adjusts the cell reference to refer to different cells relative
Reference and Style Guide for Microsoft Excel
 Reference and Style Guide for Microsoft Excel TABLE OF CONTENTS Getting Acquainted 2 Basic Excel Features 2 Writing Cell Equations Relative and Absolute Addresses 3 Selecting Cells Highlighting, Moving
Basics of Spreadsheet
 106 :: Data Entry Operations 6 Basics of Spreadsheet 6.1 INTRODUCTION A spreadsheet is a large sheet having data and information arranged in rows and columns. As you know, Excel is one of the most widely