Copyright 2010, Oracle. All rights reserved.
|
|
|
- Kelley Stevenson
- 6 years ago
- Views:
Transcription
1
2 Agenda Interactive Dashboards Master-Detail Linking New Prompt Controls Pivot Table Interactions Enhanced Dashboard Builder Analysis Editor Overview Working with the analysis editor step by step Praxisteil
3 Overview of OBIEE 11g Visualization Improvements Oracle developed visualization components which are standardized across Fusion Applications and OBIEE/OBI Applications More consistency in how visualizations are built Scorecard Capabilities (featured in previous Immersion Series Presentation) Spatial New Visualization controls and interactions Scrollable legend, sliders, master-detail linking New graph types Multi-pie, More informative Pop-ups


4 OBIEE 11g Catalog & Start Page

5 Master-Detail Linking View can Broadcast an Event Pivot Table Table Chart Map View View can Subscribe to an Event Pivot Table Table Chart Any Number of Views can Subscribe to the same Event

6 Prompting Enhancements New Prompting Controls Slider Prompt Check-box Prompt Radio-button Prompt List Prompt Hierarchical Prompt Currency Prompt

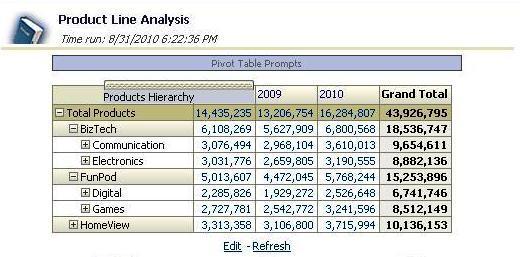
7 Pivot Table Interactions on Dashboard

8 Enhanced Dashboard Builder Easy and Intuitive approach to Dashboard Creation WYSIWIG Direct Manipulation Dashboard Preview Ability to Inherit Dashboard/Page Report Links Publish Page to Dashboard Prompt Scope Definition

9 New Features Dashboard Template Briefing Book PDF MHTML New Dashboard Objects Action Link Scorecard/KPIs
10 Customizations Significantly Different Architecture and UI Elements in 11g Recommended Approach is to Start Customization from Scratch White paper on Customizations
11 Dashboard Enhancements New Interactions and UI Enhancements Master-Detail Linking New Prompt Controls Pivot Table Interactions Enhanced Dashboard Builder New Features Dashboard Template Publish Dashboard Briefing Book in PDF New Dashboard Objects Customizations Skin-Style in 11g
12 Visualizations New visualizations engine ADF DVT Across OBIEE, ADF, Fusion Applications Foundation for further enhancements Interactivity Master-Detail Linking Animated Transitions Range Sliders Section Sliders Spatial Data visualizations


13 Advanced Usage of Map Views Multi-Measure, Mixed-Format Maps Multi-Measure, Mixed-Format Maps With Underlying Heatmapbased Background map Maps Depicting Custom Spatial Boundaries Multi-Measure, Multi-Level, Mixed-Format, Hi-Density Map
14 Key Terms Term Analysis Column Filter Prompt Selection Criteria Results Subject Area Dashboard Dashboard Prompt Query Definition Answers a query against an organization s data. Object that indicates the data that an analysis returns; measure columns contain numeric measures, while the membership of attribute columns are descriptive, and that of hierarchies represent relationships. Mechanism that restricts the result set returned by an analysis. Special kind of filter that restricts the result set returned by an analysis; can be used to populate variables. Mechanism that determines column membership included in an analysis. Set of columns and filters that are specified for an analysis. Output returned from Oracle BI Server for a specified analysis. Logical object that organizes and presents data about a business. Page in a Business Intelligence application that displays content. Filter object that filters all content on a dashboard page and can be used to populate variables. Underlying SQL issued to the Oracle BI Server for the specified analysis.
15 Agenda Interactive Dashboards Master-Detail Linking New Prompt Controls Pivot Table Interactions Enhanced Dashboard Builder Analysis Editor Overview Working with the analysis editor step by step Praxisteil
 Valuebased hierarchy column")
16 Hierarchies Are definitions of contained-by or belongs-to relationship of members. Nested levels of these many-to-one relationships Corresponding roll-up of measure values Either level-based or value-based (parent-child) Valuebased hierarchy column Measure column Collapse hierarchy Expand hierarchy Child members indent below their parent.

17 Oracle Business Intelligence Analysis Hierarchical column Drilling Region attribute column adds State column to analysis because the attributes are part of a region level-based hierarchy Custom column name Measure column Expand hierarchy to view members Revenue less than $100,000 is highlighted.


18 Creating and Editing Analyses Multiple ways to create or edit analyses in the Analysis Editor. Create or open from the Home page. 1 2

19 Analysis Editor Provides an area to create, modify, and save analyses, filters, and selections. Save Analysis. Subject Area pane Remove all columns. Catalog pane Create and remove filters on columns from the analysis.

20 Subject Area and Catalog Panes Access saved analyses and dashboards in the Presentation Catalog Show columns and filters to construct analyses Organize content into presentation folders, dimensions, and columns Attribute column Hierarchical column Measure column Presentation Catalog folders and content
21 Analysis Editor Tabs Contain on-screen information and buttons to create, access, and manage analyses View or change columns and filters for analyses View or modify results of analyses Create prompts to filter analyses Work directly with XML and SQL generated for an analysis
22 Working with the Analysis Editor in Oracle Business Intelligence 1. Construct an analysis. 2. Modify analysis criteria. Sorting columns Formulas Style Column format Data format Conditional format Interaction 3. Change column order. 4. Display analysis results. 5. Save an analysis.

23 1. Construct an Analysis Select columns from subject area folders in the Subject Areas pane to create analysis criteria. 2 Add Columns button 1 More Options button Remove all Columns from Criteria button 4 Attribute columns Analysis criteria are displayed in the Selected Columns pane. Hierarchical columns 3 Measure columns


24 2. Modify Analysis Criteria Click the More Options button to modify analysis criteria using the following options: Hierarchical column Determine sort order Add a new function (such as ranking or moving averages) Edit column properties to control appearance and behavior Limit data that appears in a column Remove column from analysis Edit level properties to control appearance and behavior

25 2. Modify Analysis Criteria (Sorting Columns) Use the Sort button to choose a sort order for the desired column Select the appropriate option to set the sort order: Primary ascending column sort This column sort occurs after the primary sort. Choose a sort option for the desired columns in your analysis. This column sort occurs after the secondary sort and in descending sequence.

26 2. Modify Analysis Criteria (Formulas) Use complex formulas in your analyses: Operators, functions, filters, variables Select a function to add it to the column formula. Select columns from the subject area. Select or create filters. Calculatio n Builder Select or create variables.
27 2. Modify Analysis Criteria (Style) Override formatting and style defaults for: Font, cell (including alignment), border, style sheets Point to custom style sheets. Save as column or data type default.

28 2. Modify Analysis Criteria (Column Format) Override formatting defaults for: Column visibility, headings, data duplication, interaction 1 2 3


29 2. Modify Analysis Criteria (Data Format) Override the way data is displayed based on the data type. Text data: Treat as plain text, HTML, link, and so on Numeric data: Treat as number, percentage, currency, and so on


30 2. Modify Analysis Criteria (Conditional Format) Direct attention to a data element that meets a certain Click condition. Add Condition for each condition. Specify an operator and a value to create a condition. Use a Presentation variable Specify a style for data meeting the condition. Select an image to display.

31 2. Modify Analysis Criteria (Interaction) Specify behavior when a user drills on a column heading or a data value. Default is to drill to the next level in a hierarchy. Reset defaults for a column. Set an action to navigate to another saved analysis.
32 3. Change Column Order Drag columns to change column order. Drag a column to another location to reorder the columns.


33 4. Display Analysis Results Click the Results tab to see the results of an analysis. An analysis can be displayed in many formats. Select additional views.

34 4. Display Analysis Results Data is automatically sorted by the first column and then sorted by the second column. Sorting can be specified by the user. Repeating values are suppressed by default. Default can be overridden by the user. Click Click to see the next group or row. to see all rows.

35 5. Save An Analysis Click the Save Analysis button in the toolbar. New Folder 1 2 3
36 Advanced Formatting Saving column settings as systemwide defaults Copying and pasting formatting attributes Using a saved analysis as a style template Using custom date-format strings

37 Saving Column Settings as Systemwide Defaults Settings on column properties tabs can be saved as systemwide defaults: Save defaults for particular columns or data types. User must have appropriate permissions to save. Subsequent users see new default settings. Save as defaults for data type. Save as defaults for column.

38 Copying and Pasting Formatting Attributes Copy a range of formatting attributes that are applied to an object and then paste them to an object of the same type: This is supported for rows, columns, and table cells in table, pivot table, and chart views. Restore defaults Copy Paste


39 Using a Saved Analysis as a Style Template Use a customized saved analysis as a cosmetic style template. Apply formatting from template to new or existing analyses. Supported in table, pivot table, and chart views 1 2
40 Customized Date and Time Format Strings Provide additional options for formatting columns that contain time stamps, dates, and times Examples of general customized format strings: Term Result Example [FMT:dateShort] [FMT:dateLong] Formats date in locale s short-date format. Formats date in locale s long-date format. 2/3/2008 Monday, February 3, 2008 [FMT:time] Formats time in locale s time format. 12:00:00 AM [FMT:timeHourMin] Formats time in locale s time format but omits seconds. 12:00 AM

41 Applying Customized Format String to a Column Example: Using a customized date format string for a date column 1 2 3
42 Writeback Set writeback settings for a column in the Column Properties dialog box. 1


43 Questions and Answers
44 Agenda Interactive Dashboards Master-Detail Linking New Prompt Controls Pivot Table Interactions Enhanced Dashboard Builder Analysis Editor Overview Working with the analysis editor step by step Praxisteil

45 Praxisteil Lab 3: Advanced Reporting, Master Detail Linking 45
46
Rich Web UI made simple Building Data Dashboards without Code
 Rich Web UI made simple Building Data Dashboards without Code Dana Singleterry http://blogs.oracle.com/dana Product Manager Oracle JDeveloper and Oracle ADF 2 Copyright 2012, Oracle and/or its affiliates.
Report Designer Report Types Table Report Multi-Column Report Label Report Parameterized Report Cross-Tab Report Drill-Down Report Chart with Static
 Table of Contents Report Designer Report Types Table Report Multi-Column Report Label Report Parameterized Report Cross-Tab Report Drill-Down Report Chart with Static Series Chart with Dynamic Series Master-Detail
XLCubed Version 9 QuickStart
 XLCubed Version 9 QuickStart 1 P a g e Contents Welcome... 3 Connecting to your data... 3 XLCubed for Pivot Table users... 3 Adding a Grid, and the Report Designer... 5 Working with Grids... 7 Grid Components...
eschoolplus+ Cognos Query Studio Training Guide Version 2.4
 + Training Guide Version 2.4 May 2015 Arkansas Public School Computer Network This page was intentionally left blank Page 2 of 68 Table of Contents... 5 Accessing... 5 Working in Query Studio... 8 Query
Kendo UI. Builder by Progress : What's New
 Kendo UI Builder by Progress : What's New Copyright 2017 Telerik AD. All rights reserved. July 2017 Last updated with new content: Version 2.0 Updated: 2017/07/13 3 Copyright 4 Contents Table of Contents
Lesson 1: Creating and formatting an Answers analysis
 Lesson 1: Creating and formatting an Answers analysis Answers is the ad-hoc query environment in the OBIEE suite. It is in Answers that you create and format analyses to help analyze business results.
Primo Analytics Workshop. BIBSYS Konferansen 20 March 2018
 Primo Analytics Workshop BIBSYS Konferansen 20 March 2018 Objectives By the end of this session, you will: Understand what is Primo Analytics and OBI. Have a high-level view of how Primo Analytics is working.
Query Studio Training Guide Cognos 8 February 2010 DRAFT. Arkansas Public School Computer Network 101 East Capitol, Suite 101 Little Rock, AR 72201
 Query Studio Training Guide Cognos 8 February 2010 DRAFT Arkansas Public School Computer Network 101 East Capitol, Suite 101 Little Rock, AR 72201 2 Table of Contents Accessing Cognos Query Studio... 5
OBIEE. Oracle Business Intelligence Enterprise Edition. Rensselaer Business Intelligence Finance Author Training
 OBIEE Oracle Business Intelligence Enterprise Edition Rensselaer Business Intelligence Finance Author Training TABLE OF CONTENTS INTRODUCTION... 1 USER INTERFACE... 1 HOW TO LAUNCH OBIEE... 1 TERMINOLOGY...
Building reports using the Web Intelligence HTML Report Panel
 Building reports using the Web Intelligence HTML Report Panel Building reports using the Web Intelligence HTML Report Panel Copyright 2008 Business Objects. All rights reserved. Business Objects owns the
Day 1 Agenda. Brio 101 Training. Course Presentation and Reference Material
 Data Warehouse www.rpi.edu/datawarehouse Brio 101 Training Course Presentation and Reference Material Day 1 Agenda Training Overview Data Warehouse and Business Intelligence Basics The Brio Environment
Oracle Business Intelligence Icon Definitions
 Oracle Business Intelligence Icon Definitions Version 1.0 JANUARY 14, 2015 OHIO UNIVERSITY Table of Contents Icon Definitions...2 1.1 Catalog Definitions for Report Consumers (ability to run reports)...2
ScholarOne Manuscripts. COGNOS Reports User Guide
 ScholarOne Manuscripts COGNOS Reports User Guide 1-May-2018 Clarivate Analytics ScholarOne Manuscripts COGNOS Reports User Guide Page i TABLE OF CONTENTS USE GET HELP NOW & FAQS... 1 SYSTEM REQUIREMENTS...
IBM DB2 Web Query for IBM i. Version 2 Release 2
 IBM DB2 Web Query for IBM i Version 2 Release 2 Active Technologies, EDA, EDA/SQL, FIDEL, FOCUS, Information Builders, the Information Builders logo, iway, iway Software, Parlay, PC/FOCUS, RStat, Table
User Guide. Web Intelligence Rich Client. Business Objects 4.1
 User Guide Web Intelligence Rich Client Business Objects 4.1 2 P a g e Web Intelligence 4.1 User Guide Web Intelligence 4.1 User Guide Contents Getting Started in Web Intelligence 4.1... 5 Log into EDDIE...
Intellicus Enterprise Reporting and BI Platform
 Designing Adhoc Reports Intellicus Enterprise Reporting and BI Platform Intellicus Technologies info@intellicus.com www.intellicus.com Designing Adhoc Reports i Copyright 2012 Intellicus Technologies This
JUNE 2016 PRIMAVERA P6 8x, CONTRACT MANAGEMENT 14x AND UNIFIER 16x CREATING DASHBOARD REPORTS IN ORACLE BI PUBLISHER
 JUNE 2016 PRIMAVERA P6 8x, CONTRACT MANAGEMENT 14x AND UNIFIER 16x ABSTRACT An often requested feature in reporting is the development of simple Dashboard reports that summarize project information in
Introducing V3 Analytics A U G U S T
 Introducing V3 Analytics A U G U S T 2 0 1 7 Table of Contents Document Versioning 2 Introduction 3 Terminology 3 Analytics Platforms: V1 Analytics versus V2 Analytics versus V3 Analytics 3 Schedule 3
Writing Reports with Report Designer and SSRS 2014 Level 1
 Writing Reports with Report Designer and SSRS 2014 Level 1 Duration- 2days About this course In this 2-day course, students are introduced to the foundations of report writing with Microsoft SQL Server
Alma Analytics Beyond out-of-the-box reports: Tips for formatting and customization
 Alma Analytics Beyond out-of-the-box reports: Tips for formatting and customization Tricia Clayton tclayton3@gsu.edu Collection Services Librarian Georgia State University GIL User Group Meeting, 2018
Asset Arena InvestOne
 Asset Arena InvestOne 1 21 AD HOC REPORTING 21.1 OVERVIEW Ad Hoc reporting supports a range of functionality from quick querying of data to more advanced features: publishing reports with complex features
Table of Contents. Table of Contents
 Powered by 1 Table of Contents Table of Contents Dashboard for Windows... 4 Dashboard Designer... 5 Creating Dashboards... 5 Printing and Exporting... 5 Dashboard Items... 5 UI Elements... 5 Providing
Desktop Studio: Charts
 Desktop Studio: Charts Intellicus Enterprise Reporting and BI Platform Intellicus Technologies info@intellicus.com www.intellicus.com Working with Charts i Copyright 2011 Intellicus Technologies This document
Microsoft How to Series
 Microsoft How to Series Getting Started with EXCEL 2007 A B C D E F Tabs Introduction to the Excel 2007 Interface The Excel 2007 Interface is comprised of several elements, with four main parts: Office
Eloqua Insight Intro Analyzer User Guide
 Eloqua Insight Intro Analyzer User Guide Table of Contents About the Course Materials... 4 Introduction to Eloqua Insight for Analyzer Users... 13 Introduction to Eloqua Insight... 13 Eloqua Insight Home
COGNOS BI I) BI introduction Products Introduction Architecture Workflows
 BI introduction Products Introduction Architecture Workflows") COGNOS BI I) BI introduction Products Architecture Workflows II) Working with Framework Manager (Modeling Tool): Architecture Flow charts Creating Project Creating Data Sources Preparing Relational Metadata
COGNOS BI I) BI introduction Products Architecture Workflows II) Working with Framework Manager (Modeling Tool): Architecture Flow charts Creating Project Creating Data Sources Preparing Relational Metadata
Overview. Principal Product Manager Oracle JDeveloper & Oracle ADF
 Rich Web UI made simple an ADF Faces Overview Dana Singleterry Dana Singleterry Principal Product Manager Oracle JDeveloper & Oracle ADF Agenda Comparison: New vs. Old JDeveloper Provides JSF Overview
Detailed Course Modules for Oracle BI Publisher Online Training:
 Detailed Course Modules for Oracle BI Publisher Online Training: 1 Introduction to Oracle BI Publisher 11g Course Agenda Overview of Oracle BI Foundation Suite Overview of Oracle Fusion Middleware Overview
Quick Reference Card Business Objects Toolbar Design Mode
 Icon Description Open in a new window Pin/Unpin this tab Close this tab File Toolbar New create a new document Open Open a document Select a Folder Select a Document Select Open Save Click the button to
Desktop Studio: Charts. Version: 7.3
 Desktop Studio: Charts Version: 7.3 Copyright 2015 Intellicus Technologies This document and its content is copyrighted material of Intellicus Technologies. The content may not be copied or derived from,
Doc. Version 1.0 Updated:
 OneStop Reporting Report Designer/Player 3.5 User Guide Doc. Version 1.0 Updated: 2012-01-02 Table of Contents Introduction... 3 Who should read this manual... 3 What s included in this manual... 3 Symbols
Course Outline. Writing Reports with Report Builder and SSRS Level 1 Course 55123: 2 days Instructor Led. About this course
 About this course Writing Reports with Report Builder and SSRS Level 1 Course 55123: 2 days Instructor Led In this 2-day course, students will continue their learning on the foundations of report writing
Management Reports Centre. User Guide. Emmanuel Amekuedi
 Management Reports Centre User Guide Emmanuel Amekuedi Table of Contents Introduction... 3 Overview... 3 Key features... 4 Authentication methods... 4 System requirements... 5 Deployment options... 5 Getting
Creating a Spreadsheet by Using Excel
 The Excel window...40 Viewing worksheets...41 Entering data...41 Change the cell data format...42 Select cells...42 Move or copy cells...43 Delete or clear cells...43 Enter a series...44 Find or replace
ActiveReports 12 Server 1
 ActiveReports 12 Server 1 Table of Contents Table of Contents 1-2 ActiveReports 12 Server Designer User Guide 3 Report Portal 3-7 Mobile Report Portal 7-11 Get Started with ActiveReports Web Designer 11-12
Index COPYRIGHTED MATERIAL. Symbols and Numerics
 Symbols and Numerics ( ) (parentheses), in functions, 173... (double quotes), enclosing character strings, 183 #...# (pound signs), enclosing datetime literals, 184... (single quotes), enclosing character
Institutional Reporting and Analysis (IRA) For help, blitz "Financial Reports", or
 For help, blitz Financial Reports, or") Institutional Reporting and Analysis (IRA) 1 Training Agenda Introduction to the IRA Reporting Tool Logging onto the system (4-5) Navigating the Dashboard (6-10) Running Reports (11-12) Working with Reports
Institutional Reporting and Analysis (IRA) 1 Training Agenda Introduction to the IRA Reporting Tool Logging onto the system (4-5) Navigating the Dashboard (6-10) Running Reports (11-12) Working with Reports
Sample Data. Sample Data APPENDIX A. Downloading the Sample Data. Images. Sample Databases
 APPENDIX A Sample Data Sample Data If you wish to follow the examples used in this book and I hope you will you will need some sample data to work with. All the files referenced in this book are available
Crystal Reports Compiled by Christopher Dairion
 Crystal Reports Compiled by Christopher Dairion Not for customer distribution! When you install Crystal Reports 9, the Excel and Access Add-In are added automatically. A Crystal Report Wizard 9 menu option
Numbers Basics Website:
 Website: http://etc.usf.edu/te/ Numbers is Apple's new spreadsheet application. It is installed as part of the iwork suite, which also includes the word processing program Pages and the presentation program
SmartView. User Guide - Analysis. Version 2.0
 SmartView User Guide - Analysis Version 2.0 Table of Contents Page i Table of Contents Table Of Contents I Introduction 1 Dashboard Layouts 2 Dashboard Mode 2 Story Mode 3 Dashboard Controls 4 Dashboards
 Page 1 of 6 Procedures > Pages > Procedures Use -the-system > MI-generate-report MI - Generate Report I Like It Tags & Notes MI - Generate Report This is an explanation of how to access, view and filter
Oracle 1Z0-620 Exam Questions & Answers
 Oracle 1Z0-620 Exam Questions & Answers Number: 1Z0-620 Passing Score: 800 Time Limit: 120 min File Version: 35.7 http://www.gratisexam.com/ Oracle 1Z0-620 Exam Questions & Answers Exam Name: Siebel7.7
Microsoft Excel 2016 / 2013 Basic & Intermediate
 Microsoft Excel 2016 / 2013 Basic & Intermediate Duration: 2 Days Introduction Basic Level This course covers the very basics of the Excel spreadsheet. It is suitable for complete beginners without prior
MicroStrategy Desktop
 MicroStrategy Desktop Quick Start Guide MicroStrategy Desktop is designed to enable business professionals like you to explore data, simply and without needing direct support from IT. 1 Import data from
A Guide to Quark Author Web Edition 2015
 A Guide to Quark Author Web Edition 2015 CONTENTS Contents Getting Started...4 About Quark Author - Web Edition...4 Smart documents...4 Introduction to the Quark Author - Web Edition User Guide...4 Quark
ER/Studio Enterprise Portal User Guide
 ER/Studio Enterprise Portal 1.1.1 User Guide Copyright 1994-2009 Embarcadero Technologies, Inc. Embarcadero Technologies, Inc. 100 California Street, 12th Floor San Francisco, CA 94111 U.S.A. All rights
Learn how to login to Sitefinity and what possible errors you can get if you do not have proper permissions.
 USER GUIDE This guide is intended for users of all levels of expertise. The guide describes in detail Sitefinity user interface - from logging to completing a project. Use it to learn how to create pages
User Manual instantolap
 User Manual instantolap Version 2.7.0 15.12.2010 Page 2 / 213 instantolap User Manual 2.7.0 instantolap User Manual 2.7.0 Page 3 / 213 Copyright Copyright (C) 2002-2010 Thomas Behrends Softwareentwicklung
Microsoft Office Excel 2013 Courses 24 Hours
 Microsoft Office Excel 2013 Courses 24 Hours COURSE OUTLINES FOUNDATION LEVEL COURSE OUTLINE Getting Started With Excel 2013 Starting Excel 2013 Selecting the Blank Worksheet Template The Excel 2013 Cell
Hands-On Lab. Developing BI Applications. Lab version: Last updated: 2/23/2011
 Hands-On Lab Developing BI Applications Lab version: 1.0.0 Last updated: 2/23/2011 CONTENTS OVERVIEW... 3 EXERCISE 1: USING THE CHART WEB PART... 4 Task 1 Add the Chart Web Part to the page... 4 Task 2
General Ledger Report Writer Users Guide
 General Ledger Report Writer Users Guide Updated 02/18/2015 Page 1 of 15 General Ledger Report Writer The new GL report writer is template driven. The template stores rows and columns that make up the
Data Should Not be a Four Letter Word Microsoft Excel QUICK TOUR
 Toolbar Tour AutoSum + more functions Chart Wizard Currency, Percent, Comma Style Increase-Decrease Decimal Name Box Chart Wizard QUICK TOUR Name Box AutoSum Numeric Style Chart Wizard Formula Bar Active
EMC Ionix ControlCenter (formerly EMC ControlCenter) 6.0 StorageScope
 6.0 StorageScope") EMC Ionix ControlCenter (formerly EMC ControlCenter) 6.0 StorageScope Best Practices Planning Abstract This white paper provides advice and information on practices that will enhance the flexibility of
EMC Ionix ControlCenter (formerly EMC ControlCenter) 6.0 StorageScope Best Practices Planning Abstract This white paper provides advice and information on practices that will enhance the flexibility of
SAS Web Report Studio 3.1
 SAS Web Report Studio 3.1 User s Guide SAS Documentation The correct bibliographic citation for this manual is as follows: SAS Institute Inc. 2006. SAS Web Report Studio 3.1: User s Guide. Cary, NC: SAS
BusinessObjects Frequently Asked Questions
 BusinessObjects Frequently Asked Questions Contents Is there a quick way of printing together several reports from the same document?... 2 Is there a way of controlling the text wrap of a cell?... 2 How
Administrative Training Mura CMS Version 5.6
 Administrative Training Mura CMS Version 5.6 Published: March 9, 2012 Table of Contents Mura CMS Overview! 6 Dashboard!... 6 Site Manager!... 6 Drafts!... 6 Components!... 6 Categories!... 6 Content Collections:
FIN 850: UDW+ Finance Ad Hoc Reports Training Version 2.9
 FIN 850: UDW+ Finance Ad Hoc Reports Training Version 2.9 Program Services Office & Decision Support Group Table of Contents Subject Areas... 1 Criteria... 2 Exercise 1: Create a Budget Summary Report...
P3e REPORT WRITER CREATING A BLANK REPORT
 P3e REPORT WRITER CREATING A BLANK REPORT 1. On the Reports window, select a report, then click Copy. 2. Click Paste. 3. Click Modify. 4. Click the New Report icon. The report will look like the following
End User s Guide Release 5.0
 [1]Oracle Application Express End User s Guide Release 5.0 E39146-04 August 2015 Oracle Application Express End User's Guide, Release 5.0 E39146-04 Copyright 2012, 2015, Oracle and/or its affiliates. All
Hands-On Lab. Lab: Developing BI Applications. Lab version: Last updated: 2/23/2011
 Hands-On Lab Lab: Developing BI Applications Lab version: 1.0.0 Last updated: 2/23/2011 CONTENTS OVERVIEW... 3 EXERCISE 1: USING THE CHARTING WEB PARTS... 5 EXERCISE 2: PERFORMING ANALYSIS WITH EXCEL AND
Designing Adhoc Reports
 Designing Adhoc Reports Intellicus Enterprise Reporting and BI Platform Intellicus Technologies info@intellicus.com www.intellicus.com Designing Adhoc Reports i Copyright 2012 Intellicus Technologies This
HYPERION SYSTEM 9 PERFORMANCE SCORECARD
 HYPERION SYSTEM 9 PERFORMANCE SCORECARD RELEASE 9.2 NEW FEATURES Welcome to Hyperion System 9 Performance Scorecard, Release 9.2. This document describes the new or modified features in this release. C
Project and Portfolio Management Center
 Project and Portfolio Management Center Software Version: 9.42 Getting Started Go to HELP CENTER ONLINE http://admhelp.microfocus.com/ppm/ Document Release Date: September 2017 Software Release Date: September
SAP BusinessObjects Analysis, edition for OLAP User Guide SAP BusinessObjects XI 4.0
 SAP BusinessObjects Analysis, edition for OLAP User Guide SAP BusinessObjects XI 4.0 Copyright 2011 SAP AG. All rights reserved.sap, R/3, SAP NetWeaver, Duet, PartnerEdge, ByDesign, SAP Business ByDesign,
 Standard Professional Premium Company size:
 Business Insight Authoring
 Business Insight Authoring Getting Started Guide ImageNow Version: 6.7.x Written by: Product Documentation, R&D Date: August 2016 2014 Perceptive Software. All rights reserved CaptureNow, ImageNow, Interact,
FIN 850: UDW+ Ad Hoc Reports Training 2014 Version 2.4
 FIN 850: UDW+ Ad Hoc Reports Training 2014 Version 2.4 Program Services Office & Decision Support Group Table of Contents Subject Areas... 1 Criteria Tab... 2 Create an Analysis... 3 Results Tab... 5 Rearrange
CHRIST THE KING BOYS MATRIC HR. SEC. SCHOOL, KUMBAKONAM CHAPTER 2 TEXT FORMATTING
 CHAPTER 2 TEXT FORMATTING 1. Explain how to create a Bulleted and Numbered List in Star Office Writer? One way to create a list of points or topics in a document is to create a bulleted list. A bullet
Using the Drag-and-Drop Report Builder
 Using the Drag-and-Drop Report Builder Salesforce, Spring 16 @salesforcedocs Last updated: January 7, 2016 Copyright 2000 2016 salesforce.com, inc. All rights reserved. Salesforce is a registered trademark
Connect Databases to AutoCAD with dbconnect Nate Bartley Test Development Engineer autodesk, inc.
 Connect Databases to AutoCAD with dbconnect Nate Bartley Test Development Engineer autodesk, inc. GD22-4 1 2 Agenda Introduction Overview of dbconnect Configure a data source Connect database to AutoCAD
Reporter Tutorial: Intermediate
 Reporter Tutorial: Intermediate Refer to the following sections for guidance on using these features of the Reporter: Lesson 1 Data Relationships in Reports Lesson 2 Create Tutorial Training Report Lesson
Microsoft Windows SharePoint Services
 Microsoft Windows SharePoint Services SITE ADMIN USER TRAINING 1 Introduction What is Microsoft Windows SharePoint Services? Windows SharePoint Services (referred to generically as SharePoint) is a tool
Chapter 4 Printing and Viewing a Presentation Using Proofing Tools I. Spell Check II. The Thesaurus... 23
 PowerPoint Level 1 Table of Contents Chapter 1 Getting Started... 7 Interacting with PowerPoint... 7 Slides... 7 I. Adding Slides... 8 II. Deleting Slides... 8 III. Cutting, Copying and Pasting Slides...
Keynote Basics Website:
 Keynote Basics Website: http://etc.usf.edu/te/ Keynote is Apple's presentation application. Keynote is installed as part of the iwork suite, which also includes the word processing program Pages. If you
Excel Level 2
 1800 ULEARN (853 276) www.ddls.com.au Excel 2016 - Level 2 Length 1 day Price $456.50 (inc GST) Overview The skills and knowledge acquired in Microsoft Excel 2016 - Level 2 enable users to expand their
Microsoft Access 2010
 2013\2014 Microsoft Access 2010 Tamer Farkouh M i c r o s o f t A c c e s s 2 0 1 0 P a g e 1 Definitions Microsoft Access 2010 What is a database? A database is defined as an organized collection of data
Policy Commander Console Guide - Published February, 2012
 Policy Commander Console Guide - Published February, 2012 This publication could include technical inaccuracies or typographical errors. Changes are periodically made to the information herein; these changes
Advanced Excel. Click Computer if required, then click Browse.
 Advanced Excel 1. Using the Application 1.1. Working with spreadsheets 1.1.1 Open a spreadsheet application. Click the Start button. Select All Programs. Click Microsoft Excel 2013. 1.1.1 Close a spreadsheet
Designing Ad hoc Report. Version: 7.3
 Designing Ad hoc Report Version: 7.3 Copyright 2015 Intellicus Technologies This document and its content is copyrighted material of Intellicus Technologies. The content may not be copied or derived from,
1Z0-526
 1Z0-526 Passing Score: 800 Time Limit: 4 min Exam A QUESTION 1 ABC's Database administrator has divided its region table into several tables so that the west region is in one table and all the other regions
Module 4: Creating Content Lesson 4: Creating Charts Learn
 Module 4: Creating Content Lesson 4: Creating Charts Learn Welcome to Module 4, Lesson 4. In this lesson, you will learn how to create, edit, and save new charts based on your uploaded data using InfoAssist+.
Call: Crystal Report Course Content:35-40hours Course Outline
 Crystal Report Course Content:35-40hours Course Outline Introduction Of Crystal Report & It s Benefit s Designing Reports Defining the Purpose Planning the Layout Examples of Reports Choosing Data Laying
 1 of 9 8/27/2014 10:53 AM Units: Teacher: MOExcel/Access, CORE Course: MOExcel/Access Year: 2012-13 Excel Unit A What is spreadsheet software? What are the parts of the Excel window? What are labels and
Access Groups. Collect and Store. Text Currency Date/Time. Tables Fields Data Type. You Your Friend Your Parent. Unique information
 Tutorial A database is a computerized record keeping system used to collect, store, analyze and report electronic information for a variety of purposes. Microsoft Access is a database. There are three
Designing Adhoc Reports
 Designing Adhoc Reports Intellicus Enterprise Reporting and BI Platform Intellicus Technologies info@intellicus.com www.intellicus.com Copyright 2010 Intellicus Technologies This document and its content
Data Explorer: User Guide 1. Data Explorer User Guide
 Data Explorer: User Guide 1 Data Explorer User Guide Data Explorer: User Guide 2 Contents About this User Guide.. 4 System Requirements. 4 Browser Requirements... 4 Important Terminology.. 5 Getting Started
CCRS Quick Start Guide for Program Administrators. September Bank Handlowy w Warszawie S.A.
 CCRS Quick Start Guide for Program Administrators September 2017 www.citihandlowy.pl Bank Handlowy w Warszawie S.A. CitiManager Quick Start Guide for Program Administrators Table of Contents Table of Contents
Personalizing CA Clarity PPM User Guide. Release
 Personalizing CA Clarity PPM User Guide Release 13.2.00 This Documentation, which includes embedded help systems and electronically distributed materials, (hereinafter referred to as the Documentation
User Guide. Visualizer
 User Guide Visualizer Copyright 2018 Upland Software. All rights reserved. Information in this document is subject to change without notice. The software described in this document is furnished under a
WebIntelligence. Creating Documents
 Creating Documents This page is intentionally left blank. 2 WIC110904 Table of Contents Lesson Objective... 5 For Assistance...6 Introduction... 7 Document Editor... 7 Designing a Query Flowchart... 9
Longview CPM elearning Library Table of Contents. January 2017 Edition
 Longview CPM elearning Library Table of Contents January 2017 Edition Topics Topic # Module Name Longview CPM elearning Library Table of Contents Time (min.sec)* Introduction to Longview 1.01 What is Longview
Griffin Training Manual Grif-WebI Introduction (For Analysts)
") Griffin Training Manual Grif-WebI Introduction (For Analysts) Alumni Relations and Development The University of Chicago Table of Contents Chapter 1: Defining WebIntelligence... 1 Chapter 2: Working with
Griffin Training Manual Grif-WebI Introduction (For Analysts) Alumni Relations and Development The University of Chicago Table of Contents Chapter 1: Defining WebIntelligence... 1 Chapter 2: Working with
SAS Infrastructure for Risk Management 3.4: User s Guide
 SAS Infrastructure for Risk Management 3.4: User s Guide SAS Documentation March 2, 2018 The correct bibliographic citation for this manual is as follows: SAS Institute Inc. 2017. SAS Infrastructure for
File: SiteExecutive 2013 Core Modules User Guide.docx Printed September 30, 2013
 File: SiteExecutive 2013 Core Modules User Guide.docx Printed September 30, 2013 Page i Contact: Systems Alliance, Inc. Executive Plaza III 11350 McCormick Road, Suite 1203 Hunt Valley, Maryland 21031
Spreadsheet definition: Starting a New Excel Worksheet: Navigating Through an Excel Worksheet
 Copyright 1 99 Spreadsheet definition: A spreadsheet stores and manipulates data that lends itself to being stored in a table type format (e.g. Accounts, Science Experiments, Mathematical Trends, Statistics,
SQL Server Reporting Services (SSRS) is one of SQL Server 2008 s
 is one of SQL Server 2008 s") Chapter 9 Turning Data into Information with SQL Server Reporting Services In This Chapter Configuring SQL Server Reporting Services with Reporting Services Configuration Manager Designing reports Publishing
Chapter 9 Turning Data into Information with SQL Server Reporting Services In This Chapter Configuring SQL Server Reporting Services with Reporting Services Configuration Manager Designing reports Publishing
Oracle. Risk Management Cloud Creating Analytics and Reports. Release 13 (update 17D)
") Oracle Risk Management Cloud Release 13 (update 17D) Release 13 (update 17D) Part Number E89287-01 Copyright 2011-2017, Oracle and/or its affiliates. All rights reserved. Author: David Christie This software
Oracle Risk Management Cloud Release 13 (update 17D) Release 13 (update 17D) Part Number E89287-01 Copyright 2011-2017, Oracle and/or its affiliates. All rights reserved. Author: David Christie This software
Mastering EA Document Style Sheets
 Mastering EA Document Style Sheets Introduction In order to provide a consistent look-and-feel to documents (RTF/DOCX/PDF) produced from Sparx Systems Enterprise Architect, Sparx Systems provided the facility
Product Documentation SAP Business ByDesign August Analytics
 Product Documentation PUBLIC Analytics Table Of Contents 1 Analytics.... 5 2 Business Background... 6 2.1 Overview of Analytics... 6 2.2 Overview of Reports in SAP Business ByDesign... 12 2.3 Reports