Producing Summary Tables in SAS Enterprise Guide
|
|
|
- Brittany Beasley
- 5 years ago
- Views:
Transcription

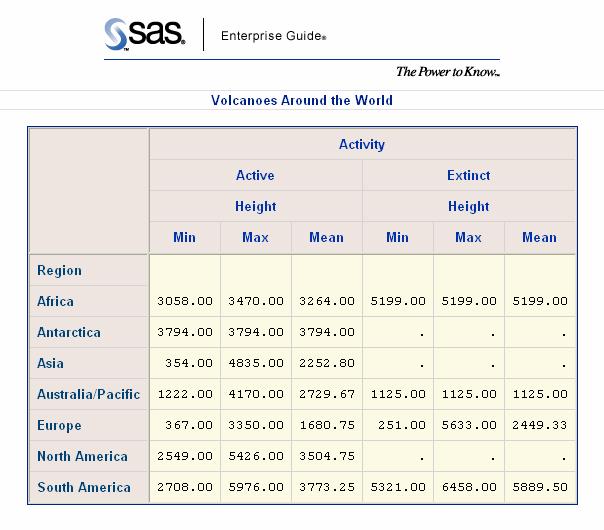
1 Producing Summary Tables in SAS Enterprise Guide Lora D. Delwiche, University of California, Davis, CA Susan J. Slaughter, Avocet Solutions, Davis, CA ABSTRACT This paper shows, step-by-step, how to use the Summary Tables task in Enterprise Guide to produce polished reports. Summary Tables is based on the TABLULATE procedure, but you don t need to know how to use PROC TABULATE or even how to write SAS programs to use this feature. Whether you are a seasoned SAS programmer or new to SAS, Summary Tables can make creating summary reports easier. INTRODUCTION The TABULATE procedure in SAS is a powerful way to create complex and attractive reports. However, getting your report arranged just the way you want it can take extensive trial and error. Enterprise Guide to the rescue. The Summary Tables task in Enterprise Guide is a point-and-click interface to the TABULATE procedure. Using it you can easily arrange and rearrange your report to see how it will look before you even run it. You can also change titles, headers, fonts, colors, and data formats. In fact, practically any feature you can set in PROC TABULATE code in SAS you can change interactively in Summary Tables. Summary Tables is faster, easier, and saves you from having to figure out where to put all those asterisks and parentheses. Once you ve perfected your table in Enterprise Guide, you can, if you wish, save the code and run it from the SAS System. This paper was written using SAS Enterprise Guide 3. If you are using SAS Enterprise Guide 2 or 4 you will see big differences in the Project and Process Flow windows, but only slight differences in the Summary Tables task. OPENING THE SUMMARY TABLES TASK To make a data set active, click its icon in the Process Flow or Project window. Then open the Summary Tables task by selecting Describe Summary Tables from the menu bar. Enterprise Guide will open a Summary Tables window for the active data set. Menus Process Flow window Data Grid displaying World data table 1


2 TASK ROLES PANE Before you can do anything else in Summary Tables, you must assign variables to task roles. To do this, drag a variable from the list of variables to the list of task roles. You must have at least one analysis or classification variable. Classification variables are ones whose values will form the rows, columns or pages of the report. Classification variables may be numeric or character. Analysis variables are ones whose values will be summarized in the data cells of the table. Analysis variables must be numeric. For classification variables, you may set some options in the Task Roles pane including sort order and whether missing values will be included. List of task roles Choose options for classification variables Drag variables to task roles SUMMARY TABLES PANE Before you can run a report, you must tell Enterprise Guide how to arrange the report. To open the Summary Tables pane, click Summary Tables in the list of options on the left. Select Summary Tables Preview Area 2


3 To assign a variable to serve as rows or columns of your report, drag the variable name from the list of Available Variables to the Preview area. It may take a little practice to get variables where you want them. The trick is to watch the cursor. If the cursor looks like the universal not allowed symbol,, then you cannot drop the variable. When the cursor changes to a line or a box, then you can drop the variable. Drag variables to Preview Area Preview Area Once the variables are where you want them, click Run to see your report. To re-open a task so you can make changes to it, double-click the Summary Tables task icon in the Process Flow or Project window, or right-click and select Open. 3
. You can insert other statistics into your table by clicking on an item in the Available Statistics box and draging it to the Preview area.")
4 CHOOSING STATISTICS The default statistic for a classification variable is N (the number of observations in that group), and the default statistic for an analysis variable is SUM (the total of the values in that group). You can insert other statistics into your table by clicking on an item in the Available Statistics box and draging it to the Preview area. Drag statistics to Preview Area Preview Area Once the variables are where you want them, click Run to see your report. 4
. For footnotes, click on Footnote and do the same.")
5 CHANGING TITLES AND FOOTNOTES You will probably want to change the titles and footnotes. To open the Titles pane, click Titles in the list on left. Click Table Titles, uncheck the Use Default Text box, and type in the new title (or delete the text to have no title). For footnotes, click on Footnote and do the same. Select Titles Select Table Titles or Footnote Type new text or delete for no title To see the report with the new title and footnote (in this case, no footnote), click Run. 5
6 6


7 CHANGING BOX AREA PROPERTIES There is always an empty box in the upper right corner of a Summary Tables report. To put text in this box, right-click anywhere in the Preview area. Then select Box Area Properties, and type in the text you want. Select Summary Tables Right-click, Select Box Area Properties Type text Click Run to see your report with the new box area label. 7


8 CHANGING ROW OR COLUMN HEADING PROPERTIES Summary Tables uses the names of the variables for row and column headings. You may want to change them to more descriptive labels, or remove them entirely. To do this, right-click the heading you want to change and select Heading Properties. In the Heading Properties window you can type in a new label. If you change the label to blank, then Enterprise Guide will delete that heading from the table. Right-click, Select Heading Properties Type new label or delete to remove heading Click Run to see your report with the new headings. 8


9 CHANGING TABLE OR DATA VALUE PROPERTIES If you want to make a change to all the data cells in a report, right-click anywhere in the Preview area and select Table Properties. However, if you want to make a change to just one row or column, right-click on the heading for that row or column and select Data Value Properties. Select the Format tab and specify the format you wish. Right-click, Select Table or Data Value Properties Select Format tab and choose format Click Run to see the report with the new data format. 9


10 CHANGING THE OVERALL STYLE Enterprise Guide comes with many built-in style templates, and you can create your own custom style templates using the Style Manager. Once you have created a report, you can easily change its style by selecting a different style template from the Style box on the menu bar. This is a temporary change in style. If you rerun the task, the style will return to the default. There are other ways to change the style that are permanent, but changing styles using the Style box on the menu bar allows you to choose styles and see the result immediately. Here is how this report looks in the Analysis style. Select a style template CHANGING OTHER STYLE ELEMENTS In addition to changing the overall style of a report, you can also change the style of almost any part of a report using the Font tab of the various Properties windows. Right-click, Select a type of Properties Select Font tab and specify style attributes 10


11 Click Run to see your report with the new style attributes. VIEWING THE SAS CODE To view the code produced by Summary Tables, right-click the Summary Tables icon and select Open Code. Enterprise Guide will open a Code window containing the complete program including PROC TABULATE. You can edit and save this program for later use in Enterprise Guide or the SAS System. CONCLUSION The Summary Tables task in Enterprise Guide is easy-to-use and gives you access to practically any feature of the TABULATE procedure. It s so easy that even experienced SAS programmers may want to use Summary Tables to generate reports or code for use in SAS programs. ABOUT THE AUTHORS Lora Delwiche and Susan Slaughter are the authors of The Little SAS Book: A Primer and The Little SAS Book for Enterprise Guide 3.0. A revision for Enterprise Guide 4.1 will be available summer of Contact the authors at: Lora D. Delwiche (530) llddelwiche@ucdavis.edu Susan J. Slaughter (530) susan@avocetsolutions.com SAS and all other SAS Institute Inc. product or service names are registered trademarks or trademarks of SAS Institute Inc. in the USA and other countries. indicates USA registration. Other brand and product names are trademarks of their respective companies. 11
Dynamic Projects in SAS Enterprise Guide How to Create and Use Parameters
 Paper HW02 Dynamic Projects in SAS Enterprise Guide How to Create and Use Parameters Susan J. Slaughter, Avocet Solutions, Davis, CA Lora D. Delwiche, University of California, Davis, CA ABSTRACT SAS Enterprise
SAS Studio: A New Way to Program in SAS
 SAS Studio: A New Way to Program in SAS Lora D Delwiche, Winters, CA Susan J Slaughter, Avocet Solutions, Davis, CA ABSTRACT SAS Studio is an important new interface for SAS, designed for both traditional
Introduction. Inserting and Modifying Tables. Word 2010 Working with Tables. To Insert a Blank Table: Page 1
 Word 2010 Working with Tables Introduction Page 1 A table is a grid of cells arranged in rows and columns. Tables can be customized and are useful for various tasks such as presenting text information
New Perspectives on Microsoft Excel Module 5: Working with Excel Tables, PivotTables, and PivotCharts
 New Perspectives on Microsoft Excel 2016 Module 5: Working with Excel Tables, PivotTables, and PivotCharts Objectives, Part 1 Explore a structured range of data Freeze rows and columns Plan and create
Basic tasks in Excel 2013
 Basic tasks in Excel 2013 Excel is an incredibly powerful tool for getting meaning out of vast amounts of data. But it also works really well for simple calculations and tracking almost any kind of information.
Tutorial 5: Working with Excel Tables, PivotTables, and PivotCharts. Microsoft Excel 2013 Enhanced
 Tutorial 5: Working with Excel Tables, PivotTables, and PivotCharts Microsoft Excel 2013 Enhanced Objectives Explore a structured range of data Freeze rows and columns Plan and create an Excel table Rename
Easing into Data Exploration, Reporting, and Analytics Using SAS Enterprise Guide
 Paper 809-2017 Easing into Data Exploration, Reporting, and Analytics Using SAS Enterprise Guide ABSTRACT Marje Fecht, Prowerk Consulting Whether you have been programming in SAS for years, are new to
Microsoft Excel Pivot Tables & Pivot Table Charts
 Microsoft Excel 2013 Pivot Tables & Pivot Table Charts A pivot table report allows you to analyze and summarize a million rows of data in Excel 2013 without entering a single formula. Pivot Tables let
Microsoft Access 5: Reports & Other Useful Functions
 Microsoft Access 5: Reports & Other Useful Functions You can print out simple records of your data by using the Office menu. However, if you want to create a customized report from one or more tables or
ODS Meets SAS/IntrNet
 Paper 9-27 ODS Meets SAS/IntrNet Susan J. Slaughter, Avocet Solutions, Davis, CA Sy Truong, Meta-Xceed, Inc, Fremont, CA Lora D. Delwiche, University of California, Davis Abstract The SAS System gives
Introduction to Excel 2013 Part 2
 Introduction to Excel 2013 Part 2 Open a file Select File from the Menu bar, select Open from the drop down menu, navigate to the place where the file was stored, double-left click on the file name. Modify
Contents About SAS Enterprise Guide About This Book xi Acknowledgments xiii
 The Little SAS Enterprise Guide Book. Full book available for purchase here. Contents About SAS Enterprise Guide About This Book xi Acknowledgments xiii ix Tutorials Section 1 Tutorial A Getting Started
Navigate to Cognos Cognos Analytics supports all browsers with the exception of Microsoft Edge.
 IBM Cognos Analytics Create a List The following instructions cover how to create a list report in IBM Cognos Analytics. A list is a report type in Cognos that displays a series of data columns listing
Microsoft Office Illustrated Introductory, Building and Using Queries
 Microsoft Office 2007- Illustrated Introductory, Building and Using Queries Creating a Query A query allows you to ask for only the information you want vs. navigating through all the fields and records
Reference Services Division Presents. Microsoft Word 2
 Reference Services Division Presents Microsoft Word 2 This handout covers the latest Microsoft Word 2010. This handout includes instructions for the tasks we will be covering in class. Basic Tasks Review
Microsoft Excel Pivot Tables & Pivot Table Charts
 Microsoft Excel 2007 Pivot Tables & Pivot Table Charts A pivot table report allows you to analyze and summarize a million rows of data in Excel 2007 without entering a single formula. Pivot Tables let
Excel Contents. MS Excel /3/2011 JSD#2-Neptune Page 1
 Excel 2013 Contents Contents... 1 Opening Start Screen... 2 Formatting cells... 2 Modifying information in a cell... 2 Autofil... 3 Merge and Center Headings and Merge Cells... 3 Auto Calculation... 3
Week 5 Creating a Calendar. About Tables. Making a Calendar From a Table Template. Week 5 Word 2010
 Week 5 Creating a Calendar About Tables Tables are a good way to organize information. They can consist of only a few cells, or many cells that cover several pages. You can arrange boxes or cells vertically
Excel 2013 for Beginners
 Excel 2013 for Beginners Class Objective: This class will familiarize you with the basics of using Microsoft Excel. Class Outline: Introduction to Microsoft Excel 2013... 1 Microsoft Excel...2-3 Getting
Skills Exam Objective Objective Number
 Overview 1 LESSON SKILL MATRIX Skills Exam Objective Objective Number Starting Excel Create a workbook. 1.1.1 Working in the Excel Window Customize the Quick Access Toolbar. 1.4.3 Changing Workbook and
Explore commands on the ribbon Each ribbon tab has groups, and each group has a set of related commands.
 Quick Start Guide Microsoft Excel 2013 looks different from previous versions, so we created this guide to help you minimize the learning curve. Add commands to the Quick Access Toolbar Keep favorite commands
Microsoft Word 2013 Working with tables
 Microsoft Word 2013 Working with tables LIBRARY AND LEARNING SERVICES WORKING WITH TABLES www.eit.ac.nz/library/ls_computer_word2013_tables.html What is a table? A table is information arranged in horizontal
Navigate to Cognos Cognos Analytics supports all browsers with the exception of Microsoft Edge.
 IBM Cognos Analytics Create a Crosstab The following instructions cover how to create a crosstab report in IBM Cognos Analytics. A crosstab is a report type in Cognos that displays an analytical look at
Numbers Basics Website:
 Website: http://etc.usf.edu/te/ Numbers is Apple's new spreadsheet application. It is installed as part of the iwork suite, which also includes the word processing program Pages and the presentation program
Table of Contents. 1. Creating a Microsoft Excel Workbook...1 EVALUATION COPY
 Table of Contents Table of Contents 1. Creating a Microsoft Excel Workbook...1 Starting Microsoft Excel...1 Creating a Workbook...2 Saving a Workbook...3 The Status Bar...5 Adding and Deleting Worksheets...6
You can clear the sample data from the table by selecting the table and pressing Delete.
 Making Quick Tables Choose Insert tab. Then click Table. Then click Quick Tables. Select the style of table from the Quick Tables Gallery. You can clear the sample data from the table by selecting the
Make it a Great Day at the Office: Essential Tips and Tricks for Office 2013 and Outlook 2013
 Computing Services and Systems Development Make it a Great Day at the Office: Essential Tips and Tricks for Office 2013 and Outlook 2013 Staff Association Council Computing Services and Systems Development
Rev. C 11/09/2010 Downers Grove Public Library Page 1 of 41
 Table of Contents Objectives... 3 Introduction... 3 Excel Ribbon Components... 3 Office Button... 4 Quick Access Toolbar... 5 Excel Worksheet Components... 8 Navigating Through a Worksheet... 8 Making
Objective 1: Familiarize yourself with basic database terms and definitions. Objective 2: Familiarize yourself with the Access environment.
 Beginning Access 2007 Objective 1: Familiarize yourself with basic database terms and definitions. What is a Database? A Database is simply defined as a collection of related groups of information. Things
Service Line Export and Pivot Table Report (Windows Excel 2010)
") Service Line Export and Pivot Table Report (Windows Excel 2010) In this tutorial, we will take the Service Lines of the Active Students only and only the most recent record to take a snapshot look at approximate
Service Line Export and Pivot Table Report (Windows Excel 2010) In this tutorial, we will take the Service Lines of the Active Students only and only the most recent record to take a snapshot look at approximate
Anyone Can Learn PROC TABULATE, v2.0
 Paper 63-25 Anyone Can Learn PROC TABULATE, v2.0 Lauren Haworth Ischemia Research & Education Foundation San Francisco ABSTRACT SAS Software provides hundreds of ways you can analyze your data. You can
SAS Macro Programming for Beginners
 ABSTRACT SAS Macro Programming for Beginners Lora D. Delwiche, Winters, CA Susan J. Slaughter, Avocet Solutions, Davis, CA Macro programming is generally considered an advanced topic. But, while macros
Microsoft Office 2016 Mail Merge
 Microsoft Office 2016 Mail Merge Mail Merge Components In order to understand how mail merge works you need to examine the elements involved in the process. In any mail merge, you'll deal with three different
Some (semi-)advanced tips for LibreOffice
advanced tips for LibreOffice") Some (semi-)advanced tips for LibreOffice by Andy Pepperdine Introduction We cover several tips on special things in Writer and Calc and anything else that turns up. Although I use LibreOffice, these should
Some (semi-)advanced tips for LibreOffice by Andy Pepperdine Introduction We cover several tips on special things in Writer and Calc and anything else that turns up. Although I use LibreOffice, these should
Unit 3 Fill Series, Functions, Sorting
 Unit 3 Fill Series, Functions, Sorting Fill enter repetitive values or formulas in an indicated direction Using the Fill command is much faster than using copy and paste you can do entire operation in
The Menu and Toolbar in Excel (see below) look much like the Word tools and most of the tools behave as you would expect.
 look much like the Word tools and most of the tools behave as you would expect.") Launch the Microsoft Excel Program Click on the program icon in Launcher or the Microsoft Office Shortcut Bar. A worksheet is a grid, made up of columns, which are lettered and rows, and are numbered.
Launch the Microsoft Excel Program Click on the program icon in Launcher or the Microsoft Office Shortcut Bar. A worksheet is a grid, made up of columns, which are lettered and rows, and are numbered.
Unit 3 Functions Review, Fill Series, Sorting, Merge & Center
 Unit 3 Functions Review, Fill Series, Sorting, Merge & Center Function built-in formula that performs simple or complex calculations automatically names a function instead of using operators (+, -, *,
Access - Introduction to Queries
 Access - Introduction to Queries Part of managing a database involves asking questions about the data. A query is an Access object that you can use to ask the question(s). The answer is contained in the
Information Visualization
 Paper 166-25 Presenting Your Data Easily with Graph-N-Go Curtis A. Smith, Defense Contract Audit Agency, La Mirada, CA ABSTRACT Visualizing and presenting data effectively using reports and listings can
Microsoft Excel 2010
 Microsoft Excel 2010 omar 2013-2014 First Semester 1. Exploring and Setting Up Your Excel Environment Microsoft Excel 2010 2013-2014 The Ribbon contains multiple tabs, each with several groups of commands.
HTML for the SAS Programmer
 HTML for the SAS Programmer Lauren Haworth Kaiser Permanente Center for Health Research Portland, Oregon ½ ABSTRACT With more and more output being delivered via the Internet, a little knowledge of HTML
Excel 2010: Getting Started with Excel
 Excel 2010: Getting Started with Excel Excel 2010 Getting Started with Excel Introduction Page 1 Excel is a spreadsheet program that allows you to store, organize, and analyze information. In this lesson,
Getting started with Ms Access Getting Started. Primary Key Composite Key Foreign Key
 Getting started with Ms Access 2007 Getting Started Customize Microsoft Office Toolbar The Ribbon Quick Access Toolbar Navigation Tabbed Document Window Viewing Primary Key Composite Key Foreign Key Table
-Using Excel- *The columns are marked by letters, the rows by numbers. For example, A1 designates row A, column 1.
 -Using Excel- Note: The version of Excel that you are using might vary slightly from this handout. This is for Office 2004 (Mac). If you are using a different version, while things may look slightly different,
How to manage backgrounds in PowerPoint
 How to manage backgrounds in PowerPoint Solid fill Let s start with a blank presentation. First you can do is to right-click anywhere on your slide and select Format Background menu. Gradient fill Choose
Paper ###-YYYY. SAS Enterprise Guide: A Revolutionary Tool! Jennifer First, Systems Seminar Consultants, Madison, WI
 Paper ###-YYYY SAS Enterprise Guide: A Revolutionary Tool! Jennifer First, Systems Seminar Consultants, Madison, WI ABSTRACT Whether you are a novice or a pro with SAS, Enterprise Guide has something for
Microsoft Excel 2010 Tutorial
 1 Microsoft Excel 2010 Tutorial Excel is a spreadsheet program in the Microsoft Office system. You can use Excel to create and format workbooks (a collection of spreadsheets) in order to analyze data and
Quick Start Guide - Contents. Opening Word Locating Big Lottery Fund Templates The Word 2013 Screen... 3
 Quick Start Guide - Contents Opening Word... 1 Locating Big Lottery Fund Templates... 2 The Word 2013 Screen... 3 Things You Might Be Looking For... 4 What s New On The Ribbon... 5 The Quick Access Toolbar...
Using Outlook for Case Management
 Using Outlook for Case Management Using software for case management can save a tremendous amount of time and enable you to also track phone calls, documents, emails and conflicts. This can all be accomplished
Office of Instructional Technology
 Office of Instructional Technology Microsoft Excel 2016 Contact Information: 718-254-8565 ITEC@citytech.cuny.edu Contents Introduction to Excel 2016... 3 Opening Excel 2016... 3 Office 2016 Ribbon... 3
Word Tutorial 3. Creating a Multiple- Page Report COMPREHENSIVE
 Word Tutorial 3 Creating a Multiple- Page Report COMPREHENSIVE Objectives Format headings with Quick Styles Insert a manual page break Create and edit a table Sort rows in a table Modify a table s structure
Creating Reports in Access 2007 Table of Contents GUIDE TO DESIGNING REPORTS... 3 DECIDE HOW TO LAY OUT YOUR REPORT... 3 MAKE A SKETCH OF YOUR
 Creating Reports in Access 2007 Table of Contents GUIDE TO DESIGNING REPORTS... 3 DECIDE HOW TO LAY OUT YOUR REPORT... 3 MAKE A SKETCH OF YOUR REPORT... 3 DECIDE WHICH DATA TO PUT IN EACH REPORT SECTION...
Contents. Group 2 Excel Handouts 2010
 Contents Styles... 2 Conditional Formatting... 2 Create a New Rule... 4 Format as Table... 5 Create your own New Table Style... 8 Cell Styles... 9 New Cell Style... 10 Merge Styles... 10 Sparklines...
Microsoft Office Illustrated. Using Tables
 Microsoft Office 2007 - Illustrated Using Tables Objectives Plan a Table Create a Table Add Table Data Find and Replace Table Data Delete Table Data 2 Objectives Sort Table Data Use Formulas in a Table
Introduction to Microsoft Access 2016
 Introduction to Microsoft Access 2016 A database is a collection of information that is related. Access allows you to manage your information in one database file. Within Access there are four major objects:
DAY 7: EXCEL CHAPTER 5. Divya Ganesan February 5, 2013
 DAY 7: EXCEL CHAPTER 5 Divya Ganesan divya.ganesan@mail.wvu.edu February 5, 2013 1 FREEZING ROWS AND COLUMNS Freezing keeps rows and columns visible during scrolling Click View tab in Ribbon Click on Freeze
Learn more about Pages, Keynote & Numbers
 Learn more about Pages, Keynote & Numbers HCPS Instructional Technology May 2012 Adapted from Apple Help Guides CHAPTER ONE: PAGES Part 1: Get to Know Pages Opening and Creating Documents Opening a Pages
Spreadsheet definition: Starting a New Excel Worksheet: Navigating Through an Excel Worksheet
 Copyright 1 99 Spreadsheet definition: A spreadsheet stores and manipulates data that lends itself to being stored in a table type format (e.g. Accounts, Science Experiments, Mathematical Trends, Statistics,
Using MS Publisher. Launch MS Publisher: Start > All Programs > Microsoft Office > Publisher. Setting up Document Size and Orientation
 Designing and Creating your GIS Poster Revised by Carolyn Talmadge 1/20/2015 First think about your audience and purpose then design your poster! Here are instructions for setting up your poster using
Microsoft Expression Web Quickstart Guide
 Microsoft Expression Web Quickstart Guide MS-Expression Web Quickstart Guide Page 1 of 24 Expression Web Quickstart Guide (20-Minute Training) Welcome to Expression Web. When you first launch the program,
FLIR Tools+ and Report Studio
 Creating and Processing Word Templates http://www.infraredtraining.com 09-20-2017 2017, Infrared Training Center. 1 FLIR Report Studio Overview Report Studio is a Microsoft Word Reporting module that is
The Programmer's Solution to the Import/Export Wizard
 The Programmer's Solution to the Import/Export Wizard Lora D. Delwiche, University of California, Davis, CA Susan J. Slaughter, SAS Consultant, Davis, CA Abstract Do you like what the Import/Export Wizard
Excel Select a template category in the Office.com Templates section. 5. Click the Download button.
 Microsoft QUICK Excel 2010 Source Getting Started The Excel Window u v w z Creating a New Blank Workbook 2. Select New in the left pane. 3. Select the Blank workbook template in the Available Templates
MAKING TABLES WITH WORD BASIC INSTRUCTIONS. Setting the Page Orientation. Inserting the Basic Table. Daily Schedule
 MAKING TABLES WITH WORD BASIC INSTRUCTIONS Setting the Page Orientation Once in word, decide if you want your paper to print vertically (the normal way, called portrait) or horizontally (called landscape)
I KNOW HOW TO PROGRAM IN SAS HOW DO I NAVIGATE SAS ENTERPRISE GUIDE?
 Paper HOW-068 A SAS Programmer s Guide to the SAS Enterprise Guide Marje Fecht, Prowerk Consulting LLC, Cape Coral, FL Rupinder Dhillon, Dhillon Consulting Inc., Toronto, ON, Canada ABSTRACT You have been
Table of Contents. Page 2 of 72. High Impact 4.0 User Manual
 Table of Contents Introduction 5 Installing High Impact email 6 Installation Location 6 Select Mail Client 6 Create a ReadyShare Account 6 Create a Default Profile 6 Outlook Configuration Message 6 Complete
Using Mail Merge in Microsoft Word 2003
 Using Mail Merge in Microsoft Word 2003 Mail Merge Created: 12 April 2005 Note: You should be competent in Microsoft Word before you attempt this Tutorial. Open Microsoft Word 2003 Beginning the Merge
The following instructions cover how to edit an existing report in IBM Cognos Analytics.
 IBM Cognos Analytics Edit a Report The following instructions cover how to edit an existing report in IBM Cognos Analytics. Navigate to Cognos Cognos Analytics supports all browsers with the exception
Working with Data in Microsoft Excel 2010
 Working with Data in Microsoft Excel 2010 This document provides instructions for using the sorting and filtering features in Microsoft Excel, as well as working with multiple worksheets in the same workbook
Microsoft How to Series
 Microsoft How to Series Getting Started with EXCEL 2007 A B C D E F Tabs Introduction to the Excel 2007 Interface The Excel 2007 Interface is comprised of several elements, with four main parts: Office
THE EXCEL ENVIRONMENT... 1 EDITING...
 Excel Essentials TABLE OF CONTENTS THE EXCEL ENVIRONMENT... 1 EDITING... 1 INSERTING A COLUMN... 1 DELETING A COLUMN... 1 INSERTING A ROW... DELETING A ROW... MOUSE POINTER SHAPES... USING AUTO-FILL...
Access Groups. Collect and Store. Text Currency Date/Time. Tables Fields Data Type. You Your Friend Your Parent. Unique information
 Tutorial A database is a computerized record keeping system used to collect, store, analyze and report electronic information for a variety of purposes. Microsoft Access is a database. There are three
Let s create another simple report from one of our queries available: Author Age query.
 Microsoft Access 6: Reports & Other Useful Functions This can be a very quick way to build a report, especially if you plan to put only a few fields on your report. When you click on the Blank Report button,
Adobe Dreamweaver CS5 Tutorial
 Adobe Dreamweaver CS5 Tutorial GETTING STARTED This tutorial focuses on the basic steps involved in creating an attractive, functional website. In using this tutorial you will learn to design a site layout,
Lesson 15 Working with Tables
 Working with Tables Computer Literacy BASICS: A Comprehensive Guide to IC 3, 4 th Edition 1 Objectives Create a table and insert text. Insert and delete rows and columns. Adjust column width and row height.
Lesson 15 Working with Tables
 Working with Tables Computer Literacy BASICS: A Comprehensive Guide to IC 3, 5 th Edition 1 Objectives Create a table and insert text. Insert and delete rows and columns. Adjust column width and row height.
Fusion. CBR Fusion MLS Level 1 Core Functions. Class Handout
 Fusion 1 CBR Fusion MLS Level 1 Core Functions Class Handout GETTING STARTED IN FUSION Logging On and Off To log on to Fusion MLS: 1. Type your user name in the User ID box. 2. Type your password in the
Creating Events An Event houses the details associated with the visit itself The group Date(s) of visit Menu of services
 of visit Menu of services") group booking Group Booking allows you to reserve resource time for future customer events. For convenience, it does not require that a staff, a service or a customer be reserved at the time of the initial
group booking Group Booking allows you to reserve resource time for future customer events. For convenience, it does not require that a staff, a service or a customer be reserved at the time of the initial
WORD XP/2002 USER GUIDE. Task- Formatting a Document in Word 2002
 University of Arizona Information Commons Training Page 1 of 21 WORD XP/2002 USER GUIDE Task- Formatting a Document in Word 2002 OBJECTIVES: At the end of this course students will have a basic understanding
P3e REPORT WRITER CREATING A BLANK REPORT
 P3e REPORT WRITER CREATING A BLANK REPORT 1. On the Reports window, select a report, then click Copy. 2. Click Paste. 3. Click Modify. 4. Click the New Report icon. The report will look like the following
MICROSOFT WORD 2010 Quick Reference Guide
 MICROSOFT WORD 2010 Quick Reference Guide Word Processing What is Word Processing? How is Word 2010 different from previous versions? Using a computer program, such as Microsoft Word, to create and edit
Shopping Cart: Queries, Personalizations, Filters, and Settings
 Shopping Cart: Queries, Personalizations, Filters, and Settings on the Shopping Cart Home Page Use this Job Aid to: Learn how to organize the Shopping Cart home page so that it is easier to use. BEFORE
Rev. B 12/16/2015 Downers Grove Public Library Page 1 of 40
 Objectives... 3 Introduction... 3 Excel Ribbon Components... 3 File Tab... 4 Quick Access Toolbar... 5 Excel Worksheet Components... 8 Navigating Through a Worksheet... 9 Downloading Templates... 9 Using
Switched-On Schoolhouse 2014 User Guide Resource Center & Messaging System
 Switched-On Schoolhouse 2014 User Guide Resource Center & Messaging System MMVI Alpha Omega Publications, Inc. Switched-On Schoolhouse 2014, Switched-On Schoolhouse. Switched-On, and their logos are registered
Microsoft Excel Level 2
 Microsoft Excel Level 2 Table of Contents Chapter 1 Working with Excel Templates... 5 What is a Template?... 5 I. Opening a Template... 5 II. Using a Template... 5 III. Creating a Template... 6 Chapter
Microsoft Access Illustrated. Unit B: Building and Using Queries
 Microsoft Access 2010- Illustrated Unit B: Building and Using Queries Objectives Use the Query Wizard Work with data in a query Use Query Design View Sort and find data (continued) Microsoft Office 2010-Illustrated
Section 1 Microsoft Excel Overview
 Course Topics: I. MS Excel Overview II. Review of Pasting and Editing Formulas III. Formatting Worksheets and Cells IV. Creating Templates V. Moving and Navigating Worksheets VI. Protecting Sheets VII.
Within the spreadsheet, columns are labeled with letters and rows are labeled with numbers.
 Excel Exercise 1: Goals: 1. Become familiar with Guidelines for spans and proportions of common spanning members (Chapter 1). 2. Become familiar with basic commands in Excel for performing simple tasks
Creating a Presentation
 Creating a Presentation Objectives Open and view a presentation Create a new presentation Enter and format slide text Apply a theme Add and modify clip art Add and modify shapes Create SmartArt Insert
New York City College of Technology. Microsoft Word Contact Information:
 New York City College of Technology Microsoft Word 2016 Contact Information: 718-254-8565 ITEC@citytech.cuny.edu Opening Word 2016 Begin by clicking on the bottom left corner icon on the desktop. From
Introduction to Microsoft Publisher
 Introduction to Microsoft Publisher Day One Agenda: Introduction Templates Layout Inserting and Formatting Text Inserting and Formatting Pictures Practice, Questions Day Two Agenda: Review Day One Tables
Enjoy Microsoft Excel 2007 for Novice Users Author: Christine Kent Web address Blog address address
 Enjoy Microsoft Excel 2007 for Novice Users Copyright Christine Kent, September 2008 Author: Christine Kent Web address www.christinekent.net Blog address http://christinekent.blogspot.com/ Email address
Intermediate Microsoft Excel 2010
 P a g e 1 Intermediate Microsoft Excel 2010 ABOUT THIS CLASS This class is designed to continue where the Microsoft Excel 2010 Basics class left off. Specifically, we will cover additional ways to organize
INTRODUCTION... 1 LONG DOCUMENTS V SHORT DOCUMENTS... 2 SECTION BREAKS... 2
 Word 2010 Level 2 Table of Contents INTRODUCTION... 1 LONG DOCUMENTS V SHORT DOCUMENTS... 2 SECTION BREAKS... 2 PAGE LAYOUT BREAKS... 2 Section break examples... 2 Inserting Section Breaks... 3 Deleting
KASBO Fall 2014 Session 4T Excel for Munis Accounts Payable and Purchase Orders (Lab) Presenter: Sheila Miller, KDE Business Analyst
 Presenter: Sheila Miller, KDE Business Analyst") KASBO Fall 2014 Session 4T Excel for Munis Accounts Payable and Purchase Orders (Lab) Presenter: Sheila Miller, KDE Business Analyst Session Prerequisites 1. You will be accessing Munis so make sure you
KASBO Fall 2014 Session 4T Excel for Munis Accounts Payable and Purchase Orders (Lab) Presenter: Sheila Miller, KDE Business Analyst Session Prerequisites 1. You will be accessing Munis so make sure you
Microsoft Word Part 3 Office 2013
 Microsoft Word Part 3 Office 2013 Hyperlinks When a document is sent as an electronic copy, hyperlinks can be added to direct the reader to a web page. To add a hyperlink: Highlight the word, phrase, paragraph,
How to use Movie Maker
 How to use Movie Maker -Every desktop computer in our district has Windows Movie Maker. In order to access it, visit the Start menu, scroll up to Programs and then move the cursor to the right and locate
Introduction to Microsoft Excel
 Create it Introduction to Microsoft Excel It's the beginning of the year (or you just got your new computer) and you want to create an electronic grade book to keep track of student achievement and do
HO-1: BASIC SPREADSHEET SKILLS - CREATING A WORKBOOK
 HO-1: BASIC SPREADSHEET SKILLS - CREATING A WORKBOOK After completing this exercise you will be able to: Create a new workbook and add and rename worksheets. Enter data (text labels, numerical values and
Introduction to SAS Procedures SAS Basics III. Susan J. Slaughter, Avocet Solutions
 Introduction to SAS Procedures SAS Basics III Susan J. Slaughter, Avocet Solutions SAS Essentials Section for people new to SAS Core presentations 1. How SAS Thinks 2. Introduction to DATA Step Programming