CUDA Tools for Debugging and Profiling. Jiri Kraus (NVIDIA)
|
|
|
- Hugh Lee
- 6 years ago
- Views:
Transcription
 GPU Programming with CUDA@Jülich Supercomputing Centre Jülich 25-27 April")
1 Mitglied der Helmholtz-Gemeinschaft CUDA Tools for Debugging and Profiling Jiri Kraus (NVIDIA) GPU Programming with Supercomputing Centre Jülich April 2016
2 What you will learn How to use cuda-memcheck to detect invalid memory accesses How to use Nsight EE to debug a CUDA Program How to use the NVIDIA visual profiler
 memcheck: Memory access checking racecheck: Shared memory hazard checking Compile with debugg information")
3 cuda-memcheck cuda-memcheck is a memory correctness tool similar to valgrind memcheck cuda-memcheck provided to tools (select via tool) memcheck: Memory access checking racecheck: Shared memory hazard checking Compile with debugg information (-g -G)
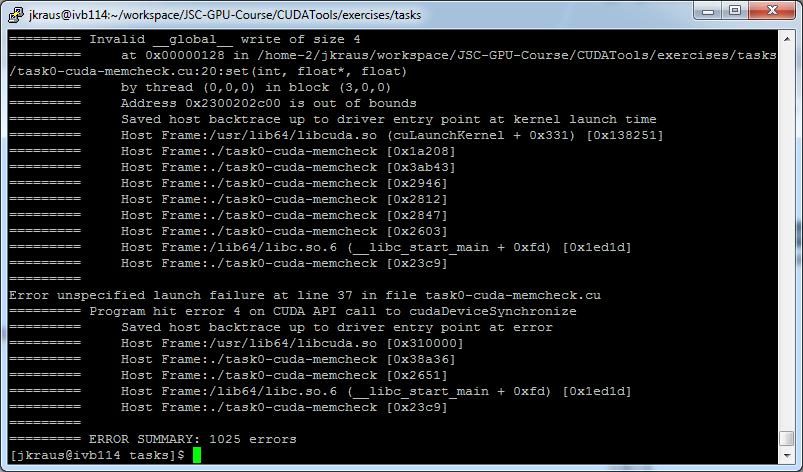
4 cuda-memcheck
5 Nsight Eclipse Edition Nsight Eclipse Edition is an IDE for CUDA development Source Editor with CUDA C and C++ syntax highlighting Project and files management with version control integration Integrated build system GUI for debugging heterogeneous applications Visual profiler integration Nsight EE is part of the CUDA Toolkit
6 Using Nsight EE to debug a CUDA Program Start Nsight EE nsight

7 Using Nsight EE to debug a CUDA Program

8 Using Nsight EE to debug a CUDA Program

9 Using Nsight EE to debug a CUDA Program
10 Using Nsight EE to debug a CUDA Program

11 Using Nsight EE to debug a CUDA Program

12 Using Nsight EE to debug a CUDA Program

13 Using Nsight EE to debug a CUDA Program

14 Using Nsight EE to debug a CUDA Program
15 Taks 0: Use cuda-memcheck to identify error Go to CUDATools/exercises/tasks Build Task 0 make task0-cuda-memcheck Run cuda-memcheck cuda-memcheck./task0-cuda-memcheck Identify and fix the error (cuda-memcheck should run with out errors) task0-cuda-memcheck.cu
16 Taks 1: Use Nsight EE to debug a program Go to CUDATools/exercises/tasks Build Task 1 make task1-cuda-gdb Start Nsight EE nsight Setup a debug session in Nsight EE Use the variable view to let thread 4 from block 1 print 4 (instead of 0) Do not modify the source code
17 Why Performance Measurement Tools? You can only improve what you measure Need to identify: Hotspots: Which function takes most of the run time? Bottlenecks: What limits the performance of the Hotspots? Manual timing is tedious and error prone Possible for small application like jacobi and matrix multiplication Impractical for larger/more complex application Access to hardware counters (PAPI, CUPTI)
18 The command line profiler nvprof Simple launcher to get profiles of your application Profiles CUDA Kernels and API calls > nvprof --unified-memory-profiling per-process-device./scale_vector_um ==32717== NVPROF is profiling process 32717, command:./scale_vector_um ==32717== Warning: Unified Memory Profiling is not supported on the current configuration because a pair of devices without peer-to-peer support is detected on this multi-gpu setup. When peer mappings are not available, system falls back to using zero-copy memory. It can cause kernels, which access unified memory, to run slower. More details can be found at: Passed! ==32717== Profiling application:./scale_vector_um ==32717== Profiling result: Time(%) Time Calls Avg Min Max % us us us us [ ] snip Name scale(float, float*, float*, int)
19 Unified Memory Excursus: Zero-copy Fall back CPU0 $ nvidia-smi topo -m GPU0 GPU1 GPU0 X PIX GPU1 PIX X GPU2 GPU3 mlx5_0 PHB PHB GPU2 X PIX GPU3 PIX X mlx5_0 PHB PHB X CPU Affinity 0-11, , , ,36-47 Legend: X PHB PXB PIX = = = = = Self Path Path Path Path traverses traverses traverses traverses a socket-level link (e.g. QPI) a PCIe host bridge multiple PCIe internal switches a PCIe internal switch GPU3 GPUDirect P2P GPU2 GPU1 GPU0 GPUDirect P2P CPU1
20 CUDA_MANAGED_FORCE_DEVICE_ALLOC > CUDA_MANAGED_FORCE_DEVICE_ALLOC=1 nvprof --unified-memory-profiling per-process-device./scale_vector_um ==491== NVPROF is profiling process 491, command:./scale_vector_um Passed! ==491== Profiling application:./scale_vector_um ==491== Profiling result: Time(%) Time Calls Avg Min Max % us us us us Name scale(float, float*, float*, int) ==491== Unified Memory profiling result: Device "Tesla K80 (0)" Count Avg Size Min Size Max Size Total Size Total Time Name KB KB KB KB us Host To Device KB KB KB KB us Device To Host ==491== API calls: Time(%) Time Calls Avg Min Max 98.87% ms ms us ms Name cudamallocmanaged With Fallback: [ ] Zero-copy snip % us us us us scale(float, float*, float*, int)


21 nvprof interoperability with nvvp nvprof can write the application timeline to nvvp compatible file: nvprof --unified-memory-profiling per-process-device -o scale_vector.nvprof./scale_vector_um Import in nvvp
22 nvprof important command-line options Options: -o, --export-profile <filename> Export the result file which can be imported later or opened by the NVIDIA Visual Profiler. "%p" in the file name string is replaced with the process ID of the application being profiled. "%q{<env>}" in the file name string is replaced with the value of the environment variable "<ENV>". If the environment variable is not set it's an error. "%h" in the file name string is replaced with the hostname of the system. "%%" in the file name string is replaced with "%". Any other character following "%" is illegal. By default, this option disables the summary output. Note: If the application being profiled creates child processes, or if '--profile-all-processes' is used, the "%p" format is needed to get correct export files for each process. --analysis-metrics Collect profiling data that can be imported to Visual Profiler's "analysis" mode. Note: Use "--export-profile" to specify an export file. -h, --unified-memory-profiling <per-process-device off> Options for unified memory profiling. Allowed values: per-process-device - collect counts for each process and each device off - turn off unified memory profiling (default) --help Print this help information.

23 nvvp introduction

24 Task 2: Analyze scale_vector Start scale_vector with nvprof and write timeline to file Import profile into nvvp Create profile with --analysis-metrics and run the guided analysis
25 Cheat Sheet Generate timeline with nvprof nvprof --unified-memory-profiling per-process-device -o <output-profile>./a.out Collect analysis metrics nvprof nvprof --unified-memory-profiling per-process-device --analysis-metrics -o <output-profile>./a.out Start nvvp nvvp profiler users guide
CUDA Tools for Debugging and Profiling
 CUDA Tools for Debugging and Profiling CUDA Course, Jülich Supercomputing Centre Andreas Herten, Forschungszentrum Jülich, 3 August 2016 Overview What you will learn in this session Use cuda-memcheck to
Using JURECA's GPU Nodes
 Mitglied der Helmholtz-Gemeinschaft Using JURECA's GPU Nodes Willi Homberg Supercomputing Centre Jülich (JSC) Introduction to the usage and programming of supercomputer resources in Jülich 23-24 May 2016
CUDA Development Using NVIDIA Nsight, Eclipse Edition. David Goodwin
 CUDA Development Using NVIDIA Nsight, Eclipse Edition David Goodwin NVIDIA Nsight Eclipse Edition CUDA Integrated Development Environment Project Management Edit Build Debug Profile SC'12 2 Powered By
S WHAT THE PROFILER IS TELLING YOU OPTIMIZING WHOLE APPLICATION PERFORMANCE. Mathias Wagner, Jakob Progsch GTC 2017
 S7445 - WHAT THE PROFILER IS TELLING YOU OPTIMIZING WHOLE APPLICATION PERFORMANCE Mathias Wagner, Jakob Progsch GTC 2017 BEFORE YOU START The five steps to enlightenment 1. Know your application What does
April 4-7, 2016 Silicon Valley. CUDA DEBUGGING TOOLS IN CUDA8 Vyas Venkataraman, Kudbudeen Jalaludeen, April 6, 2016
 April 4-7, 2016 Silicon Valley CUDA DEBUGGING TOOLS IN CUDA8 Vyas Venkataraman, Kudbudeen Jalaludeen, April 6, 2016 AGENDA General debugging approaches Cuda-gdb Demo 2 CUDA API CHECKING CUDA calls are
NEW DEVELOPER TOOLS FEATURES IN CUDA 8.0. Sanjiv Satoor
 NEW DEVELOPER TOOLS FEATURES IN CUDA 8.0 Sanjiv Satoor CUDA TOOLS 2 NVIDIA NSIGHT Homogeneous application development for CPU+GPU compute platforms CUDA-Aware Editor CUDA Debugger CPU+GPU CUDA Profiler
Profiling GPU Code. Jeremy Appleyard, February 2016
 Profiling GPU Code Jeremy Appleyard, February 2016 What is Profiling? Measuring Performance Measuring application performance Usually the aim is to reduce runtime Simple profiling: How long does an operation
S WHAT THE PROFILER IS TELLING YOU: OPTIMIZING GPU KERNELS. Jakob Progsch, Mathias Wagner GTC 2018
 S8630 - WHAT THE PROFILER IS TELLING YOU: OPTIMIZING GPU KERNELS Jakob Progsch, Mathias Wagner GTC 2018 1. Know your hardware BEFORE YOU START What are the target machines, how many nodes? Machine-specific
NSIGHT ECLIPSE EDITION
 NSIGHT ECLIPSE EDITION DG-06450-001 _v5.0 October 2012 Getting Started Guide TABLE OF CONTENTS Chapter 1. Introduction...1 1.1 About...1 Chapter 2. Using... 2 2.1 Installing... 2 2.1.1 Installing CUDA
NSIGHT ECLIPSE EDITION
 NSIGHT ECLIPSE EDITION DG-06450-001 _v8.0 September 2016 Getting Started Guide TABLE OF CONTENTS Chapter 1. Introduction...1 1.1. About...1 Chapter 2. New and Noteworthy... 2 2.1. New in 7.5... 2 2.2.
CME 213 S PRING Eric Darve
 CME 213 S PRING 2017 Eric Darve Review Secret behind GPU performance: simple cores but a large number of them; even more threads can exist live on the hardware (10k 20k threads live). Important performance
NSIGHT ECLIPSE EDITION
 NSIGHT ECLIPSE EDITION DG-06450-001 _v7.0 March 2015 Getting Started Guide TABLE OF CONTENTS Chapter 1. Introduction...1 1.1. About...1 Chapter 2. New and Noteworthy... 2 2.1. New in 7.0... 2 2.2. New
CUDA Basics. July 6, 2016
 Mitglied der Helmholtz-Gemeinschaft CUDA Basics July 6, 2016 CUDA Kernels Parallel portion of application: execute as a kernel Entire GPU executes kernel, many threads CUDA threads: Lightweight Fast switching
April 4-7, 2016 Silicon Valley
 April 4-7, 2016 Silicon Valley TEGRA PLATFORMS GAMING DRONES ROBOTICS IVA AUTOMOTIVE 2 Compile Debug Profile Trace C/C++ NVTX NVIDIA Tools extension Getting Started CodeWorks JetPack Installers IDE Integration
OpenACC Course. Office Hour #2 Q&A
 OpenACC Course Office Hour #2 Q&A Q1: How many threads does each GPU core have? A: GPU cores execute arithmetic instructions. Each core can execute one single precision floating point instruction per cycle
Unified Memory. Notes on GPU Data Transfers. Andreas Herten, Forschungszentrum Jülich, 24 April Member of the Helmholtz Association
 Unified Memory Notes on GPU Data Transfers Andreas Herten, Forschungszentrum Jülich, 24 April 2017 Handout Version Overview, Outline Overview Unified Memory enables easy access to GPU development But some
NEW FEATURES IN CUDA 6 MAKE GPU ACCELERATION EASIER MARK HARRIS
 NEW FEATURES IN CUDA 6 MAKE GPU ACCELERATION EASIER MARK HARRIS 1 Unified Memory CUDA 6 2 3 XT and Drop-in Libraries GPUDirect RDMA in MPI 4 Developer Tools 1 Unified Memory CUDA 6 2 3 XT and Drop-in Libraries
CUDA Update: Present & Future. Mark Ebersole, NVIDIA CUDA Educator
 CUDA Update: Present & Future Mark Ebersole, NVIDIA CUDA Educator Recent CUDA News Kepler K20 & K20X Kepler GPU Architecture: Streaming Multiprocessor (SMX) 192 SP CUDA Cores per SMX 64 DP CUDA Cores per
Hands-on CUDA Optimization. CUDA Workshop
 Hands-on CUDA Optimization CUDA Workshop Exercise Today we have a progressive exercise The exercise is broken into 5 steps If you get lost you can always catch up by grabbing the corresponding directory
CUDA Performance Optimization
 Mitglied der Helmholtz-Gemeinschaft CUDA Performance Optimization GPU Programming with CUDA April 25-27, 2016 Jiri Kraus (NVIDIA) based on work by Andrew V. Adinetz What you will learn: What is memory
Tesla GPU Computing A Revolution in High Performance Computing
 Tesla GPU Computing A Revolution in High Performance Computing Gernot Ziegler, Developer Technology (Compute) (Material by Thomas Bradley) Agenda Tesla GPU Computing CUDA Fermi What is GPU Computing? Introduction
Mitglied der Helmholtz-Gemeinschaft. Eclipse Parallel Tools Platform (PTP)
") Mitglied der Helmholtz-Gemeinschaft Eclipse Parallel Tools Platform (PTP) April 25, 2013 Carsten Karbach Content 1 Parallel Tools Platform (PTP) 2 Eclipse Plug-In Development April 25, 2013 Carsten Karbach
Mitglied der Helmholtz-Gemeinschaft Eclipse Parallel Tools Platform (PTP) April 25, 2013 Carsten Karbach Content 1 Parallel Tools Platform (PTP) 2 Eclipse Plug-In Development April 25, 2013 Carsten Karbach
CSE 599 I Accelerated Computing Programming GPUS. Intro to CUDA C
 CSE 599 I Accelerated Computing Programming GPUS Intro to CUDA C GPU Teaching Kit Accelerated Computing Lecture 2.1 - Introduction to CUDA C CUDA C vs. Thrust vs. CUDA Libraries Objective To learn the
MULTI-GPU PROGRAMMING MODELS. Jiri Kraus, Senior Devtech Compute Sreeram Potluri, Senior CUDA Software Engineer
 MULTI-GPU PROGRAMMING MODELS Jiri Kraus, Senior Devtech Compute Sreeram Potluri, Senior CUDA Software Engineer MOTIVATION Why use multiple GPUs? Need to compute larger, e.g. bigger networks, car models,
n N c CIni.o ewsrg.au
 @NCInews NCI and Raijin National Computational Infrastructure 2 Our Partners General purpose, highly parallel processors High FLOPs/watt and FLOPs/$ Unit of execution Kernel Separate memory subsystem GPGPU
Future Directions for CUDA Presented by Robert Strzodka
 Future Directions for CUDA Presented by Robert Strzodka Authored by Mark Harris NVIDIA Corporation Platform for Parallel Computing Platform The CUDA Platform is a foundation that supports a diverse parallel
Introduction to CUDA C/C++ Mark Ebersole, NVIDIA CUDA Educator
 Introduction to CUDA C/C++ Mark Ebersole, NVIDIA CUDA Educator What is CUDA? Programming language? Compiler? Classic car? Beer? Coffee? CUDA Parallel Computing Platform www.nvidia.com/getcuda Programming
High-Productivity CUDA Programming. Cliff Woolley, Sr. Developer Technology Engineer, NVIDIA
 High-Productivity CUDA Programming Cliff Woolley, Sr. Developer Technology Engineer, NVIDIA HIGH-PRODUCTIVITY PROGRAMMING High-Productivity Programming What does this mean? What s the goal? Do Less Work
Debugging Your CUDA Applications With CUDA-GDB
 Debugging Your CUDA Applications With CUDA-GDB Outline Introduction Installation & Usage Program Execution Control Thread Focus Program State Inspection Run-Time Error Detection Tips & Miscellaneous Notes
Scalable Cluster Computing with NVIDIA GPUs Axel Koehler NVIDIA. NVIDIA Corporation 2012
 Scalable Cluster Computing with NVIDIA GPUs Axel Koehler NVIDIA Outline Introduction to Multi-GPU Programming Communication for Single Host, Multiple GPUs Communication for Multiple Hosts, Multiple GPUs
PROFILER USER'S GUIDE. DU _v7.5 September 2015
 PROFILER USER'S GUIDE DU-05982-001_v7.5 September 2015 TABLE OF CONTENTS Profiling Overview... vi What's New... vi Terminology... vi Chapter 1. Preparing An Application For Profiling... 1 1.1. Focused
Enabling the Next Generation of Computational Graphics with NVIDIA Nsight Visual Studio Edition. Jeff Kiel Director, Graphics Developer Tools
 Enabling the Next Generation of Computational Graphics with NVIDIA Nsight Visual Studio Edition Jeff Kiel Director, Graphics Developer Tools Computational Graphics Enabled Problem: Complexity of Computation
S CUDA on Xavier
 S8868 - CUDA on Xavier Anshuman Bhat CUDA Product Manager Saikat Dasadhikari CUDA Engineering 29 th March 2018 1 CUDA ECOSYSTEM 2018 CUDA DOWNLOADS IN 2017 3,500,000 CUDA REGISTERED DEVELOPERS 800,000
CUDA 5 and Beyond. Mark Ebersole. Original Slides: Mark Harris 2012 NVIDIA
 CUDA 5 and Beyond Mark Ebersole Original Slides: Mark Harris The Soul of CUDA The Platform for High Performance Parallel Computing Accessible High Performance Enable Computing Ecosystem Introducing CUDA
MPI + X programming. UTK resources: Rho Cluster with GPGPU George Bosilca CS462
 MPI + X programming UTK resources: Rho Cluster with GPGPU https://newton.utk.edu/doc/documentation/systems/rhocluster George Bosilca CS462 MPI Each programming paradigm only covers a particular spectrum
PROFILER USER'S GUIDE. DU _v9.1 December 2017
 PROFILER USER'S GUIDE DU-05982-001_v9.1 December 2017 TABLE OF CONTENTS Profiling Overview... iv What's New... iv Terminology... iv Chapter 1. Preparing An Application For Profiling... 1 1.1. Focused Profiling...1
Profiling and Parallelizing with the OpenACC Toolkit OpenACC Course: Lecture 2 October 15, 2015
 Profiling and Parallelizing with the OpenACC Toolkit OpenACC Course: Lecture 2 October 15, 2015 Oct 1: Introduction to OpenACC Oct 6: Office Hours Oct 15: Profiling and Parallelizing with the OpenACC Toolkit
PERFORMANCE ANALYSIS AND DEBUGGING FOR VOLTA. Felix Schmitt 11 th Parallel Tools Workshop September 11-12, 2017
 PERFORMANCE ANALYSIS AND DEBUGGING FOR VOLTA Felix Schmitt 11 th Parallel Tools Workshop September 11-12, 2017 INTRODUCING TESLA V100 Volta Architecture Improved NVLink & HBM2 Volta MPS Improved SIMT Model
Vectorisation and Portable Programming using OpenCL
 Vectorisation and Portable Programming using OpenCL Mitglied der Helmholtz-Gemeinschaft Jülich Supercomputing Centre (JSC) Andreas Beckmann, Ilya Zhukov, Willi Homberg, JSC Wolfram Schenck, FH Bielefeld
Profiling & Tuning Applications. CUDA Course István Reguly
 Profiling & Tuning Applications CUDA Course István Reguly Introduction Why is my application running slow? Work it out on paper Instrument code Profile it NVIDIA Visual Profiler Works with CUDA, needs
GPU Programming. Rupesh Nasre.
 GPU Programming Rupesh Nasre. http://www.cse.iitm.ac.in/~rupesh IIT Madras July 2017 Debugging Debugging parallel programs is difficult. Non-determinism due to thread-scheduling Output can be different
High-Productivity CUDA Programming. Levi Barnes, Developer Technology Engineer, NVIDIA
 High-Productivity CUDA Programming Levi Barnes, Developer Technology Engineer, NVIDIA MORE RESOURCES How to learn more GTC -- March 2014 San Jose, CA gputechconf.com Video archives, too Qwiklabs nvlabs.qwiklabs.com
CUDA Lecture 2. Manfred Liebmann. Technische Universität München Chair of Optimal Control Center for Mathematical Sciences, M17
 CUDA Lecture 2 Manfred Liebmann Technische Universität München Chair of Optimal Control Center for Mathematical Sciences, M17 manfred.liebmann@tum.de December 15, 2015 CUDA Programming Fundamentals CUDA
CUDA 7.5 OVERVIEW WEBINAR 7/23/15
 CUDA 7.5 OVERVIEW WEBINAR 7/23/15 CUDA 7.5 https://developer.nvidia.com/cuda-toolkit 16-bit Floating-Point Storage 2x larger datasets in GPU memory Great for Deep Learning cusparse Dense Matrix * Sparse
NVIDIA CUDA TOOLKIT
 NVIDIA CUDA TOOLKIT 9.1.246 RN-06722-001 _v9.1 April 2018 Release Notes for Windows, Linux, and Mac OS TABLE OF CONTENTS Errata... iv New Features... iv Resolved Issues... v Known Issues...v Chapter 1.
NVIDIA Nsight Visual Studio Edition 4.0 A Fast-Forward of All the Greatness of the Latest Edition. Sébastien Dominé, NVIDIA
 NVIDIA Nsight Visual Studio Edition 4.0 A Fast-Forward of All the Greatness of the Latest Edition Sébastien Dominé, NVIDIA AGENDA Introduction What s new with 4.0? Graphics Redefined DirectX 9 and 11.1
MODELING CUDA COMPUTE APPLICATIONS BY CRITICAL PATH. PATRIC ZHAO, JIRI KRAUS, SKY WU
 MODELING CUDA COMPUTE APPLICATIONS BY CRITICAL PATH PATRIC ZHAO, JIRI KRAUS, SKY WU patricz@nvidia.com AGENDA Background Collect data and Visualizations Critical Path Performance analysis and prediction
PROFILER. DU _v5.0 October User's Guide
 PROFILER DU-05982-001_v5.0 October 2012 User's Guide TABLE OF CONTENTS Profiling Overview...v What's New...v Chapter 1. Preparing An Application For Profiling... 1 1.1 Focused Profiling... 1 1.2 Marking
Profiling of Data-Parallel Processors
 Profiling of Data-Parallel Processors Daniel Kruck 09/02/2014 09/02/2014 Profiling Daniel Kruck 1 / 41 Outline 1 Motivation 2 Background - GPUs 3 Profiler NVIDIA Tools Lynx 4 Optimizations 5 Conclusion
GPU Computing Master Clss. Development Tools
 GPU Computing Master Clss Development Tools Generic CUDA debugger goals Support all standard debuggers across all OS Linux GDB, TotalView and DDD Windows Visual studio Mac - XCode Support CUDA runtime
Performance Analysis of Parallel Scientific Applications In Eclipse
 Performance Analysis of Parallel Scientific Applications In Eclipse EclipseCon 2015 Wyatt Spear, University of Oregon wspear@cs.uoregon.edu Supercomputing Big systems solving big problems Performance gains
Accelerator programming with OpenACC
 ..... Accelerator programming with OpenACC Colaboratorio Nacional de Computación Avanzada Jorge Castro jcastro@cenat.ac.cr 2018. Agenda 1 Introduction 2 OpenACC life cycle 3 Hands on session Profiling
TESLA DRIVER VERSION (LINUX)/411.82(WINDOWS)
/411.82(WINDOWS)") TESLA DRIVER VERSION 410.72(LINUX)/411.82(WINDOWS) RN-08625-410.72_411.82 _v01 October 2018 Release Notes TABLE OF CONTENTS Chapter 1. Version Highlights...1 1.1. New Features...1 1.2. Improvements...
TESLA DRIVER VERSION 410.72(LINUX)/411.82(WINDOWS) RN-08625-410.72_411.82 _v01 October 2018 Release Notes TABLE OF CONTENTS Chapter 1. Version Highlights...1 1.1. New Features...1 1.2. Improvements...
CSE 591: GPU Programming. Programmer Interface. Klaus Mueller. Computer Science Department Stony Brook University
 CSE 591: GPU Programming Programmer Interface Klaus Mueller Computer Science Department Stony Brook University Compute Levels Encodes the hardware capability of a GPU card newer cards have higher compute
CUDA OPTIMIZATION WITH NVIDIA NSIGHT ECLIPSE EDITION
 CUDA OPTIMIZATION WITH NVIDIA NSIGHT ECLIPSE EDITION WHAT YOU WILL LEARN An iterative method to optimize your GPU code Some common bottlenecks to look out for Performance diagnostics with NVIDIA Nsight
Best Practices for Deploying and Managing GPU Clusters
 Best Practices for Deploying and Managing GPU Clusters Dale Southard, NVIDIA dsouthard@nvidia.com About the Speaker and You [Dale] is a senior solution architect with NVIDIA (I fix things). I primarily
Overview. Lecture 1: an introduction to CUDA. Hardware view. Hardware view. hardware view software view CUDA programming
 Overview Lecture 1: an introduction to CUDA Mike Giles mike.giles@maths.ox.ac.uk hardware view software view Oxford University Mathematical Institute Oxford e-research Centre Lecture 1 p. 1 Lecture 1 p.
NVIDIA CUDA TOOLKIT V6.0
 NVIDIA CUDA TOOLKIT V6.0 RN-06722-001 _v6.0 February 2014 Release Notes for Windows, Linux, and Mac OS TABLE OF CONTENTS Errata... iii CUDA 6.0 Release Candidate... iii Chapter 1. CUDA Toolkit Major Components...
CUDA OPTIMIZATIONS ISC 2011 Tutorial
 CUDA OPTIMIZATIONS ISC 2011 Tutorial Tim C. Schroeder, NVIDIA Corporation Outline Kernel optimizations Launch configuration Global memory throughput Shared memory access Instruction throughput / control
Fundamental CUDA Optimization. NVIDIA Corporation
 Fundamental CUDA Optimization NVIDIA Corporation Outline! Fermi Architecture! Kernel optimizations! Launch configuration! Global memory throughput! Shared memory access! Instruction throughput / control
NVIDIA Parallel Nsight. Jeff Kiel
 NVIDIA Parallel Nsight Jeff Kiel Agenda: NVIDIA Parallel Nsight Programmable GPU Development Presenting Parallel Nsight Demo Questions/Feedback Programmable GPU Development More programmability = more
Critically Missing Pieces on Accelerators: A Performance Tools Perspective
 Critically Missing Pieces on Accelerators: A Performance Tools Perspective, Karthik Murthy, Mike Fagan, and John Mellor-Crummey Rice University SC 2013 Denver, CO November 20, 2013 What Is Missing in GPUs?
Developing, Debugging, and Optimizing GPU Codes for High Performance Computing with Allinea Forge
 Developing, Debugging, and Optimizing GPU Codes for High Performance Computing with Allinea Forge Ryan Hulguin Applications Engineer ryan.hulguin@arm.com Agenda Introduction Overview of Allinea Products
Tesla GPU Computing A Revolution in High Performance Computing
 Tesla GPU Computing A Revolution in High Performance Computing Mark Harris, NVIDIA Agenda Tesla GPU Computing CUDA Fermi What is GPU Computing? Introduction to Tesla CUDA Architecture Programming & Memory
Lecture 1: an introduction to CUDA
 Lecture 1: an introduction to CUDA Mike Giles mike.giles@maths.ox.ac.uk Oxford University Mathematical Institute Oxford e-research Centre Lecture 1 p. 1 Overview hardware view software view CUDA programming
Towards Automatic Heterogeneous Computing Performance Analysis. Carl Pearson Adviser: Wen-Mei Hwu
 Towards Automatic Heterogeneous Computing Performance Analysis Carl Pearson pearson@illinois.edu Adviser: Wen-Mei Hwu 2018 03 30 1 Outline High Performance Computing Challenges Vision CUDA Allocation and
NVIDIA Application Lab at Jülich
 Mitglied der Helmholtz- Gemeinschaft NVIDIA Application Lab at Jülich Dirk Pleiter Jülich Supercomputing Centre (JSC) Forschungszentrum Jülich at a Glance (status 2010) Budget: 450 mio Euro Staff: 4,800
Parallel Computing. November 20, W.Homberg
 Mitglied der Helmholtz-Gemeinschaft Parallel Computing November 20, 2017 W.Homberg Why go parallel? Problem too large for single node Job requires more memory Shorter time to solution essential Better
CUDA OPTIMIZATION WITH NVIDIA NSIGHT VISUAL STUDIO EDITION
 April 4-7, 2016 Silicon Valley CUDA OPTIMIZATION WITH NVIDIA NSIGHT VISUAL STUDIO EDITION CHRISTOPH ANGERER, NVIDIA JAKOB PROGSCH, NVIDIA 1 WHAT YOU WILL LEARN An iterative method to optimize your GPU
MULTI GPU PROGRAMMING WITH MPI AND OPENACC JIRI KRAUS, NVIDIA
 MULTI GPU PROGRAMMING WITH MPI AND OPENACC JIRI KRAUS, NVIDIA MPI+OPENACC GDDR5 Memory System Memory GDDR5 Memory System Memory GDDR5 Memory System Memory GPU CPU GPU CPU GPU CPU PCI-e PCI-e PCI-e Network
DEEP DIVE INTO DYNAMIC PARALLELISM
 April 4-7, 2016 Silicon Valley DEEP DIVE INTO DYNAMIC PARALLELISM SHANKARA RAO THEJASWI NANDITALE, NVIDIA CHRISTOPH ANGERER, NVIDIA 1 OVERVIEW AND INTRODUCTION 2 WHAT IS DYNAMIC PARALLELISM? The ability
CUDA Workshop. High Performance GPU computing EXEBIT Karthikeyan
 CUDA Workshop High Performance GPU computing EXEBIT- 2014 Karthikeyan CPU vs GPU CPU Very fast, serial, Low Latency GPU Slow, massively parallel, High Throughput Play Demonstration Compute Unified Device
NVIDIA CUDA TOOLKIT
 NVIDIA CUDA TOOLKIT 9.0.176 RN-06722-001 _v9.0 September 2017 Release Notes for Windows, Linux, and Mac OS TABLE OF CONTENTS Errata... iii New Features... iii Unsupported Features...iii Resolved Issues...
INTRODUCTION TO OPENACC. Analyzing and Parallelizing with OpenACC, Feb 22, 2017
 INTRODUCTION TO OPENACC Analyzing and Parallelizing with OpenACC, Feb 22, 2017 Objective: Enable you to to accelerate your applications with OpenACC. 2 Today s Objectives Understand what OpenACC is and
Tesla Architecture, CUDA and Optimization Strategies
 Tesla Architecture, CUDA and Optimization Strategies Lan Shi, Li Yi & Liyuan Zhang Hauptseminar: Multicore Architectures and Programming Page 1 Outline Tesla Architecture & CUDA CUDA Programming Optimization
LECTURE ON PASCAL GPU ARCHITECTURE. Jiri Kraus, November 14 th 2016
 LECTURE ON PASCAL GPU ARCHITECTURE Jiri Kraus, November 14 th 2016 ACCELERATED COMPUTING CPU Optimized for Serial Tasks GPU Accelerator Optimized for Parallel Tasks 2 ACCELERATED COMPUTING CPU Optimized
CUDA Optimization with NVIDIA Nsight Visual Studio Edition 3.0. Julien Demouth, NVIDIA
 CUDA Optimization with NVIDIA Nsight Visual Studio Edition 3.0 Julien Demouth, NVIDIA What Will You Learn? An iterative method to optimize your GPU code A way to conduct that method with Nsight VSE APOD
Accelerating Data Centers Using NVMe and CUDA
 Accelerating Data Centers Using NVMe and CUDA Stephen Bates, PhD Technical Director, CSTO, PMC-Sierra Santa Clara, CA 1 Project Donard @ PMC-Sierra Donard is a PMC CTO project that leverages NVM Express
PERFORMANCE OPTIMIZATIONS FOR AUTOMOTIVE SOFTWARE
 April 4-7, 2016 Silicon Valley PERFORMANCE OPTIMIZATIONS FOR AUTOMOTIVE SOFTWARE Pradeep Chandrahasshenoy, Automotive Solutions Architect, NVIDIA Stefan Schoenefeld, ProViz DevTech, NVIDIA 4 th April 2016
PERFWORKS A LIBRARY FOR GPU PERFORMANCE ANALYSIS
 April 4-7, 2016 Silicon Valley PERFWORKS A LIBRARY FOR GPU PERFORMANCE ANALYSIS Avinash Baliga, NVIDIA Developer Tools Software Architect April 5, 2016 @ 3:00 p.m. Room 211B NVIDIA PerfWorks SDK New API
An Evaluation of Unified Memory Technology on NVIDIA GPUs
 An Evaluation of Unified Memory Technology on NVIDIA GPUs Wenqiang Li 1, Guanghao Jin 2, Xuewen Cui 1, Simon See 1,3 Center for High Performance Computing, Shanghai Jiao Tong University, China 1 Tokyo
INTRODUCTION TO GPU COMPUTING IN AALTO. Topi Siro
 INTRODUCTION TO GPU COMPUTING IN AALTO Topi Siro 11.6.2014 PART I Introduction to GPUs Basics of CUDA (and OpenACC) Running GPU jobs on Triton Hands-on 1 PART II Optimizing CUDA codes Libraries Hands-on
ME964 High Performance Computing for Engineering Applications
 ME964 High Performance Computing for Engineering Applications Debugging & Profiling CUDA Programs February 28, 2012 Dan Negrut, 2012 ME964 UW-Madison Everyone knows that debugging is twice as hard as writing
GPU Performance Nuggets
 GPU Performance Nuggets Simon Garcia de Gonzalo & Carl Pearson PhD Students, IMPACT Research Group Advised by Professor Wen-mei Hwu Jun. 15, 2016 grcdgnz2@illinois.edu pearson@illinois.edu GPU Performance
Efficient CPU GPU data transfers CUDA 6.0 Unified Virtual Memory
 Institute of Computational Science Efficient CPU GPU data transfers CUDA 6.0 Unified Virtual Memory Juraj Kardoš (University of Lugano) July 9, 2014 Juraj Kardoš Efficient GPU data transfers July 9, 2014
Enterprise. Breadth-First Graph Traversal on GPUs. November 19th, 2015
 Enterprise Breadth-First Graph Traversal on GPUs Hang Liu H. Howie Huang November 9th, 5 Graph is Ubiquitous Breadth-First Search (BFS) is Important Wide Range of Applications Single Source Shortest Path
Turing Architecture and CUDA 10 New Features. Minseok Lee, Developer Technology Engineer, NVIDIA
 Turing Architecture and CUDA 10 New Features Minseok Lee, Developer Technology Engineer, NVIDIA Turing Architecture New SM Architecture Multi-Precision Tensor Core RT Core Turing MPS Inference Accelerated,
CUDA OPTIMIZATION WITH NVIDIA NSIGHT ECLIPSE EDITION. Julien Demouth, NVIDIA Cliff Woolley, NVIDIA
 CUDA OPTIMIZATION WITH NVIDIA NSIGHT ECLIPSE EDITION Julien Demouth, NVIDIA Cliff Woolley, NVIDIA WHAT WILL YOU LEARN? An iterative method to optimize your GPU code A way to conduct that method with NVIDIA
Parallel Programming and Debugging with CUDA C. Geoff Gerfin Sr. System Software Engineer
 Parallel Programming and Debugging with CUDA C Geoff Gerfin Sr. System Software Engineer CUDA - NVIDIA s Architecture for GPU Computing Broad Adoption Over 250M installed CUDA-enabled GPUs GPU Computing
Getting Started with CUDA C/C++ Mark Ebersole, NVIDIA CUDA Educator
 Getting Started with CUDA C/C++ Mark Ebersole, NVIDIA CUDA Educator Heterogeneous Computing CPU GPU Once upon a time Past Massively Parallel Supercomputers Goodyear MPP Thinking Machine MasPar Cray 2 1.31
CUDA-MEMCHECK. DU _v03 February 17, User Manual
 CUDA-MEMCHECK DU-05355-001_v03 February 17, 2011 User Manual TABLE OF CONTENTS 1 Introduction... 1 About cuda-memcheck... 1 Why cuda-memcheck... 1 Supported error detection... 1 Installation and cross-platform
Advanced CUDA Optimization 1. Introduction
 Advanced CUDA Optimization 1. Introduction Thomas Bradley Agenda CUDA Review Review of CUDA Architecture Programming & Memory Models Programming Environment Execution Performance Optimization Guidelines
Paralization on GPU using CUDA An Introduction
 Paralization on GPU using CUDA An Introduction Ehsan Nedaaee Oskoee 1 1 Department of Physics IASBS IPM Grid and HPC workshop IV, 2011 Outline 1 Introduction to GPU 2 Introduction to CUDA Graphics Processing
Operational Robustness of Accelerator Aware MPI
 Operational Robustness of Accelerator Aware MPI Sadaf Alam Swiss National Supercomputing Centre (CSSC) Switzerland 2nd Annual MVAPICH User Group (MUG) Meeting, 2014 Computing Systems @ CSCS http://www.cscs.ch/computers
Overview of Performance Prediction Tools for Better Development and Tuning Support
 Overview of Performance Prediction Tools for Better Development and Tuning Support Universidade Federal Fluminense Rommel Anatoli Quintanilla Cruz / Master's Student Esteban Clua / Associate Professor
WHAT S NEW IN CUDA 8. Siddharth Sharma, Oct 2016
 WHAT S NEW IN CUDA 8 Siddharth Sharma, Oct 2016 WHAT S NEW IN CUDA 8 Why Should You Care >2X Run Computations Faster* Solve Larger Problems** Critical Path Analysis * HOOMD Blue v1.3.3 Lennard-Jones liquid
CUDA PROGRAMMING MODEL. Carlo Nardone Sr. Solution Architect, NVIDIA EMEA
 CUDA PROGRAMMING MODEL Carlo Nardone Sr. Solution Architect, NVIDIA EMEA CUDA: COMMON UNIFIED DEVICE ARCHITECTURE Parallel computing architecture and programming model GPU Computing Application Includes
Accelerate your Application with Kepler. Peter Messmer
 Accelerate your Application with Kepler Peter Messmer Goals How to analyze/optimize an existing application for GPUs What to consider when designing new GPU applications How to optimize performance with
Parallel Compact Roadmap Construction of 3D Virtual Environments on the GPU
 Parallel Compact Roadmap Construction of 3D Virtual Environments on the GPU Avi Bleiweiss NVIDIA Corporation Programmability GPU Computing CUDA C++ Parallel Debug Heterogeneous Computing Productivity Efficiency
OpenCL: History & Future. November 20, 2017
 Mitglied der Helmholtz-Gemeinschaft OpenCL: History & Future November 20, 2017 OpenCL Portable Heterogeneous Computing 2 APIs and 2 kernel languages C Platform Layer API OpenCL C and C++ kernel language