2
|
|
|
- Maurice Lucas
- 5 years ago
- Views:
Transcription
1 1
2 2
3 3
4 4
5 5
6 6

7 7
8 8
9 9
10 The inventor from the story used his knowledge of sequences to his advantage to gain riches. A sequence is a pattern involving an ordered arrangement of numbers, geometric figures, letters, or other objects. A term in a sequence is an individual number, figure, or letter in the sequence. 10
11 11
12 12
13 13
14 Class Work: In textbook, Lesson 2.1- Complete Problems 5 to 11 AND the table in page 54 14

15 15
16 16

17 17
18 18
19 19
20 20
21 21

22 22

23 23
24 24
25 25
26 26
27 Class Work: Complete testbook pages 64 to 66 Homework: Student Assignments 2.1 and

28 28
29 Key Terms: set- abscissa- relation- ordinate- function- input- output- domain- range- mapping- scatter plotvertical line test- 29

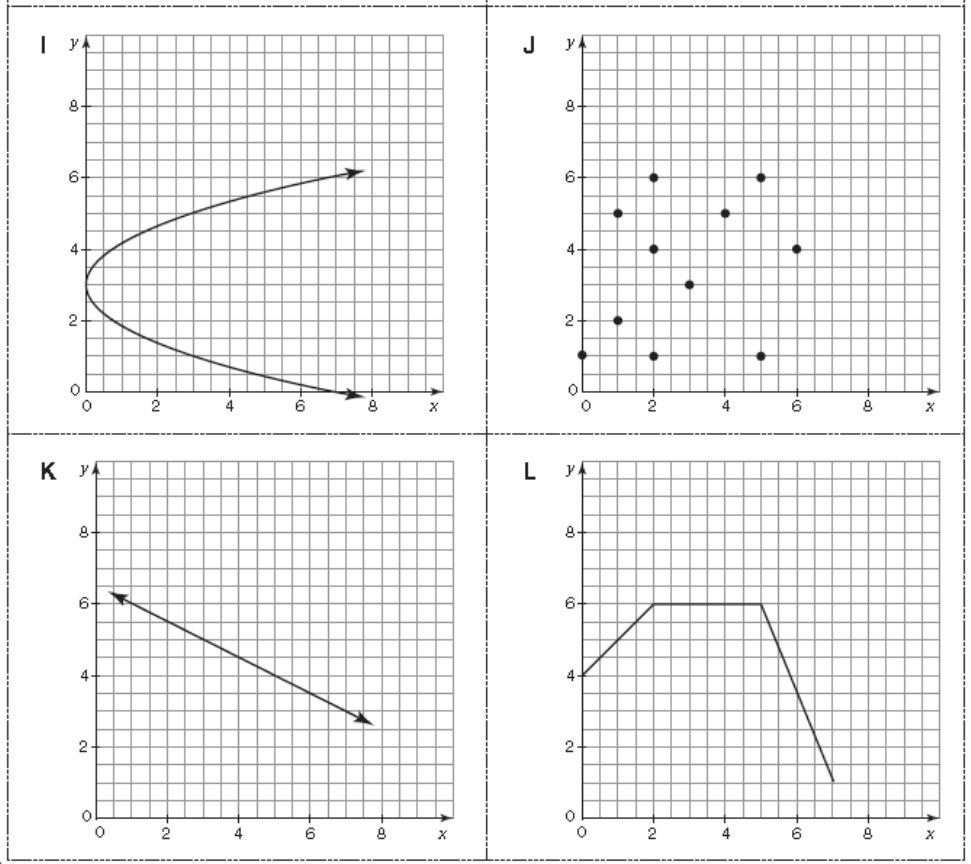
30 As you learned previously, ordered pairs consist of an x-coordinate and a y-coordinate. You also learned that a series of ordered pairs on a coordinate plane can represent a pattern. You can also use a mapping to show ordered pairs. Mapping represents two sets of objects or items. An arrow connects the items together to represent a relationship between the two items. 30
31 31
32 32
33 The mappings or ordered pairs shown in Questions 1 through 3 form relations. A relation is any set of ordered pairs or the mapping between a set of inputs and a set of outputs. The first coordinate of an ordered pair in a relation is the input, and the second coordinate is the output. A function maps each input to one and only one output. In other words, a function has no input with more than one output. The domain of a function is the set of all inputs of the function. Mention two other names for the input: The range of a function is the set of all outputs of the function. Mention two other names for the output: 33
34 34
35 Read each context and decide whether it fits the definition of a function. Explain your reasoning. 1. Input: Sue writes a thank-you note to her best friend. Output: Her best friend receives the thank-you note in the mail. 2. Input: A football game is being telecast. Output: It appears on televisions in millions of homes. 3. Input: There are four puppies in a litter. Output: One puppy was adopted by the Smiths, another by the Jacksons, and the remaining two by the Fullers. 4. Input: The basketball team has numbered uniforms. Output: Each player wears a uniform with her assigned number. 5. Input: Beverly Hills, California, has the zip code Output: There are 34,675 people living in Beverly Hills. 35
36 1. Determine if each sequence represents a function. Explain why or why not. If it is a function, identify its domain and range. a. 2, 4, 6, 8, 10, b. 1, 0, 1, 0, 1, c. 0, 5, 10, 15, 20, 2. What do you notice about each answer in Question 1? What conclusion can you make about sequences? 36


37 A relation can be represented as a graph. Graphs A L from Lesson 2.2 provide examples of graphical representations of relations. A scatter plot is a graph of a collection of ordered pairs that allows an exploration of the relationship between the points. 1. Determine if these scatter plots represent functions. Explain your reasoning. 37
38 The vertical line test is a visual method used to determine whether a relation represented as a graph is a function. To apply the vertical line test, consider all of the vertical lines that could be drawn on the graph of a relation. If any of the vertical lines intersect the graph of the relation at more than one point, then the relation is not a function. 38


39 2. Use the vertical line test to determine if each graph represents a function. Explain your reasoning. 39
40 So far, you have determined whether a set of data points in a scatter plot represents a function. You can also determine whether an equation is a function. The given equation can be used to convert yards into feet. Let x represent the number of yards, and y represent the number of feet. y = 3x To test whether this equation is a function, first, substitute values for x into the equation, and then determine if any x-value can be mapped to more than one y-value. If each x-value has exactly one y-value, then it is a function; otherwise, it is not a function. In this case, every x-value can be mapped to only one y-value. Each x-value is multiplied by 3. Some examples of ordered pairs are (2, 6), (10, 30), and (5, 15). So, this equation is a function. 1. Determine whether each equation is a function. List three ordered pairs that are solutions to each. Explain your reasoning. 40

41 CLASS WORK: 1. Sorting Activity: a. Carefully ANALYZE the Relations M through X on the following pages. b. Refer to Graphs A through L from Lesson 2. c. Sort Relations A through X into two groups: those that are functions and those that are not functions. d. Record your findings in the table by writing the letter of each relation. 41
42 HOMEWORK: STUDENT ASSIGNMENTS 2.3, ALL QUESTIONS 42

43 43

44 44
45 45

46 Can you draw a perfectly straight line without using a ruler or other straightedge? What about over a long distance? Carpenters and other construction workers use what is called a chalk line to mark straight lines over long distances. A chalk line tool looks a bit like a tape measure. A cord that is coated in chalk is wound inside the tool. One person pulls the cord to the end of where the line will be, and the other person holds the tool at the beginning of the line. When they have the line where they want, both people pull the cord tight, and one person pulls up on the cord and lets go so that the cord snaps a straight line of chalk onto the surface below the cord. Have you ever seen or used a chalk line tool? Does anyone in your class have one they could show? 46
47 1. You and your friends are rock climbing a vertical cliff that is 108 feet tall along a beach. You have been climbing for a while and are currently 36 feet above the beach when you stop on a ledge to have a snack and then begin climbing again. You can climb about 12 feet in height each hour. If you maintain your pace after your break, how high will you have climbed in: a. 1 hour? b. 2 hours? c. 180 minutes? d. 210 minutes? e. Which quantities are changing? Which quantities remain constant? f. Which quantity depends on the other quantity? g. What other names can be given to the independent and dependent variables? 47
48 2. Complete the table shown by first writing the name and the unit of measure for each quantity. Then, write your answers from Problem 1 in the table. Please note that you will complete the table at a later time. 3. Define a variable for the input quantity. Enter this variable in the Expression row at the bottom of Column Write an expression that you can use to represent the output quantity in terms of the input quantity. Enter this expression in the Expression row under output. 5. Use your expression to write an equation that you can solve to determine each answer. Then, write your answer in the appropriate place in table. a. How long will it be until you have climbed to 84 feet above the beach? b. How long will it be until you have climbed to 96 feet above the beach? c. How long will it be until you have reached the top of the cliff? 48
49 6. Create a graph to represent the values in your table. Label the horizontal axis with the input quantity and the vertical axis with the output quantity. The axes are already numbered. Finally, plot the points on the coordinate plane. 7. Connect the points on your graphs. 8. Determine the domain and range of this situation. 9. Does your table represent the same domain and range? Why or why not? 10. Is the relation shown in the graph a function? Explain why or why not. 49
50 When you graph the input and output values of some functions, the graph forms a straight line. A function whose graph is a straight line is a linear function. The relation shown in the graph in this lesson is a linear function. The graph is a line segment. Let s think about the problem situation, your table, and your graph. 1. Which variable is the dependent variable? 2. Which variable is the independent variable? 3. Describe what happens to the value of the dependent variable each time the independent variable increases by Describe what happens to the value of the dependent variable when the independent variable increases by Compare the values of the dependent variable when the independent variable is1 and 6. Describe how the dependent variable changes in relation to the independent variable. 6. Describe how the independent and dependent values change in linear functions 50
51 51
52 Recall that the absolute value of a number is defined as the distance from the number to zero on a number line. The symbol for absolute value is x. 2. Use the function y = x, to complete the table. Recall that the area of a square is equal to the side length, s, multiplied by itself and is written as A = s 2. This formula can also be modeled by the equation y = x 2, where x represents the side length of a square and y represents the area of a square 2. Use the equation, y = x 2, to complete the table. Recall that the volume of a cube is defined as the product of the length of one edge times itself 3 times and is written as V = s 3. This formula can also be modeled by the equation y = x 3, where x represents the side length of a cube and y represents the volume of a cube. 2. Use the equation, y = x 3, to complete the table. 52
53 3. Graph the values from the table on the coordinate plane. 3. Graph the values from the table on the coordinate plane. 3. Graph the values from the table on the coordinate plane. 4. Connect the points to model the relationship of the equation y = x. 5. What is the domain of this function? Do all the points on the graph make sense in terms of the equation y = x. Explain your reasoning. 4. Connect the points to model the relationship of the equation y = x What is the domain of this function? Do all the points on the graph make sense in terms of the equation y = x 2. Explain your reasoning. 4. Connect the points to model the relationship of the equation y = x What is the domain of this function? Do all the points on the graph make sense in terms of the equation y = x 3. Explain your reasoning. 6. Does the graph of these points form a straight line? Explain your reasoning. 6. What is the minimum, or least value of y? How do you know? State the range of this function. 7. Does the graph of these points form a straight line? Explain your reasoning. 6. What is the minimum value of y? How do you know? State the range of this function. 7. Does the graph of these points form a straight line? Explain your reasoning 53
54 8. Is this a linear function? Explain your reasoning. 8. Is this a linear function? Explain your reasoning. 8. Is this a linear function? Explain your reasoning. You have just graphed an absolute value function. An absolute value function is a function that can be written in the form f(x) = x, where x is any number. Function notation can be used to write functions such that the dependent variable is replaced with the name of the function, such as f(x). You have just graphed a quadratic function. A quadratic function is a function that can be written in the form f(x) = ax 2 + bx + c, where a, b, and c are any numbers and a is not equal to zero. You have just graphed a cubic function. A cubic function is a function that can be written in the form f(x) = a 3x 3 + a 2x 2 + a 1x + a 0. 54
55 HOMEWORK: STUDENT ASSIGNMENTS 2.4 & 2.7, ALL QUESTIONS 55
2
 1 2 3 4 5 6 7 8 The inventor from the story used his knowledge of sequences to his advantage to gain riches. A sequence is a pattern involving an ordered arrangement of numbers, geometric figures, letters,
Functions as Mappings from One Set to Another
 ACTIVITY. Functions as Mappings from One Set to Another As ou learned previousl, ordered pairs consist of an -coordinate and a -coordinate. You also learned that a series of ordered pairs on a coordinate
GUIDED NOTES 3.1 FUNCTIONS AND FUNCTION NOTATION
 GUIDED NOTES 3.1 FUNCTIONS AND FUNCTION NOTATION LEARNING OBJECTIVES In this section, you will: Determine whether a relation represents a function. Find the value of a function. Determine whether a function
Sec 4.1 Coordinates and Scatter Plots. Coordinate Plane: Formed by two real number lines that intersect at a right angle.
 Algebra I Chapter 4 Notes Name Sec 4.1 Coordinates and Scatter Plots Coordinate Plane: Formed by two real number lines that intersect at a right angle. X-axis: The horizontal axis Y-axis: The vertical
Input/Output Machines
 UNIT 1 1 STUDENT BOOK / Machines LESSON Quick Review t Home c h o o l This is an / machine It can be used to make a growing pattern Each input is multiplied by 9 to get the output If you input 1, the output
KEY Algebra: Unit 10 Graphing Quadratic Equations & other Relations
 Name: KEY Algebra: Unit 10 Graphing Quadratic Equations & other Relations Date: Test Bank Part I: Answer all 15 questions in this part. Each correct answer will receive credits. No partial credit will
3.1 INTRODUCTION TO THE FAMILY OF QUADRATIC FUNCTIONS
 3.1 INTRODUCTION TO THE FAMILY OF QUADRATIC FUNCTIONS Finding the Zeros of a Quadratic Function Examples 1 and and more Find the zeros of f(x) = x x 6. Solution by Factoring f(x) = x x 6 = (x 3)(x + )
Unit #3: Quadratic Functions Lesson #13: The Almighty Parabola. Day #1
 Algebra I Unit #3: Quadratic Functions Lesson #13: The Almighty Parabola Name Period Date Day #1 There are some important features about the graphs of quadratic functions we are going to explore over the
Rational Numbers: Graphing: The Coordinate Plane
 Rational Numbers: Graphing: The Coordinate Plane A special kind of plane used in mathematics is the coordinate plane, sometimes called the Cartesian plane after its inventor, René Descartes. It is one
Unit 1, Lesson 1: Tiling the Plane
 Unit 1, Lesson 1: Tiling the Plane Let s look at tiling patterns and think about area. 1.1: Which One Doesn t Belong: Tilings Which pattern doesn t belong? 1 1.2: More Red, Green, or Blue? m.openup.org//6-1-1-2
The ball is at a height of 8 m at x = and x = b. Substitute that value into the equation:
 MPMD Day : Intro to Quadratic Equations... and solving them graphically. Task : The Quadratic Equation Warm-Up: The equation h = -0.05x + x represents the height, h, in metres of one kick of a soccer ball
Unit 1 Quadratic Functions
 Unit 1 Quadratic Functions This unit extends the study of quadratic functions to include in-depth analysis of general quadratic functions in both the standard form f ( x) = ax + bx + c and in the vertex
Lesson 2: Using the Number Line to Model the Addition of Integers
 : Using the Number Line to Model the Addition of Integers Classwork Exercise 1: Real-World Introduction to Integer Addition Answer the questions below. a. Suppose you received $10 from your grandmother
QUADRATICS Graphing Quadratic Functions Common Core Standard
 H Quadratics, Lesson 6, Graphing Quadratic Functions (r. 2018) QUADRATICS Graphing Quadratic Functions Common Core Standard Next Generation Standard F-IF.B.4 For a function that models a relationship between
Properties of Quadratic functions
 Name Today s Learning Goals: #1 How do we determine the axis of symmetry and vertex of a quadratic function? Properties of Quadratic functions Date 5-1 Properties of a Quadratic Function A quadratic equation
Complete Assignment #1 listed below on WK #1 in packet. Textbook required!!!
 400Algebra 2H ASSIGNMENT SHEETrev14 CHAPTER 3: Linear Functions with Review of Chapter 1 and 2 (3-1 to 3-4 Highlights on reverse side) Directions: 1. Review classwork and read each section in textbook
Chapter 12: Quadratic and Cubic Graphs
 Chapter 12: Quadratic and Cubic Graphs Section 12.1 Quadratic Graphs x 2 + 2 a 2 + 2a - 6 r r 2 x 2 5x + 8 2y 2 + 9y + 2 All the above equations contain a squared number. They are therefore called quadratic
You should be able to plot points on the coordinate axis. You should know that the the midpoint of the line segment joining (x, y 1 1
 Name GRAPHICAL REPRESENTATION OF DATA: You should be able to plot points on the coordinate axis. You should know that the the midpoint of the line segment joining (x, y 1 1 ) and (x, y ) is x1 x y1 y,.
Chapter 1. Linear Equations and Straight Lines. 2 of 71. Copyright 2014, 2010, 2007 Pearson Education, Inc.
 Chapter 1 Linear Equations and Straight Lines 2 of 71 Outline 1.1 Coordinate Systems and Graphs 1.4 The Slope of a Straight Line 1.3 The Intersection Point of a Pair of Lines 1.2 Linear Inequalities 1.5
Math Analysis Chapter 1 Notes: Functions and Graphs
 Math Analysis Chapter 1 Notes: Functions and Graphs Day 6: Section 1-1 Graphs Points and Ordered Pairs The Rectangular Coordinate System (aka: The Cartesian coordinate system) Practice: Label each on the
3.1 Quadratic Functions and Models
 3.1 Quadratic Functions and Models Objectives: 1. Identify the vertex & axis of symmetry of a quadratic function. 2. Graph a quadratic function using its vertex, axis and intercepts. 3. Use the maximum
UNIT 3 EXPRESSIONS AND EQUATIONS Lesson 3: Creating Quadratic Equations in Two or More Variables
 Guided Practice Example 1 Find the y-intercept and vertex of the function f(x) = 2x 2 + x + 3. Determine whether the vertex is a minimum or maximum point on the graph. 1. Determine the y-intercept. The
Unit 3, Lesson 3.1 Creating and Graphing Equations Using Standard Form
 Unit 3, Lesson 3.1 Creating and Graphing Equations Using Standard Form Imagine the path of a basketball as it leaves a player s hand and swooshes through the net. Or, imagine the path of an Olympic diver
Common Core Vocabulary and Representations
 Vocabulary Description Representation 2-Column Table A two-column table shows the relationship between two values. 5 Group Columns 5 group columns represent 5 more or 5 less. a ten represented as a 5-group
5.1 Introduction to the Graphs of Polynomials
 Math 3201 5.1 Introduction to the Graphs of Polynomials In Math 1201/2201, we examined three types of polynomial functions: Constant Function - horizontal line such as y = 2 Linear Function - sloped line,
Lesson 19: Four Interesting Transformations of Functions
 Student Outcomes Students examine that a horizontal scaling with scale factor of the graph of corresponds to changing the equation from to 1. Lesson Notes In this lesson, students study the effect a horizontal
II. Functions. 61. Find a way to graph the line from the problem 59 on your calculator. Sketch the calculator graph here, including the window values:
 II Functions Week 4 Functions: graphs, tables and formulas Problem of the Week: The Farmer s Fence A field bounded on one side by a river is to be fenced on three sides so as to form a rectangular enclosure
Math Analysis Chapter 1 Notes: Functions and Graphs
 Math Analysis Chapter 1 Notes: Functions and Graphs Day 6: Section 1-1 Graphs; Section 1- Basics of Functions and Their Graphs Points and Ordered Pairs The Rectangular Coordinate System (aka: The Cartesian
QUADRATIC AND CUBIC GRAPHS
 NAME SCHOOL INDEX NUMBER DATE QUADRATIC AND CUBIC GRAPHS KCSE 1989 2012 Form 3 Mathematics Working Space 1. 1989 Q22 P1 (a) Using the grid provided below draw the graph of y = -2x 2 + x + 8 for values
Linear, Quadratic, Exponential, and Absolute Value Functions
 Linear, Quadratic, Exponential, and Absolute Value Functions Linear Quadratic Exponential Absolute Value Y = mx + b y = ax 2 + bx + c y = a b x y = x 1 What type of graph am I? 2 What can you tell me about
Assignments for Algebra 1 Unit 9 Quadratics, Part 1
 Name: Assignments for Algebra 1 Unit 9 Quadratics, Part 1 Day 1, Quadratic Transformations: p.1-2 Day 2, Vertex Form of Quadratics: p. 3 Day 3, Solving Quadratics: p. 4-5 Day 4, No Homework (be sure you
MAFS Algebra 1. Quadratic Functions. Day 17 - Student Packet
 MAFS Algebra 1 Quadratic Functions Day 17 - Student Packet Day 17: Quadratic Functions MAFS.912.F-IF.3.7a, MAFS.912.F-IF.3.8a I CAN graph a quadratic function using key features identify and interpret
Lesson 1: Analyzing Quadratic Functions
 UNIT QUADRATIC FUNCTIONS AND MODELING Lesson 1: Analyzing Quadratic Functions Common Core State Standards F IF.7 F IF.8 Essential Questions Graph functions expressed symbolically and show key features
Unit 6 Quadratic Functions
 Unit 6 Quadratic Functions 12.1 & 12.2 Introduction to Quadratic Functions What is A Quadratic Function? How do I tell if a Function is Quadratic? From a Graph The shape of a quadratic function is called
6.4 Vertex Form of a Quadratic Function
 6.4 Vertex Form of a Quadratic Function Recall from 6.1 and 6.2: Standard Form The standard form of a quadratic is: f(x) = ax 2 + bx + c or y = ax 2 + bx + c where a, b, and c are real numbers and a 0.
EXERCISE SET 10.2 MATD 0390 DUE DATE: INSTRUCTOR
 EXERCISE SET 10. STUDENT MATD 090 DUE DATE: INSTRUCTOR You have studied the method known as "completing the square" to solve quadratic equations. Another use for this method is in transforming the equation
But a vertex has two coordinates, an x and a y coordinate. So how would you find the corresponding y-value?
 We will work with the vertex, orientation, and x- and y-intercepts of these functions. Intermediate algebra Class notes More Graphs of Quadratic Functions (section 11.6) In the previous section, we investigated
I. Function Characteristics
 I. Function Characteristics Interval of possible x values for a given function. (Left,Right) Interval of possible y values for a given function. (down, up) What is happening at the far ends of the graph?
Do you need a worksheet or a copy of the teacher notes? Go to
 Name Period Day Date Assignment (Due the next class meeting) Wednesday Thursday Friday Monday Tuesday Wednesday Thursday Friday Monday Tuesday Wednesday Thursday Friday Monday Tuesday Wednesday Thursday
 Specific Objectives Students will understand that that the family of equation corresponds with the shape of the graph. Students will be able to create a graph of an equation by plotting points. In lesson
Meeting 1 Introduction to Functions. Part 1 Graphing Points on a Plane (REVIEW) Part 2 What is a function?
 Part 2 What is a function?") Meeting 1 Introduction to Functions Part 1 Graphing Points on a Plane (REVIEW) A plane is a flat, two-dimensional surface. We describe particular locations, or points, on a plane relative to two number
Meeting 1 Introduction to Functions Part 1 Graphing Points on a Plane (REVIEW) A plane is a flat, two-dimensional surface. We describe particular locations, or points, on a plane relative to two number
Lesson 8 Introduction to Quadratic Functions
 Lesson 8 Introduction to Quadratic Functions We are leaving exponential and logarithmic functions behind and entering an entirely different world. As you work through this lesson, you will learn to identify
Exam 2 Review. 2. What the difference is between an equation and an expression?
 Exam 2 Review Chapter 1 Section1 Do You Know: 1. What does it mean to solve an equation? 2. What the difference is between an equation and an expression? 3. How to tell if an equation is linear? 4. How
Chapter 2. Polynomial and Rational Functions. 2.2 Quadratic Functions
 Chapter 2 Polynomial and Rational Functions 2.2 Quadratic Functions 1 /27 Chapter 2 Homework 2.2 p298 1, 5, 17, 31, 37, 41, 43, 45, 47, 49, 53, 55 2 /27 Chapter 2 Objectives Recognize characteristics of
Planting the Seeds Exploring Cubic Functions
 295 Planting the Seeds Exploring Cubic Functions 4.1 LEARNING GOALS In this lesson, you will: Represent cubic functions using words, tables, equations, and graphs. Interpret the key characteristics of
Section 6.2 Properties of Graphs of Quadratic Functions soln.notebook January 12, 2017
 Section 6.2: Properties of Graphs of Quadratic Functions 1 Properties of Graphs of Quadratic Functions A quadratic equation can be written in three different ways. Each version of the equation gives information
Section 18-1: Graphical Representation of Linear Equations and Functions
 Section 18-1: Graphical Representation of Linear Equations and Functions Prepare a table of solutions and locate the solutions on a coordinate system: f(x) = 2x 5 Learning Outcome 2 Write x + 3 = 5 as
Answers to practice questions for Midterm 1
 Answers to practice questions for Midterm Paul Hacking /5/9 (a The RREF (reduced row echelon form of the augmented matrix is So the system of linear equations has exactly one solution given by x =, y =,
WK # Given: f(x) = ax2 + bx + c
 = ax2 + bx + c") Alg2H Chapter 5 Review 1. Given: f(x) = ax2 + bx + c Date or y = ax2 + bx + c Related Formulas: y-intercept: ( 0, ) Equation of Axis of Symmetry: x = Vertex: (x,y) = (, ) Discriminant = x-intercepts: When
Alg2H Chapter 5 Review 1. Given: f(x) = ax2 + bx + c Date or y = ax2 + bx + c Related Formulas: y-intercept: ( 0, ) Equation of Axis of Symmetry: x = Vertex: (x,y) = (, ) Discriminant = x-intercepts: When
9.1: GRAPHING QUADRATICS ALGEBRA 1
 9.1: GRAPHING QUADRATICS ALGEBRA 1 OBJECTIVES I will be able to graph quadratics: Given in Standard Form Given in Vertex Form Given in Intercept Form What does the graph of a quadratic look like? https://www.desmos.com/calculator
2. From General Form: y = ax 2 + bx + c # of x-intercepts determined by the, D =
 Alg2H 5-3 Using the Discriminant, x-intercepts, and the Quadratic Formula WK#6 Lesson / Homework --Complete without calculator Read p.181-p.186. Textbook required for reference as well as to check some
MAC Learning Objectives. Module 4. Quadratic Functions and Equations. - Quadratic Functions - Solving Quadratic Equations
 MAC 1105 Module 4 Quadratic Functions and Equations Learning Objectives Upon completing this module, you should be able to: 1. Understand basic concepts about quadratic functions and their graphs. 2. Complete
MD5-26 Stacking Blocks Pages
 MD5-26 Stacking Blocks Pages 115 116 STANDARDS 5.MD.C.4 Goals Students will find the number of cubes in a rectangular stack and develop the formula length width height for the number of cubes in a stack.
Building Concepts: Moving from Proportional Relationships to Linear Equations
 Lesson Overview In this TI-Nspire lesson, students use previous experience with proportional relationships of the form y = kx to consider relationships of the form y = mx and eventually y = mx + b. Proportional
Recognizing a Function
 Recognizing a Function LAUNCH (7 MIN) Before Why would someone hire a dog walking service? During Do you know exactly what it would cost to hire Friendly Dog Walking? After How does each service encourage
Sketching graphs of polynomials
 Sketching graphs of polynomials We want to draw the graphs of polynomial functions y = f(x). The degree of a polynomial in one variable x is the highest power of x that remains after terms have been collected.
MAC Rev.S Learning Objectives. Learning Objectives (Cont.) Module 4 Quadratic Functions and Equations
 Module 4 Quadratic Functions and Equations") MAC 1140 Module 4 Quadratic Functions and Equations Learning Objectives Upon completing this module, you should be able to 1. understand basic concepts about quadratic functions and their graphs.. complete
MAC 1140 Module 4 Quadratic Functions and Equations Learning Objectives Upon completing this module, you should be able to 1. understand basic concepts about quadratic functions and their graphs.. complete
Foundations of Math II
 Foundations of Math II Unit 6b: Toolkit Functions Academics High School Mathematics 6.6 Warm Up: Review Graphing Linear, Exponential, and Quadratic Functions 2 6.6 Lesson Handout: Linear, Exponential,
Glossary Common Core Curriculum Maps Math/Grade 6 Grade 8
 Glossary Common Core Curriculum Maps Math/Grade 6 Grade 8 Grade 6 Grade 8 absolute value Distance of a number (x) from zero on a number line. Because absolute value represents distance, the absolute value
Chapter 4: Linear Relations
 Chapter 4: Linear Relations How many people can sit around 1 table? If you put two tables together, how many will the new arrangement seat? What if there are 10 tables? What if there are 378 tables in
1.1 Functions. Cartesian Coordinate System
 1.1 Functions This section deals with the topic of functions, one of the most important topics in all of mathematics. Let s discuss the idea of the Cartesian coordinate system first. Cartesian Coordinate
Polynomial and Rational Functions
 Chapter 3 Polynomial and Rational Functions Review sections as needed from Chapter 0, Basic Techniques, page 8. Refer to page 187 for an example of the work required on paper for all graded homework unless
Integers and the Coordinate Plane
 Name Date Class 9A Dear Family, A Family Letter: Understanding Integers The student will begin the study of an important set of numbers called integers. Integers are the set of numbers that include all
Test 3 review SHORT ANSWER. Write the word or phrase that best completes each statement or answers the question.
 Test 3 review SHORT ANSWER. Write the word or phrase that best completes each statement or answers the question. Approximate the coordinates of each turning point by graphing f(x) in the standard viewing
Lesson 6 - Practice Problems
 Lesson 6 - Practice Problems Section 6.1: Characteristics of Quadratic Functions 1. For each of the following quadratic functions: Identify the coefficients a, b and c. Determine if the parabola opens
1.1 - Functions, Domain, and Range
 1.1 - Functions, Domain, and Range Lesson Outline Section 1: Difference between relations and functions Section 2: Use the vertical line test to check if it is a relation or a function Section 3: Domain
5. Compare the volume of a three dimensional figure to surface area.
 5. Compare the volume of a three dimensional figure to surface area. 1. What are the inferences that can be drawn from sets of data points having a positive association and a negative association. 2. Why
Name Course Days/Start Time
 Name Course Days/Start Time Mini-Project : The Library of Functions In your previous math class, you learned to graph equations containing two variables by finding and plotting points. In this class, we
2-9 Operations with Complex Numbers
 2-9 Operations with Complex Numbers Warm Up Lesson Presentation Lesson Quiz Algebra 2 Warm Up Express each number in terms of i. 1. 9i 2. Find each complex conjugate. 3. 4. Find each product. 5. 6. Objective
Section 3.1 Graphing Using the Rectangular Coordinate System
 Objectives Section 3.1 Graphing Using the Rectangular Coordinate System n Construct a rectangular coordinate system n Plot ordered pairs and determine the coordinates of a point n Graph paired data n Read
Lesson 16: More on Modeling Relationships with a Line
 Student Outcomes Students use the least squares line to predict values for a given data set. Students use residuals to evaluate the accuracy of predictions based on the least squares line. Lesson Notes
Learning Objectives. Math Prerequisites. Technology Prerequisites. Materials. Math Objectives. Technology Objectives
 Learning Objectives Parametric Functions Lesson 2: Dude, Where s My Football? Level: Algebra 2 Time required: 60 minutes Many students expect a falling object graph to look just like the path of the falling
Types of Functions Here are six common types of functions and examples of each. Linear Quadratic Absolute Value Square Root Exponential Reciprocal
 Topic 2.0 Review Concepts What are non linear equations? Student Notes Unit 2 Non linear Equations Types of Functions Here are six common types of functions and examples of each. Linear Quadratic Absolute
Practices (1) 6.MP.2. Reason abstractly and quantitatively.
 6.MP.2. Reason abstractly and quantitatively.") Common Core Scope and Sequence Sixth Grade Quarter 3 Unit 6: Coordinate Plane and Proportional Relationships Domain: The Number System, Geometry, Expressions and Equations, Ratios and Proportional Relationships
Common Core Scope and Sequence Sixth Grade Quarter 3 Unit 6: Coordinate Plane and Proportional Relationships Domain: The Number System, Geometry, Expressions and Equations, Ratios and Proportional Relationships
 Tools of Geometry 1. X + 9 = 24 2. 25 X = 15 3. X + 3 = -2X -10 4. 3X + 4Y = 2 Place in slope intercept form. 5. Y = ½ X 2 What is the slope? What is the Y- Intercept? Inductive Reasoning is reasoning
Student Exploration: Quadratics in Polynomial Form
 Name: Date: Student Exploration: Quadratics in Polynomial Form Vocabulary: axis of symmetry, parabola, quadratic function, vertex of a parabola Prior Knowledge Questions (Do these BEFORE using the Gizmo.)
5 th Grade LEUSD Learning Targets in Mathematics
 5 th Grade LEUSD Learning Targets in Mathematics 6/24/2015 The learning targets below are intended to provide a guide for teachers in determining whether students are exhibiting characteristics of being
Did you ever think that a four hundred year-old spider may be why we study linear relationships today?
 Show Me: Determine if a Function is Linear M8221 Did you ever think that a four hundred year-old spider may be why we study linear relationships today? Supposedly, while lying in bed Rene Descartes noticed
8 th Grade Mathematics Unpacked Content For the new Common Core standards that will be effective in all North Carolina schools in the
 8 th Grade Mathematics Unpacked Content For the new Common Core standards that will be effective in all North Carolina schools in the 2012-13. This document is designed to help North Carolina educators
Unit 2-2: Writing and Graphing Quadratics NOTE PACKET. 12. I can use the discriminant to determine the number and type of solutions/zeros.
 Unit 2-2: Writing and Graphing Quadratics NOTE PACKET Name: Period Learning Targets: Unit 2-1 12. I can use the discriminant to determine the number and type of solutions/zeros. 1. I can identify a function
Plotting Graphs. Error Bars
 E Plotting Graphs Construct your graphs in Excel using the method outlined in the Graphing and Error Analysis lab (in the Phys 124/144/130 laboratory manual). Always choose the x-y scatter plot. Number
10.3 vertex and max values with comparing functions 2016 ink.notebook. March 14, Vertex and Max Value & Page 101.
 10.3 vertex and max values with comparing functions 2016 ink.notebook Page 101 Page 102 10.3 Vertex and Value and Comparing Functions Algebra: Transformations of Functions Page 103 Page 104 Lesson Objectives
SNAP Centre Workshop. Graphing Lines
 SNAP Centre Workshop Graphing Lines 45 Graphing a Line Using Test Values A simple way to linear equation involves finding test values, plotting the points on a coordinate plane, and connecting the points.
Math 7 Notes - Unit 4 Pattern & Functions
 Math 7 Notes - Unit 4 Pattern & Functions Syllabus Objective: (3.2) The student will create tables, charts, and graphs to extend a pattern in order to describe a linear rule, including integer values.
Using the Best of Both!
 Using the Best of Both! A Guide to Using Connected Mathematics 2 with Prentice Hall Mathematics Courses 1, 2, 3 2012, and Algebra Readiness MatBro111707BestOfBothPH10&CMP2.indd 1 6/7/11 11:59 AM Using
Section 3.1. Reading graphs and the Rectangular Coordinate System
 Section 3.1 Reading graphs and the Rectangular Coordinate System Learning objectives Read bar & line graphs Introduce the rectangular coordinate system Graph paired data points on the rectangular coordinate
Carnegie LearningÒ Middle School Math Solution Correlations Course 3 NCSCoS: Grade 8
 MATHEMATICAL PRACTICES - 1 - Make sense of problems and persevere in solving them. Explain the meaning of a problem and look for entry points to its solution. Analyze givens, constraints, relationships,
Course Number 432/433 Title Algebra II (A & B) H Grade # of Days 120
 H Grade # of Days 120") Whitman-Hanson Regional High School provides all students with a high- quality education in order to develop reflective, concerned citizens and contributing members of the global community. Course Number
Whitman-Hanson Regional High School provides all students with a high- quality education in order to develop reflective, concerned citizens and contributing members of the global community. Course Number
Developed in Consultation with Tennessee Educators
 Developed in Consultation with Tennessee Educators Table of Contents Letter to the Student........................................ Test-Taking Checklist........................................ Tennessee
Y. Butterworth Lehmann & 9.2 Page 1 of 11
 Pre Chapter 9 Coverage Quadratic (2 nd Degree) Form a type of graph called a parabola Form of equation we'll be dealing with in this chapter: y = ax 2 + c Sign of a determines opens up or down "+" opens
SCHEME OF WORK YR 8 THETA 2 UNIT / LESSON
 SCHEME OF WORK YR 8 THETA 2 UNIT / LESSON STEPS STEPS FROM TO 1 Number 4th 6th OBJECTIVES 1.1 Calculations 5th 5th Use written methods to add and subtract with decimals. Calculate mentally. Calculate with
Slide 2 / 222. Algebra II. Quadratic Functions
 Slide 1 / 222 Slide 2 / 222 Algebra II Quadratic Functions 2014-10-14 www.njctl.org Slide 3 / 222 Table of Contents Key Terms Explain Characteristics of Quadratic Functions Combining Transformations (review)
Elementary Functions
 Elementary Functions Part 1, Functions Lecture 1.2a, Graphs of Functions: Introduction Dr. Ken W. Smith Sam Houston State University Spring 2013 Smith (SHSU) Elementary Functions Spring 2013 1 / 37 Representing
MEI GeoGebra Tasks for AS Pure
 Task 1: Coordinate Geometry Intersection of a line and a curve 1. Add a quadratic curve, e.g. y = x 2 4x + 1 2. Add a line, e.g. y = x 3 3. Use the Intersect tool to find the points of intersection of
Year 8 Set 2 : Unit 1 : Number 1
 Year 8 Set 2 : Unit 1 : Number 1 Learning Objectives: Level 5 I can order positive and negative numbers I know the meaning of the following words: multiple, factor, LCM, HCF, prime, square, square root,
Amplifying an Instructional Task Algebra II Example
 Original Task The student is expected to write the equation of a parabola using given attributes, including vertex, focus, directrix, axis of symmetry, and direction of opening. A(4)(B) Write the equations
Sample: Do Not Reproduce QUAD4 STUDENT PAGES. QUADRATIC FUNCTIONS AND EQUATIONS Student Pages for Packet 4: Quadratic Functions and Applications
 Name Period Date QUADRATIC FUNCTIONS AND EQUATIONS Student Pages for Packet 4: Quadratic Functions and Applications QUAD 4.1 Vertex Form of a Quadratic Function 1 Explore how changing the values of h and
Integrated Mathematics I Performance Level Descriptors
 Limited A student performing at the Limited Level demonstrates a minimal command of Ohio s Learning Standards for Integrated Mathematics I. A student at this level has an emerging ability to demonstrate
UNIT 3B CREATING AND GRAPHING EQUATIONS Lesson 4: Solving Systems of Equations Instruction
 Prerequisite Skills This lesson requires the use of the following skills: graphing multiple equations on a graphing calculator graphing quadratic equations graphing linear equations Introduction A system
Homework Packet Week #2
 All problems with answers or work are examples. Homework Packet Week #2 Section 1.1 Determine the independent and dependent quantities in each scenario. (1-2) 1. Phillip enjoys rock climbing on the weekends.