DEPARTMENT OF BIOSTATISTICS UNIVERSITY OF COPENHAGEN. Graphics. Compact R for the DANTRIP team. Klaus K. Holst
|
|
|
- Kellie Bailey
- 6 years ago
- Views:
Transcription
1 Graphics Compact R for the DANTRIP team Klaus K. Holst
2 The R Graphics system R has a very flexible and powerful graphics system Basic plot routine: plot(x,y,...) low-level routines: lines, points, text, title, legend,... Example of high-level routines: qqnorm, hist, boxplot,... Many classes have attached plot-method, e.g.: plot(density(iris$sepal.length))
3 Graphics methods plot(density(iris$sepal.length))

4 Iris data For illustration purposes we are using the Anderson s Iris flower data set consisting of measurements of sepal length and width and petal length and with of 50 flowers of specie iris setosa, versicolor and virginica.

5 Iris data pairs(iris, col=as.numeric(iris$species))
6 Graphics methods (m1 <- methods("plot")) [1] plot.holtwinters* plot.tukeyhsd plot.acf* [4] plot.correspondence* plot.data.frame* plot.decompos [7] plot.default plot.dendrogram* plot.density [10] plot.ecdf plot.factor* plot.formula* [13] plot.function plot.hclust* plot.histogra [16] plot.isoreg* plot.lda* plot.lm [19] plot.mca* plot.medpolish* plot.mlm [22] plot.ppr* plot.prcomp* plot.princomp [25] plot.profile* plot.profile.nls* plot.ridgelm* [28] plot.shingle* plot.spec plot.stepfun [31] plot.stl* plot.table* plot.trellis* [34] plot.ts plot.tskernel* Non-visible functions are asterisked
7 The R Graphics system Traditional system Lattice Grid (library(grid), see R Graphics, by Paul Murrell) paul/rg2e/ ggplot2 (Grammar of Graphics) Limited support for interactive graphics
8 Lattice Library of high-level plot functions including scattter-plots, density plots, qq-plots, level plots,... Particularly well suited to visualize longitudinal and grouped data. k <- 10 n <- 20 id <- y <- x <- c() set.seed(1) for (i in seq(n)) { x0 <- seq(k)+runif(k,0,0.5) u <- rnorm(1,sd=1.5) x <- c(x,x0) id <- c(id,rep(i,k)) y <- c(y,rnorm(k,u+x0,sd=0.8)) } z <- as.factor(rep(c(0,1),each=k*n/2)) d <- data.frame(y=y,x=x,id=id,z=z)
9 Lattice print(xyplot(y ~ x, group=id, type="l", data=d, col="darkblu
10 Lattice print(xyplot(y ~ x z, group=id, type="l", data=d))

11 Lattice xyplot(y ~ x id, type="l", data=d)

12 ggplot2 Implementation of Grammar of Graphics library(ggplot2) p1 <- qplot(sepal.length,sepal.width,data=iris,colour=species) p1
13 ggplot2 p2 <- p1 + xlab(expression(eta)) + ylab(expression(phi(eta))) p2 <- p2 + opts(axis.title.x=theme_text(size=15,vjust=0.5), axis.title.y=theme_text(size=15,vjust=0.5,angle=90)) p2
")
14 ggplot2 p3 <- p2 + stat_smooth(span=0.75,se=true,colour="darkblue") p3+geom_point(shape=1,size=3)
15 3D graphics, surface plots x <- seq(0,3,by=.05) z <- outer(x,x,fun=function(x,y) sin(x*y)+x^2) contour(x,x,z)

16 3D graphics, contour plots filled.contour(x,x,z)

17 3D graphics, images image(z,col=heat.colors(50))
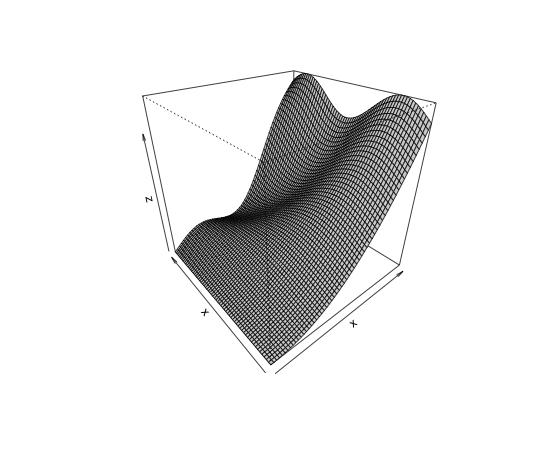
18 3D graphics, surface persp(x,x,z,theta=-40,phi=30,col="lightgray")
19 3D graphics, scatter plots library(scatterplot3d) with(iris, scatterplot3d(sepal.length, Petal.Length, Petal.Width,color=as.numeric(Species)))
20 3D graphics, rgl Interactive plots via rgl library(rgl) persp3d(x,x,z,col="orange") with(iris, plot3d(cbind(sepal.length, Petal.Length, Petal.Width), col=as.numeric(species), type="s",radius=0.07))
21 Interactive graphics A few third party libraries are available which implements some support for interacting with plots such as brushing Iplots rggobi playwith rpanel rgl, misc3d all available on CRAN
22 Identifying points, brushing source("color.r") plot(sepal.length ~ Petal.Length, data=iris) idp <- with(iris, Id(Petal.Length,Sepal.Length)) Text("My label")
23 Mathematical annotation x <- seq(0,2, by=0.001) f1 <- sqrt(x) f2 <- x^2 plot(x, f1, type= l, lty=1, col="red", ylab="f(x)") lines(x, f2, lty=2, col="blue") legend("bottomright", legend=c(expression(f[1](x)==sqrt(x)), expression(phi(x)==x^2) ), col=c("red","blue"), lty=c(1,2)) title(expression(sum(delta[i],i==1,n)==integral(f(x)*dx,a,b)
24 Mathematical annotation
25 Large data load("prt.rda") str(prt) head(prt) prt <- prt[order(prt$id),] prt$twinnum <- unlist(lapply(table(prt$id),seq)) prtwide <- reshape(prt,direction="wide", idvar=c("id","zyg","country"),timevar="twinnum") head(prt) data.frame : obs. of 6 variables: $ country: Factor w/ 4 levels "Denmark","Finland",..: $ time : num $ status : int $ zyg : Factor w/ 2 levels "DZ","MZ": $ id : int $ cancer : num country time status zyg id cancer

26 Large data plot(time.1~time.2,prtwide)
27 Large data plot(time.1~time.2,prtwide,pch=16,cex=0.5)

28 Large data library(hexbin) hp <- with(prtwide, hexbin(time.1,time.2)) plot(hp)
29 Large data plot(hp, style="centroids")
30 Large data cols <- c(rgb(0.5,0,0,0.1),rgb(0,0,0.5,0.1)) plot(time.1~time.2,prtwide,pch=16,cex=1, col=cols[as.numeric(prtwide$zyg)])
31 Colors and transparency The Col function from color.r can add transparency to a named color Col("blue",0.2) To select a color with the mouse you can call color(1)
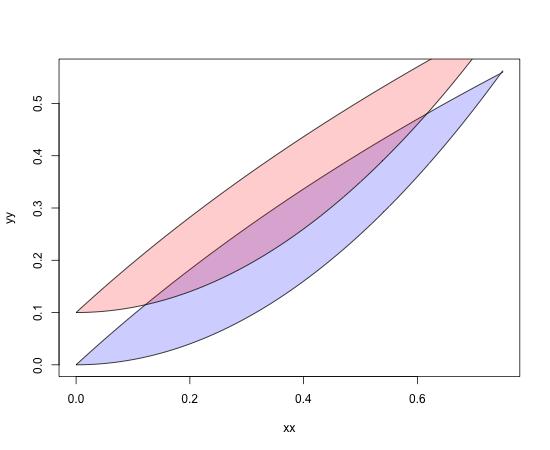
32 Colors and transparency x <- seq(0,0.75,by=0.01) y1 <- log(x+1) y2 <- x^2 xx <- c(x,rev(x)) yy <- c(y1,rev(y2)) plot(xx,yy, type="n") polygon(xx,yy, col=col("blue",0.2)) polygon(xx,rev(yy)+0.1, col=col("red",0.2))
33 Colors and transparency
34 Practicals: transparent confidence bands 1 Fit a linear regression model to the iris data with Sepal.Length as the outcome and Sepal.Width as the covariate. Include the interaction with Species and assess the statistical significance of the interaction using a Likelihood Ratio Test or Wald test. 2 Make a scatter-plot of the two continuous variables (colored by Species) and add the estimated regression lines with transparent 95% confidence limits (in matching colors).
Linear discriminant analysis and logistic
 Practical 6: classifiers Linear discriminant analysis and logistic This practical looks at two different methods of fitting linear classifiers. The linear discriminant analysis is implemented in the MASS
Course outline. An Introduction to R Graphics 2. Standard graphics in R. Outline: Session 2. R graphics systems. 1. Overview of R graphics
 Course outline An Introduction to R Graphics 2. Standard graphics in R 1. Overview of R graphics 2. Standard graphics in R 3. Grid & lattice graphics 4. ggplot2 Michael Friendly SCS Short Course March,
Intro to R for Epidemiologists
 Lab 9 (3/19/15) Intro to R for Epidemiologists Part 1. MPG vs. Weight in mtcars dataset The mtcars dataset in the datasets package contains fuel consumption and 10 aspects of automobile design and performance
k Nearest Neighbors Super simple idea! Instance-based learning as opposed to model-based (no pre-processing)
") k Nearest Neighbors k Nearest Neighbors To classify an observation: Look at the labels of some number, say k, of neighboring observations. The observation is then classified based on its nearest neighbors
k Nearest Neighbors k Nearest Neighbors To classify an observation: Look at the labels of some number, say k, of neighboring observations. The observation is then classified based on its nearest neighbors
Data Visualization in R 2. Standard graphics in R
 Data Visualization in R 2. Standard graphics in R Michael Friendly SCS Short Course Sep/Oct, 2018 http://datavis.ca/courses/rgraphics/ Course outline 1. Overview of R graphics 2. Standard graphics in R
Introduction to R and Statistical Data Analysis
 Microarray Center Introduction to R and Statistical Data Analysis PART II Petr Nazarov petr.nazarov@crp-sante.lu 22-11-2010 OUTLINE PART II Descriptive statistics in R (8) sum, mean, median, sd, var, cor,
Les exemples des fonctions graphiques de haut niveau
 Fiche TD avec le logiciel : tdr79 Les exemples des fonctions graphiques de haut niveau P r Jean R. Lobry Table des matières 1 Introduction 3 2 boot 1.3-18 4 2.1 glm.diag.plots : Diagnostics plots for generalized
Chapter 7 Graphing Tools
 Chapter 7 Graphing Tools Chapter 5, the plot function was introduced. We demonstrated elementary scatterplots, modifying plotting characters, and adding x- and y-labels and a main title. In this chapter,
An Introduction to R Graphics
 An Introduction to R Graphics PnP Group Seminar 25 th April 2012 Why use R for graphics? Fast data exploration Easy automation and reproducibility Create publication quality figures Customisation of almost
Advanced Graphics in R
 Advanced Graphics in R Laurel Stell February 7, 8 Introduction R Markdown file and slides Download in easy steps: http://web.stanford.edu/ lstell/ Click on Data Studio presentation: Advanced graphics in
Advanced Statistics 1. Lab 11 - Charts for three or more variables. Systems modelling and data analysis 2016/2017
 Advanced Statistics 1 Lab 11 - Charts for three or more variables 1 Preparing the data 1. Run RStudio Systems modelling and data analysis 2016/2017 2. Set your Working Directory using the setwd() command.
Customising spatial data classes and methods *
 Customising spatial data classes and methods * Edzer Pebesma Feb 2008 Contents 1 Programming with classes and methods 2 1.1 S3-style classes and methods.................... 3 1.2 S4-style classes and methods....................
DATA VISUALIZATION WITH GGPLOT2. Coordinates
 DATA VISUALIZATION WITH GGPLOT2 Coordinates Coordinates Layer Controls plot dimensions coord_ coord_cartesian() Zooming in scale_x_continuous(limits =...) xlim() coord_cartesian(xlim =...) Original Plot
arulescba: Classification for Factor and Transactional Data Sets Using Association Rules
 arulescba: Classification for Factor and Transactional Data Sets Using Association Rules Ian Johnson Southern Methodist University Abstract This paper presents an R package, arulescba, which uses association
LaTeX packages for R and Advanced knitr
 LaTeX packages for R and Advanced knitr Iowa State University April 9, 2014 More ways to combine R and LaTeX Additional knitr options for formatting R output: \Sexpr{}, results='asis' xtable - formats
Data Mining - Data. Dr. Jean-Michel RICHER Dr. Jean-Michel RICHER Data Mining - Data 1 / 47
 Data Mining - Data Dr. Jean-Michel RICHER 2018 jean-michel.richer@univ-angers.fr Dr. Jean-Michel RICHER Data Mining - Data 1 / 47 Outline 1. Introduction 2. Data preprocessing 3. CPA with R 4. Exercise
Introduction to R for Epidemiologists
 Introduction to R for Epidemiologists Jenna Krall, PhD Thursday, January 29, 2015 Final project Epidemiological analysis of real data Must include: Summary statistics T-tests or chi-squared tests Regression
Data analysis case study using R for readily available data set using any one machine learning Algorithm
 Assignment-4 Data analysis case study using R for readily available data set using any one machine learning Algorithm Broadly, there are 3 types of Machine Learning Algorithms.. 1. Supervised Learning
Chuck Cartledge, PhD. 20 January 2018
 Big Data: Data Analysis Boot Camp Visualizing the Iris Dataset Chuck Cartledge, PhD 20 January 2018 1/31 Table of contents (1 of 1) 1 Intro. 2 Histograms Background 3 Scatter plots 4 Box plots 5 Outliers
Graphing Bivariate Relationships
 Graphing Bivariate Relationships Overview To fully explore the relationship between two variables both summary statistics and visualizations are important. For this assignment you will describe the relationship
STAT 1291: Data Science
 STAT 1291: Data Science Lecture 18 - Statistical modeling II: Machine learning Sungkyu Jung Where are we? data visualization data wrangling professional ethics statistical foundation Statistical modeling:
Data Visualization Using R & ggplot2. Karthik Ram October 6, 2013
 Data Visualization Using R & ggplot2 Karthik Ram October 6, 2013 Some housekeeping Install some packages install.packages("ggplot2", dependencies = TRUE) install.packages("plyr") install.packages("ggthemes")
Clojure & Incanter. Introduction to Datasets & Charts. Data Sorcery with. David Edgar Liebke
 Data Sorcery with Clojure & Incanter Introduction to Datasets & Charts National Capital Area Clojure Meetup 18 February 2010 David Edgar Liebke liebke@incanter.org Outline Overview What is Incanter? Getting
Creating publication-ready Word tables in R
 Creating publication-ready Word tables in R Sara Weston and Debbie Yee 12/09/2016 Has this happened to you? You re working on a draft of a manuscript with your adviser, and one of her edits is something
Introduction to R/Bioconductor
 Introduction to R/Bioconductor MCBIOS-2015 Workshop Thomas Girke March 12, 2015 Introduction to R/Bioconductor Slide 1/62 Introduction Look and Feel of the R Environment R Library Depositories Installation
K-fold cross validation in the Tidyverse Stephanie J. Spielman 11/7/2017
 K-fold cross validation in the Tidyverse Stephanie J. Spielman 11/7/2017 Requirements This demo requires several packages: tidyverse (dplyr, tidyr, tibble, ggplot2) modelr broom proc Background K-fold
Data Visualization in R
 Data Visualization in R L. Torgo ltorgo@fc.up.pt Faculdade de Ciências / LIAAD-INESC TEC, LA Universidade do Porto Oct, 216 Introduction Motivation for Data Visualization Humans are outstanding at detecting
programming R: Functions and Methods
 programming R: Functions and Methods Adrian Waddell University of Waterloo Departement of Statistics and Actuarial Science September 8, 2010 About these Slides These slides were written on behalf of the
R Graphics. SCS Short Course March 14, 2008
 R Graphics SCS Short Course March 14, 2008 Archeology Archeological expedition Basic graphics easy and flexible Lattice (trellis) graphics powerful but less flexible Rgl nice 3d but challenging Tons of
A Tour of Sweave. Max Kuhn. March 14, Pfizer Global R&D Non Clinical Statistics Groton
 A Tour of Sweave Max Kuhn Pfizer Global R&D Non Clinical Statistics Groton March 14, 2011 Creating Data Analysis Reports For most projects where we need a written record of our work, creating the report
Input: Concepts, Instances, Attributes
 Input: Concepts, Instances, Attributes 1 Terminology Components of the input: Concepts: kinds of things that can be learned aim: intelligible and operational concept description Instances: the individual,
Introduction to R: Part II
 Introduction to R language and plotting functions Alexandre Perera i Lluna 1,2 1 Centre de Recerca en Enginyeria Biomèdica (CREB) Departament d Enginyeria de Sistemes, Automàtica i Informàtica Industrial
An Introduction to R Graphics with examples
 An Introduction to R Graphics with examples Feng Li November 18, 2008 1 R graphics system A picture is worth a thousand words! The R graphics system can be broken into four distinct levels: graphics packages;
A Data Explorer System and Rulesets of Table Functions
 A Data Explorer System and Rulesets of Table Functions Kunihiko KANEKO a*, Ashir AHMED b*, Seddiq ALABBASI c* * Department of Advanced Information Technology, Kyushu University, Motooka 744, Fukuoka-Shi,
Machine Learning: Algorithms and Applications Mockup Examination
 Machine Learning: Algorithms and Applications Mockup Examination 14 May 2012 FIRST NAME STUDENT NUMBER LAST NAME SIGNATURE Instructions for students Write First Name, Last Name, Student Number and Signature
Introduction to Statistical Graphics Procedures
 Introduction to Statistical Graphics Procedures Selvaratnam Sridharma, U.S. Census Bureau, Washington, DC ABSTRACT SAS statistical graphics procedures (SG procedures) that were introduced in SAS 9.2 help
DATA VISUALIZATION WITH GGPLOT2. Grid Graphics
 DATA VISUALIZATION WITH GGPLOT2 Grid Graphics ggplot2 internals Explore grid graphics 35 30 Elements of ggplot2 plot 25 How do graphics work in R? 2 plotting systems mpg 20 15 base package grid graphics
Data Visualization in R
 Data Visualization in R L. Torgo ltorgo@fc.up.pt Faculdade de Ciências / LIAAD-INESC TEC, LA Universidade do Porto Aug, 2017 Introduction Motivation for Data Visualization Humans are outstanding at detecting
Experimental Design + k- Nearest Neighbors
 10-601 Introduction to Machine Learning Machine Learning Department School of Computer Science Carnegie Mellon University Experimental Design + k- Nearest Neighbors KNN Readings: Mitchell 8.2 HTF 13.3
MULTIVARIATE ANALYSIS USING R
 MULTIVARIATE ANALYSIS USING R B N Mandal I.A.S.R.I., Library Avenue, New Delhi 110 012 bnmandal @iasri.res.in 1. Introduction This article gives an exposition of how to use the R statistical software for
Introduction to Artificial Intelligence
 Introduction to Artificial Intelligence COMP307 Machine Learning 2: 3-K Techniques Yi Mei yi.mei@ecs.vuw.ac.nz 1 Outline K-Nearest Neighbour method Classification (Supervised learning) Basic NN (1-NN)
While not exactly the same, these definitions highlight four key elements of statistics.
 What Is Statistics? Some Definitions of Statistics This is a book primarily about statistics, but what exactly is statistics? In other words, what is this book about? 1 Here are some definitions of statistics
Making Data Speak USING R SOFTWARE. 1 November 2017
 Making Data Speak USING R SOFTWARE 1 November 2017 Dr. Norhaiza Ahmad Department of Mathematical Sciences Faculty of Science Universiti Teknologi Malaysia Welcome. The title for this talk should really
Data Mining: Exploring Data. Lecture Notes for Chapter 3
 Data Mining: Exploring Data Lecture Notes for Chapter 3 Slides by Tan, Steinbach, Kumar adapted by Michael Hahsler Look for accompanying R code on the course web site. Topics Exploratory Data Analysis
BL5229: Data Analysis with Matlab Lab: Learning: Clustering
 BL5229: Data Analysis with Matlab Lab: Learning: Clustering The following hands-on exercises were designed to teach you step by step how to perform and understand various clustering algorithm. We will
Introduction to Graphics with ggplot2
 Introduction to Graphics with ggplot2 Reaction 2017 Flavio Santi Sept. 6, 2017 Flavio Santi Introduction to Graphics with ggplot2 Sept. 6, 2017 1 / 28 Graphics with ggplot2 ggplot2 [... ] allows you to
Package reghelper. April 8, 2017
 Type Package Title Helper Functions for Regression Analysis Version 0.3.3 Date 2017-04-07 Package reghelper April 8, 2017 A set of functions used to automate commonly used methods in regression analysis.
Decision Trees In Weka,Data Formats
 CS 4510/9010 Applied Machine Learning 1 Decision Trees In Weka,Data Formats Paula Matuszek Fall, 2016 J48: Decision Tree in Weka 2 NAME: weka.classifiers.trees.j48 SYNOPSIS Class for generating a pruned
R Graphics. Feng Li School of Statistics and Mathematics Central University of Finance and Economics
 R Graphics Feng Li feng.li@cufe.edu.cn School of Statistics and Mathematics Central University of Finance and Economics Revised on June 2, 2015 Today we are going to learn... 1 Basic R Graphical System
Manuel Oviedo de la Fuente and Manuel Febrero Bande
 Supervised classification methods in by fda.usc package Manuel Oviedo de la Fuente and Manuel Febrero Bande Universidade de Santiago de Compostela CNTG (Centro de Novas Tecnoloxías de Galicia). Santiago
Boxplot
 Boxplot By: Meaghan Petix, Samia Porto & Franco Porto A boxplot is a convenient way of graphically depicting groups of numerical data through their five number summaries: the smallest observation (sample
Introduction to R. Richard Wang, PhD CBI fellow Nelson & Miceli labs
 Introduction to R Richard Wang, PhD CBI fellow Nelson & Miceli labs Workshop 3: Introduction to R Day 2 Statistical methods Probability distributions Random number generation Common statistical tests Fisher
KTH ROYAL INSTITUTE OF TECHNOLOGY. Lecture 14 Machine Learning. K-means, knn
 KTH ROYAL INSTITUTE OF TECHNOLOGY Lecture 14 Machine Learning. K-means, knn Contents K-means clustering K-Nearest Neighbour Power Systems Analysis An automated learning approach Understanding states in
Package tidylpa. March 28, 2018
 Type Package Title Easily Carry Out Latent Profile Analysis Version 0.1.3 Package tidylpa March 28, 2018 An interface to the 'mclust' package to easily carry out latent profile analysis (``LPA''). Provides
An Introduction to Cluster Analysis. Zhaoxia Yu Department of Statistics Vice Chair of Undergraduate Affairs
 An Introduction to Cluster Analysis Zhaoxia Yu Department of Statistics Vice Chair of Undergraduate Affairs zhaoxia@ics.uci.edu 1 What can you say about the figure? signal C 0.0 0.5 1.0 1500 subjects Two
INTRODUCTION TO R. Basic Graphics
 INTRODUCTION TO R Basic Graphics Graphics in R Create plots with code Replication and modification easy Reproducibility! graphics package ggplot2, ggvis, lattice graphics package Many functions plot()
IST 3108 Data Analysis and Graphics Using R Week 9
 IST 3108 Data Analysis and Graphics Using R Week 9 Engin YILDIZTEPE, Ph.D 2017-Spring Introduction to Graphics >y plot (y) In R, pictures are presented in the active graphical device or window.
Visualizing high-dimensional data:
 Visualizing high-dimensional data: Applying graph theory to data visualization Wayne Oldford based on joint work with Catherine Hurley (Maynooth, Ireland) Adrian Waddell (Waterloo, Canada) Challenge p
Model Selection Introduction to Machine Learning. Matt Gormley Lecture 4 January 29, 2018
 10-601 Introduction to Machine Learning Machine Learning Department School of Computer Science Carnegie Mellon University Model Selection Matt Gormley Lecture 4 January 29, 2018 1 Q&A Q: How do we deal
blogr: R for blogs Shane M. Conway December 13, 2009
 blogr: R for blogs Shane M. Conway December 13, 2009 Abstract blogr is an R package to provide a standardized framework for online reproducible research through blogs. It aims to both simplify the blogging
Stat 302 Statistical Software and Its Applications Density Estimation
 Stat 302 Statistical Software and Its Applications Density Estimation Yen-Chi Chen Department of Statistics, University of Washington Spring 2017 1 / 42 Examples of Density Estimation 1 Histogram of faithful$eruptions
Basic Concepts Weka Workbench and its terminology
 Changelog: 14 Oct, 30 Oct Basic Concepts Weka Workbench and its terminology Lecture Part Outline Concepts, instances, attributes How to prepare the input: ARFF, attributes, missing values, getting to know
Package TPD. June 14, 2018
 Type Package Package TPD June 14, 2018 Title Methods for Measuring Functional Diversity Based on Trait Probability Density Version 1.0.0 Date 2018-06-13 Author Carlos P. Carmona
Introduction to R. A Short Overview. Thomas Girke. December 12, Introduction to R Slide 1/70
 Introduction to R A Short Overview Thomas Girke December 12, 2013 Introduction to R Slide 1/70 Introduction Look and Feel of the R Environment R Library Depositories Installation Getting Around Basic Syntax
Instance-Based Representations. k-nearest Neighbor. k-nearest Neighbor. k-nearest Neighbor. exemplars + distance measure. Challenges.
 Instance-Based Representations exemplars + distance measure Challenges. algorithm: IB1 classify based on majority class of k nearest neighbors learned structure is not explicitly represented choosing k
mmpf: Monte-Carlo Methods for Prediction Functions by Zachary M. Jones
 CONTRIBUTED RESEARCH ARTICLE 1 mmpf: Monte-Carlo Methods for Prediction Functions by Zachary M. Jones Abstract Machine learning methods can often learn high-dimensional functions which generalize well
Chapter 60 The STEPDISC Procedure. Chapter Table of Contents
 Chapter 60 Chapter Table of Contents OVERVIEW...3155 GETTING STARTED...3156 SYNTAX...3163 PROC STEPDISC Statement...3163 BYStatement...3166 CLASSStatement...3167 FREQStatement...3167 VARStatement...3167
Visualizing the World
 Visualizing the World An Introduction to Visualization 15.071x The Analytics Edge Why Visualization? The picture-examining eye is the best finder we have of the wholly unanticipated -John Tukey Visualizing
Data Manipulation using dplyr
 Data Manipulation in R Reading and Munging Data L. Torgo ltorgo@fc.up.pt Faculdade de Ciências / LIAAD-INESC TEC, LA Universidade do Porto Oct, 2017 Data Manipulation using dplyr The dplyr is a package
USE IBM IN-DATABASE ANALYTICS WITH R
 USE IBM IN-DATABASE ANALYTICS WITH R M. WURST, C. BLAHA, A. ECKERT, IBM GERMANY RESEARCH AND DEVELOPMENT Introduction To process data, most native R functions require that the data first is extracted from
6 Subscripting. 6.1 Basics of Subscripting. 6.2 Numeric Subscripts. 6.3 Character Subscripts
 6 Subscripting 6.1 Basics of Subscripting For objects that contain more than one element (vectors, matrices, arrays, data frames, and lists), subscripting is used to access some or all of those elements.
Data Mining: Exploring Data. Lecture Notes for Chapter 3
 Data Mining: Exploring Data Lecture Notes for Chapter 3 1 What is data exploration? A preliminary exploration of the data to better understand its characteristics. Key motivations of data exploration include
Introduction to R. Daniel Berglund. 9 November 2017
 Introduction to R Daniel Berglund 9 November 2017 1 / 15 R R is available at the KTH computers If you want to install it yourself it is available at https://cran.r-project.org/ Rstudio an IDE for R is
Partitioning Cluster Analysis with Possibilistic C-Means Zeynel Cebeci
 Partitioning Cluster Analysis with Possibilistic C-Means Zeynel Cebeci 2017-11-10 Contents 1 PREPARING FOR THE ANALYSIS 1 1.1 Install and load the package ppclust................................ 1 1.2
Advanced Graphics with R
 Advanced Graphics with R Paul Murrell Universitat de Barcelona April 30 2009 Session overview: (i) Introduction Graphic formats: Overview and creating graphics in R Graphical parameters in R: par() Selected
Package PCADSC. April 19, 2017
 Type Package Package PCADSC April 19, 2017 Title Tools for Principal Component Analysis-Based Data Structure Comparisons Version 0.8.0 A suite of non-parametric, visual tools for assessing differences
Data Mining: Exploring Data. Lecture Notes for Chapter 3. Introduction to Data Mining
 Data Mining: Exploring Data Lecture Notes for Chapter 3 Introduction to Data Mining by Tan, Steinbach, Kumar What is data exploration? A preliminary exploration of the data to better understand its characteristics.
Data Mining: Exploring Data. Lecture Notes for Data Exploration Chapter. Introduction to Data Mining
 Data Mining: Exploring Data Lecture Notes for Data Exploration Chapter Introduction to Data Mining by Tan, Steinbach, Karpatne, Kumar 02/03/2018 Introduction to Data Mining 1 What is data exploration?
The STEPDISC Procedure
 SAS/STAT 9.2 User s Guide The STEPDISC Procedure (Book Excerpt) This document is an individual chapter from SAS/STAT 9.2 User s Guide. The correct bibliographic citation for the complete manual is as follows:
03 - Intro to graphics (with ggplot2)
") 3 - Intro to graphics (with ggplot2) ST 597 Spring 217 University of Alabama 3-dataviz.pdf Contents 1 Intro to R Graphics 2 1.1 Graphics Packages................................ 2 1.2 Base Graphics...................................
3 - Intro to graphics (with ggplot2) ST 597 Spring 217 University of Alabama 3-dataviz.pdf Contents 1 Intro to R Graphics 2 1.1 Graphics Packages................................ 2 1.2 Base Graphics...................................
LESSON 14: Box plots questions
 LESSON 14: Box plots questions FOCUS QUESTION: How can I compare the distributions for data sets that have outliers? Contents EXAMPLE 1: Load the Fisher iris data (comes with MATLAB) EXAMPLE 2: Compare
Data Mining: Exploring Data
 Data Mining: Exploring Data Lecture Notes for Chapter 3 Introduction to Data Mining by Tan, Steinbach, Kumar But we start with a brief discussion of the Friedman article and the relationship between Data
k-nearest Neighbors + Model Selection
 10-601 Introduction to Machine Learning Machine Learning Department School of Computer Science Carnegie Mellon University k-nearest Neighbors + Model Selection Matt Gormley Lecture 5 Jan. 30, 2019 1 Reminders
Using the missforest Package
 Using the missforest Package Daniel J. Stekhoven stekhoven@stat.math.ethz.ch Friday, 13 th of May, 2011 Update: Version 1.2, 20.02.12 Contents 1 Introduction 1 1.1 What is this document? (And what it isn
Roger D. Peng, Associate Professor of Biostatistics Johns Hopkins Bloomberg School of Public Health
 The Lattice Plotting System in R Roger D. Peng, Associate Professor of Biostatistics Johns Hopkins Bloomberg School of Public Health The Lattice Plotting System The lattice plotting system is implemented
Orange3 Educational Add-on Documentation
 Orange3 Educational Add-on Documentation Release 0.1 Biolab Jun 01, 2018 Contents 1 Widgets 3 2 Indices and tables 27 i ii Widgets in Educational Add-on demonstrate several key data mining and machine
The Basics of Plotting in R
 The Basics of Plotting in R R has a built-in Datasets Package: iris mtcars precip faithful state.x77 USArrests presidents ToothGrowth USJudgeRatings You can call built-in functions like hist() or plot()
Lab 6 More Linear Regression
 Lab 6 More Linear Regression Corrections from last lab 5: Last week we produced the following plot, using the code shown below. plot(sat$verbal, sat$math,, col=c(1,2)) legend("bottomright", legend=c("male",
Tutorial for the R Statistical Package
 Tutorial for the R Statistical Package University of Colorado Denver Stephanie Santorico Mark Shin Contents 1 Basics 2 2 Importing Data 10 3 Basic Analysis 14 4 Plotting 22 5 Installing Packages 29 This
plot(seq(0,10,1), seq(0,10,1), main = "the Title", xlim=c(1,20), ylim=c(1,20), col="darkblue");
, seq(0,10,1), main = the Title, xlim=c(1,20), ylim=c(1,20), col=darkblue);") R for Biologists Day 3 Graphing and Making Maps with Your Data Graphing is a pretty convenient use for R, especially in Rstudio. plot() is the most generalized graphing function. If you give it all numeric
R for Biologists Day 3 Graphing and Making Maps with Your Data Graphing is a pretty convenient use for R, especially in Rstudio. plot() is the most generalized graphing function. If you give it all numeric
EPL451: Data Mining on the Web Lab 5
 EPL451: Data Mining on the Web Lab 5 Παύλος Αντωνίου Γραφείο: B109, ΘΕΕ01 University of Cyprus Department of Computer Science Predictive modeling techniques IBM reported in June 2012 that 90% of data available
Fitting Classification and Regression Trees Using Statgraphics and R. Presented by Dr. Neil W. Polhemus
 Fitting Classification and Regression Trees Using Statgraphics and R Presented by Dr. Neil W. Polhemus Classification and Regression Trees Machine learning methods used to construct predictive models from
Introduction to R. Hao Helen Zhang. Fall Department of Mathematics University of Arizona
 Department of Mathematics University of Arizona hzhang@math.aricona.edu Fall 2019 What is R R is the most powerful and most widely used statistical software Video: A language and environment for statistical
ANN exercise session
 ANN exercise session In this exercise session, you will read an external file with Iris flowers and create an internal database in Java as it was done in previous exercise session. A new file contains
netzen - a software tool for the analysis and visualization of network data about
 Architect and main contributor: Dr. Carlos D. Correa Other contributors: Tarik Crnovrsanin and Yu-Hsuan Chan PI: Dr. Kwan-Liu Ma Visualization and Interface Design Innovation (ViDi) research group Computer
Rstudio GGPLOT2. Preparations. The first plot: Hello world! W2018 RENR690 Zihaohan Sang
 Rstudio GGPLOT2 Preparations There are several different systems for creating data visualizations in R. We will introduce ggplot2, which is based on Leland Wilkinson s Grammar of Graphics. The learning
Advanced Econometric Methods EMET3011/8014
 Advanced Econometric Methods EMET3011/8014 Lecture 2 John Stachurski Semester 1, 2011 Announcements Missed first lecture? See www.johnstachurski.net/emet Weekly download of course notes First computer
Chapter 1, TUFTE STYLE GRIDDING FOR READABILITY. Chapter 5, SLICE (CROSS-SECTIONAL VIEWS)
") Chapter, TUFTE STYLE GRIDDING FOR READABILITY Chapter 5, SLICE (CROSS-SECTIONAL VIEWS) Number of responses 8 7 6 5 4 3 2 9 8 7 6 5 4 3 2 Distribution of ethnicities in each income group of SF bay area
Chapter, TUFTE STYLE GRIDDING FOR READABILITY Chapter 5, SLICE (CROSS-SECTIONAL VIEWS) Number of responses 8 7 6 5 4 3 2 9 8 7 6 5 4 3 2 Distribution of ethnicities in each income group of SF bay area
RAJESH KEDIA 2014CSZ8383
 SIV895: Special Module on Intelligent Information Processing Project Report Title: Classification of Iris flower species: Analysis using Neural Network. Submitted By: RAJESH KEDIA 14CSZ8383 Date: -Apr-16
An introduction to ggplot: An implementation of the grammar of graphics in R
 An introduction to ggplot: An implementation of the grammar of graphics in R Hadley Wickham 00-0-7 1 Introduction Currently, R has two major systems for plotting data, base graphics and lattice graphics