Linear, Quadratic, and Exponential Models Attendance Problems 1. Find the slope and y-intercept of the line that passes through (4, 20) and (20, 24).
|
|
|
- Cecil Griffin
- 6 years ago
- Views:
Transcription

1 Page 1 of 13 Linear, Quadratic, and Exponential Models Attendance Problems 1. Find the slope and y-intercept of the line that passes through (4, 20) and (20, 24). The population of a town is decreasing at a rate of 1.8% per year. In 2000, there were 4600 people. 2. Write an exponential decay function to model this situation. 3. Predict the population in I can compare linear, quadratic, and exponential models. Given a set of data, I can decide which type of function models the data and write an equation to describe the function. Common Core CCSS.MATH.CONTENT.HSF.LE.A.1 Distinguish between situations that can be modeled with linear functions and with exponential functions. CCSS.MATH.CONTENT.HSF.LE.A.2 Construct linear and exponential functions, including arithmetic and geometric sequences, given a graph, a description of a relationship, or two inputoutput pairs (include reading these from a table). CCSS.MATH.CONTENT.HSA.CED.A.2 Create equations in two or more variables to represent relationships between quantities; graph equations on coordinate axes with labels and scales.


2 Page 2 of 13 Look at the tables and graphs. The data show three ways you have learned that variable quantities can be related. The relationship shown is linear. Look at the tables and graphs below. The data show three ways you have learned that variable quantities can be related. The relationship shown is quadratic. Look at the tables and graphs. The data show three ways you have learned that variable quantities can be related. The relationship shown is exponential.
 they think")

3 ! Algebra Page 3 of 13 People often gather data and then must decide what kind of relationship (if any) they think best describes their data. Video Example 1. Graph each data set. Which kind of model best describes the data? A. B.


4 Algebra 1 Graphing Data to Choose a Model Graph each data set. Which kind of model best describes the data? A Time (h) Bacteria Page 4 of 13 Plot the data points and connect them. The data appear to be exponential. Graph each data set. Which kind of model best describes the data? B C F Plot the data points and connect them. The data appear to be linear.
5 Page 5 of 13 Example 1. Graph each data set. Which kind of model best describes the data? A. Time(h) Bacteria B. x y


6 Page 6 of Guided Practice. Graph the data set. Which kind of model best describes the data? x y Another way to decide which kind of relationship (if any) best describes a data set is to use patterns. Video Example 2. Look for a pattern in each data set to determine which kind of model best describes the data. A. B.
 Cable s Height (ft) 0 400 100 256 200 144 300 64-144 - 112-80 + 32 + 32 For")
 Value ($) 0 20,000 1 17,000 2 14,450 3 12,282.50 0.85 0.")
7 Algebra Page 7 of 13 2 Using Patterns to Choose a Model Look for a pattern in each data set to determine which kind of model best describes the data. A Height of Bridge Suspension Cables Cable s Distance from Tower (ft) Cable s Height (ft) For every constant change in distance of +100 feet, there is a constant second difference of +32. The data appear to be quadratic. B Value of a Car Car s Age (yr) Value ($) 0 20, , , , For every constant change in age of +1 year, there is a constant ratio of The data appear to be exponential.
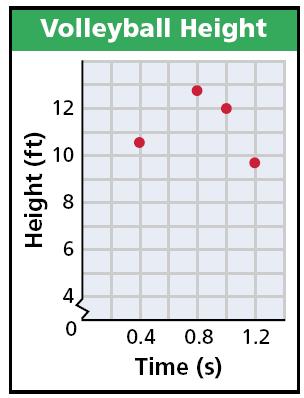
8 Page 8 of 13 Example 2. Look for a pattern in each data set to determine which kind of model best describes the data. A. Height of golf ball Time (s) Height (ft) B. Money in CD Time (yr) Amount ($) Guided Practice. Look for a pattern in the data set {( 2, 10), ( 1, 1), (0, 2), (1, 1), (2, 10)} to determine which kind of model best describes the data. After deciding which model best fits the data, you can write a function. Recall the general forms of linear, quadratic, and exponential functions.


9 Page 9 of 13 Video Example 3. Use the data in the table to describe how the ladybug population is changing. Then write a function that models the data. Use your function to predict the ladybug population after two years.


. Substitute for x and y. Simplify. 3 0 = 1 The value of a is 10.")
 12 = 5,314,410 Substitute 12 for x (1 year = 12 mo). Use a calculator.")
10 Algebra Page 10 of 13 3 Problem-Solving Application Use the data in the table to describe how the ladybug population is changing. Then write a function that models the data. Use your function to predict the ladybug population after one year. Ladybug Population Time (mo) Ladybugs Understand the Problem The answer will have three parts a description, a function, and a prediction. 2 Make a Plan Determine whether the data is linear, quadratic, or exponential. Use the general form to write a function. Then use the function to find the population after one year. 3 Solve Step 1 Describe the situation in words. Ladybug Population Time (mo) Ladybugs Each month, the ladybug population is multiplied by 3. In other words, the population triples each month. Step 2 Write the function. There is a constant ratio of 3. The data appear to be exponential. y = a b x Write the general form of an exponential function. y = a (3) x 10 = a (3) 0 10 = a (1) 10 = a y = 10 (3) x Substitute the constant ratio, 3, for b. Choose an ordered pair from the table, such as (0, 10). Substitute for x and y. Simplify. 3 0 = 1 The value of a is 10. Substitute 10 for a in y = a (3) x. Step 3 Predict the ladybug population after one year. y = 10 (3) x Write the function. = 10 (3) 12 = 5,314,410 Substitute 12 for x (1 year = 12 mo). Use a calculator. There will be 5,314,410 ladybugs after one year. 4 Look Back You chose the ordered pair (0, 10) to wr ite the function. Check that ever y other ordered pair in the table satisfies your function. y = 10 (3) x (3) (3) y = 10 (3) x (3) (9) y = 10 (3) x (3) (27)
11 Page 11 of 13 Example 3. Use the data in the table to describe how the number of people changes. Then write a function that models the data. Use your function to predict the number of people who received the after one week. Time (Days) forwarding Number of People Who Received the Remember! When the independent variable changes by a constant amount, linear functions have constant first differences. quadratic functions have constant second differences. exponential functions have a constant ratio. Teacher: Why are you so dressed up? Student: You said we d be modeling today.


12 Page 12 of Guided Practice. Use the data in the table to describe how the oven temperature is changing. Then write a function that models the data. Use your function to predict the temperature after 1 hour. Summary. Which kind of model best describes each set of data? 8. 9.

13 Page 13 of Use the data in the table to describe how the amount of water is changing. Then write a function that models the data. Use your function to predict the amount of water in the pool after 3 hours. 9-4 Assignment (p 653) 8-14,
Linear, Quadratic, Exponential, and Absolute Value Functions
 Linear, Quadratic, Exponential, and Absolute Value Functions Linear Quadratic Exponential Absolute Value Y = mx + b y = ax 2 + bx + c y = a b x y = x 1 What type of graph am I? 2 What can you tell me about
3.1 INTRODUCTION TO THE FAMILY OF QUADRATIC FUNCTIONS
 3.1 INTRODUCTION TO THE FAMILY OF QUADRATIC FUNCTIONS Finding the Zeros of a Quadratic Function Examples 1 and and more Find the zeros of f(x) = x x 6. Solution by Factoring f(x) = x x 6 = (x 3)(x + )
Section 7: Exponential Functions
 Topic 1: Geometric Sequences... 175 Topic 2: Exponential Functions... 178 Topic 3: Graphs of Exponential Functions - Part 1... 182 Topic 4: Graphs of Exponential Functions - Part 2... 185 Topic 5: Growth
Lesson 8: Graphs and Graphing Linear Equations
 In this chapter, we will begin looking at the relationships between two variables. Typically one variable is considered to be the input, and the other is called the output. The input is the value that
Section 6.2: Properties of Graphs of Quadratic Functions. Vertex:
 Section 6.2: Properties of Graphs of Quadratic Functions determine the vertex of a quadratic in standard form sketch the graph determine the y intercept, x intercept(s), the equation of the axis of symmetry,
Solutions. Algebra II Journal. Module 2: Regression. Exploring Other Function Models
 Solutions Algebra II Journal Module 2: Regression Exploring Other Function Models This journal belongs to: 1 Algebra II Journal: Reflection 1 Before exploring these function families, let s review what
Geometric Sequences. Geometric Sequences. Warm Up Lesson Presentation Lesson Quiz. Holt McDougal Algebra 1
 Warm Up Lesson Presentation Lesson Quiz Algebra 1 Warm Up Find the value of each expression. 1. 2 5 32 2. 2 5 3. 3 4 81 4. ( 3) 4 81 5. (0.2) 3 0.008 6. 7( 4) 2 112 7. 8. 12( 0.4) 3 0.768 Objectives Recognize
6.4 Vertex Form of a Quadratic Function
 6.4 Vertex Form of a Quadratic Function Recall from 6.1 and 6.2: Standard Form The standard form of a quadratic is: f(x) = ax 2 + bx + c or y = ax 2 + bx + c where a, b, and c are real numbers and a 0.
FSA Algebra I End-of-Course Review Packet. Functions and Modeling
 FSA Algebra I End-of-Course Review Packet Functions and Modeling Table of Contents MAFS.912.F-BF.2.3 EOC Practice... 3 MAFS.912.F-IF.1.2 EOC Practice... 5 MAFS.912.F-IF.1.1 EOC Practice... 7 MAFS.912.F-IF.2.5
CW High School. Algebra I A
 1. Functions (20.00%) 1.1 I can solve a two or more step equation involving parenthesis and negative numbers including those with no solution or all real numbers solutions. 4 Pro cient I can solve a two
 Specific Objectives Students will understand that that the family of equation corresponds with the shape of the graph. Students will be able to create a graph of an equation by plotting points. In lesson
UNIT 4 DESCRIPTIVE STATISTICS Lesson 2: Working with Two Categorical and Quantitative Variables Instruction
 Prerequisite Skills This lesson requires the use of the following skills: plotting points on the coordinate plane, given data in a table plotting the graph of a linear function, given an equation plotting
But a vertex has two coordinates, an x and a y coordinate. So how would you find the corresponding y-value?
 We will work with the vertex, orientation, and x- and y-intercepts of these functions. Intermediate algebra Class notes More Graphs of Quadratic Functions (section 11.6) In the previous section, we investigated
Lesson 3.1 Vertices and Intercepts. Important Features of Parabolas
 Lesson 3.1 Vertices and Intercepts Name: _ Learning Objective: Students will be able to identify the vertex and intercepts of a parabola from its equation. CCSS.MATH.CONTENT.HSF.IF.C.7.A Graph linear and
STANDARDS OF LEARNING CONTENT REVIEW NOTES. ALGEBRA I Part I. 4 th Nine Weeks,
 STANDARDS OF LEARNING CONTENT REVIEW NOTES ALGEBRA I Part I 4 th Nine Weeks, 2016-2017 1 OVERVIEW Algebra I Content Review Notes are designed by the High School Mathematics Steering Committee as a resource
PROBLEM SOLVING WITH EXPONENTIAL FUNCTIONS
 Topic 21: Problem solving with eponential functions 323 PROBLEM SOLVING WITH EXPONENTIAL FUNCTIONS Lesson 21.1 Finding function rules from graphs 21.1 OPENER 1. Plot the points from the table onto the
Assignment. Growth, Decay, and Interest Exponential Models. Write an exponential function to model each situation.
 Assignment Assignment for Lesson.1 Name Date Growth, Decay, and Interest Exponential Models Write an exponential function to model each situation. 1. A town s population was 78,400 in 10. The population
UNIT 5 QUADRATIC FUNCTIONS Lesson 7: Building Functions Instruction
 Prerequisite Skills This lesson requires the use of the following skills: multiplying linear expressions factoring quadratic equations finding the value of a in the vertex form of a quadratic equation
KEY Algebra: Unit 10 Graphing Quadratic Equations & other Relations
 Name: KEY Algebra: Unit 10 Graphing Quadratic Equations & other Relations Date: Test Bank Part I: Answer all 15 questions in this part. Each correct answer will receive credits. No partial credit will
Properties of Graphs of Quadratic Functions
 H e i g h t (f t ) Lesson 2 Goal: Properties of Graphs of Quadratic Functions Identify the characteristics of graphs of quadratic functions: Vertex Intercepts Domain and Range Axis of Symmetry and use
2) For the graphs f and g given : c) Find the values of x for which g( x) f ( x)
 For the graphs f and g given : c) Find the values of x for which g( x) f ( x)") Algebra Per Name Concept Category 1 - Functions Teacher: N 1 3 4 Student: N 1 3 4 1) Domain : Range : End Behavior Interval of increase : f (3) f (4) decrease : f ( x) 1 x? x intercept y intercept ) For
Algebra Per Name Concept Category 1 - Functions Teacher: N 1 3 4 Student: N 1 3 4 1) Domain : Range : End Behavior Interval of increase : f (3) f (4) decrease : f ( x) 1 x? x intercept y intercept ) For
DOWNLOAD PDF BIG IDEAS MATH VERTICAL SHRINK OF A PARABOLA
 Chapter 1 : BioMath: Transformation of Graphs Use the results in part (a) to identify the vertex of the parabola. c. Find a vertical line on your graph paper so that when you fold the paper, the left portion
Review for Mastery Using Graphs and Tables to Solve Linear Systems
 3-1 Using Graphs and Tables to Solve Linear Systems A linear system of equations is a set of two or more linear equations. To solve a linear system, find all the ordered pairs (x, y) that make both equations
A I only B II only C II and IV D I and III B. 5 C. -8
 1. (7A) Points (3, 2) and (7, 2) are on the graphs of both quadratic functions f and g. The graph of f opens downward, and the graph of g opens upward. Which of these statements are true? I. The graphs
b. Cost depends on the number of rods in a staircase frame (ACE Exercise 3). c. Bridge strength depends on bridge thickness (Problem 1.1).
. c. Bridge strength depends on bridge thickness (Problem 1.1).") HOMEWORK HELP Thinking With Mathematical Models Investigation 1, ACE Exercise 5 Parts (a) (f) refer to relationships between variables you have studied in this Investigation. Tell whether each relationship
HOMEWORK HELP Thinking With Mathematical Models Investigation 1, ACE Exercise 5 Parts (a) (f) refer to relationships between variables you have studied in this Investigation. Tell whether each relationship
II. Functions. 61. Find a way to graph the line from the problem 59 on your calculator. Sketch the calculator graph here, including the window values:
 II Functions Week 4 Functions: graphs, tables and formulas Problem of the Week: The Farmer s Fence A field bounded on one side by a river is to be fenced on three sides so as to form a rectangular enclosure
Algebra 1, 4th 4.5 weeks
 The following practice standards will be used throughout 4.5 weeks:. Make sense of problems and persevere in solving them.. Reason abstractly and quantitatively. 3. Construct viable arguments and critique
loose-leaf paper Name: Class: Date: Multiple Choice Identify the choice that best completes the statement or answers the question.
 Class: Date: Algebra 2 Midterm Exam Review 2014 loose-leaf paper Do all work in a neat and organzied manner on Multiple Choice Identify the choice that best completes the statement or answers the question.
Section 8: Summary of Functions
 Topic 1: Comparing Linear, Quadratic, and Exponential Functions - Part 1... 197 Topic 2: Comparing Linear, Quadratic, and Exponential Functions - Part 2... 199 Topic 3: Comparing Arithmetic and Geometric
ALGEBRA 1 SPRING FINAL REVIEW. This COMPLETED packet is worth: and is DUE:
 Name: Period: Date: MODULE 3 Unit 7 Sequences ALGEBRA 1 SPRING FINAL REVIEW This COMPLETED packet is worth: and is DUE: 1. Write the first 5 terms of each sequence, then state if it is geometric or arithmetic.
Slide 2 / 222. Algebra II. Quadratic Functions
 Slide 1 / 222 Slide 2 / 222 Algebra II Quadratic Functions 2014-10-14 www.njctl.org Slide 3 / 222 Table of Contents Key Terms Explain Characteristics of Quadratic Functions Combining Transformations (review)
STANDARDS OF LEARNING CONTENT REVIEW NOTES ALGEBRA II. 3 rd Nine Weeks,
 STANDARDS OF LEARNING CONTENT REVIEW NOTES ALGEBRA II 3 rd Nine Weeks, 2016-2017 1 OVERVIEW Algebra II Content Review Notes are designed by the High School Mathematics Steering Committee as a resource
Mathematics Scope & Sequence Algebra I
 Mathematics Scope & Sequence 2016-17 Algebra I Revised: June 20, 2016 First Grading Period (24 ) Readiness Standard(s) Solving Equations and Inequalities A.5A solve linear equations in one variable, including
8.6. Write and Graph Exponential Decay Functions. Warm Up Lesson Presentation Lesson Quiz
 8.6 Write and Graph Exponential Decay Functions Warm Up Lesson Presentation Lesson Quiz 8.6 Warm-Up. Evaluate. 3 ANSWER 8. Evaluate. 4 ANSWER 6 3. The table shows how much money Tess owes after w weeks.
Course of study- Algebra Introduction: Algebra 1-2 is a course offered in the Mathematics Department. The course will be primarily taken by
 Course of study- Algebra 1-2 1. Introduction: Algebra 1-2 is a course offered in the Mathematics Department. The course will be primarily taken by students in Grades 9 and 10, but since all students must
Algebra II Quadratic Functions
 1 Algebra II Quadratic Functions 2014-10-14 www.njctl.org 2 Ta b le o f C o n te n t Key Terms click on the topic to go to that section Explain Characteristics of Quadratic Functions Combining Transformations
Algebra 1 Notes Quarter
 Algebra 1 Notes Quarter 3 2014 2015 Name: ~ 1 ~ Table of Contents Unit 9 Exponent Rules Exponent Rules for Multiplication page 6 Negative and Zero Exponents page 10 Exponent Rules Involving Quotients page
ALGEBRA 1 NOTES. Quarter 3. Name: Block
 2016-2017 ALGEBRA 1 NOTES Quarter 3 Name: Block Table of Contents Unit 8 Exponent Rules Exponent Rules for Multiplication page 4 Negative and Zero Exponents page 8 Exponent Rules Involving Quotients page
Types of Functions Here are six common types of functions and examples of each. Linear Quadratic Absolute Value Square Root Exponential Reciprocal
 Topic 2.0 Review Concepts What are non linear equations? Student Notes Unit 2 Non linear Equations Types of Functions Here are six common types of functions and examples of each. Linear Quadratic Absolute
Lesson 8: Graphs and Graphing Linear Equations
 A critical skill required for the study of algebra is the ability to construct and interpret graphs. In this lesson we will learn how the Cartesian plane is used for constructing graphs and plotting data.
Arithmetic sequences. Melissa Kramer Laingsburg HS
 Arithmetic sequences Melissa Kramer Laingsburg HS What is a sequence? A list of values having a specific pattern 10, 20, 30, 40 5, 10, 20, 40, 80, The domain of a sequence is the set of natural numbers
Let s review some things we learned earlier about the information we can gather from the graph of a quadratic.
 Section 6: Quadratic Equations and Functions Part 2 Section 6 Topic 1 Observations from a Graph of a Quadratic Function Let s review some things we learned earlier about the information we can gather from
Graphing Linear Equations
 Graphing Linear Equations Question 1: What is a rectangular coordinate system? Answer 1: The rectangular coordinate system is used to graph points and equations. To create the rectangular coordinate system,
Algebra II 1 st Trimester Learning Targets
 Algebra II 1 st Trimester Learning Targets Unit 1 - Sequences (Chapter 1) 1a. I can use a recursive formula to write out a sequence Write out the first terms of the following sequences: 1) = 20 = an +
Section 6: Quadratic Equations and Functions Part 2
 Section 6: Quadratic Equations and Functions Part 2 Topic 1: Observations from a Graph of a Quadratic Function... 147 Topic 2: Nature of the Solutions of Quadratic Equations and Functions... 150 Topic
Algebra 8 Final Exam Review Packet
 Algebra 8 Final Exam Review Packet Name: Period: Date: The final will be 20 multiple-choice questions. You will have one class period to complete it. You may use a non-graphing calculator. What you need
Instructor: Barry McQuarrie Page 1 of 6
 Questions 1. Solve the system by graphing: 3x + y = 2 2x y = 3 2. Solve the system by graphing: x + 3y = 9 y = 1 3 x 2 3. Solve the system by graphing: y = 2x + 5 3y + 6x = 15 4. Solve the system algebraically,
Quadratics Functions: Review
 Quadratics Functions: Review Name Per Review outline Quadratic function general form: Quadratic function tables and graphs (parabolas) Important places on the parabola graph [see chart below] vertex (minimum
Exploring Slope. We use the letter m to represent slope. It is the ratio of the rise to the run.
 Math 7 Exploring Slope Slope measures the steepness of a line. If you take any two points on a line, the change in y (vertical change) is called the rise and the change in x (horizontal change) is called
QUADRATIC FUNCTIONS TEST REVIEW NAME: SECTION 1: FACTORING Factor each expression completely. 1. 3x p 2 16p. 3. 6x 2 13x 5 4.
 QUADRATIC FUNCTIONS TEST REVIEW NAME: SECTION 1: FACTORING Factor each expression completely. 1. 3x 2 48 2. 25p 2 16p 3. 6x 2 13x 5 4. 9x 2 30x + 25 5. 4x 2 + 81 6. 6x 2 14x + 4 7. 4x 2 + 20x 24 8. 4x
Day #1. Determining an exponential function from a table Ex #1: Write an exponential function to model the given data.
 Algebra I Name Unit #2: Sequences & Exponential Functions Lesson #7: Determining an Exponential Function from a Table or Graph Period Date Day #1 Ok, so we spent a lot of time focusing on exponential growth
Algebra 1: Quadratic Functions Review (Ch. 9 part 1)
") Name: Class: Date: ID: A Algebra 1: Quadratic Functions Review (Ch. 9 part 1) 1. Find the rule of a parabola that has the Ê 1 x-intercepts at ( 6,0) and,0 ˆ 3 ËÁ. 6. 2. Find the rule of a parabola that
Name: Class: Date: ID: A Algebra 1: Quadratic Functions Review (Ch. 9 part 1) 1. Find the rule of a parabola that has the Ê 1 x-intercepts at ( 6,0) and,0 ˆ 3 ËÁ. 6. 2. Find the rule of a parabola that
Part I. Fill in the blank. 2 points each. No calculators. No partial credit
 Math 108 (105) Final Exam Page 1 Spring 2015 Part I. Fill in the blank. 2 points each. No calculators. No partial credit 1) Fill in the blank a) 2 8 h) 5 0 21 4 b) 5 7 i) 8 3 c) 2 3 = j) 2 7 d) The additive
Meeting 1 Introduction to Functions. Part 1 Graphing Points on a Plane (REVIEW) Part 2 What is a function?
 Part 2 What is a function?") Meeting 1 Introduction to Functions Part 1 Graphing Points on a Plane (REVIEW) A plane is a flat, two-dimensional surface. We describe particular locations, or points, on a plane relative to two number
Meeting 1 Introduction to Functions Part 1 Graphing Points on a Plane (REVIEW) A plane is a flat, two-dimensional surface. We describe particular locations, or points, on a plane relative to two number
9-1: Slope NAME: 1. What do you think is meant by the terms rise and run?
 9-1: Slope NAME: CUES: PER: DATE: 1. What do you think is meant by the terms rise and run? 2. What is the vertical change between: a. points A and B? b. points A and C? c. points C and D? 3. What is the
Using Technology to Make Connections in Algebra
 Using Technology to Make Connections in Algebra Richard Parr rparr@rice.edu Rice University School Mathematics Project http://rusmp.rice.edu All On The Line Alg1Week17_Systems.tns Name Class Problem 1
Algebra II. Working with Rational Expressions. Slide 1 / 179 Slide 2 / 179. Slide 4 / 179. Slide 3 / 179. Slide 6 / 179.
 Slide 1 / 179 Slide 2 / 179 Algebra II Rational Expressions & Equations 2015-08-15 www.njctl.org Slide 3 / 179 Slide 4 / 179 Table of Contents Working with Rational Expressions Joint and Inverse Variation
Identifying Slope and y-intercept slope y = mx + b
 Practice 1 Identifying m and b Identifying Slope and y-intercept slope y = mx + b y-intercept 1 1. For each of the following, identify the slope and y-intercept, OR use the slope and y-intercept to write
Sample: Do Not Reproduce QUAD4 STUDENT PAGES. QUADRATIC FUNCTIONS AND EQUATIONS Student Pages for Packet 4: Quadratic Functions and Applications
 Name Period Date QUADRATIC FUNCTIONS AND EQUATIONS Student Pages for Packet 4: Quadratic Functions and Applications QUAD 4.1 Vertex Form of a Quadratic Function 1 Explore how changing the values of h and
Unit 6 Quadratic Functions
 Unit 6 Quadratic Functions 12.1 & 12.2 Introduction to Quadratic Functions What is A Quadratic Function? How do I tell if a Function is Quadratic? From a Graph The shape of a quadratic function is called
Chapter 3 Practice Test
 1. Complete parts a c for each quadratic function. a. Find the y-intercept, the equation of the axis of symmetry, and the x-coordinate of the vertex. b. Make a table of values that includes the vertex.
Lesson 21: Comparing Linear and Exponential Functions Again
 Lesson M Lesson : Comparing Linear and Eponential Functions Again Student Outcomes Students create models and understand the differences between linear and eponential models that are represented in different
Graphing Rational Functions
 Graphing Rational Functions Return to Table of Contents 109 Vocabulary Review x-intercept: The point where a graph intersects with the x-axis and the y-value is zero. y-intercept: The point where a graph
Quadratic Functions. Chapter Properties of Quadratic Functions... p Investigating Quadratic Functions... p. 6 in Vertex Form: Part 1
 Chapter 3 Quadratic Functions 3. Properties of Quadratic Functions........... p. 1 3.1 Investigating Quadratic Functions........... p. 6 in Vertex Form: Part 1 3.1 Investigating Quadratic Functions...........
Modesto City Schools. Secondary Math I. Module 1 Extra Help & Examples. Compiled by: Rubalcava, Christina
 Modesto City Schools Secondary Math I Module 1 Extra Help & Examples Compiled by: Rubalcava, Christina 1.1 Ready, Set, Go! Ready Topic: Recognizing a solution to an equation. The solution to an equation
15.1 Understanding Geometric
 Name Class Date 15.1 Understanding Geometric Sequences Essential Question: How are the terms of a geometric sequence related? Resource Locker Explore 1 Exploring Growth Patterns of Geometric Sequences
FIRST TERM EXAM REVISION WORKSHEET AY Grade 10 Mathematics. Algebra. Section A: Vocabulary
 FIRST TERM EXAM REVISION WORKSHEET AY 06-07 Grade 0 Mathematics Name: Section: Algebra Section A: Vocabulary Fill in the blanks using the words given in the following table: geometric sequence arithmetic
MINI LESSON. Lesson 1a Introduction to Functions
 MINI LESSON Lesson 1a Introduction to Functions Lesson Objectives: 1. Define FUNCTION 2. Determine if data sets, graphs, statements, or sets of ordered pairs define functions 3. Use proper function notation
Teaneck High School Algebra II Summer Assignment
 Teaneck High School Algebra II Summer Assignment Dear Parents and Students: This summer assignment must be completed prior to entering Algebra II in September of 2016-2017 school year. The packet includes
2.) What does this graph represent?
 What does this graph represent?") Standard: A-CED.2 Create equations in two or more variables to represent relationships between quantities; graph equations on coordinate axes with labels and scales. 1.) Write an equation for the graph
Standard: A-CED.2 Create equations in two or more variables to represent relationships between quantities; graph equations on coordinate axes with labels and scales. 1.) Write an equation for the graph
Gift Card Representations
 Name Gift Card Representations Charmaine received a gift card for $ worth of media downloads. The cost of each download is $.5. Complete each representation for this scenario below. The remaining balance
EXPLORE MATHEMATICS TEST
 EXPLORE MATHEMATICS TEST Table 4: The College Readiness The describe what students who score in the specified score ranges are likely to know and to be able to do. The help teachers identify ways of enhancing
10.3 vertex and max values with comparing functions 2016 ink.notebook. March 14, Vertex and Max Value & Page 101.
 10.3 vertex and max values with comparing functions 2016 ink.notebook Page 101 Page 102 10.3 Vertex and Value and Comparing Functions Algebra: Transformations of Functions Page 103 Page 104 Lesson Objectives
Name: Checking solutions of equations with graphing calculator Inequalities Translating to and from words
 Name: Midterm Review 2018-2019 Units 1, 2, 3, and 4 *Use notes, activities, quizzes, and tests to help remember how to solve problems* Unit 1: Patterns Graphing Extending the line? Connecting points? Title
You Try: Find the x-intercepts of f ( x) Find the roots (zeros, x-intercepts) of 2. x x. x 2. x 8 x x 2 8x 4 4x 32
 Find the roots (zeros, x-intercepts) of 2. x x. x 2. x 8 x x 2 8x 4 4x 32") 1 Find the roots (zeros, -intercepts) of 1 3. 1a Find the -intercepts of 5 1 We are looking for the solutions to Method 1: Factoring Using Guess & heck Using an rea Model, fill in a Generic Rectangle with
1 Find the roots (zeros, -intercepts) of 1 3. 1a Find the -intercepts of 5 1 We are looking for the solutions to Method 1: Factoring Using Guess & heck Using an rea Model, fill in a Generic Rectangle with
Algebra II. Slide 1 / 179. Slide 2 / 179. Slide 3 / 179. Rational Expressions & Equations. Table of Contents
 Slide 1 / 179 Slide 2 / 179 Algebra II Rational Expressions & Equations 2015-08-15 www.njctl.org Table of Contents Slide 3 / 179 Working with Rational Expressions Joint and Inverse Variation Simplifying
End of Year Test B. Whole Numbers, Decimals, and Integers. Fractions. Name Date END OF YEAR TEST B. Answers. 5x 2 3y 3x 2y 5 8, 5 2 3, 1
 Whole Numbers Decimals and Integers 1. Which list orders the integers from greatest to least? A. 15 8 1 0 B. 0 1 5 C. 18 12 7 D. 10 5 0 5 2. The coldest U.S. temperature on record occurred at Prospect
3.1. 3x 4y = 12 3(0) 4y = 12. 3x 4y = 12 3x 4(0) = y = x 0 = 12. 4y = 12 y = 3. 3x = 12 x = 4. The Rectangular Coordinate System
 4y = 12. 3x 4y = 12 3x 4(0) = y = x 0 = 12. 4y = 12 y = 3. 3x = 12 x = 4. The Rectangular Coordinate System") 3. The Rectangular Coordinate System Interpret a line graph. Objectives Interpret a line graph. Plot ordered pairs. 3 Find ordered pairs that satisfy a given equation. 4 Graph lines. 5 Find x- and y-intercepts.
3. The Rectangular Coordinate System Interpret a line graph. Objectives Interpret a line graph. Plot ordered pairs. 3 Find ordered pairs that satisfy a given equation. 4 Graph lines. 5 Find x- and y-intercepts.
Lesson 2: Analyzing a Data Set
 Student Outcomes Students recognize linear, quadratic, and exponential functions when presented as a data set or sequence, and formulate a model based on the data. Lesson Notes This lesson asks students
QUADRATICS Graphing Quadratic Functions Common Core Standard
 H Quadratics, Lesson 6, Graphing Quadratic Functions (r. 2018) QUADRATICS Graphing Quadratic Functions Common Core Standard Next Generation Standard F-IF.B.4 For a function that models a relationship between
Math 1314 Lesson 2. Continuing with the introduction to GGB
 Math 1314 Lesson 2 Continuing with the introduction to GGB 2 Example 10: The path of a small rocket is modeled by the function ht ( ) = 16t + 128t+ 12 where initial velocity is 128 feet per section and
Sample tasks from: Algebra Assessments Through the Common Core (Grades 6-12)
") Sample tasks from: Algebra Assessments Through the Common Core (Grades 6-12) A resource from The Charles A Dana Center at The University of Texas at Austin 2011 About the Dana Center Assessments More than
Sample tasks from: Algebra Assessments Through the Common Core (Grades 6-12) A resource from The Charles A Dana Center at The University of Texas at Austin 2011 About the Dana Center Assessments More than
Step 1. Use a ruler or straight-edge to determine a line of best fit. One example is shown below.
 Linear Models Modeling 1 ESSENTIALS Example Draw a straight line through the scatter plot so that the line represents a best fit approximation to the points. Then determine the equation for the line drawn.
Student Exploration: Quadratics in Polynomial Form
 Name: Date: Student Exploration: Quadratics in Polynomial Form Vocabulary: axis of symmetry, parabola, quadratic function, vertex of a parabola Prior Knowledge Questions (Do these BEFORE using the Gizmo.)
Chapter 2. Polynomial and Rational Functions. 2.2 Quadratic Functions
 Chapter 2 Polynomial and Rational Functions 2.2 Quadratic Functions 1 /27 Chapter 2 Homework 2.2 p298 1, 5, 17, 31, 37, 41, 43, 45, 47, 49, 53, 55 2 /27 Chapter 2 Objectives Recognize characteristics of
Sec 4.1 Coordinates and Scatter Plots. Coordinate Plane: Formed by two real number lines that intersect at a right angle.
 Algebra I Chapter 4 Notes Name Sec 4.1 Coordinates and Scatter Plots Coordinate Plane: Formed by two real number lines that intersect at a right angle. X-axis: The horizontal axis Y-axis: The vertical
Graphing Linear Functions
 Practice A Graphing Functions Complete the function tables. Then match the letter of each graph with the function table for its linear function. 1. y x 2 Graph: A x y x 2 y (x, y) 0 1 2 2. y x 2 Graph:
Lakeview Christian Academy Summer Math Packet For Students Entering Algebra 2
 Lakeview Christian Academy Summer Math Packet For Students Entering Algebra Student s Name This packet is designed for you to review your Algebra 1 skills and make sure you are well prepared for the start
The ball is at a height of 8 m at x = and x = b. Substitute that value into the equation:
 MPMD Day : Intro to Quadratic Equations... and solving them graphically. Task : The Quadratic Equation Warm-Up: The equation h = -0.05x + x represents the height, h, in metres of one kick of a soccer ball
Algebra 1 STAAR EOC Review #9 Reporting Category 5: Quadratic and Other Nonlinear Functions
 Name Class Date RC9 A.09B Algebra 1 STAAR EOC Review #9 Reporting Category 5: Quadratic and Other Nonlinear Functions 1. Which shows the functions correctly listed in order from widest to narrowest graph?
Graphs of Exponential
 Graphs of Exponential Functions By: OpenStaxCollege As we discussed in the previous section, exponential functions are used for many realworld applications such as finance, forensics, computer science,
STRAIGHT LINE GRAPHS THE COORDINATES OF A POINT. The coordinates of any point are written as an ordered pair (x, y)
") THE COORDINATES OF A POINT STRAIGHT LINE GRAPHS The coordinates of any point are written as an ordered pair (x, y) Point P in the diagram has coordinates (2, 3). Its horizontal distance along the x axis
THE COORDINATES OF A POINT STRAIGHT LINE GRAPHS The coordinates of any point are written as an ordered pair (x, y) Point P in the diagram has coordinates (2, 3). Its horizontal distance along the x axis
STANDARDS OF LEARNING CONTENT REVIEW NOTES ALGEBRA I. 2 nd Nine Weeks,
 STANDARDS OF LEARNING CONTENT REVIEW NOTES ALGEBRA I 2 nd Nine Weeks, 2016-2017 1 OVERVIEW Algebra I Content Review Notes are designed by the High School Mathematics Steering Committee as a resource for
Algebra I Notes Graphs of Functions OBJECTIVES: F.IF.A.1 Understand the concept of a function and use function notation. F.IF.A.2.
 OBJECTIVES: F.IF.A.1 Understand the concept of a function and use function notation. Understand that a function from one set (called the domain) to another set (called the range) assigns to each element
Name: Algebra. Unit 8. Quadratic. Functions
 Name: Algebra Unit 8 Quadratic Functions Quadratic Function Characteristics of the Graph: Maximum Minimum Parent Function Equation: Vertex How many solutions can there be? They mean what? What does a do?
2.1 Solutions to Exercises
 Last edited 9/6/17.1 Solutions to Exercises 1. P(t) = 1700t + 45,000. D(t) = t + 10 5. Timmy will have the amount A(n) given by the linear equation A(n) = 40 n. 7. From the equation, we see that the slope
Objectives and Homework List
 MAC 1140 Objectives and Homework List Each objective covered in MAC1140 is listed below. Along with each objective is the homework list used with MyMathLab (MML) and a list to use with the text (if you
Voluntary State Curriculum Algebra II
 Algebra II Goal 1: Integration into Broader Knowledge The student will develop, analyze, communicate, and apply models to real-world situations using the language of mathematics and appropriate technology.
Common Core Algebra 2. Chapter 1: Linear Functions
 Common Core Algebra 2 Chapter 1: Linear Functions 1 1.1 Parent Functions and Transformations Essential Question: What are the characteristics of some of the basic parent functions? What You Will Learn
Mathematics in Context
 Level 3 Units Overview Mathematics in Context Level 3 Level 3: Order of Implementation and Pacing Guide Revisiting Numbers Scientific notation; unit rates; operations with rational numbers 15 days Ups