2.3. Graphing Calculators; Solving Equations and Inequalities Graphically
|
|
|
- Heather Lawson
- 6 years ago
- Views:
Transcription
1 2.3 Graphing Calculators; Solving Equations and Inequalities Graphically
2 Solving Equations and Inequalities Graphically To do this, we must first draw a graph using a graphing device, this is your TI-83/84 calculator. You should know how to use it to graph several equations at once Y=, WINDOW, ZOOM, TRACE, GRAPH buttons You should also know the second function of each of these buttons, particularly FORMAT, CALC and TABLE
3 Viewing Rectangle A graphing calculator or computer displays a rectangular portion of the graph of an equation in a display window or viewing screen. We call this a viewing rectangle, find it by selecting WINDOW
4 Viewing Rectangle Let s choose: The x-values to range from a minimum value of Xmin = a to a maximum value of Xmax = b The y-values to range from a minimum value of Ymin = c to a maximum value of Ymax = d.
![Viewing Rectangle Then, the displayed portion of the graph lies in the rectangle [a, b] x](/docs-images/74/70551037/images/5-0.jpg "[c, d] = {(x, y) a x b, c y d} We refer to this as the [a, b] by [c, d] viewing rectangle.")
5 Viewing Rectangle Then, the displayed portion of the graph lies in the rectangle [a, b] x [c, d] = {(x, y) a x b, c y d} We refer to this as the [a, b] by [c, d] viewing rectangle.
6 Two Graphs on the Same Screen Graph the equations y = 3x 2 6x + 1 and y = 0.23x 2.25 together in the viewing rectangle [1, 3] by [ 2.5, 1.5] Enter on of these above as y 1 and the other as y 2 Press the GRAPH button to see both of these equations Do the graphs intersect in this viewing rectangle?

7 Two Graphs on the Same Screen The figure shows the essential features of both graphs. One is a parabola and the other is a line. It looks as if the graphs intersect near the point (1, 2).

8 Two Graphs on the Same Screen Use the ZOOM button to ZOOM in or create a ZOOMbox around the point to see what is really happening
9 Using a Graphing Calculator Most graphing calculators can only graph equations in which y is isolated on one side of the equal sign. The next example shows how to graph equations that don t have this property.
10 Graphing a Circle Graph the circle x 2 + y 2 = 1. We first solve for y to isolate it on one side of the equal sign. y 2 = 1 x 2 (Subtract x 2 ) y = ± (Take square roots)
11 Graphing a Circle Thus, the circle is described by the graphs of two equations: The first equation represents the top half of the circle (because y 0). The second represents the bottom half (y 0).
![Graphing a Circle If we graph the first equation in the viewing rectangle [ 2, 2] by [ 2, 2], we get the semicircle shown.](/docs-images/74/70551037/images/12-1.jpg "The graph of the second equation is the semicircle shown.")
12 Graphing a Circle If we graph the first equation in the viewing rectangle [ 2, 2] by [ 2, 2], we get the semicircle shown. The graph of the second equation is the semicircle shown. Graphing these semicircles together on the same viewing screen, we get the full circle shown.
13 Solving Equations Graphically
14 Solving Equations Algebraically In Chapter 1, we learned how to solve equations. To solve an equation like 3x 5 = 0, we used the algebraic method. This means we used the rules of algebra to isolate x on one side of the equation.
15 Solving Equations Algebraically We view x as an unknown and we use the rules of algebra to hunt it down. Here are the steps: 3x 5 = 0 3x = 5 (Add 5) x = 5/3 (Divide by 3)
16 Solving Equations Graphically We can also solve this equation by the graphical method. We view x as a variable and sketch the graph of the equation y = 3x 5. Different values for x give different values for y. Our goal is to find the value of x for which y = 0.
17 Solving Equations Graphically From the graph, we see that y = 0 when x 1.7. The solution is x 1.7.

18 Solving Equations Graphically We summarize these methods here.
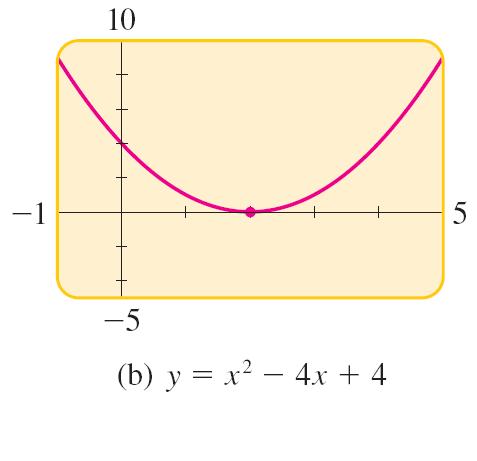
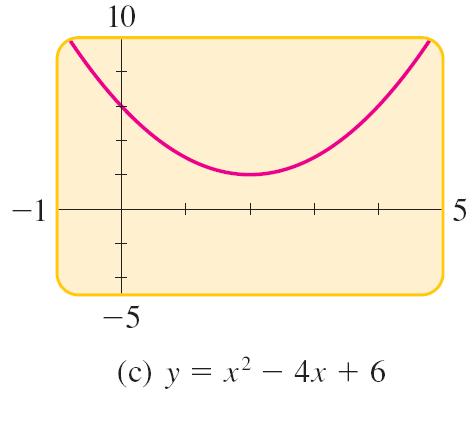
19 Solving a Quadratic Equation Solve the quadratic equations algebraically and graphically. (a) x 2 4x + 2 = 0 (b) x 2 4x + 4 = 0 (c) x 2 4x + 6 = 0
20 Solving Algebraically There are two solutions:
21 Solving Algebraically There is just one solution, x = 2.
22 Solving Algebraically There is no real solution.
23 Solving Graphically Now, see the power of graphing the equations as simultaneous equations in your calculator y = x 2 4x + 2 y = x 2 4x + 4 y = x 2 4x + 6 By determining the x-intercepts of the graphs, we find the following solutions. In our calculator, this is found when you do the CALC function which the second TRACE
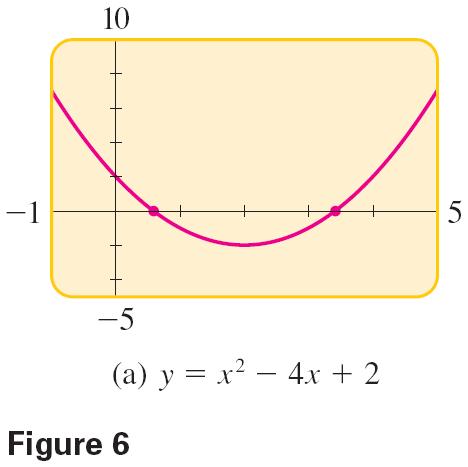
24 Solving Graphically Example (a) x 0.6 and x 3.4
25 Solving Quadratic Equations Graphically There is no x-intercept for that last one, you can see it does not cross the x-axis therefore the equation has no solution. The graphs in Figure 6 show visually why a quadratic equation may have two solutions, one solution, or no real solution.
26 Solving Equations Graphically In the next example, we use the graphical method to solve an equation that is extremely difficult to solve algebraically.
27 E.g. 6 Solving an Equation in an Interval Solve the equation in the interval [1, 6]. We need to find all solutions x that satisfy 1 x 6. So, we will graph the equation in a viewing rectangle for which the x-values are restricted to this interval.
28 Solving an Equation in an Interval The figure shows the graph of the equation in the viewing rectangle [1, 6] by [ 5, 5]. There are two x-intercepts in this rectangle.


29 Solving an Equation in an Interval To find the x-intercepts on your calculator Use CALC, select 2 for zero Put the cursor before and after each point and put your guess around the intercept Do you see why you need to do this twice? 1 2
30 Solving an Equation in an Interval Zooming in, we see that the solutions are: x and x 3.72
31 Solving Inequalities Graphically
32 Solving Inequalities Graphically To solve the inequality graphically, we draw the graph of y = x 2 5x + 6. Our goal is to find those values of x for which y 0.

33 Solving Inequalities Graphically These are simply the x-values for which the graph lies below the x-axis. We see that the solution of the inequality is the interval [2, 3].
34 Solving an Inequality Graphically Solve the inequality 3.7x x x Ouch, hard algebraically but pretty easy on the calculator graphically
35 Solving an Inequality Graphically We graph the equations in the same viewing rectangle. y 1 = 3.7x x 1.9 y 2 = x
36 Solving an Inequality Graphically We are interested in those values of x for which y 1 y 2. The solution are points for which the graph of y 2 (blue) lies on or above the graph of y 1 (red) You could pick a point to test, maybe the origin?? You try it.
37 E.g. 9 Solving an Inequality Graphically Solve the inequality x 3 5x 2 8 We write the inequality as: x 3 5x

38 E.g. 9 Solving an Inequality Graphically Then, we graph the equation y = x 3 5x in the viewing rectangle [ 6, 6] by [ 15, 15] The solution consists of those intervals on which the graph lies on or above the x-axis.
Graphing with a Graphing Calculator
 APPENDIX C Graphing with a Graphing Calculator A graphing calculator is a powerful tool for graphing equations and functions. In this appendix we give general guidelines to follow and common pitfalls to
EXAMPLE. 1. Enter y = x 2 + 8x + 9.
 VI. FINDING INTERCEPTS OF GRAPHS As we have seen, TRACE allows us to find a specific point on the graph. Thus TRACE can be used to solve a number of important problems in algebra. For example, it can be
Basic Graphing on TI 83 / 84
 Basic Graphing on TI 83 / 84 A graphing calculator can, of course, graph but only from an equation in function form. That means each equation must be solved for "y". The first activity is to practice solving
6 Using Technology Wisely
 6 Using Technology Wisely Concepts: Advantages and Disadvantages of Graphing Calculators How Do Calculators Sketch Graphs? When Do Calculators Produce Incorrect Graphs? The Greatest Integer Function Graphing
Calculator Basics TI-83, TI-83 +, TI-84. Index Page
 Calculator Basics TI-83, TI-83 +, TI-84 Index Page Getting Started Page 1 Graphing Page 2 Evaluating Functions page 4 Minimum and Maximum Values Page 5 Table of Values Page 6 Graphing Scatter Plots Page
FUNCTIONS AND MODELS
 1 FUNCTIONS AND MODELS FUNCTIONS AND MODELS In this section, we assume that you have access to a graphing calculator or a computer with graphing software. FUNCTIONS AND MODELS 1.4 Graphing Calculators
Lesson 8 - Practice Problems
 Lesson 8 - Practice Problems Section 8.1: A Case for the Quadratic Formula 1. For each quadratic equation below, show a graph in the space provided and circle the number and type of solution(s) to that
Table of contents. Jakayla Robbins & Beth Kelly (UK) Precalculus Notes Fall / 27
 Precalculus Notes Fall / 27") Table of contents Using Technology Wisely Connecting the Dots. Is This Always a Good Plan? Basic Instructions for the Graphing Calculator Using Technology to Find Approximate Solutions of Equations in
Table of contents Using Technology Wisely Connecting the Dots. Is This Always a Good Plan? Basic Instructions for the Graphing Calculator Using Technology to Find Approximate Solutions of Equations in
THE MATHEMATICS DIVISION OF LEHIGH CARBON COMMUNITY COLLEGE PRESENTS. WORKSHOP II Graphing Functions on the TI-83 and TI-84 Graphing Calculators
 THE MATHEMATICS DIVISION OF LEHIGH CARBON COMMUNITY COLLEGE PRESENTS WORKSHOP II Graphing Functions on the TI-83 and TI-84 Graphing Calculators Graphing Functions on the TI-83 or 84 Graphing Calculators
Chpt 1. Functions and Graphs. 1.1 Graphs and Graphing Utilities 1 /19
 Chpt 1 Functions and Graphs 1.1 Graphs and Graphing Utilities 1 /19 Chpt 1 Homework 1.1 14, 18, 22, 24, 28, 42, 46, 52, 54, 56, 78, 79, 80, 82 2 /19 Objectives Functions and Graphs Plot points in the rectangular
Quadratics Functions: Review
 Quadratics Functions: Review Name Per Review outline Quadratic function general form: Quadratic function tables and graphs (parabolas) Important places on the parabola graph [see chart below] vertex (minimum
SKILL: Fraction arithmetic and reducing fractions back to top
 Table of Contents 050 Skills 1) Fraction Arithmetic 2) Check Solution 3) Graphing and Ordered Pairs 4) Finding Intercepts From a Graph 5) Solve a System of Equations 6) Evaluate an Expression with Exponents
Section 6.1: Quadratic Functions and their Characteristics Vertical Intercept Vertex Axis of Symmetry Domain and Range Horizontal Intercepts
 Lesson 6 Quadratic Functions and Equations Lesson 6 Quadratic Functions and Equations We are leaving exponential functions behind and entering an entirely different world. As you work through this lesson,
Chapter. Graph Solve. 9-1 Before Using Graph Solve 9-2 Analyzing a Function Graph 9-3 Graph Solve Precautions
 Chapter Graph Solve You can use any of the following methods to analyze function graphs and approximate results. Root extraction Determination of the maximum and minimum Determination of the y-intercept
UNIT 5 QUADRATIC FUNCTIONS Lesson 6: Analyzing Quadratic Functions Instruction
 Prerequisite Skills This lesson requires the use of the following skills: factoring quadratic expressions finding the vertex of a quadratic function Introduction We have studied the key features of the
Chapter. Graph-to-Table
 Chapter Graph-to-Table With this function, the screen shows both a graph and a table. You can move a pointer around the graph and store its current coordinates inside the table whenever you want. This
You should be able to plot points on the coordinate axis. You should know that the the midpoint of the line segment joining (x, y 1 1
 Name GRAPHICAL REPRESENTATION OF DATA: You should be able to plot points on the coordinate axis. You should know that the the midpoint of the line segment joining (x, y 1 1 ) and (x, y ) is x1 x y1 y,.
TI-83 Graphing Functions & Relations
 To graph a function: 1. The equation must be written in functional notation in explicit (or y equals ) form. (Y is the dependent variable and X is the independent variable.) For instance, we may need to
GRAPHING CALCULATOR - WINDOW SIZING
 Section 1.1 GRAPHING CALCULATOR - WINDOW SIZING WINDOW BUTTON. Xmin= Xmax= Xscl= Ymin= Ymax= Yscl= Xres=resolution, smaller number= clearer graph Larger number=quicker graphing Xscl=5, Yscal=1 Xscl=10,
9.1 Linear Inequalities in Two Variables Date: 2. Decide whether to use a solid line or dotted line:
 9.1 Linear Inequalities in Two Variables Date: Key Ideas: Example Solve the inequality by graphing 3y 2x 6. steps 1. Rearrange the inequality so it s in mx ± b form. Don t forget to flip the inequality
Using a Scientific Calculator
 Using a Scientific Calculator Hardware on the TI-89 How much memory does the TI 89 have? The TI-89 has 188k of RAM and 384k of memory that can be used for archiving programs, making a total memory of 572k
Getting Started with the TI-83/TI-84 Plus Family of Calculators
 Appendix C Getting Started with the TI-83/TI-84 Plus Family of Calculators ON-OFF To turn on the calculator, press the ON key. To turn off the calculator, press 2nd and then ON. Most keys on the calculator
3.1 INTRODUCTION TO THE FAMILY OF QUADRATIC FUNCTIONS
 3.1 INTRODUCTION TO THE FAMILY OF QUADRATIC FUNCTIONS Finding the Zeros of a Quadratic Function Examples 1 and and more Find the zeros of f(x) = x x 6. Solution by Factoring f(x) = x x 6 = (x 3)(x + )
0.7 Graphing Features: Value (Eval), Zoom, Trace, Maximum/Minimum, Intersect
, Zoom, Trace, Maximum/Minimum, Intersect") 0.7 Graphing Features: Value (Eval), Zoom, Trace, Maximum/Minimum, Intersect Value (TI-83 and TI-89), Eval (TI-86) The Value or Eval feature allows us to enter a specific x coordinate and the cursor moves
0.7 Graphing Features: Value (Eval), Zoom, Trace, Maximum/Minimum, Intersect Value (TI-83 and TI-89), Eval (TI-86) The Value or Eval feature allows us to enter a specific x coordinate and the cursor moves
X-values are restricted to [Xmin,Xmax].
![X-values are restricted to [Xmin,Xmax].](/thumbs/87/95044733.jpg "X-values are restricted to [Xmin,Xmax].") A. TRACE Working With A Graph TRACE is a very useful tool in graph analyses. Even when a graph is not visible, you can use TRACE to find Y-values. When using TRACE, the X-values are restricted to the interval
A. TRACE Working With A Graph TRACE is a very useful tool in graph analyses. Even when a graph is not visible, you can use TRACE to find Y-values. When using TRACE, the X-values are restricted to the interval
An Introduction to Graphing Calculator Basics: Graphing Functions and Solving Equations
 An Introduction to Graphing Calculator Basics: Graphing Functions and Solving Equations Audience: Teachers of mathematics who have little or no experience with graphing calculators. Required Technology:
2.1 Basics of Functions and Their Graphs
 .1 Basics of Functions and Their Graphs Section.1 Notes Page 1 Domain: (input) all the x-values that make the equation defined Defined: There is no division by zero or square roots of negative numbers
Function Transformations and Symmetry
 CHAPTER Function Transformations and Symmetry The first well-documented postal system was in ancient Rome, where mail was carried by horsedrawn carriages and ox-drawn wagons. The US Postal Service delivers
Not for reproduction
 x=a GRAPHING CALCULATORS AND COMPUTERS (a, d ) y=d (b, d ) (a, c ) y=c (b, c) (a) _, by _, 4 x=b FIGURE 1 The viewing rectangle a, b by c, d _4 4 In this section we assume that you have access to a graphing
WHAT YOU SHOULD LEARN
 GRAPHS OF EQUATIONS WHAT YOU SHOULD LEARN Sketch graphs of equations. Find x- and y-intercepts of graphs of equations. Use symmetry to sketch graphs of equations. Find equations of and sketch graphs of
Lesson 8 Introduction to Quadratic Functions
 Lesson 8 Introduction to Quadratic Functions We are leaving exponential and logarithmic functions behind and entering an entirely different world. As you work through this lesson, you will learn to identify
The x coordinate tells you how far left or right from center the point is. The y coordinate tells you how far up or down from center the point is.
 We will review the Cartesian plane and some familiar formulas. College algebra Graphs 1: The Rectangular Coordinate System, Graphs of Equations, Distance and Midpoint Formulas, Equations of Circles Section
Graphical Solutions (How to solve equations graphically; how to find intersection of two lines)
") Graphical Solutions (How to solve equations graphically; how to find intersection of two lines) Dr. Gisela Acosta-Carr. (8-page document) Let us review: Solve the equation 2x + 1 = 7 algebraically. First,
Graphical Solutions (How to solve equations graphically; how to find intersection of two lines) Dr. Gisela Acosta-Carr. (8-page document) Let us review: Solve the equation 2x + 1 = 7 algebraically. First,
Section 1.6. Inverse Functions
 Section 1.6 Inverse Functions Important Vocabulary Inverse function: Let f and g be two functions. If f(g(x)) = x in the domain of g and g(f(x) = x for every x in the domain of f, then g is the inverse
MATH SPEAK - TO BE UNDERSTOOD AND MEMORIZED DETERMINING THE INTERSECTIONS USING THE GRAPHING CALCULATOR
 FOM 11 T15 INTERSECTIONS & OPTIMIZATION PROBLEMS - 1 1 MATH SPEAK - TO BE UNDERSTOOD AND MEMORIZED 1) INTERSECTION = a set of coordinates of the point on the grid where two or more graphed lines touch
Graphing Calculator Workshop
 Graphing Calculator Workshop Marian K. Hukle, hukle@math.ku.edu; Amy Kim, akim@math.ku.edu; Chris Valle, cvalle@math.ku.edu POWER ON/OFF ON to turn on calculator. 2nd OFF to turn off calculator. SCREEN
Unit: Quadratic Functions
 Unit: Quadratic Functions Learning increases when you have a goal to work towards. Use this checklist as guide to track how well you are grasping the material. In the center column, rate your understand
Quadratic Functions. Full Set of Notes. No Solutions
 Quadratic Functions Full Set of Notes No Solutions Graphing Quadratic Functions The graph of a quadratic function is called a parabola. Applications of Parabolas: http://www.doe.virginia.gov/div/winchester/jhhs/math/lessons/calc2004/appparab.html
Quadratic Functions. *These are all examples of polynomial functions.
 Look at: f(x) = 4x-7 f(x) = 3 f(x) = x 2 + 4 Quadratic Functions *These are all examples of polynomial functions. Definition: Let n be a nonnegative integer and let a n, a n 1,..., a 2, a 1, a 0 be real
More Ways to Solve & Graph Quadratics The Square Root Property If x 2 = a and a R, then x = ± a
 More Ways to Solve & Graph Quadratics The Square Root Property If x 2 = a and a R, then x = ± a Example: Solve using the square root property. a) x 2 144 = 0 b) x 2 + 144 = 0 c) (x + 1) 2 = 12 Completing
NEW CONCEPTS LEARNED IN THIS LESSON INCLUDE: Fundamental Theorem of Algebra
 2.5. Graphs of polynomial functions. In the following lesson you will learn to sketch graphs by understanding what controls their behavior. More precise graphs will be developed in the next two lessons
Section 1.1 Graphs Graphs
 Section 1.1 Graphs 55 1.1 Graphs Much of algebra is concerned with solving equations. Many algebraic techniques have been developed to provide insights into various sorts of equations, and those techniques
Lesson 1: Analyzing Quadratic Functions
 UNIT QUADRATIC FUNCTIONS AND MODELING Lesson 1: Analyzing Quadratic Functions Common Core State Standards F IF.7 F IF.8 Essential Questions Graph functions expressed symbolically and show key features
MATHS METHODS QUADRATICS REVIEW. A reminder of some of the laws of expansion, which in reverse are a quick reference for rules of factorisation
 MATHS METHODS QUADRATICS REVIEW LAWS OF EXPANSION A reminder of some of the laws of expansion, which in reverse are a quick reference for rules of factorisation a) b) c) d) e) FACTORISING Exercise 4A Q6ace,7acegi
Organizing and Summarizing Data
 Section 2.2 9 Organizing and Summarizing Data Section 2.2 C H A P T E R 2 4 Example 2 (pg. 72) A Histogram for Discrete Data To create a histogram, you have two choices: 1): enter all the individual data
Graphing Calculator How To Packet
 Graphing Calculator How To Packet The following outlines some of the basic features of your TI Graphing Calculator. The graphing calculator is a useful tool that will be used extensively in this class
UNIT 3B CREATING AND GRAPHING EQUATIONS Lesson 4: Solving Systems of Equations Instruction
 Prerequisite Skills This lesson requires the use of the following skills: graphing multiple equations on a graphing calculator graphing quadratic equations graphing linear equations Introduction A system
Box It Up (A Graphical Look)
") . Name Date A c t i v i t y 1 0 Box It Up (A Graphical Look) The Problem Ms. Hawkins, the physical sciences teacher at Hinthe Middle School, needs several open-topped boxes for storing laboratory materials.
. Name Date A c t i v i t y 1 0 Box It Up (A Graphical Look) The Problem Ms. Hawkins, the physical sciences teacher at Hinthe Middle School, needs several open-topped boxes for storing laboratory materials.
APPENDICES. APPENDIX A Calculus and the TI-82 Calculator. Functions. Specific Window Settings
 APPENDICES APPENDIX A Calculus and the TI-82 Calculator Functions A. Define a function Press y= to obtain Y= edit screen. Cursor down to the function to be defined. (Press clear if the function is to be
Lesson 6 - Practice Problems
 Lesson 6 - Practice Problems Section 6.1: Characteristics of Quadratic Functions 1. For each of the following quadratic functions: Identify the coefficients a, b and c. Determine if the parabola opens
Falling Balls. Names: Date: About this Laboratory
 Falling Balls Names: Date: About this Laboratory In this laboratory,1 we will explore quadratic functions and how they relate to the motion of an object that is dropped from a specified height above ground
Graphing Calculator Graphing with the TI-85
 Graphing Calculator Graphing with the TI-85 I. Introduction The TI-85 has fifty keys, many of which will perform multiple functions when used in combination. Each key has a symbol printed on its face.
Pure Math 30: Explained!
 www.puremath30.com 5 Conics Lesson Part I - Circles Circles: The standard form of a circle is given by the equation (x - h) +(y - k) = r, where (h, k) is the centre of the circle and r is the radius. Example
f( x ), or a solution to the equation f( x) 0. You are already familiar with ways of solving
, or a solution to the equation f( x) 0. You are already familiar with ways of solving") The Bisection Method and Newton s Method. If f( x ) a function, then a number r for which f( r) 0 is called a zero or a root of the function f( x ), or a solution to the equation f( x) 0. You are already
The Bisection Method and Newton s Method. If f( x ) a function, then a number r for which f( r) 0 is called a zero or a root of the function f( x ), or a solution to the equation f( x) 0. You are already
Appendix A Using a Graphing Calculator. Section 4: The CALCULATE Menu
 Appendix A Using a Graphing Calculator Section 4: The CALCULATE Menu The CALC menu provides access to many features that will be regularly used in the class. value returns a single y value when the user
HOD: WISKUNDE-DIDAKTIEK 174
 HOD: WISKUNDE-DIDAKTIEK 174 HUISWERK 3 DIE GRAFIESE SAKREKENAAR VENSTER Werk deur die tutoriaal... Handig slegs jou antwoorde vir ACTIVITIES, vrae 1-11 in. Illustreer met handsketse... 1 TUTORIAL: WHICH
Chapter 1. Linear Equations and Straight Lines. 2 of 71. Copyright 2014, 2010, 2007 Pearson Education, Inc.
 Chapter 1 Linear Equations and Straight Lines 2 of 71 Outline 1.1 Coordinate Systems and Graphs 1.4 The Slope of a Straight Line 1.3 The Intersection Point of a Pair of Lines 1.2 Linear Inequalities 1.5
Lesson 4 Exponential Functions I
 Lesson 4 Exponential Functions I Lesson 4 Exponential Functions I Exponential functions play a major role in our lives. Population growth and disease processes are real-world problems that involve exponential
GRAPHING CALCULATOR REFERENCE BOOK
 John T. Baker Middle School GRAPHING CALCULATOR REFERENCE BOOK Name: Teacher: - 1 - To Graph an Equation: Graphing Linear Equations 1.) Press Y= and enter the equation into Y 1. 2.) To see the graph in
Math 1113 Notes - Quadratic Functions
 Math 1113 Notes - Quadratic Functions Philippe B. Laval Kennesaw State University September 7, 000 Abstract This handout is a review of quadratic functions. It includes a review of the following topics:
Texas Instruments TI-86 Graphics Calculator. Getting started with the TI-86
 Part III: Texas Instruments TI-86 Graphics Calculator III.1 Getting started with the TI-86 III.1.1 Basics: Press the ON key to begin using your TI-86 calculator. If you need to adjust the display contrast,
Finding the axis of symmetry, vertex, and roots of a parabola
 Finding the axis of symmetry, vertex, and roots of a parabola 1) Find the Axis of Symmetry of y = x 2-4x + 3 (The AOS is the vertical line that splits the parabola in 2 equal parts) Axis of Symmetry Axis
Chapter 3 Practice Test
 1. Complete parts a c for each quadratic function. a. Find the y-intercept, the equation of the axis of symmetry, and the x-coordinate of the vertex. b. Make a table of values that includes the vertex.
Whole Group: Basics of Graphing on your TI Calculator
 Whole Group: Basics of Graphing on your TI Calculator 1. Start by pressing the Y= key on the upper left of your calculator. Notice that there are 10 different lines to write; this means that it is possible
Module 3: Graphing Quadratic Functions
 Haberman MTH 95 Section V Quadratic Equations and Functions Module 3 Graphing Quadratic Functions In this module, we'll review the graphing quadratic functions (you should have studied the graphs of quadratic
Section 18-1: Graphical Representation of Linear Equations and Functions
 Section 18-1: Graphical Representation of Linear Equations and Functions Prepare a table of solutions and locate the solutions on a coordinate system: f(x) = 2x 5 Learning Outcome 2 Write x + 3 = 5 as
Types of Functions Here are six common types of functions and examples of each. Linear Quadratic Absolute Value Square Root Exponential Reciprocal
 Topic 2.0 Review Concepts What are non linear equations? Student Notes Unit 2 Non linear Equations Types of Functions Here are six common types of functions and examples of each. Linear Quadratic Absolute
12.1 Getting Started with the TI-86
 CHAPTER 1 TEXAS INSTRUMENTS TI-86 1.1 Getting Started with the TI-86 1.1.1 Basics: Press the ON key to begin using your TI-86. If you need to adjust the display contrast, first press nd, then press and
Quadratic Functions Dr. Laura J. Pyzdrowski
 1 Names: (8 communication points) About this Laboratory A quadratic function in the variable x is a polynomial where the highest power of x is 2. We will explore the domains, ranges, and graphs of quadratic
Texas Instruments TI-89 Graphing Calculator. Getting started with the TI-89
 Part IV: Texas Instruments TI-89 Graphing Calculator IV.1 Getting started with the TI-89 In this guide, the key with the green diamond symbol inside a green border will be indicated by, the key with the
Maximizing Volume: The Box Example
 Maximizing Volume: The Box Example Names: Date: About this Laboratory You will construct a box from a sheet of paper with dimensions 8.5 inches x 11 inches by cutting congruent squares from each corner
TI-89 Calculator Workshop #1 The Basics
 page 1 TI-89 Calculator Workshop #1 The Basics After completing this workshop, students will be able to: 1. find, understand, and manipulate keys on the calculator keyboard 2. perform basic computations
Lesson 8 Practice Problems
 Name: Date: Lesson 8 Section 8.1: Characteristics of Quadratic Functions 1. For each of the following quadratic functions: Identify the coefficients a, b, c Determine if the parabola opens up or down and
Contents 10. Graphs of Trigonometric Functions
 Contents 10. Graphs of Trigonometric Functions 2 10.2 Sine and Cosine Curves: Horizontal and Vertical Displacement...... 2 Example 10.15............................... 2 10.3 Composite Sine and Cosine
ACTIVITY 8. The Bouncing Ball. You ll Need. Name. Date. 1 CBR unit 1 TI-83 or TI-82 Graphing Calculator Ball (a racquet ball works well)
") . Name Date ACTIVITY 8 The Bouncing Ball If a ball is dropped from a given height, what does a Height- Time graph look like? How does the velocity change as the ball rises and falls? What affects the shape
. Name Date ACTIVITY 8 The Bouncing Ball If a ball is dropped from a given height, what does a Height- Time graph look like? How does the velocity change as the ball rises and falls? What affects the shape
WK # Given: f(x) = ax2 + bx + c
 = ax2 + bx + c") Alg2H Chapter 5 Review 1. Given: f(x) = ax2 + bx + c Date or y = ax2 + bx + c Related Formulas: y-intercept: ( 0, ) Equation of Axis of Symmetry: x = Vertex: (x,y) = (, ) Discriminant = x-intercepts: When
Alg2H Chapter 5 Review 1. Given: f(x) = ax2 + bx + c Date or y = ax2 + bx + c Related Formulas: y-intercept: ( 0, ) Equation of Axis of Symmetry: x = Vertex: (x,y) = (, ) Discriminant = x-intercepts: When
Algebra II Quadratic Functions
 1 Algebra II Quadratic Functions 2014-10-14 www.njctl.org 2 Ta b le o f C o n te n t Key Terms click on the topic to go to that section Explain Characteristics of Quadratic Functions Combining Transformations
SM2H 4.3 HW- Writing Quadratic Equations
 SM2H Name: Period: SM2H 4.3 HW- Writing Quadratic Equations For each of the parabolas described below, write a quadratic equation in Vertex Form. SHOW ALL YOUR WORK. 1. Vertex: ( 0, 6 ), passes through
Analyzing Change: Extrema and Points of Inflection & 5.1 Optimization
 Chapter 5 Analyzing Change: Extrema and Points of Inflection & 5.1 Optimization Your calculator can be very helpful in checking your analytic work when you find optimal points and points of inflection.
Lesson 10 Rational Functions and Equations
 Lesson 10 Rational Functions and Equations Lesson 10 Rational Functions and Equations In this lesson, you will embark on a study of rational functions. Rational functions look different because they are
Objectives. Materials
 . Objectives Activity 10 To determine the relationship between the stretch of a spring and the number of weights in a cup suspended from the spring To find the y value of a function, given the x value
Calculator Supplement for TI-82/83 # 0 Introduction # 1 Computations # 2 Tables of Values # 3 Graphing # 4 The Calculate Submenu
 11/00, revised 3/02, 6/04, 10/05 JCD Calculator Supplement for TI-82/83 # 0 Introduction # 1 Computations # 2 Tables of Values # 3 Graphing # 4 The Calculate Submenu # 1 Introduction A. Double Action of
Final Exam Review Algebra Semester 1
 Final Exam Review Algebra 015-016 Semester 1 Name: Module 1 Find the inverse of each function. 1. f x 10 4x. g x 15x 10 Use compositions to check if the two functions are inverses. 3. s x 7 x and t(x)
9.1: GRAPHING QUADRATICS ALGEBRA 1
 9.1: GRAPHING QUADRATICS ALGEBRA 1 OBJECTIVES I will be able to graph quadratics: Given in Standard Form Given in Vertex Form Given in Intercept Form What does the graph of a quadratic look like? https://www.desmos.com/calculator
MATH 0310 Graphing Calculator Supplement
 All instructions reference the TI83/84 family of calculators. All graphs shown use the viewing window x: [-10, 10], y: [-10, 10]. Solving an Equation MATH 0310 Graphing Calculator Supplement The equation
,!7IA3C1-cjfcei!:t;K;k;K;k ISBN Graphing Calculator Reference Card. Addison-Wesley s. Basics. Created in conjuction with
 Addison-Wesley s Graphing Calculator Reference Card Created in conjuction with Basics Converting Fractions to Decimals The calculator will automatically convert a fraction to a decimal. Type in a fraction,
Notes Packet on Quadratic Functions and Factoring Graphing quadratic equations in standard form, vertex form, and intercept form.
 Notes Packet on Quadratic Functions and Factoring Graphing quadratic equations in standard form, vertex form, and intercept form. A. Intro to Graphs of Quadratic Equations:! = ax + bx + c A is a function
Unit #3: Quadratic Functions Lesson #13: The Almighty Parabola. Day #1
 Algebra I Unit #3: Quadratic Functions Lesson #13: The Almighty Parabola Name Period Date Day #1 There are some important features about the graphs of quadratic functions we are going to explore over the
But a vertex has two coordinates, an x and a y coordinate. So how would you find the corresponding y-value?
 We will work with the vertex, orientation, and x- and y-intercepts of these functions. Intermediate algebra Class notes More Graphs of Quadratic Functions (section 11.6) In the previous section, we investigated
Chapter 2 Scatter Plots and Introduction to Graphing
 Chapter 2 Scatter Plots and Introduction to Graphing 2.1 Scatter Plots Relationships between two variables can be visualized by graphing data as a scatter plot. Think of the two list as ordered pairs.
Chapter 1 Histograms, Scatterplots, and Graphs of Functions
 Chapter 1 Histograms, Scatterplots, and Graphs of Functions 1.1 Using Lists for Data Entry To enter data into the calculator you use the statistics menu. You can store data into lists labeled L1 through
Quadratic Equations Group Acitivity 3 Business Project Week #5
 MLC at Boise State 013 Quadratic Equations Group Acitivity 3 Business Project Week #5 In this activity we are going to further explore quadratic equations. We are going to analyze different parts of the
Chapter. Implicit Function Graphs
 Chapter 14 Implicit Function Graphs You can graph any one of the following types of implicit functions using the calculator s built-in functions. Parabolic graph Circle graph Elliptical graph Hyperbolic
EASY STEPS TO SUCCESS: A GRAPHING CALCULATOR GUIDE
 EASY STEPS TO SUCCESS: A GRAPHING CALCULATOR GUIDE TO ACCOMPANY MATHEMATICAL APPLICATIONS FOR THE MANAGEMENT, LIFE, AND SOCIAL SCIENCES NINTH EDITION HARSHBARGER/REYNOLDS LISA S. YOCCO Georgia Southern
Graphing Calculator Graphing with the TI-89
 Graphing Calculator Graphing with the TI-89 I. Introduction The TI-89 has fifty keys, many of which will perform multiple functions when used in combination. Each key has a symbol printed on its face.
Algebra 2 Semester 1 (#2221)
") Instructional Materials for WCSD Math Common Finals The Instructional Materials are for student and teacher use and are aligned to the 2016-2017 Course Guides for the following course: Algebra 2 Semester
Instructional Materials for WCSD Math Common Finals The Instructional Materials are for student and teacher use and are aligned to the 2016-2017 Course Guides for the following course: Algebra 2 Semester
Section 7.2 Characteristics of Quadratic Functions
 Section 7. Characteristics of Quadratic Functions A QUADRATIC FUNCTION is a function of the form " # $ N# 1 & ;# & 0 Characteristics Include:! Three distinct terms each with its own coefficient:! An x
HP Prime: The 10-Quicky Introduction Version 1.0. HP Prime: A Breakthrough in Mathematics Education Technology!
 HP Prime: A Breakthrough in Mathematics Education Technology! GT Springer, Solutions Architect HP Calculators and Educational Software gt.springer@hp.com This hands-on workshop is a basic introduction
Transformations with Quadratic Functions KEY
 Algebra Unit: 05 Lesson: 0 TRY THIS! Use a calculator to generate a table of values for the function y = ( x 3) + 4 y = ( x 3) x + y 4 Next, simplify the function by squaring, distributing, and collecting
How to Do Everything We Need to Do on a TI Calculator in Algebra 2 for Now (Unless Davies Forgot Something)
") How to Do Everything We Need to Do on a TI Calculator in Algebra 2 for Now (Unless Davies Forgot Something) 10.01.17 Before you do anything, set up your calculator so that it won t get in your way. Basics:
How to Do Everything We Need to Do on a TI Calculator in Algebra 2 for Now (Unless Davies Forgot Something) 10.01.17 Before you do anything, set up your calculator so that it won t get in your way. Basics: