Basic plotting commands Types of plots Customizing plots graphically Specifying color Customizing plots programmatically Exporting figures
|
|
|
- Gloria Chase
- 6 years ago
- Views:
Transcription

1
2 Basic plotting commands Types of plots Customizing plots graphically Specifying color Customizing plots programmatically Exporting figures
3 Matlab is flexible enough to let you quickly visualize data, and powerful enough to give you complete control over the final product Features: Interactive plotting simple 3D plotting programmatic annotation
4 2D Visualization plot (line plots) histogram scatter (scatter plots) image/imagesc (images) 3D Visualization surf/mesh (surfaces) plot3 (lines) scatter3
5 Create a new figure : figure(); Specify a figure number: figure(1) Hold onto a figure handle fighandle1 = figure(1); Re-select a figure: figure(fighandle1) Some useful functions: clf: close all: gcf: clear figure closes all figures get handle to current figure

6
7 Syntax: plot(x,y) plots points in the vector y against points in the vector x
 plots bars at the points given by")
8 Syntax: histogram(y) plots a histogram of the values in y, bar(x,y) plots bars at the points given by (x,y)
9 Syntax: scatter(x,y,s,c) lets you specify the size (s) and color (c) of each point given by (x,y)

10 Syntax: image(c) plots the values stored in the matrix C as an image
11 Syntax: surf(x,y,z) and mesh(x,y,z) are used to visualize a surface in three dimensions
12 Syntax: plot3(x,y,z) plot points in 3D

13
14 the subplot command let s you plot multiple plots on one figure syntax: subplot(nrows, ncols, index) (Figure 1) subplot(1,3,1) subplot(1,3,2) subplot(1,3,3)
15 the subplot command let s you plot multiple plots on one figure syntax: subplot(nrows, ncols, index) (Figure 2) subplot(3,2,1) subplot(3,2,2) subplot(3,2,3) subplot(3,2,4) subplot(3,2,5) subplot(3,2,6)

16
17 gca panel get handle to current axis

18 Panel() user-submitted function from Matlab File Exchange (FEX) Provides MUCH more control over subplot positioning, layout, margins, etc.
19

20
21 Plot() plots along dimension 1 of an array. If there are multiple dimensions, plot creates a separate line for each column If your data isn t constructed this way, just transpose with the apostrophy character: plot(data )

22
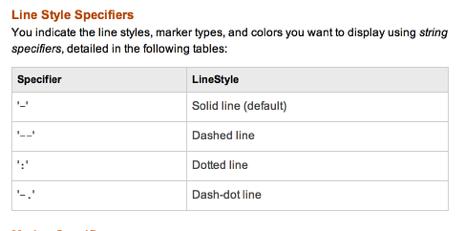
23 For line plots, specify the line type using a format string: plot(x,y, b ) % plots blue line (default) plot(x,y, b. ) % plots blue dots plot(x,y, b: ) % plots blue dotted line plot(x,y, k-- ) % plots black dashed line plot(x,y, ro ) % plots red circles Chain together characters for full specification of color, marker, and line plot(x,y, ro- ) % plots red circles with solid line plot(x,y, ro: ) % plots red circles with dotted line
24 For line plots, specify the line type using a format string: plot(x,y, b ) % plots blue line (default) plot(x,y, b. ) % plots blue dots plot(x,y, b: ) % plots blue dotted line plot(x,y, k-- ) % plots black dashed line plot(x,y, ro ) % plots red circles Chain together characters for full specification of color, marker, and line plot(x,y, ro- ) % plots red circles with solid line plot(x,y, ro: ) % plots red circles with dotted line
25

26
27 Everything you can do graphically you can also do programmatically. DON T do something by hand if you have to do it more than once! Examples axes labels: xlabel( text ), ylabel( text ) plot/axis title: title( text ) Add text: text(x,y, text to add )
28 Graphics parameters are usually specified as parameter, value pairs: plot(x,y, linewidth, 1.4) plot(x,y, bo-, linewidth, 2, markersize, 15) plot(x,y, o-, MarkerFaceColor, [1 0 0], markeredgecolor, [0 0 1])
29 grid on axis off colorbar colormap hot adds grid lines turns off the axes adds a colorbar to image plot switch colormap
30
31 Matlab has 8 built-in colors: Black (k), Red (r), Blue (b), Green (g), Cyan (c), Magenta (m), Yellow (y), White (w) We can specify other colors using RGB (red, green blue) notation: red = [1 0 0] blue = [0 0 1] green = [0 1 0] gray = [ ] black = [0 0 0] All RGB colors are 1x3 arrays and all elements between 0-1.

32

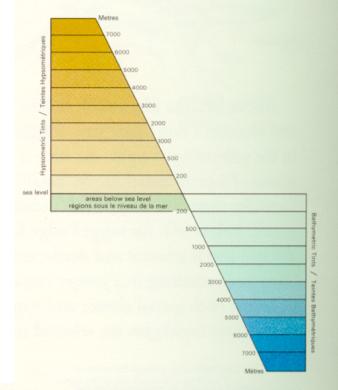
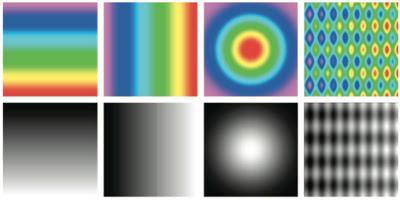
33 Colormaps are used to specify how data gets mapped onto different colors. Matlab has a few built-in colormaps, but you can also specify your own!
34
35
36
37 Figures in Matlab are referenced using handles, which are pointers to different parts of the figure. Example: myhandle = plot(x,y); Will return a handle to the plot. Then you can run the following: get(myhandle); % to see a list of properties set(myhandle, Name,Value); % to set the value of a property
38 Different parts of the figure are organized hierarchically: >> gcf >> gca >> get(gca,'children') >> get(gcf,'children')
39
40 Matlab saves figures using it s own.fig format. To share figures or view outside matlab, export to other formats, including: JPG, PNG, EPS, PDF, TIFF
41 Two main classes of image formats: bitmap vs. vector graphics Bitmap (jpg, png): Fixed image sizes Best for actual images (pictures of stuff) Vector (eps, pdf): Variable image sizes Best for line / bar graphs, scatter plots, etc.
42 print(fighandle,filename,formattype) e.g.: print(figure(1), MyPlot, -dpng ) formats: -dpng, -depsc2, -dpdf, etc add flag for resolution: -r300, etc
43
44 2D and 3D visualization examples: Custom colormaps: Panel panel Colors in figures (blog post)
45 Cawley et. al., Cell, Volume 116, Issue 4, 20 February 2004.
 <=8,738 units/wk")

46 100% 75% Proportion 50% 25% 0% < < < <39 >=39 All Hematocrit Group(%) <=8,738 units/wk >8,738-13,944 units/wk >13,944-21,692 units/wk >21,692 units/wk Cotter et. al., Journal of Clinical Epidemiology 57 (2004)
PROGRAMMING WITH MATLAB WEEK 6
 PROGRAMMING WITH MATLAB WEEK 6 Plot: Syntax: plot(x, y, r.- ) Color Marker Linestyle The line color, marker style and line style can be changed by adding a string argument. to select and delete lines
Mechanical Engineering Department Second Year (2015)
") Lecture 7: Graphs Basic Plotting MATLAB has extensive facilities for displaying vectors and matrices as graphs, as well as annotating and printing these graphs. This section describes a few of the most
Lecture 7: Graphs Basic Plotting MATLAB has extensive facilities for displaying vectors and matrices as graphs, as well as annotating and printing these graphs. This section describes a few of the most
W1005 Intro to CS and Programming in MATLAB. Plo9ng & Visualiza?on. Fall 2014 Instructor: Ilia Vovsha. hgp://www.cs.columbia.
 W1005 Intro to CS and Programming in MATLAB Plo9ng & Visualiza?on Fall 2014 Instructor: Ilia Vovsha hgp://www.cs.columbia.edu/~vovsha/w1005 Outline Plots (2D) Plot proper?es Figures Plots (3D) 2 2D Plots
STAT 391 Handout 1 Making Plots with Matlab Mar 26, 2006
 STAT 39 Handout Making Plots with Matlab Mar 26, 26 c Marina Meilă & Lei Xu mmp@cs.washington.edu This is intended to help you mainly with the graphics in the homework. Matlab is a matrix oriented mathematics
Logical Subscripting: This kind of subscripting can be done in one step by specifying the logical operation as the subscripting expression.
 What is the answer? >> Logical Subscripting: This kind of subscripting can be done in one step by specifying the logical operation as the subscripting expression. The finite(x)is true for all finite numerical
SGN Introduction to Matlab
 SGN-84007 Introduction to Matlab Lecture 4: Data Visualization Heikki Huttunen Alessandro Foi October 10, 2016 Outline Basics: figure, axes, handles, properties; Plotting univariate and multivariate data;
Basic Graphs. Dmitry Adamskiy 16 November 2011
 Basic Graphs Dmitry Adamskiy adamskiy@cs.rhul.ac.uk 16 November 211 1 Plot Function plot(x,y): plots vector Y versus vector X X and Y must have the same size: X = [x1, x2 xn] and Y = [y1, y2,, yn] Broken
CSE 123. Plots in MATLAB
 CSE 123 Plots in MATLAB Easiest way to plot Syntax: ezplot(fun) ezplot(fun,[min,max]) ezplot(fun2) ezplot(fun2,[xmin,xmax,ymin,ymax]) ezplot(fun) plots the expression fun(x) over the default domain -2pi
fplot Syntax Description Examples Plot Symbolic Expression Plot symbolic expression or function fplot(f) fplot(f,[xmin xmax])
![fplot Syntax Description Examples Plot Symbolic Expression Plot symbolic expression or function fplot(f) fplot(f,[xmin xmax])](/thumbs/73/69317189.jpg "fplot Syntax Description Examples Plot Symbolic Expression Plot symbolic expression or function fplot(f) fplot(f,[xmin xmax])") fplot Plot symbolic expression or function Syntax fplot(f) fplot(f,[xmin xmax]) fplot(xt,yt) fplot(xt,yt,[tmin tmax]) fplot(,linespec) fplot(,name,value) fplot(ax, ) fp = fplot( ) Description fplot(f)
fplot Plot symbolic expression or function Syntax fplot(f) fplot(f,[xmin xmax]) fplot(xt,yt) fplot(xt,yt,[tmin tmax]) fplot(,linespec) fplot(,name,value) fplot(ax, ) fp = fplot( ) Description fplot(f)
INC151 Electrical Engineering Software Practice. MATLAB Graphics. Dr.Wanchak Lenwari :Control System and Instrumentation Engineering, KMUTT 1
 INC151 Electrical Engineering Software Practice MATLAB Graphics Dr.Wanchak Lenwari :Control System and Instrumentation Engineering, KMUTT 1 Graphical display is one of MATLAB s greatest strengths and most
Matlab Tutorial 1: Working with variables, arrays, and plotting
 Matlab Tutorial 1: Working with variables, arrays, and plotting Setting up Matlab First of all, let's make sure we all have the same layout of the different windows in Matlab. Go to Home Layout Default.
GUI Alternatives. Syntax. Description. MATLAB Function Reference plot. 2-D line plot
 MATLAB Function Reference plot 2-D line plot GUI Alternatives Use the Plot Selector to graph selected variables in the Workspace Browser and the Plot Catalog, accessed from the Figure Palette. Directly
12 whereas if I terminate the expression with a semicolon, the printed output is suppressed.
 Example 4 Printing and Plotting Matlab provides numerous print and plot options. This example illustrates the basics and provides enough detail that you can use it for typical classroom work and assignments.
NENS 230 Assignment 4: Data Visualization
 NENS 230 Assignment 4: Data Visualization Due date: Tuesday, October 20, 2015 Goals Get comfortable manipulating figures Familiarize yourself with common 2D and 3D plots Understand how color and colormaps
MATLAB Laboratory 09/23/10 Lecture. Chapters 5 and 9: Plotting
 MATLAB Laboratory 09/23/10 Lecture Chapters 5 and 9: Plotting Lisa A. Oberbroeckling Loyola University Maryland loberbroeckling@loyola.edu L. Oberbroeckling (Loyola University) MATLAB 09/23/10 Lecture
Department of Chemical Engineering ChE-101: Approaches to Chemical Engineering Problem Solving MATLAB Tutorial Vb
 Department of Chemical Engineering ChE-101: Approaches to Chemical Engineering Problem Solving MATLAB Tutorial Vb Making Plots with Matlab (last updated 5/29/05 by GGB) Objectives: These tutorials are
This module aims to introduce Precalculus high school students to the basic capabilities of Matlab by using functions. Matlab will be used in
 This module aims to introduce Precalculus high school students to the basic capabilities of Matlab by using functions. Matlab will be used in subsequent modules to help to teach research related concepts
Dr Richard Greenaway
 SCHOOL OF PHYSICS, ASTRONOMY & MATHEMATICS 4PAM1008 MATLAB 4 Visualising Data Dr Richard Greenaway 4 Visualising Data 4.1 Simple Data Plotting You should now be familiar with the plot function which is
More on Plots. Dmitry Adamskiy 30 Nov 2011
 More on Plots Dmitry Adamskiy adamskiy@cs.rhul.ac.uk 3 Nov 211 1 plot3 (1) Recall that plot(x,y), plots vector Y versus vector X. plot3(x,y,z), where x, y and z are three vectors of the same length, plots
Introduction to MATLAB: Graphics
 Introduction to MATLAB: Graphics Eduardo Rossi University of Pavia erossi@eco.unipv.it September 2014 Rossi Introduction to MATLAB Financial Econometrics - 2014 1 / 14 2-D Plot The command plot provides
MATH 2221A Mathematics Laboratory II
 MATH A Mathematics Laboratory II Lab Assignment 4 Name: Student ID.: In this assignment, you are asked to run MATLAB demos to see MATLAB at work. The color version of this assignment can be found in your
Dr. Iyad Jafar. Adapted from the publisher slides
 Computer Applications Lab Lab 6 Plotting Chapter 5 Sections 1,2,3,8 Dr. Iyad Jafar Adapted from the publisher slides Outline xy Plotting Functions Subplots Special Plot Types Three-Dimensional Plotting
Graphics and plotting techniques
 Davies: Computer Vision, 5 th edition, online materials Matlab Tutorial 5 1 Graphics and plotting techniques 1. Introduction The purpose of this tutorial is to outline the basics of graphics and plotting
PART 1 PROGRAMMING WITH MATHLAB
 PART 1 PROGRAMMING WITH MATHLAB Presenter: Dr. Zalilah Sharer 2018 School of Chemical and Energy Engineering Universiti Teknologi Malaysia 23 September 2018 Programming with MATHLAB MATLAB Environment
Introduction to MATLAB
 Introduction to MATLAB Violeta Ivanova, Ph.D. MIT Academic Computing violeta@mit.edu http://web.mit.edu/violeta/www/iap2006 Topics MATLAB Interface and Basics Linear Algebra and Calculus Graphics Programming
EOSC 473/573 Matlab Tutorial R. Pawlowicz with changes by M. Halverson
 EOSC 473/573 Matlab Tutorial R. Pawlowicz with changes by M. Halverson February 12, 2008 Getting help 1. Local On-line help (a) text-based help: >> help (b) GUI-help >> helpwin (c) Browser-based
INTRODUCTION TO MATLAB PLOTTING WITH MATLAB
 1 INTRODUCTION TO MATLAB PLOTTING WITH MATLAB Plotting with MATLAB x-y plot Plotting with MATLAB MATLAB contains many powerful functions for easily creating plots of several different types. Command plot(x,y)
What is Matlab? A software environment for interactive numerical computations
 What is Matlab? A software environment for interactive numerical computations Examples: Matrix computations and linear algebra Solving nonlinear equations Numerical solution of differential equations Mathematical
AMS 27L LAB #2 Winter 2009
 AMS 27L LAB #2 Winter 2009 Plots and Matrix Algebra in MATLAB Objectives: 1. To practice basic display methods 2. To learn how to program loops 3. To learn how to write m-files 1 Vectors Matlab handles
Getting Started. Chapter 1. How to Get Matlab. 1.1 Before We Begin Matlab to Accompany Lay s Linear Algebra Text
 Chapter 1 Getting Started How to Get Matlab Matlab physically resides on each of the computers in the Olin Hall labs. See your instructor if you need an account on these machines. If you are going to go
Basic MATLAB Intro III
 Basic MATLAB Intro III Plotting Here is a short example to carry out: >x=[0:.1:pi] >y1=sin(x); y2=sqrt(x); y3 = sin(x).*sqrt(x) >plot(x,y1); At this point, you should see a graph of sine. (If not, go to
The Department of Engineering Science The University of Auckland Welcome to ENGGEN 131 Engineering Computation and Software Development
 The Department of Engineering Science The University of Auckland Welcome to ENGGEN 131 Engineering Computation and Software Development Chapter 7 Graphics Learning outcomes Label your plots Create different
Graphics in MATLAB. Responsible teacher: Anatoliy Malyarenko. November 10, Abstract. Basic Plotting Commands
 Graphics in MATLAB Responsible teacher: Anatoliy Malyarenko November 10, 2003 Contents of the lecture: Two-dimensional graphics. Formatting graphs. Three-dimensional graphics. Specialised plots. Abstract
APPM 2460 PLOTTING IN MATLAB
 APPM 2460 PLOTTING IN MATLAB. Introduction Matlab is great at crunching numbers, and one of the fundamental ways that we understand the output of this number-crunching is through visualization, or plots.
Basic Beginners Introduction to plotting in Python
 Basic Beginners Introduction to plotting in Python Sarah Blyth July 23, 2009 1 Introduction Welcome to a very short introduction on getting started with plotting in Python! I would highly recommend that
Graphics Example a final product:
 Basic 2D Graphics 1 Graphics Example a final product: TITLE LEGEND YLABEL TEXT or GTEXT CURVES XLABEL 2 2-D Plotting Specify x-data and/or y-data Specify color, line style and marker symbol (Default values
INTERNATIONAL EDITION. MATLAB for Engineers. Third Edition. Holly Moore
 INTERNATIONAL EDITION MATLAB for Engineers Third Edition Holly Moore 5.4 Three-Dimensional Plotting Figure 5.8 Simple mesh created with a single two-dimensional matrix. 5 5 Element,5 5 The code mesh(z)
MATLAB Introduction to MATLAB Programming
 MATLAB Introduction to MATLAB Programming MATLAB Scripts So far we have typed all the commands in the Command Window which were executed when we hit Enter. Although every MATLAB command can be executed
Introduction to Matlab to Accompany Linear Algebra. Douglas Hundley Department of Mathematics and Statistics Whitman College
 Introduction to Matlab to Accompany Linear Algebra Douglas Hundley Department of Mathematics and Statistics Whitman College August 27, 2018 2 Contents 1 Getting Started 5 1.1 Before We Begin........................................
DATA PLOTTING WITH MATLAB
 DATA PLOTTING WITH MATLAB Prof. Marco Pilotti marco.pilotti@ing.unibs.it Dr. Giulia Valerio giulia.valerio@ing.unibs.it Giulia Valerio 7Marzo 2014 1 1. WHY MATLAB? WHY MATLAB? Matlab is a high-level programming
2D LINE PLOTS... 1 The plot() Command... 1 Labeling and Annotating Figures... 5 The subplot() Command... 7 The polarplot() Command...
 Command... 1 Labeling and Annotating Figures... 5 The subplot() Command... 7 The polarplot() Command...") Contents 2D LINE PLOTS... 1 The plot() Command... 1 Labeling and Annotating Figures... 5 The subplot() Command... 7 The polarplot() Command... 9 2D LINE PLOTS One of the benefits of programming in MATLAB
Contents 2D LINE PLOTS... 1 The plot() Command... 1 Labeling and Annotating Figures... 5 The subplot() Command... 7 The polarplot() Command... 9 2D LINE PLOTS One of the benefits of programming in MATLAB
Introduction to Matlab. WIAA Technical Workshop #2 10/20/2015
 Introduction to Matlab WIAA Technical Workshop #2 10/20/2015 * This presentation is merely an introduction to some of the functions of MATLAB and is not a comprehensive review of their capabilities. **
A MATLAB Exercise Book. Ludmila I. Kuncheva and Cameron C. Gray
 A MATLAB Exercise Book Ludmila I. Kuncheva and Cameron C. Gray Contents 1 Getting Started 1 1.1 MATLAB................................................. 1 1.2 Programming Environment......................................
1. Register an account on: using your Oxford address
 1P10a MATLAB 1.1 Introduction MATLAB stands for Matrix Laboratories. It is a tool that provides a graphical interface for numerical and symbolic computation along with a number of data analysis, simulation
PyPlot. The plotting library must be imported, and we will assume in these examples an import statement similar to those for numpy and math as
 Geog 271 Geographic Data Analysis Fall 2015 PyPlot Graphicscanbeproducedin Pythonviaavarietyofpackages. We willuseapythonplotting package that is part of MatPlotLib, for which documentation can be found
Chapter 3: Introduction to MATLAB Programming (4 th ed.)
") Chapter 3: Introduction to MATLAB Programming (4 th ed.) Algorithms MATLAB scripts Input / Output o disp versus fprintf Graphs Read and write variables (.mat files) User-defined Functions o Definition
Chapter 3: Introduction to MATLAB Programming (4 th ed.) Algorithms MATLAB scripts Input / Output o disp versus fprintf Graphs Read and write variables (.mat files) User-defined Functions o Definition
Overview. Lecture 13: Graphics and Visualisation. Graphics & Visualisation 2D plotting. Graphics and visualisation of data in Matlab
 Overview Lecture 13: Graphics and Visualisation Graphics & Visualisation 2D plotting 1. Plots for one or multiple sets of data, logarithmic scale plots 2. Axis control & Annotation 3. Other forms of 2D
EGR 102 Introduction to Engineering Modeling. Lab 05B Plotting
 EGR 102 Introduction to Engineering Modeling Lab 05B Plotting 1 Overview Plotting in MATLAB 2D plotting ( ezplot(), fplot(), plot()) Formatting of 2D plots 3D plotting (surf(), mesh(), plot3()) Formatting
MATLAB Modul 2. Introduction to Computational Science: Modeling and Simulation for the Sciences, 2 nd Edition
 MATLAB Modul 2 Introduction to Computational Science: Modeling and Simulation for the Sciences, 2 nd Edition Angela B. Shiflet and George W. Shiflet Wofford College 2014 by Princeton University Press Introduction
1 >> Lecture 4 2 >> 3 >> -- Graphics 4 >> Zheng-Liang Lu 184 / 243
 1 >> Lecture 4 >> 3 >> -- Graphics 4 >> Zheng-Liang Lu 184 / 43 Introduction ˆ Engineers use graphic techniques to make the information easier to understand. ˆ With graphs, it is easy to identify trends,
Introduction to MATLAB
 Introduction to MATLAB Violeta Ivanova, Ph.D. Office for Educational Innovation & Technology violeta@mit.edu http://web.mit.edu/violeta/www Topics MATLAB Interface and Basics Calculus, Linear Algebra,
Appendix A. Introduction to MATLAB. A.1 What Is MATLAB?
 Appendix A Introduction to MATLAB A.1 What Is MATLAB? MATLAB is a technical computing environment developed by The Math- Works, Inc. for computation and data visualization. It is both an interactive system
QUICK INTRODUCTION TO MATLAB PART I
 QUICK INTRODUCTION TO MATLAB PART I Department of Mathematics University of Colorado at Colorado Springs General Remarks This worksheet is designed for use with MATLAB version 6.5 or later. Once you have
MATLAB SUMMARY FOR MATH2070/2970
 MATLAB SUMMARY FOR MATH2070/2970 DUNCAN SUTHERLAND 1. Introduction The following is inted as a guide containing all relevant Matlab commands and concepts for MATH2070 and 2970. All code fragments should
PyPlot. The plotting library must be imported, and we will assume in these examples an import statement similar to those for numpy and math as
 Geog 271 Geographic Data Analysis Fall 2017 PyPlot Graphicscanbeproducedin Pythonviaavarietyofpackages. We willuseapythonplotting package that is part of MatPlotLib, for which documentation can be found
Classes 7-8 (4 hours). Graphics in Matlab.
. Graphics in Matlab.") Classes 7-8 (4 hours). Graphics in Matlab. Graphics objects are displayed in a special window that opens with the command figure. At the same time, multiple windows can be opened, each one assigned a number.
Classes 7-8 (4 hours). Graphics in Matlab. Graphics objects are displayed in a special window that opens with the command figure. At the same time, multiple windows can be opened, each one assigned a number.
Part #6. A0B17MTB Matlab. Miloslav Čapek Filip Kozák, Viktor Adler, Pavel Valtr
 A0B17MTB Matlab Part #6 Miloslav Čapek miloslav.capek@fel.cvut.cz Filip Kozák, Viktor Adler, Pavel Valtr Department of Electromagnetic Field B2-626, Prague Learning how to Visualizing in Matlab #1 Debugging
Additional Plot Types and Plot Formatting
 Additional Plot Types and Plot Formatting The xy plot is the most commonly used plot type in MAT- LAB Engineers frequently plot either a measured or calculated dependent variable, say y, versus an independent
1 Introduction to Matlab
 1 Introduction to Matlab 1. What is Matlab? Matlab is a computer program designed to do mathematics. You might think of it as a super-calculator. That is, once Matlab has been started, you can enter computations,
MATH36032 Problem Solving by Computer. Publishable Quality Graphics
 MATH36032 Problem Solving by Computer Publishable Quality Graphics Which format of figures (images) do you know? Which format of figures (images) do you know? Raster formats: png, jpeg, tiff, gif, bmp,...
Introduction to Programming in MATLAB
 Introduction to Programming in MATLAB User-defined Functions Functions look exactly like scripts, but for ONE difference Functions must have a function declaration Help file Function declaration Outputs
Data Analysis in Geophysics ESCI Class 17. Bob Smalley. More Matlab.
 Data Analysis in Geophysics ESCI 7205 Class 17 Bob Smalley More Matlab. Final project selection due soon. Saving & Exporting Graphics The default graphics file is a Matlab Figure or.fig formatted file.
Prof. Manoochehr Shirzaei. RaTlab.asu.edu
 RaTlab.asu.edu Introduction To MATLAB Introduction To MATLAB This lecture is an introduction of the basic MATLAB commands. We learn; Functions Procedures for naming and saving the user generated files
FF505/FY505 Computational Science. MATLAB Graphics. Marco Chiarandini
 FF505/FY505 Computational Science MATLAB Marco Chiarandini (marco@imada.sdu.dk) Department of Mathematics and Computer Science (IMADA) University of Southern Denmark Outline 1. 2D Plots 3D Plots 2 Outline
Interactive Computing with Matlab. Gerald W. Recktenwald Department of Mechanical Engineering Portland State University
 Interactive Computing with Matlab Gerald W. Recktenwald Department of Mechanical Engineering Portland State University gerry@me.pdx.edu Starting Matlab Double click on the Matlab icon, or on unix systems
Name: INSERT YOUR NAME HERE UWNetID: INSERT YOUR NETID
 AMath 584 Homework 3 Due to dropbox by 6pm PDT, November 4, 2011 Name: INSERT YOUR NAME HERE UWNetID: INSERT YOUR NETID Use latex for this assignment! Submit a pdf file to the dropbox. You do not need
MATLAB Tutorial. 1. The MATLAB Windows. 2. The Command Windows. 3. Simple scalar or number operations
 MATLAB Tutorial The following tutorial has been compiled from several resources including the online Help menu of MATLAB. It contains a list of commands that will be directly helpful for understanding
MATLAB Functions and Graphics
 Functions and Graphics We continue our brief overview of by looking at some other areas: Functions: built-in and user defined Using M-files to store and execute statements and functions A brief overview
Computing Fundamentals Plotting
 Computing Fundamentals Plotting Salvatore Filippone salvatore.filippone@uniroma2.it 2014 2015 (salvatore.filippone@uniroma2.it) Plotting 2014 2015 1 / 14 Plot function The basic function to plot something
TikZ & PGF(plots) Daniel Knittl-Frank. May This work is licensed under the Creative Commons Attribution-ShareAlike 3.
 Daniel Knittl-Frank. May This work is licensed under the Creative Commons Attribution-ShareAlike 3.") TikZ & PGF(plots) Daniel Knittl-Frank May 2015 This work is licensed under the Creative Commons Attribution-ShareAlike 3.0 Austria license (CC-BY-SA) 2D value plot Bitstamp USD 20,000 Weighted Price High
TikZ & PGF(plots) Daniel Knittl-Frank May 2015 This work is licensed under the Creative Commons Attribution-ShareAlike 3.0 Austria license (CC-BY-SA) 2D value plot Bitstamp USD 20,000 Weighted Price High
What is MATLAB? It is a high-level programming language. for numerical computations for symbolic computations for scientific visualizations
 What is MATLAB? It stands for MATrix LABoratory It is developed by The Mathworks, Inc (http://www.mathworks.com) It is an interactive, integrated, environment for numerical computations for symbolic computations
Chapter 2. MATLAB Fundamentals
 Chapter 2. MATLAB Fundamentals Choi Hae Jin Chapter Objectives q Learning how real and complex numbers are assigned to variables. q Learning how vectors and matrices are assigned values using simple assignment,
Introduction to Matlab
 What is Matlab? Introduction to Matlab Matlab is software written by a company called The Mathworks (mathworks.com), and was first created in 1984 to be a nice front end to the numerical routines created
CCNY. BME 2200: BME Biostatistics and Research Methods. Lecture 4: Graphing data with MATLAB
 BME 2200: BME Biostatistics and Research Methods Lecture 4: Graphing data with MATLAB Lucas C. Parra Biomedical Engineering Department CCNY parra@ccny.cuny.edu 1 Content, Schedule 1. Scientific literature:
Plotting - Practice session
 Plotting - Practice session Alessandro Fanfarillo - Salvatore Filippone fanfarillo@ing.uniroma2.it May 28th, 2013 (fanfarillo@ing.uniroma2.it) Plotting May 28th, 2013 1 / 14 Plot function The basic function
ENGR Fall Exam 1
 ENGR 1300 Fall 01 Exam 1 INSTRUCTIONS: Duration: 60 minutes Keep your eyes on your own work! Keep your work covered at all times! 1. Each student is responsible for following directions. Read carefully..
Introduction to Matlab
 Introduction to Matlab What is Matlab The software program called Matlab (short for MATrix LABoratory) is arguably the world standard for engineering- mainly because of its ability to do very quick prototyping.
Introduction to MATLAB programming: Fundamentals
 Introduction to MATLAB programming: Fundamentals Shan He School for Computational Science University of Birmingham Module 06-23836: Computational Modelling with MATLAB Outline Outline of Topics Why MATLAB?
Lab 5: Matlab Tutorial Due Sunday, May 8 at midnight
 Lab 5: Matlab Tutorial Due Sunday, May 8 at midnight For this final lab, you should work with a partner. You know how to do that at this point. Only one partner turns in the lab, but both of your names
MATLAB Fundamentals. Berlin Chen Department of Computer Science & Information Engineering National Taiwan Normal University
 MATLAB Fundamentals Berlin Chen Department of Computer Science & Information Engineering National Taiwan Normal University Reference: 1. Applied Numerical Methods with MATLAB for Engineers, Chapter 2 &
MATLAB Tutorial III Variables, Files, Advanced Plotting
 MATLAB Tutorial III Variables, Files, Advanced Plotting A. Dealing with Variables (Arrays and Matrices) Here's a short tutorial on working with variables, taken from the book, Getting Started in Matlab.
3D plot of a surface in Matlab
 3D plot of a surface in Matlab 3D plot of a surface in Matlab Create a surface of function mesh Graphics 3-D line plot Graphics 3-D contour plot Draw contours in volume slice planes For 3-D shaded surface
Miami Conservancy District Logo Specs
 Full Color CMYK 70% Black Reversed Out Treatment when using Color White C: 43, M: 0, Y: 0, K: 0 C: 43 M: 0 Y: 0 K: 0 C: 85 M: 15 Y: 0 K: 17 C: 85 M: 15 Y: 0 K: 38 C: 100 M: 75 Y: 0 K: 57 C: 0 M: 0 Y: 0
Name: Math Analytic Geometry and Calculus III - Spring Matlab Project - due on Wednesday, March 30
 Name: Math 275 - Analytic Geometry and Calculus III - Spring 2011 Solve the following problems: Matlab Project - due on Wednesday, March 30 (Section 14.1 # 30) Use Matlab to graph the curve given by the
Advanced Programming in MATLAB
 Advanced Programming in MATLAB Aaron Ponti September 3, 2010 Abstract In the first session of this course, we introduced some of the basic concepts of MATLAB programming. In this lecture, we want to explore
The MathWorks - MATLAB Digest June Exporting Figures for Publication
 Page 1 of 5 Exporting Figures for Publication by Ben Hinkle This article describes how to turn figures into publication-ready Encapsulated Postscript (EPS) files using a new MATLAB script called exportfig.m.
Hello Earth! A grounded introduction to Matlab. Frederik J Simons. Christopher Harig. Adam C. Maloof Princeton University
 Hello Earth! A grounded introduction to Matlab Frederik J Simons Christopher Harig Adam C. Maloof Princeton University (Enter teacher) i 2 Something canny Matlab can do i 3 200 400 600 800 1000 100 200
Matlab Concise Notes
 Gang Wang Oct. 3, 9. Introduction Matlab stands for MATrix LABoratory and the objects of basic operations are vectors and matrices (user should be good at linear algebra). It is written in C. Matlab is
PSY8219 : Week 6. Homework 5 Due Today. Homework 6 Due October 8. Readings for Today Attaway Chapter 6, 10, and 12
 Homework 5 Due Today PSY8219 : Week 6 Homework 6 Due October 8 Readings for Today Attaway Chapter 6, 10, and 12 Readings for Next Week Attaway Chapter 12 and 13 Turning in Homework Assignments Remember
MAT 275 Laboratory 1 Introduction to MATLAB
 MATLAB sessions: Laboratory 1 1 MAT 275 Laboratory 1 Introduction to MATLAB MATLAB is a computer software commonly used in both education and industry to solve a wide range of problems. This Laboratory
Introduction to MATLAB
 58:110 Computer-Aided Engineering Spring 2005 Introduction to MATLAB Department of Mechanical and industrial engineering January 2005 Topics Introduction Running MATLAB and MATLAB Environment Getting help
Beyond the Mouse A Short Course on Programming
 1 / 15 Beyond the Mouse A Short Course on Programming 5. Matlab IO: Getting data in and out of Matlab Ronni Grapenthin and Glenn Thompson Geophysical Institute, University of Alaska Fairbanks October 11,
Computer Programming in MATLAB
 Computer Programming in MATLAB Prof. Dr. İrfan KAYMAZ Engineering Faculty Department of Mechanical Engineering Arrays in MATLAB; Vectors and Matrices Graphing Vector Generation Before graphing plots in
What is MATLAB? What is MATLAB? Programming Environment MATLAB PROGRAMMING. Stands for MATrix LABoratory. A programming environment
 What is MATLAB? MATLAB PROGRAMMING Stands for MATrix LABoratory A software built around vectors and matrices A great tool for numerical computation of mathematical problems, such as Calculus Has powerful
Scientific Python: matplotlib
 Scientific Python: matplotlib 17 July 2014 Introduction and Aims This exercise introduces the matplotlib module of Python. Matplotlib is a versatile plotting library that can be used to produce both quick
Introduction to Scientific Programming in MATLAB
 Introduction to Scientific Programming in MATLAB Derrick Kearney HUBzero Platform for Scientific Collaboration Purdue University Original slides by Michael McLennan This work licensed under Creative Commons
ENGG1811 Computing for Engineers Week 11 Part C Matlab: 2D and 3D plots
 ENGG1811 Computing for Engineers Week 11 Part C Matlab: 2D and 3D plots ENGG1811 UNSW, CRICOS Provider No: 00098G1 W11 slide 1 More on plotting Matlab has a lot of plotting features Won t go through them
PowerPoints organized by Dr. Michael R. Gustafson II, Duke University
 Part 1 Chapter 2 MATLAB Fundamentals PowerPoints organized by Dr. Michael R. Gustafson II, Duke University All images copyright The McGraw-Hill Companies, Inc. Permission required for reproduction or display.
Introduction to MATLAB LAB 1
 Introduction to MATLAB LAB 1 1 Basics of MATLAB MATrix LABoratory A super-powerful graphing calculator Matrix based numeric computation Embedded Functions Also a programming language User defined functions
Introduction to Matlab
 Introduction to Matlab Math 339 Fall 2013 First, put the icon in the launcher: Drag and drop Now, open Matlab: * Current Folder * Command Window * Workspace * Command History Operations in Matlab Description: