Pure Math 30: Explained!
|
|
|
- Paul Beasley
- 5 years ago
- Views:
Transcription

1 30


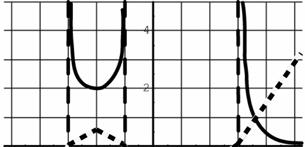
2 part i: stretches about other lines Stretches about other lines: Stretches about lines other than the x & y axis are frequently required. Example 1: Stretch the graph horizontally by a factor of about the line x = First draw in the vertical line x =. Count out how far each point is away from the line, then multiply by the stretch factor to find the new distance from the line. Notice how the top right point was 1 unit from the line, now it s units away. The top left point was 5 units from the line, now it s 10 units away. Example : Stretch the graph vertically by a factor of 1 about the line y = - First draw in the horizontal line y = -. Count out how far each point is away from the line, then multiply by the stretch factor to find the new distance from the line. Notice how the top of the parabola was 4 units from the line, now it s units away. 31


 from the line.")

3 part i: stretches about other lines Example 3: Stretch the graph horizontally by a factor of 5 about the line x = First draw in the vertical line x =. Then apply the horizontal stretch by counting the spaces, multiplying by 5, and drawing in the new points. Example 4: Find the new coordinates of the point (1, -3) after a vertical stretch by a factor of about the line y = The point is units away from the line initially, First draw in the horizontal line y = and so after multiplying by it will be 4 units away the point (1, -3) from the line. New Point = (1, -5) In these types of stretches, the invariant points are on the line you are stretching about. 3
 Horizontal stretch by a factor of about the line x = 4) Vertical stretch by a factor of 5 about the line y = 1 www.puremath30.")
4 part i: stretches about other lines Questions: For each of the following, draw in the transformed graph: 1) Horizontal stretch by a factor of 1/ about the line x = -3 ) Vertical stretch by a factor of 1/ about the line y = - 3) Horizontal stretch by a factor of about the line x = 4) Vertical stretch by a factor of 5 about the line y =
5 part i: stretches about other lines Questions: Continued 5) Find the new coordinates of the point (3, -) after the following transformation: a) Vertical stretch by a factor of 3 about the line y = b) Vertical stretch by a factor of 1/ about the line y = c) Horizontal stretch by a factor of about the line x = 1 d) Horizontal stretch by a factor of 1/3 about the line x = -3 Answers: a) (3, -4) b) (3, 0) c) (5, -) d) (, -) 34


6 part ii: inverses Inverses: An inverse is defined as x = f(y) or y = f (x), and may be obtained by interchanging the x & y values. As such, inverses are reflected over the line y = x. Example 1: Draw in the inverse of the given graph. First draw in the line y=x. Now graph the inverse by interchanging the x & y values. e.g. The point (-, 1) will become (1, -) Example : Determine the equation of the inverse to f(x) = 3x 4 First rewrite f(x) as y : y = 3x - 4 Now interchange x & y : x = 3y - 4 Solve for the new y : x +4 = 3y x+4 y = 3 Inverses are written with the notation f (x), so express the final answer as : x+4 f (x)= 3 Example 3: Find the equation of the inverse to f(x) = (x - 3) 4 y=(x-3) -4 x=(y-3) -4 For inverses, x+4=(y-3) the invariant ± x +4 = y - 3 points are on y = x Remember that you need the ± when taking a square root f (x)=± x+4+3 Example 4: How would you restrict the domain of y = (x +1) such that the inverse is a function? First find the equation of the inverse : f (x)=± x Graph the original Now draw the inverse Notice that the inverse is NOT a function, since it doesn t pass the vertical line test. To make the inverse a function, we need to restrict the domain of the original so the inverse will pass the vertical line test. The domain of the original could be restricted to x This will force the inverse to be a function. Or, the domain of the original could be restricted to x This will also force the inverse to be a function. 35
 Find the equation of the inverse for each of the following: a) f(x) = 4x 5 b) f(x) = x 4 c) f(x) = (x")
 How would you restrict the domain of y = (x - ) such that the inverse f (x) = ± x + is a function? www.")
7 part ii: inverses Questions: 1.. Draw in the inverse for each of the following graphs ) Find the equation of the inverse for each of the following: a) f(x) = 4x 5 b) f(x) = x 4 c) f(x) = (x + ) d) f(x) = x 6) If the point (-3, 4) undergoes the transformation y = f (x), what is the new point? 7) How would you restrict the domain of y = (x - ) such that the inverse f (x) = ± x + is a function? 36
 b) c) d) x +5 f (x)= 4 f (x) = ± x + 4 f (x)= ± x")


8 part ii: inverses Answers: a) b) c) d) x +5 f (x)= 4 f (x) = ± x + 4 f (x)= ± x - f (x)=x The new point is found by interchanging x & y, (4, -3) 7. First graph the function & the inverse. If the domain of the original is restricted to x, this will force the inverse to be a function. Or, the domain of the original could be restricted to x. This will also force the inverse to be a function. 37
9 part iii: linear reciprocals Reciprocal Functions: A reciprocal function is represented by y = Example 1: Draw y =x and the 1 reciprocal graph, y = x 1 f(x) 1 Note that and f (x) do f(x) NOT mean the same thing! The first is a reciprocal graph, the second is an inverse graph. They are very different. Black: y=x 1 Dashed: y= x Obtain the values in this column by using the y-values of the original graph. f ( x ) Reciprocal the numbers from the first column. 1 f ( x) UNDEFINED Remember what happens in basic division of numbers: As the denominator becomes larger, the resulting number becomes smaller = 0.5 = 0.5 = As the denominator becomes smaller, the resulting number becomes larger = = 4 = Remember that dividing by zero is undefined, so at the x-intercepts of the original, the reciprocal graph has no corresponding point. Indicate this on the graph by drawing a vertical asymptote, since the graph will approach this line from both sides but never actually reach it. Note the following characteristics of reciprocal graphs: 1) The reciprocal graph will always be on the same side of the x-axis as the original. If the original is above the x-axis, the reciprocal is also above. If the original is below, the reciprocal is also below. ) The vertical asymptotes are drawn at the x-intercepts of the original. The equation of a vertical line is of the form: x = constant. In the graph above, the equation of the vertical asymptote is x = 0 3) Horizontal asymptotes are may also by present in the reciprocal graph. The equation of a horizontal line is of the form: y = constant. In the graph above, the equation of the horizontal asymptote is y = 0 4) Invariant points are points that don t change position when a transformation is applied. In reciprocal graphs, the invariant points are located at y = and y =
10 part iii: linear reciprocals Example : Draw the graph of y =x+1 and it s reciprocal, 1 y= x +1 Step 1: Draw y=x+1 Step : Draw in the vertical asymptote at the x-intercept. Step 3: Place dots at the invariant points (wherever y = ±1 on the original) Step 4: Draw in the reciprocal graph. Domain: x 0.5 Range: y
11 part iii: linear reciprocals Questions: Draw the original & reciprocal graphs for each of the following functions. State the domain and range for the reciprocal. 1) y = -x ) y =x- 3 3) y =x+ 4) 1 y =- x- Answers: 1) ) 3) 4) Domain: x 0 Range: y 0 Domain: x 3 Range: y 0 Domain: x 1 Domain: x 4 Range: y 0 Range: y
12 part iv: non - linear reciprocals Reciprocals of Non-Linear Graphs: In these graphs, you have to be careful about where a reciprocal passes through, touches, or completely misses the original graph. Example 1: Draw the reciprocal of y =x -. Step 1: Draw y=x - Step : Draw in vertical asymptotes at the x-intercepts Step 3: Draw in dots at the invariant points. Step 4: Look at the bottom tip of the parabola. The y-value there is -, so the reciprocal value is Put a tick there since the reciprocal graph must pass through that point. Step 5: Draw in the graph 41


13 part iv: non - linear reciprocals Example : Draw in the reciprocal of the following graph: Step 1: Draw in the asymptotes Step : Draw in dots at all invariant points. Step 3: The first tip is at y = 1, and the reciprocal of this is also 1. Place a tick there. The next tip is at -, with a reciprocal of Place another tick there. The last tip is at 0.5, and the reciprocal is. Put your final tick there. Step 4: Fill in the reciprocal graph. 4
14 part iv: non - linear reciprocals Questions: Draw the original & reciprocal graphs. 1. y 1 1 = x. y = ( x ) y = ( x+ ) y= ( x 3)


15 part iv: non - linear reciprocals Answers:
Pure Math 30: Explained!
 www.puremath30.com 5 Conics Lesson Part I - Circles Circles: The standard form of a circle is given by the equation (x - h) +(y - k) = r, where (h, k) is the centre of the circle and r is the radius. Example
Math January, Non-rigid transformations. Parent function New function Scale factor
 Non-rigid transformations In non-rigid transformations, the shape of a function is modified, either stretched or shrunk. We will call the number which tells us how much it is changed the scale factor,
1.1: Basic Functions and Translations
 .: Basic Functions and Translations Here are the Basic Functions (and their coordinates!) you need to get familiar with.. Quadratic functions (a.k.a. parabolas) y x Ex. y ( x ). Radical functions (a.k.a.
Summer Review for Students Entering Pre-Calculus with Trigonometry. TI-84 Plus Graphing Calculator is required for this course.
 1. Using Function Notation and Identifying Domain and Range 2. Multiplying Polynomials and Solving Quadratics 3. Solving with Trig Ratios and Pythagorean Theorem 4. Multiplying and Dividing Rational Expressions
Chapter 9 Review. By Charlie and Amy
 Chapter 9 Review By Charlie and Amy 9.1- Inverse and Joint Variation- Explanation There are 3 basic types of variation: direct, indirect, and joint. Direct: y = kx Inverse: y = (k/x) Joint: y=kxz k is
Rational functions, like rational numbers, will involve a fraction. We will discuss rational functions in the form:
 Name: Date: Period: Chapter 2: Polynomial and Rational Functions Topic 6: Rational Functions & Their Graphs Rational functions, like rational numbers, will involve a fraction. We will discuss rational
Transformation a shifting or change in shape of a graph
 1.1 Horizontal and Vertical Translations Frieze Patterns Transformation a shifting or change in shape of a graph Mapping the relating of one set of points to another set of points (ie. points on the original
Summer Review for Students Entering Pre-Calculus with Trigonometry. TI-84 Plus Graphing Calculator is required for this course.
 Summer Review for Students Entering Pre-Calculus with Trigonometry 1. Using Function Notation and Identifying Domain and Range 2. Multiplying Polynomials and Solving Quadratics 3. Solving with Trig Ratios
1.1 - Functions, Domain, and Range
 1.1 - Functions, Domain, and Range Lesson Outline Section 1: Difference between relations and functions Section 2: Use the vertical line test to check if it is a relation or a function Section 3: Domain
Basic Transformations
 Basic Transformations www.math40s.com 90 Part I: Vertical Stretches Vertical Stretches: A vertical stretch is represented by the form y = af(x), where a is the vertical stretch factor. Example 1: Stretch
More Ways to Solve & Graph Quadratics The Square Root Property If x 2 = a and a R, then x = ± a
 More Ways to Solve & Graph Quadratics The Square Root Property If x 2 = a and a R, then x = ± a Example: Solve using the square root property. a) x 2 144 = 0 b) x 2 + 144 = 0 c) (x + 1) 2 = 12 Completing
9.1 Linear Inequalities in Two Variables Date: 2. Decide whether to use a solid line or dotted line:
 9.1 Linear Inequalities in Two Variables Date: Key Ideas: Example Solve the inequality by graphing 3y 2x 6. steps 1. Rearrange the inequality so it s in mx ± b form. Don t forget to flip the inequality
Chapter 2(part 2) Transformations
 Transformations") Chapter 2(part 2) Transformations Lesson Package MCR3U 1 Table of Contents Lesson 1: Intro to transformations.... pg. 3-7 Lesson 2: Transformations of f x = x!...pg. 8-11 Lesson 3: Transformations of f
Chapter 2(part 2) Transformations Lesson Package MCR3U 1 Table of Contents Lesson 1: Intro to transformations.... pg. 3-7 Lesson 2: Transformations of f x = x!...pg. 8-11 Lesson 3: Transformations of f
Graphs of Increasing Exponential Functions
 Section 5 2A: Graphs of Increasing Exponential Functions We want to determine what the graph of an exponential function y = a x looks like for all values of a > We will select a value of a > and examine
Graphs of Increasing Exponential Functions
 Section 5 2A: Graphs of Increasing Exponential Functions We want to determine what the graph of an exponential function y = a x looks like for all values of a > We will select a value of a > and examine
2-3 Graphing Rational Functions
 2-3 Graphing Rational Functions Factor What are the end behaviors of the Graph? Sketch a graph How to identify the intercepts, asymptotes and end behavior of a rational function. How to sketch the graph
Graphing Techniques. Domain (, ) Range (, ) Squaring Function f(x) = x 2 Domain (, ) Range [, ) f( x) = x 2
 Range (, ) Squaring Function f(x) = x 2 Domain (, ) Range [, ) f( x) = x 2") Graphing Techniques In this chapter, we will take our knowledge of graphs of basic functions and expand our ability to graph polynomial and rational functions using common sense, zeros, y-intercepts, stretching
Graphing Techniques In this chapter, we will take our knowledge of graphs of basic functions and expand our ability to graph polynomial and rational functions using common sense, zeros, y-intercepts, stretching
The x-intercept can be found by setting y = 0 and solving for x: 16 3, 0
 y=-3/4x+4 and y=2 x I need to graph the functions so I can clearly describe the graphs Specifically mention any key points on the graphs, including intercepts, vertex, or start/end points. What is the
Multiplying and Dividing Rational Expressions
 Page 1 of 14 Multiplying and Dividing Rational Expressions Attendance Problems. Simplify each expression. Assume all variables are nonzero. x 6 y 2 1. x 5 x 2 2. y 3 y 3 3. 4. x 2 y 5 Factor each expression.
Replacing f(x) with k f(x) and. Adapted from Walch Education
 with k f(x) and. Adapted from Walch Education") Replacing f(x) with k f(x) and f(k x) Adapted from Walch Education Graphing and Points of Interest In the graph of a function, there are key points of interest that define the graph and represent the characteristics
Replacing f(x) with k f(x) and f(k x) Adapted from Walch Education Graphing and Points of Interest In the graph of a function, there are key points of interest that define the graph and represent the characteristics
2-4 Graphing Rational Functions
 2-4 Graphing Rational Functions Factor What are the zeros? What are the end behaviors? How to identify the intercepts, asymptotes, and end behavior of a rational function. How to sketch the graph of a
Multiplying and Dividing Rational Expressions
 Multiplying and Dividing Rational Expressions Warm Up Simplify each expression. Assume all variables are nonzero. 1. x 5 x 2 3. x 6 x 2 x 7 Factor each expression. 2. y 3 y 3 y 6 x 4 4. y 2 1 y 5 y 3 5.
Section 4.4: Parabolas
 Objective: Graph parabolas using the vertex, x-intercepts, and y-intercept. Just as the graph of a linear equation y mx b can be drawn, the graph of a quadratic equation y ax bx c can be drawn. The graph
Graphing Rational Functions
 Graphing Rational Functions Return to Table of Contents 109 Vocabulary Review x-intercept: The point where a graph intersects with the x-axis and the y-value is zero. y-intercept: The point where a graph
Section 1.6 & 1.7 Parent Functions and Transformations
 Math 150 c Lynch 1 of 8 Section 1.6 & 1.7 Parent Functions and Transformations Piecewise Functions Example 1. Graph the following piecewise functions. 2x + 3 if x < 0 (a) f(x) = x if x 0 1 2 (b) f(x) =
THE RECIPROCAL FUNCTION FAMILY AND RATIONAL FUNCTIONS AND THEIR GRAPHS L E S S O N 9-2 A N D L E S S O N 9-3
 THE RECIPROCAL FUNCTION FAMILY AND RATIONAL FUNCTIONS AND THEIR GRAPHS L E S S O N 9-2 A N D L E S S O N 9-3 ASSIGNMENT 2/12/15 Section 9-2 (p506) 2, 6, 16, 22, 24, 28, 30, 32 section 9-3 (p513) 1 18 Functions
September 18, B Math Test Chapter 1 Name: x can be expressed as: {y y 0, y R}.
 September 8, 208 62B Math Test Chapter Name: Part : Objective Questions [ mark each, total 2 marks]. State whether each of the following statements is TRUE or FALSE a) The mapping rule (x, y) (-x, y) represents
Mini-Project 1: The Library of Functions and Piecewise-Defined Functions
 Name Course Days/Start Time Mini-Project 1: The Library of Functions and Piecewise-Defined Functions Part A: The Library of Functions In your previous math class, you learned to graph equations containing
Section 3.7 Notes. Rational Functions. is a rational function. The graph of every rational function is smooth (no sharp corners)
") Section.7 Notes Rational Functions Introduction Definition A rational function is fraction of two polynomials. For example, f(x) = x x + x 5 Properties of Rational Graphs is a rational function. The graph
Section.7 Notes Rational Functions Introduction Definition A rational function is fraction of two polynomials. For example, f(x) = x x + x 5 Properties of Rational Graphs is a rational function. The graph
Unit 2: Function Transformation Chapter 1. Basic Transformations Reflections Inverses
 Unit 2: Function Transformation Chapter 1 Basic Transformations Reflections Inverses Section 1.1: Horizontal and Vertical Transformations A transformation of a function alters the equation and any combination
Lesson #1: Exponential Functions and Their Inverses Day 2
 Unit 5: Logarithmic Functions Lesson #1: Exponential Functions and Their Inverses Day 2 Exponential Functions & Their Inverses Exponential Functions are in the form. The inverse of an exponential is a
2.6: Rational Functions and Their Graphs
 2.6: Rational Functions and Their Graphs Rational Functions are quotients of polynomial functions. The of a rational expression is all real numbers except those that cause the to equal. Example 1 (like
Green Globs And Graphing Equations
 Green Globs And Graphing Equations Green Globs and Graphing Equations has four parts to it which serve as a tool, a review or testing device, and two games. The menu choices are: Equation Plotter which
Warm Up. Factor the following numbers and expressions. Multiply the following factors using either FOIL or Box Method
 Warm Up Factor the following numbers and expressions 1. 36 2. 36x 3 + 48x 2 + 24x Multiply the following factors using either FOIL or Box Method 3. (3x 2)(x 1) 4. (x 2)(x + 3) Objectives Recognize standard
AP Calculus Summer Review Packet
 AP Calculus Summer Review Packet Name: Date began: Completed: **A Formula Sheet has been stapled to the back for your convenience!** Email anytime with questions: danna.seigle@henry.k1.ga.us Complex Fractions
Math 2 Coordinate Geometry Part 3 Inequalities & Quadratics
 Math 2 Coordinate Geometry Part 3 Inequalities & Quadratics 1 DISTANCE BETWEEN TWO POINTS - REVIEW To find the distance between two points, use the Pythagorean theorem. The difference between x 1 and x
Polynomial and Rational Functions. Copyright Cengage Learning. All rights reserved.
 2 Polynomial and Rational Functions Copyright Cengage Learning. All rights reserved. 2.7 Graphs of Rational Functions Copyright Cengage Learning. All rights reserved. What You Should Learn Analyze and
AP Calculus AB Summer Review Packet
 AP Calculus AB Summer Review Packet Mr. Burrows Mrs. Deatherage 1. This packet is to be handed in to your Calculus teacher on the first day of the school year. 2. All work must be shown on separate paper
Radical and Rational Function Exam Questions
 Radical and Rational Function Exam Questions Name: ANSWERS 2 Multiple Choice 1. Identify the graph of the function x y. x 2. Given the graph of y f x, what is the domain of x f? a. x R b. 2 x 2 c. x 2
GRAPHING WORKSHOP. A graph of an equation is an illustration of a set of points whose coordinates satisfy the equation.
 GRAPHING WORKSHOP A graph of an equation is an illustration of a set of points whose coordinates satisfy the equation. The figure below shows a straight line drawn through the three points (2, 3), (-3,-2),
GRAPHING RATIONAL FUNCTIONS DAY 2 & 3. Unit 12
 1 GRAPHING RATIONAL FUNCTIONS DAY 2 & 3 Unit 12 2 Warm up! Analyze the graph Domain: Range: Even/Odd Symmetry: End behavior: Increasing: Decreasing: Intercepts: Vertical Asymptotes: Horizontal Asymptotes:
Learning Packet. Lesson 6 Exponents and Rational Functions THIS BOX FOR INSTRUCTOR GRADING USE ONLY
 Learning Packet Student Name Due Date Class Time/Day Submission Date THIS BOX FOR INSTRUCTOR GRADING USE ONLY Mini-Lesson is complete and information presented is as found on media links (0 5 pts) Comments:
Polynomial Functions Graphing Investigation Unit 3 Part B Day 1. Graph 1: y = (x 1) Graph 2: y = (x 1)(x + 2) Graph 3: y =(x 1)(x + 2)(x 3)
 Graph 2: y = (x 1)(x + 2) Graph 3: y =(x 1)(x + 2)(x 3)") Part I: Polynomial Functions when a = 1 Directions: Polynomial Functions Graphing Investigation Unit 3 Part B Day 1 1. For each set of factors, graph the zeros first, then use your calculator to determine
Part I: Polynomial Functions when a = 1 Directions: Polynomial Functions Graphing Investigation Unit 3 Part B Day 1 1. For each set of factors, graph the zeros first, then use your calculator to determine
SECTION 1.3: BASIC GRAPHS and SYMMETRY
 (Section.3: Basic Graphs and Symmetry).3. SECTION.3: BASIC GRAPHS and SYMMETRY LEARNING OBJECTIVES Know how to graph basic functions. Organize categories of basic graphs and recognize common properties,
Graphs and transformations, Mixed Exercise 4
 Graphs and transformations, Mixed Exercise 4 a y = x (x ) 0 = x (x ) So x = 0 or x = The curve crosses the x-axis at (, 0) and touches it at (0, 0). y = x x = x( x) As a = is negative, the graph has a
A function: A mathematical relationship between two variables (x and y), where every input value (usually x) has one output value (usually y)
, where every input value (usually x) has one output value (usually y)") SESSION 9: FUNCTIONS KEY CONCEPTS: Definitions & Terminology Graphs of Functions - Straight line - Parabola - Hyperbola - Exponential Sketching graphs Finding Equations Combinations of graphs TERMINOLOGY
SESSION 9: FUNCTIONS KEY CONCEPTS: Definitions & Terminology Graphs of Functions - Straight line - Parabola - Hyperbola - Exponential Sketching graphs Finding Equations Combinations of graphs TERMINOLOGY
SNAP Centre Workshop. Graphing Lines
 SNAP Centre Workshop Graphing Lines 45 Graphing a Line Using Test Values A simple way to linear equation involves finding test values, plotting the points on a coordinate plane, and connecting the points.
1.1 - Functions, Domain, and Range
 1.1 - Functions, Domain, and Range Lesson Outline Section 1: Difference between relations and functions Section 2: Use the vertical line test to check if it is a relation or a function Section 3: Domain
Algebra II Chapter 6: Rational Exponents and Radical Functions
 Algebra II Chapter 6: Rational Exponents and Radical Functions Chapter 6 Lesson 1 Evaluate nth Roots and Use Rational Exponents Vocabulary 1 Example 1: Find nth Roots Note: and Example 2: Evaluate Expressions
6B Quiz Review Learning Targets ,
 6B Quiz Review Learning Targets 5.10 6.3, 6.5-6.6 Key Facts Double transformations when more than one transformation is applied to a graph o You can still use our transformation rules to identify which
CCNY Math Review Chapter 2: Functions
 CCN Math Review Chapter : Functions Section.1: Functions.1.1: How functions are used.1.: Methods for defining functions.1.3: The graph of a function.1.: Domain and range.1.5: Relations, functions, and
Part I. Problems in this section are mostly short answer and multiple choice. Little partial credit will be given. 5 points each.
 Math 106/108 Final Exam Page 1 Part I. Problems in this section are mostly short answer and multiple choice. Little partial credit will be given. 5 points each. 1. Factor completely. Do not solve. a) 2x
Algebra 2CP S1 Final Exam Information. Your final exam will consist of two parts: Free Response and Multiple Choice
 Algebra 2CP Name Algebra 2CP S1 Final Exam Information Your final exam will consist of two parts: Free Response and Multiple Choice Part I: Free Response: Five questions, 10 points each (50 points total),
Math 121. Graphing Rational Functions Fall 2016
 Math 121. Graphing Rational Functions Fall 2016 1. Let x2 85 x 2 70. (a) State the domain of f, and simplify f if possible. (b) Find equations for the vertical asymptotes for the graph of f. (c) For each
Math Sections 4.4 and 4.5 Rational Functions. 1) A rational function is a quotient of polynomial functions:
 A rational function is a quotient of polynomial functions:") 1) A rational function is a quotient of polynomial functions: 2) Explain how you find the domain of a rational function: a) Write a rational function with domain x 3 b) Write a rational function with domain
1) A rational function is a quotient of polynomial functions: 2) Explain how you find the domain of a rational function: a) Write a rational function with domain x 3 b) Write a rational function with domain
Math 3 Coordinate Geometry Part 2 Graphing Solutions
 Math 3 Coordinate Geometry Part 2 Graphing Solutions 1 SOLVING SYSTEMS OF EQUATIONS GRAPHICALLY The solution of two linear equations is the point where the two lines intersect. For example, in the graph
Section Rational Functions and Inequalities. A rational function is a quotient of two polynomials. That is, is a rational function if
 Section 6.1 --- Rational Functions and Inequalities A rational function is a quotient of two polynomials. That is, is a rational function if =, where and are polynomials and is not the zero polynomial.
2.1 Basics of Functions and Their Graphs
 .1 Basics of Functions and Their Graphs Section.1 Notes Page 1 Domain: (input) all the x-values that make the equation defined Defined: There is no division by zero or square roots of negative numbers
Graphs and transformations 4G
 Graphs and transformations 4G a f(x + ) is a translation by one unit to the left. d A (0, ), B ( ),0, C (, 4), D (, 0) A (, ), B (0, 0), C (, 4), D (5, 0) e f(x) is a stretch with scale factor b f(x) 4
Objectives Graph and Analyze Rational Functions Find the Domain, Asymptotes, Holes, and Intercepts of a Rational Function
 SECTIONS 3.5: Rational Functions Objectives Graph and Analyze Rational Functions Find the Domain, Asymptotes, Holes, and Intercepts of a Rational Function I. Rational Functions A rational function is a
Math 370 Exam 1 Review Name. Use the vertical line test to determine whether or not the graph is a graph in which y is a function of x.
 Math 370 Exam 1 Review Name Determine whether the relation is a function. 1) {(-6, 6), (-6, -6), (1, 3), (3, -8), (8, -6)} Not a function The x-value -6 corresponds to two different y-values, so this relation
 Specific Objectives Students will understand that that the family of equation corresponds with the shape of the graph. Students will be able to create a graph of an equation by plotting points. In lesson
Walt Whitman High School SUMMER REVIEW PACKET. For students entering AP CALCULUS BC
 Walt Whitman High School SUMMER REVIEW PACKET For students entering AP CALCULUS BC Name: 1. This packet is to be handed in to your Calculus teacher on the first day of the school year.. All work must be
State the domain and range of the relation. EX: {(-1,1), (1,5), (0,3)} 1 P a g e Province Mathematics Southwest TN Community College
, (1,5), (0,3)} 1 P a g e Province Mathematics Southwest TN Community College") A relation is a set of ordered pairs of real numbers. The domain, D, of a relation is the set of all first coordinates of the ordered pairs in the relation (the xs). The range, R, of a relation is the
A relation is a set of ordered pairs of real numbers. The domain, D, of a relation is the set of all first coordinates of the ordered pairs in the relation (the xs). The range, R, of a relation is the
Warm Up Simplify each expression. Assume all variables are nonzero.
 Warm Up Simplify each expression. Assume all variables are nonzero. 1. x 5 x 2 3. x 6 x 2 x 7 x 4 Factor each expression. 2. y 3 y 3 y 6 4. y 2 1 y 5 y 3 5. x 2 2x 8 (x 4)(x + 2) 6. x 2 5x x(x 5) 7. x
Properties of a Function s Graph
 Section 3.2 Properties of a Function s Graph Objective 1: Determining the Intercepts of a Function An intercept of a function is a point on the graph of a function where the graph either crosses or touches
College Algebra. Fifth Edition. James Stewart Lothar Redlin Saleem Watson
 College Algebra Fifth Edition James Stewart Lothar Redlin Saleem Watson 4 Polynomial and Rational Functions 4.6 Rational Functions Rational Functions A rational function is a function of the form Px (
Transformations with Quadratic Functions KEY
 Algebra Unit: 05 Lesson: 0 TRY THIS! Use a calculator to generate a table of values for the function y = ( x 3) + 4 y = ( x 3) x + y 4 Next, simplify the function by squaring, distributing, and collecting
Quadratic Equations. Learning Objectives. Quadratic Function 2. where a, b, and c are real numbers and a 0
 Quadratic Equations Learning Objectives 1. Graph a quadratic function using transformations. Identify the vertex and axis of symmetry of a quadratic function 3. Graph a quadratic function using its vertex,
Math Analysis Chapter 1 Notes: Functions and Graphs
 Math Analysis Chapter 1 Notes: Functions and Graphs Day 6: Section 1-1 Graphs Points and Ordered Pairs The Rectangular Coordinate System (aka: The Cartesian coordinate system) Practice: Label each on the
MAT 003 Brian Killough s Instructor Notes Saint Leo University
 MAT 003 Brian Killough s Instructor Notes Saint Leo University Success in online courses requires self-motivation and discipline. It is anticipated that students will read the textbook and complete sample
Section 2.2 Graphs of Linear Functions
 Section. Graphs of Linear Functions Section. Graphs of Linear Functions When we are working with a new function, it is useful to know as much as we can about the function: its graph, where the function
MAT 123 Practice for Midterm 1 with Solutions
 MAT 123 Practice for with Solutions Remark. If you are comfortable with all of the following problems, you will be well prepared for. Exam Policies. You must show up on time for all exams. Please bring
Intro. To Graphing Linear Equations
 Intro. To Graphing Linear Equations The Coordinate Plane A. The coordinate plane has 4 quadrants. B. Each point in the coordinate plain has an x-coordinate (the abscissa) and a y-coordinate (the ordinate).
Name Course Days/Start Time
 Name Course Days/Start Time Mini-Project : The Library of Functions In your previous math class, you learned to graph equations containing two variables by finding and plotting points. In this class, we
We want to determine what the graph of an exponential function y = a x looks like for all values of a such that 0 < a < 1
 Section 5 2B: Graphs of Decreasing Eponential Functions We want to determine what the graph of an eponential function y = a looks like for all values of a such that 0 < a < We will select a value of a
Obtaining Information from a Function s Graph.
 Obtaining Information from a Function s Graph Summary about using closed dots, open dots, and arrows on the graphs 1 A closed dot indicate that the graph does not extend beyond this point and the point
= ( )= To find the domain, we look at the vertical asymptote(s) (where denominator equals zero) , =0
= To find the domain, we look at the vertical asymptote(s) (where denominator equals zero) , =0") Precalculus College Algebra Review for Final Name It is also a good idea to go back through your old tests and quizzes to review. 1. Find (+1) given ()=3 +1 2. Determine () given ()=+2 and ()= (+1)=3(+1)
Precalculus College Algebra Review for Final Name It is also a good idea to go back through your old tests and quizzes to review. 1. Find (+1) given ()=3 +1 2. Determine () given ()=+2 and ()= (+1)=3(+1)
Exploring Rational Functions
 Name Date Period Exploring Rational Functions Part I - The numerator is a constant and the denominator is a linear factor. 1. The parent function for rational functions is: Graph and analyze this function:
Ch. 8.7 Graphs of Rational Functions Learning Intentions: Identify characteristics of the graph of a rational function from its equation.
 Ch. 8.7 Graphs of Rational Functions Learning Intentions: Identify characteristics of the graph of a rational function from its equation. Learn to write the equation of a rational function from its graph.
4.4 Absolute Value Equations. What is the absolute value of a number? Example 1 Simplify a) 6 b) 4 c) 7 3. Example 2 Solve x = 2
 6 b) 4 c) 7 3. Example 2 Solve x = 2") 4.4 Absolute Value Equations What is the absolute value of a number? Eample Simplif a) 6 b) 4 c) 7 3 Eample Solve = Steps for solving an absolute value equation: ) Get the absolute value b itself on one
4.4 Absolute Value Equations What is the absolute value of a number? Eample Simplif a) 6 b) 4 c) 7 3 Eample Solve = Steps for solving an absolute value equation: ) Get the absolute value b itself on one
FUNCTIONS. L f(2)= 2. g(-3)= _ 3. f(t+l)= _. g(x) ) in for x in the outside function (in this case, f(x)).
= 2. g(-3)= _ 3. f(t+l)= _. g(x) ) in for x in the outside function (in this case, f(x)).") FUNCTIONS To evaluate a function for a given value, simply plug the value into the function for x. Recall: (f 0 g ) (x) = f(g(x)) OR f[g(x)] read 'Jofg of x" Means to plug the inside function (in this
FUNCTIONS To evaluate a function for a given value, simply plug the value into the function for x. Recall: (f 0 g ) (x) = f(g(x)) OR f[g(x)] read 'Jofg of x" Means to plug the inside function (in this
1 Review of Functions Symmetry of Functions; Even and Odd Combinations of Functions... 42
 Contents 0.1 Basic Facts...................................... 8 0.2 Factoring Formulas.................................. 9 1 Review of Functions 15 1.1 Functions.......................................
1. Answer: x or x. Explanation Set up the two equations, then solve each equation. x. Check
 Thinkwell s Placement Test 5 Answer Key If you answered 7 or more Test 5 questions correctly, we recommend Thinkwell's Algebra. If you answered fewer than 7 Test 5 questions correctly, we recommend Thinkwell's
2. The diagram shows part of the graph of y = a (x h) 2 + k. The graph has its vertex at P, and passes through the point A with coordinates (1, 0).
 2 + k. The graph has its vertex at P, and passes through the point A with coordinates (1, 0).") Quadratics Vertex Form 1. Part of the graph of the function y = d (x m) + p is given in the diagram below. The x-intercepts are (1, 0) and (5, 0). The vertex is V(m, ). (a) Write down the value of (i)
Quadratics Vertex Form 1. Part of the graph of the function y = d (x m) + p is given in the diagram below. The x-intercepts are (1, 0) and (5, 0). The vertex is V(m, ). (a) Write down the value of (i)
Section 4.3. Graphing Exponential Functions
 Graphing Exponential Functions Graphing Exponential Functions with b > 1 Graph f x = ( ) 2 x Graphing Exponential Functions by hand. List input output pairs (see table) Input increases by 1 and output
In this class, we addressed problem 14 from Chapter 2. So first step, we expressed the problem in STANDARD FORM:
 In this class, we addressed problem 14 from Chapter 2. So first step, we expressed the problem in STANDARD FORM: Now that we have done that, we want to plot our constraint lines, so we can find our feasible
Functions. Copyright Cengage Learning. All rights reserved.
 Functions Copyright Cengage Learning. All rights reserved. 2.2 Graphs Of Functions Copyright Cengage Learning. All rights reserved. Objectives Graphing Functions by Plotting Points Graphing Functions with
Unit 1 and Unit 2 Concept Overview
 Unit 1 and Unit 2 Concept Overview Unit 1 Do you recognize your basic parent functions? Transformations a. Inside Parameters i. Horizontal ii. Shift (do the opposite of what feels right) 1. f(x+h)=left
Algebra II Lesson 10-5: Hyperbolas Mrs. Snow, Instructor
 Algebra II Lesson 10-5: Hyperbolas Mrs. Snow, Instructor In this section, we will look at the hyperbola. A hyperbola is a set of points P in a plane such that the absolute value of the difference between
1.2 Reflections and Stretches
 Chapter Part : Reflections.2 Reflections and Stretches Pages 6 3 Investigating a reflection in the x axis:. a) Complete the following table for and sketch on the axis provided. x 2 0 2 y b) Now sketch
Math 101 Exam 1 Review
 Math 101 Exam 1 Review Reminder: Exam 1 will be on Friday, October 14, 011 at 8am. It will cover sections 1.1, 1. and 10.1 10.3 Room Assignments: Room Sections Nesbitt 111 9, 14, 3, 4, 8 Nesbitt 15 0,
MAC Learning Objectives. Transformation of Graphs. Module 5 Transformation of Graphs. - A Library of Functions - Transformation of Graphs
 MAC 1105 Module 5 Transformation of Graphs Learning Objectives Upon completing this module, you should be able to: 1. Recognize the characteristics common to families of functions. 2. Evaluate and graph
MAC Module 5 Transformation of Graphs. Rev.S08
 MAC 1105 Module 5 Transformation of Graphs Learning Objectives Upon completing this module, you should be able to: 1. Recognize the characteristics common to families of functions. 2. Evaluate and graph
3. Solve the following. Round to the nearest thousandth.
 This review does NOT cover everything! Be sure to go over all notes, homework, and tests that were given throughout the semester. 1. Given g ( x) i, h( x) x 4x x, f ( x) x, evaluate the following: a) f
Trigonometry I -- Answers -- Trigonometry I Diploma Practice Exam - ANSWERS 1
 Trigonometry I -- Answers -- Trigonometry I Diploma Practice Exam - ANSWERS www.puremath.com Formulas These are the formulas for Trig I you will be given on your diploma. a rθ sinθ cosθ tan θ cotθ cosθ
1.1 Functions. Cartesian Coordinate System
 1.1 Functions This section deals with the topic of functions, one of the most important topics in all of mathematics. Let s discuss the idea of the Cartesian coordinate system first. Cartesian Coordinate
3.1. 3x 4y = 12 3(0) 4y = 12. 3x 4y = 12 3x 4(0) = y = x 0 = 12. 4y = 12 y = 3. 3x = 12 x = 4. The Rectangular Coordinate System
 4y = 12. 3x 4y = 12 3x 4(0) = y = x 0 = 12. 4y = 12 y = 3. 3x = 12 x = 4. The Rectangular Coordinate System") 3. The Rectangular Coordinate System Interpret a line graph. Objectives Interpret a line graph. Plot ordered pairs. 3 Find ordered pairs that satisfy a given equation. 4 Graph lines. 5 Find x- and y-intercepts.
3. The Rectangular Coordinate System Interpret a line graph. Objectives Interpret a line graph. Plot ordered pairs. 3 Find ordered pairs that satisfy a given equation. 4 Graph lines. 5 Find x- and y-intercepts.
Pre-Calculus Summer Assignment
 Pre-Calculus Summer Assignment Identify the vertex and the axis of symmetry of the parabola. Identify points corresponding to P and Q. 1. 2. Find a quadratic model for the set of values. 3. x 2 0 4 f(x)
Exploring Quadratic Graphs
 Exploring Quadratic Graphs The general quadratic function is y=ax 2 +bx+c It has one of two basic graphs shapes, as shown below: It is a symmetrical "U"-shape or "hump"-shape, depending on the sign of