Debugging in Small Basic is the process of analysing a program to detect and fix errors or improve functionality in some way.
|
|
|
- Jonah Allison
- 5 years ago
- Views:
Transcription
1 How to Debug Introduction Debugging in Small Basic is the process of analysing a program to detect and fix errors or improve functionality in some way. In order to debug a program it must first compile and run with no syntax errors in the source code, so fix these first. Using standard Small Basic the techniques to debug a program mainly rely on adding TextWindow.WriteLine commands or some other way to see the value of variables at key points in the program. Other commands that can be useful are GraphicsWindow.Title (write simple data to the GraphicsWindow title bar), Program.Delay (to slow a dynamic program to see what is happening on the screen) or Sound.PlayClickAndWait (to give an audible indication that some piece of code was executed). This document is about extended debugging using SB-Prime. Overview Debugging runs the program as normal, except that the program can be paused at specific lines of your code. When the program is paused, the current line is highlighted with a yellow background colour. Also, when paused, the values of variables can be checked or even changed. When paused, the program can also be advanced line-by-line so you can see the path taken, for example which branch of an If statement is taken. As well as advancing line by line you can step over or out of subroutines. This means it can be easier to get to a point in your code where something doesn t seem to work as expected. Another way to get the program to pause at a point you want is by setting breakpoints. These can be set at any line in the code and the program will pause when a break-point line is reached. Finally, it is possible to pause the program when the value of a variable changes, or becomes greater than, less than or equal to a certain value. So for example, you want the program to pause when a game score is at a value that is causing problems. So, in summary debugging allows you to trace the route through a program, checking variables as it proceeds, ensuring it is behaving as you want.

2 Debug Ribbon Bar To debug your program, first make sure it complies and runs. This example shows the PaintProgram.sb sample that comes with Small Basic. Next select the Debug ribbon bar. When the debug ribbon bar is selected, the Debug tab at the bottom of the IDE is also selected. Errors and warnings will continue to be sent to the Output tab, so this can also be checked if any errors occur. For example, you can only debug one program at a time. Occasionally if a program crashes you may have to manually kill the program process, however usually pressing Stop will reset everything to start a new debugging run. Various commands have function key shortcuts, such as F6 to start debugging or F9 to toggle break-points. The function keys are shown in the tooltip for buttons where they are available. Run and Step Commands Start or resume running the program. You can interact normally with the program only while it is running. The program will continue running until it is paused.
3 Stop and close the current program, if it is running or paused. Pause a running program at its current location. Step to the next statement, this will step into a subroutine if the next statement calls a subroutine. You can also use this to start and pause at the first statement in a program. Step over the next statement. This is the same as the step unless the statement is a subroutine, in which case the entire subroutine is run and the program is paused when the subroutine has completed. Step out will complete the current subroutine and pause when the subroutine is exited. Therefore this method only really applies when you are currently paused within a subroutine. Break Points Toggle setting a break-point on the current line. The program will break and pause when a break-point line is reached. Break-points are shown as red circles on the left of the code window. Break-points can also be set or unset by clicking to the left of the line numbers. A red circle appears in the first column of the left margin when a break-point is set. Remove all break-points. Toggle to temporarily disable all break-points. Book Marks Bookmarks do not interact with the debugger, but can be useful in a long program to quickly move between different sections of the program. Watch Variables Variables may be added to the watch list in the Debug tab at the bottom of the IDE. The variable name may be entered directly. Alternatively a variable may be selected in the program code and added with Ctrl+W or using right click context menu.
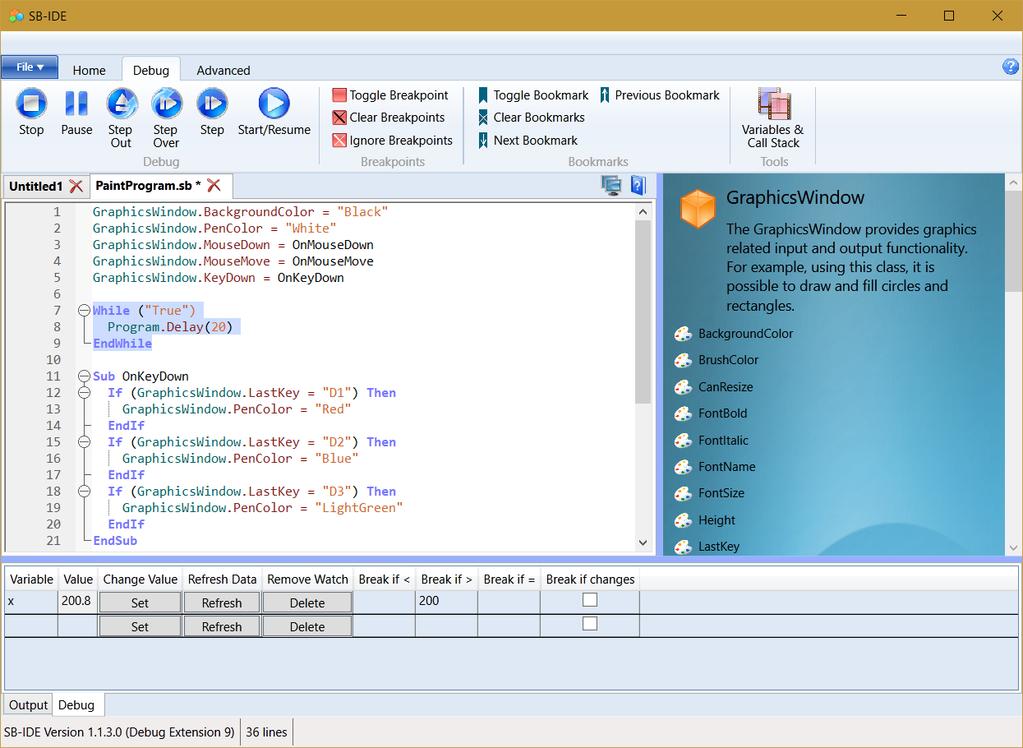
4 Whenever the program is paused the current value of the watch variables will be shown. Various options for the watch variable may be used to change the current value of a variable, or pause the program when the value of the variable changes or becomes greater than or less than or equal to a set value. You can also use the [] notation to watch array elements, e.g. data[5] or data[i]. Variables and Call Stack Use this option to create a window that displays all of the program variable values and subroutine call stack every time the program is paused. Example Using the PainProgram.sb example we are going to set a break-point inside the OnMouseDown event subroutine and set a watch parameter to pause the program when the variable x is greater than 200. Doing this should leave your program looking like this: Now we can either run the program or step into the first line we do the second by pressing Step.
.")
5 The program is now paused at the first line, the variable x has not been set yet so no value is shown. Note that default values for unset variables in Small Basic is zero, so this could be confusing if you set conditional watch break-points that trigger for a value of zero (e.g. x < 200). Now we can continue by pressing Start/Resume. The program is now running and the GraphicsWindow with a black background appears. We can move our windows or select the GraphicsWindow to interact with it. Draw a line in the left part of the window, x < 200. Hint, make sure you enter the GraphicsWindow from the left, otherwise x may be > 200. As soon as you press the mouse down the program pauses at the break point.
6 Note that the variable x now has a value. The current value of any variable can also be view when paused by hovering the mouse over a variable name in the program. You can also use the Variables and Call Stack button shows the values of all variables. Advance one step window. to bring up a window that to update the data in this

7 Now remove the break point in the subroutine OnMouseDown, simply by clicking the red circle in the left margin on line 20. Press to continue the program, and draw a line, this time that has x > 200. At any point when x become greater than 200 the program will pause.
8 You can experiment changing the conditions for watch variables to pause the code. You can also change the value of a variable by typing a new value in the Value column of the watch list and pressing the Set button. This example is useful to show how to debug, but there is an issue with some aspects of this program under some circumstances. The problem is that the main UI thread actually ends and all the action occurs inside event subroutines. For programs of this type it is sometimes useful to add a dummy Game Loop to keep the main UI thread running, perhaps like this:
9
Introduction to IntelliJ
 Introduction to IntelliJ IntelliJ is a large software package used by professional software developers. This document will give you a brief introduction but is by no means exhaustive. If you have questions
Supplement: Visual C++ Debugging
 Supplement: Visual C++ Debugging For Introduction to C++ Programming By Y. Daniel Liang Note: The screen shots are taken from VC++ 2010. It is the same for the later version. 1 Introduction The debugger
Chapter 12 Visual Program Debugger
 Chapter 12 Visual Program Debugger In the previous chapter on programs a section titled Getting programs to do what you want discussed using the log to trace how programs execute. That is a useful technique
Lab 8 - Vectors, and Debugging. Directions
 Lab 8 - Vectors, and Debugging. Directions The labs are marked based on attendance and effort. It is your responsibility to ensure the TA records your progress by the end of the lab. While completing these
Programming Logic - Beginning
 Programming Logic - Beginning 152-101 Debugging Applications Quick Links & Text References Debugging Concepts Pages Debugging Terminology Pages Debugging in Visual Studio Pages Breakpoints Pages Watches
Under the Debug menu, there are two menu items for executing your code: the Start (F5) option and the
 option and the") CS106B Summer 2013 Handout #07P June 24, 2013 Debugging with Visual Studio This handout has many authors including Eric Roberts, Julie Zelenski, Stacey Doerr, Justin Manis, Justin Santamaria, and Jason
CS106B Summer 2013 Handout #07P June 24, 2013 Debugging with Visual Studio This handout has many authors including Eric Roberts, Julie Zelenski, Stacey Doerr, Justin Manis, Justin Santamaria, and Jason
The NetBeans IDE is a big file --- a minimum of around 30 MB. After you have downloaded the file, simply execute the file to install the software.
 Introduction to Netbeans This document is a brief introduction to writing and compiling a program using the NetBeans Integrated Development Environment (IDE). An IDE is a program that automates and makes
The NetBeans Debugger: A Brief Tutorial
 The NetBeans Debugger: A Brief Tutorial Based on a tutorial by Anousha Mesbah from the University of Georgia NetBeans provides a debugging tool that lets you trace the execution of a program step by step.
GDB Tutorial. A Walkthrough with Examples. CMSC Spring Last modified March 22, GDB Tutorial
 A Walkthrough with Examples CMSC 212 - Spring 2009 Last modified March 22, 2009 What is gdb? GNU Debugger A debugger for several languages, including C and C++ It allows you to inspect what the program
GETTING STARTED WITH ECLIPSE Caitrin Armstrong
 GETTING STARTED WITH ECLIPSE Caitrin Armstrong 1 THE ECLIPSE IDE IDE = Integrated Development Environment Language-neutral: Java, C, HTML, Powerful, advanced features that help with code development (e.g.
NetBeans Tutorial. For Introduction to Java Programming By Y. Daniel Liang. This tutorial applies to NetBeans 6, 7, or a higher version.
 NetBeans Tutorial For Introduction to Java Programming By Y. Daniel Liang This tutorial applies to NetBeans 6, 7, or a higher version. This supplement covers the following topics: Getting Started with
Debugging Code in Access 2002
 0672321025 AppA 10/24/01 3:53 PM Page 1 Debugging Code in Access 2002 APPENDIX A IN THIS APPENDIX Setting the Correct Module Options for Maximum Debugging Power 2 Using the Immediate Window 6 Stopping
Code::Blocks Student Manual
 Code::Blocks Student Manual Lawrence Goetz, Network Administrator Yedidyah Langsam, Professor and Theodore Raphan, Distinguished Professor Dept. of Computer and Information Science Brooklyn College of
Code::Blocks Student Manual
 Code::Blocks Student Manual Lawrence Goetz, Network Administrator Yedidyah Langsam, Professor and Theodore Raphan, Distinguished Professor Dept. of Computer and Information Science Brooklyn College of
Laboratory Assignment #4 Debugging in Eclipse CDT 1
 Lab 4 (10 points) November 20, 2013 CS-2301, System Programming for Non-majors, B-term 2013 Objective Laboratory Assignment #4 Debugging in Eclipse CDT 1 Due: at 11:59 pm on the day of your lab session
BasicScript 2.25 User s Guide. May 29, 1996
 BasicScript 2.25 User s Guide May 29, 1996 Information in this document is subject to change without notice. No part of this document may be reproduced or transmitted in any form or by any means, electronic
Parallel Debugging. ª Objective. ª Contents. ª Learn the basics of debugging parallel programs
 ª Objective ª Learn the basics of debugging parallel programs ª Contents ª Launching a debug session ª The Parallel Debug Perspective ª Controlling sets of processes ª Controlling individual processes
Introduction. Key features and lab exercises to familiarize new users to the Visual environment
 Introduction Key features and lab exercises to familiarize new users to the Visual environment January 1999 CONTENTS KEY FEATURES... 3 Statement Completion Options 3 Auto List Members 3 Auto Type Info
HOW TO USE CODE::BLOCKS IDE FOR COMPUTER PROGRAMMING LABORATORY SESSIONS
 HOW TO USE CODE::BLOCKS IDE FOR COMPUTER PROGRAMMING LABORATORY SESSIONS INTRODUCTION A program written in a computer language, such as C/C++, is turned into executable using special translator software.
7 The Integrated Debugger
 7 The Integrated Debugger Your skill set for writing programs would not be complete without knowing how to use a debugger. While a debugger is traditionally associated with finding bugs, it can also be
JCreator. Starting JCreator
 1 of 12 9/29/2005 2:31 PM JCreator JCreator is a commercial Java environment available from http://www.jcreator.com. Inexpensive academic licenses and a free "limited edition" are available. JCreator runs
We are built to make mistakes, coded for error. Lewis Thomas
 Debugging in Eclipse Debugging 1 We are built to make mistakes, coded for error. Lewis Thomas It is one thing to show a man that he is in error, and another to put him in possession of the truth. John
Your code must have been compiled with the -g compiler option. Example:
 ddd Tips This provides some helpful information about the Unix ddd debugger. with more detailed information: There are other resources available gnu ddd manual matloff ddd information Contents Prerequisites...
1 Introduction to MARS
 1 Introduction to MARS 1.1 Objectives After completing this lab, you will: Get familiar with the MARS simulator Learn how to assemble, run, and debug a MIPS program 1.2 The MARS Simulator MARS, the MIPS
First, let s just try to run the program. When we click the button we get the error message shown below:
 VB.NET Debugging Tool Appendix D If a program is not running the way you intend, then you will have to debug the program. Debugging is the process of finding and correcting the errors. There are two general
BASICS OF THE RENESAS SYNERGY PLATFORM
 BASICS OF THE RENESAS SYNERGY PLATFORM TM Richard Oed 2018.11 02 CHAPTER 11 EVENT ANALYSIS WITH TRACEX CONTENTS 11 EVENT ANALYSIS WITH TRACEX 03 11.1 An Introduction to TraceX 03 11.2 Built-in Views and
Setting up a Project and Debugging with Visual Studio
 Setting up a Project and Debugging with Visual Studio Contents Setup Visual Studio to compile a DLL ---------------------------------------------------------------- 1 Step 1: Install Visual Studio Express
11Debugging and Handling. C# Programming: From Problem Analysis to Program Design 2nd Edition. David McDonald, Ph.D. Director of Emerging Technologies
 11Debugging and Handling 11Exceptions C# Programming: From Problem Analysis to Program Design 2nd Edition David McDonald, Ph.D. Director of Emerging Technologies Chapter Objectives Learn about exceptions,
SQL Server Whitepaper DEMYSTIFYING DEBUGGING TECHNIQUES WITH SQL SERVER BY PINAL DAVE
 SQL Server Whitepaper DEMYSTIFYING DEBUGGING TECHNIQUES WITH SQL SERVER BY PINAL DAVE INTRODUCTION The greatest happiness for a father is to see our children grow in front of our very own eyes. My daughter
Visual Studio.NET. Although it is possible to program.net using only the command OVERVIEW OF VISUAL STUDIO.NET
 Chapter. 03 9/17/01 6:08 PM Page 35 Visual Studio.NET T H R E E Although it is possible to program.net using only the command line compiler, it is much easier and more enjoyable to use Visual Studio.NET.
SECTION 2: HW3 Setup.
 SECTION 2: HW3 Setup cse331-staff@cs.washington.edu slides borrowed and adapted from Alex Mariakis,CSE 390a,Justin Bare, Deric Pang, Erin Peach, Vinod Rathnam LINKS TO DETAILED SETUP AND USAGE INSTRUCTIONS
Chapter 4 Working with Arena
 Chapter 4 Working with Arena What We ll Do... User interface Menus (including Running) Toolbars Help Model windows Drawing Printing Running Building the simple processing model Simulation with Arena Chapter
Debugging and testing
 Debugging and testing Level 3 Extended Diploma Unit 22 Developing Computer Games Ref: https://developers.google.com/chrome-developer-tools/docs/overview Developer Tools Notepad++ Syntax highlighting Syntax
VB Net Debugging (Console)
") VB Net Debugging (Console) Introduction A bug is some sort of error in the code which can prevent your program from running properly. When. you write a substantial program always assume that it contains
VB Net Debugging (Console) Introduction A bug is some sort of error in the code which can prevent your program from running properly. When. you write a substantial program always assume that it contains
CHAPTER 1. Interface Overview 3 CHAPTER 2. Menus 17 CHAPTER 3. Toolbars and Tools 33 CHAPTER 4. Timelines and Screens 61 CHAPTER 5.
 FLASH WORKSPACE CHAPTER 1 Interface Overview 3 CHAPTER 2 Menus 17 CHAPTER 3 Toolbars and Tools 33 CHAPTER 4 Timelines and Screens 61 CHAPTER 5 Panels 69 CHAPTER 6 Preferences and Printing 93 COPYRIGHTED
Outline. Debugging. In Class Exercise Solution. Review If Else If. Immediate Program Errors. Function Test Example
 Debugging Larry Caretto Mechanical Engineering 209 Computer Programming for Mechanical Engineers February 16, 2017 Outline Review choice statements Finding and correcting program errors Debugging toolbar
After completing this appendix, you will be able to:
 1418835463_AppendixA.qxd 5/22/06 02:31 PM Page 879 A P P E N D I X A A DEBUGGING After completing this appendix, you will be able to: Describe the types of programming errors Trace statement execution
Flow of Control: Loops
 Walter Savitch Frank M. Carrano Flow of Control: Loops Chapter 4 Java Loop Statements: Outline The while statement The do-while statement The for Statement Java Loop Statements A portion of a program that
Creating Breakout - Part 2
 Creating Breakout - Part 2 Adapted from Basic Projects: Game Maker by David Waller So the game works, it is a functioning game. It s not very challenging though, and it could use some more work to make
Starting Embedded C Programming CM0506 Small Embedded Systems
 Starting Embedded C Programming CM0506 Small Embedded Systems Dr Alun Moon 19th September 2016 This exercise will introduce you to using the development environment to compile, build, downnload, and debug
Enterprise Architect. User Guide Series. Profiling
 Enterprise Architect User Guide Series Profiling Investigating application performance? The Sparx Systems Enterprise Architect Profiler finds the actions and their functions that are consuming the application,
Enterprise Architect. User Guide Series. Profiling. Author: Sparx Systems. Date: 10/05/2018. Version: 1.0 CREATED WITH
 Enterprise Architect User Guide Series Profiling Author: Sparx Systems Date: 10/05/2018 Version: 1.0 CREATED WITH Table of Contents Profiling 3 System Requirements 8 Getting Started 9 Call Graph 11 Stack
Mastering the Visual LISP Integrated Development Environment
 Mastering the Visual LISP Integrated Development Environment R. Robert Bell Sparling SD7297 How do you create and edit your AutoLISP programming language software code? Are you using a text editor such
Debugging with GDB and DDT
 Debugging with GDB and DDT Ramses van Zon SciNet HPC Consortium University of Toronto June 13, 2014 1/41 Ontario HPC Summerschool 2014 Central Edition: Toronto Outline Debugging Basics Debugging with the
Debugging INTRODUCTION DEBUGGER WHAT IS VBA'S DEBUGGING ENVIRONMENT?
 Debugging INTRODUCTION Logic errors are called bugs. The process of finding and correcting errors is called debugging. A common approach to debugging is to use a combination of methods to narrow down to
IDE: Integrated Development Environment
 Name: Student ID: Lab Instructor: Borja Sotomayor Do not write in this area 1 2 3 TOTAL Maximum possible points: 30 One of the goals of this lab is to introduce the Eclipse IDE, a software environment
1.00 Lecture 2. What s an IDE?
 1.00 Lecture 2 Interactive Development Environment: Eclipse Reading for next time: Big Java: sections 3.1-3.9 (Pretend the method is main() in each example) What s an IDE? An integrated development environment
COPYRIGHTED MATERIAL. Part I: Getting Started. Chapter 1: IDE. Chapter 2: Controls in General. Chapter 3: Program and Module Structure
 Part I: Getting Started Chapter 1: IDE Chapter 2: Controls in General Chapter 3: Program and Module Structure Chapter 4: Data Types, Variables, and Constants Chapter 5: Operators Chapter 6: Subroutines
Step through Your DATA Step: Introducing the DATA Step Debugger in SAS Enterprise Guide
 SAS447-2017 Step through Your DATA Step: Introducing the DATA Step Debugger in SAS Enterprise Guide ABSTRACT Joe Flynn, SAS Institute Inc. Have you ever run SAS code with a DATA step and the results are
ATMS ACTION TRACKING MANAGEMENT SYSTEM. Quick Start Guide. The ATMS dev team
 ATMS ACTION TRACKING MANAGEMENT SYSTEM Quick Start Guide The ATMS dev team Contents What is ATMS?... 2 How does ATMS work?... 2 I get it, now where can I find more info?... 2 What s next?... 2 Welcome
An Introduction to Komodo
 An Introduction to Komodo The Komodo debugger and simulator is the low-level debugger used in the Digital Systems Laboratory. Like all debuggers, Komodo allows you to run your programs under controlled
Your code must have been compiled with the -g compiler option. Example:
 ddd Tips This provides some helpful information about the Unix ddd debugger. with more detailed information: There are other resources available gnu ddd manual matloff ddd information Contents Prerequisites...
Prerequisites for Eclipse
 Prerequisites for Eclipse 1 To use Eclipse you must have an installed version of the Java Runtime Environment (JRE). The latest version is available from java.com/en/download/manual.jsp Since Eclipse includes
Visual Studio.NET. Rex Jaeschke
 Visual Studio.NET Rex Jaeschke Copyright c 2002, 2005 Rex Jaeschke. All rights reserved. Edition: 2.0 (matches V2) Printing: August 6, 2005 All rights reserved. No part of this publication may be reproduced,
Supplement H.1: JBuilder X Tutorial. For Introduction to Java Programming, 5E By Y. Daniel Liang
 Supplement H.1: JBuilder X Tutorial For Introduction to Java Programming, 5E By Y. Daniel Liang This supplement covers the following topics: Getting Started with JBuilder Creating a Project Creating, Compiling,
Debugging and Handling Exceptions
 12 Debugging and Handling Exceptions C# Programming: From Problem Analysis to Program Design C# Programming: From Problem Analysis to Program Design 1 4th Edition Chapter Objectives Learn about exceptions,
Supplement II.B(1): JBuilder X Tutorial. For Introduction to Java Programming By Y. Daniel Liang
: JBuilder X Tutorial. For Introduction to Java Programming By Y. Daniel Liang") Supplement II.B(1): JBuilder X Tutorial For Introduction to Java Programming By Y. Daniel Liang This supplement covers the following topics: Getting Started with JBuilder Creating a Project Creating, Compiling,
Supplement II.B(1): JBuilder X Tutorial For Introduction to Java Programming By Y. Daniel Liang This supplement covers the following topics: Getting Started with JBuilder Creating a Project Creating, Compiling,
the NXT-G programming environment
 2 the NXT-G programming environment This chapter takes a close look at the NXT-G programming environment and presents a few simple programs. The NXT-G programming environment is fairly complex, with lots
HPCC - Hrothgar. Getting Started User Guide TotalView. High Performance Computing Center Texas Tech University
 HPCC - Hrothgar Getting Started User Guide TotalView High Performance Computing Center Texas Tech University HPCC - Hrothgar 2 Table of Contents *This user guide is under development... 3 1. Introduction...
Section 2: Developer tools and you. Alex Mariakakis (staff-wide)
") Section 2: Developer tools and you Alex Mariakakis cse331-staff@cs.washington.edu (staff-wide) What is an SSH client? Uses the secure shell protocol (SSH) to connect to a remote computer o Enables you
Section 2: Developer tools and you Alex Mariakakis cse331-staff@cs.washington.edu (staff-wide) What is an SSH client? Uses the secure shell protocol (SSH) to connect to a remote computer o Enables you
Enterprise Architect. User Guide Series. Portals. Author: Sparx Systems. Date: 19/03/2018. Version: 1.0 CREATED WITH
 Enterprise Architect User Guide Series Portals Author: Sparx Systems Date: 19/03/2018 Version: 1.0 CREATED WITH Table of Contents Portals 3 Perspective Portal 6 Workspace Portal 7 Window Portal 9 Status
Intro to MS Visual C++ Debugging
 Intro to MS Visual C++ Debugging 1 Debugger Definition A program used to control the execution of another program for diagnostic purposes. Debugger Features / Operations Single-Stepping 100011101010101010
Enterprise Architect. User Guide Series. Portals
 Enterprise Architect User Guide Series Portals What are Portals? In Sparx Systems Enterprise Architect, each Portal is a high-level logical grouping of common tools, custom searches, window layouts and
Chapter 24 Control User Interface
 Chapter 24 Control User Interface The Control Interface sometimes called the Touch Screen Interface even though it works well on non-touch screens - is an alternative user interface that can be used to
Enterprise Architect. User Guide Series. Portals
 Enterprise Architect User Guide Series Portals What are Portals? In Sparx Systems Enterprise Architect, each Portal is a high-level logical grouping of common tools, custom searches, window layouts and
Introduction to Computation and Problem Solving
 Class 3: The Eclipse IDE Introduction to Computation and Problem Solving Prof. Steven R. Lerman and Dr. V. Judson Harward What is an IDE? An integrated development environment (IDE) is an environment in
Product Updates TPFUG 2019, Denver
 1 Product Updates TPFUG 2019, Denver Agenda ztpfgi Releases JavaNow Multiple System Support DFDL with Rest API zqdc Automation Dump Viewer Source, TPFDF, DETAC Color Customization Other Enhancements ztpfgi
2 Getting Started. Getting Started (v1.8.6) 3/5/2007
 3/5/2007") 2 Getting Started Java will be used in the examples in this section; however, the information applies to all supported languages for which you have installed a compiler (e.g., Ada, C, C++, Java) unless
2 Getting Started Java will be used in the examples in this section; however, the information applies to all supported languages for which you have installed a compiler (e.g., Ada, C, C++, Java) unless
We first learn one useful option of gcc. Copy the following C source file to your
 Lecture 5 p.1 Faculty of Computer Science, Dalhousie University CSCI 2132 Software Development Lab 5: gcc and gdb tools 10-Oct-2018 Location: Teaching Labs Time: Thursday Instructor: Vlado Keselj Lab 5:
Integrated Software Environment. Part 2
 Integrated Software Environment Part 2 Operating Systems An operating system is the most important software that runs on a computer. It manages the computer's memory, processes, and all of its software
CS520 Setting Up the Programming Environment for Windows Suresh Kalathur. For Windows users, download the Java8 SDK as shown below.
 CS520 Setting Up the Programming Environment for Windows Suresh Kalathur 1. Java8 SDK Java8 SDK (Windows Users) For Windows users, download the Java8 SDK as shown below. The Java Development Kit (JDK)
Using a debugger. Segmentation fault? GDB to the rescue!
 Using a debugger Segmentation fault? GDB to the rescue! But first... Let's talk about the quiz Let's talk about the previous homework assignment Let's talk about the current homework assignment K findkey(v
2. Click on the "FREE JAVA DOWNLOAD" button. Note: It will check their PC first and tell them if they have the latest version of Java.
 SKILLPORT INSTRUCTIONS Skillport is a computer-based training website that you can access from any computer with internet access. Please note that the Skillport system requires Java (download available
Remodeling Your Office A New Look for the SAS Add-In for Microsoft Office
 Paper SAS1864-2018 Remodeling Your Office A New Look for the SAS Add-In for Microsoft Office ABSTRACT Tim Beese, SAS Institute Inc., Cary, NC Millions of people spend their weekdays in an office. Occasionally
SECTION 2: Loop Reasoning & HW3 Setup
 SECTION 2: Loop Reasoning & HW3 Setup cse331-staff@cs.washington.edu Review: Reasoning about loops What is a loop invariant? An assertion that always holds at the top of a loop Why do we need invariants?
A Tour of the Scripting System. Contents
 A Tour of the Scripting System Contents Features of the Scripting System Script Projects and Scripts Scripting Editor Scripting Panels Scripting Debugger Several Scripting Languages Application Programming
Lesson Seven: Holding Gestures
 Lesson Seven: Holding Gestures PAGE 01 Lesson Seven: Holding Gestures Overview In the previous lesson, we made our functions more useful by allowing them to output through the keyboard. By assigning different
Software Engineering
 Software Engineering Lecture 12: Testing and Debugging Debugging Peter Thiemann University of Freiburg, Germany 13.06.2013 Today s Topic Last Lecture Bug tracking Program control Design for Debugging Input
Using the Xcode Debugger
 g Using the Xcode Debugger J Objectives In this appendix you ll: Set breakpoints and run a program in the debugger. Use the Continue program execution command to continue execution. Use the Auto window
Excel Intermediate
 Excel 2013 - Intermediate (103-124) Multiple Worksheets Quick Links Manipulating Sheets Pages EX16 EX17 Copying Worksheets Page EX337 Grouping Worksheets Pages EX330 EX332 Multi-Sheet Cell References Page
1 Preface About this Manual Intended Audience Revision History Document Conventions Version...
 Table of Contents 1 Preface... 3 1.1 About this Manual... 3 1.2 Intended Audience... 3 1.3 Revision History... 3 1.4 Document Conventions... 3 1.5 Version... 4 2 Introduction... 5 2.1 Overview... 5 2.2
Keil uvision development story (Adapted from (Valvano, 2014a))
)") Introduction uvision has powerful tools for debugging and developing C and Assembly code. For debugging a code, one can either simulate it on the IDE s simulator or execute the code directly on ta Keil
Introduction uvision has powerful tools for debugging and developing C and Assembly code. For debugging a code, one can either simulate it on the IDE s simulator or execute the code directly on ta Keil
Changing the Embedded World TM. Module 3: Getting Started Debugging
 Changing the Embedded World TM Module 3: Getting Started Debugging Module Objectives: Section 1: Introduce Debugging Techniques Section 2: PSoC In-Circuit Emulator (ICE) Section 3: Hands on Debugging a
Software Setup and Introductory Assembly programs for the MSP430 *
 OpenStax-CNX module: m15976 1 Software Setup and Introductory Assembly programs for the MSP430 * Texas Instruments This work is produced by OpenStax-CNX and licensed under the Creative Commons Attribution
At the shell prompt, enter idlde
 IDL Workbench Quick Reference The IDL Workbench is IDL s graphical user interface and integrated development environment. The IDL Workbench is based on the Eclipse framework; if you are already familiar
NetBeans IDE Field Guide
 NetBeans IDE Field Guide Copyright 2004 Sun Microsystems, Inc. All rights reserved. Debugging Java Applications Table of Contents Starting a Debugging Session...2 Debugger Windows...3 Attaching the Debugger
MIDI Player Pro v1.3.0 basic users guide By Hans Petter Selasky, November 2015
 MIDI Player Pro v1.3.0 basic users guide By Hans Petter Selasky, November 2015 1. Device configuration Before you can start using MIDI Player Pro you need to select the «Config» tab and press the «DEV»
NEW CEIBO DEBUGGER. Menus and Commands
 NEW CEIBO DEBUGGER Menus and Commands Ceibo Debugger Menus and Commands D.1. Introduction CEIBO DEBUGGER is the latest software available from Ceibo and can be used with most of Ceibo emulators. You will
Tutorial 1 Exploring ArcGIS
 Tutorial 1 Exploring ArcGIS Before beginning this tutorial, you should make sure your GIS network folder is mapped on the computer you are using. Please refer to the How to map your GIS server folder as
SDKs - Eclipse. SENG 403, Tutorial 2
 SDKs - SENG 403, Tutorial 2 AGENDA - SDK Basics - - How to create Project - How to create a Class - Run Program - Debug Program SDK Basics Software Development Kit is a set of software development tools
hw6, BFS, debugging CSE 331 Section 5 10/25/12 Slides by Kellen Donohue
 hw6, BFS, debugging CSE 331 Section 5 10/25/12 Slides by Kellen Donohue Agenda hw4 being graded hw5 may be graded first, for feedback to be used on hw6 hw6 due next week Today hw6 BFS Debugging hashcode()
1LIVE CHESS BOOK User Manual
 1LIVE CHESS BOOK User Manual Q.1] System Requirements - The software works on windows 7, windows 8, and windows 10 platform. - Please ensure that your speaker of PC/ Laptop is in proper working condition,
Ms. Payne, WCSS. This is very much like asking a question, and having a yes/no answer (also known a true/false). The general structure for this is:
. The general structure for this is:") The Decision Structure The repetition (looping) structure discussed previously is a very important structure because it allows the programmer to instruct the computer to do something more than once. The
The Decision Structure The repetition (looping) structure discussed previously is a very important structure because it allows the programmer to instruct the computer to do something more than once. The
1. Allowed you to see the value of one or more variables, or 2. Indicated where you were in the execution of a program
 CS0449 GDB Lab What is a debugger? A debugger is a program that helps you find logical mistakes in your programs by running them in a controlled way. Undoubtedly by this point in your programming life,
Software Engineering Testing and Debugging Debugging
 Software Engineering Testing and Debugging Debugging Prof. Dr. Peter Thiemann Universität Freiburg 13.07.2009 Today s Topic Last Lecture Bug tracking Program control Design for Debugging Input simplification
Eclipse Tutorial. For Introduction to Java Programming By Y. Daniel Liang
 Eclipse Tutorial For Introduction to Java Programming By Y. Daniel Liang This supplement covers the following topics: Getting Started with Eclipse Choosing a Perspective Creating a Project Creating a Java
Today s Topic. Software Engineering Testing and Debugging Debugging. Today s Topic. The Main Steps in Systematic Debugging
 Today s Topic Software Engineering Testing and Debugging Debugging Prof. Dr. Peter Thiemann Last Lecture Bug tracking Program control Design for Debugging Input simplification Universität Freiburg 22.06.2011
Flow of Control: Loops. Chapter 4
 Flow of Control: Loops Chapter 4 Java Loop Statements: Outline The while statement The do-while statement The for Statement Java Loop Statements A portion of a program that repeats a statement or a group
Teach Yourself Microsoft Word Topic 12 - Multipage Document Features Part 1
 http://www.gerrykruyer.com Teach Yourself Microsoft Word Topic 12 - Multipage Document Features Part 1 In this class and the next few you will find out how to use MS Word features that make it easier to
6L00IA - Introduction to Synergy Software Package Short Version (SSP v1.2.0) Renesas Synergy Family - S7 Series
 Renesas Synergy Family - S7 Series") 6L00IA - Introduction to Synergy Software Package Short Version (SSP v1.2.0) Renesas Synergy Family - S7 Series LAB PROCEDURE Description: The purpose of this lab is to familiarize the user with the Synergy
6L00IA - Introduction to Synergy Software Package Short Version (SSP v1.2.0) Renesas Synergy Family - S7 Series LAB PROCEDURE Description: The purpose of this lab is to familiarize the user with the Synergy