Himax Technologies (HIMX) Devin D Angelo
|
|
|
- Herbert Lambert
- 5 years ago
- Views:
Transcription


1 Himax Technologies (HIMX) Devin D Angelo
2 Agenda Executive Summary Industry Thesis Company Thesis Valuation & Recommendation 2


3 Business Overview Revenue By Segment % 54% 30% Large Panel Drivers Small and Medium Panel Drivers Total Non-Drivers Himax is a fabless semiconductor design house located in Taiwan. 84% of Revenue from Display Driver IC in LCD Panels. For 5 years, the company has seen rapid declines in Large Panel Driver IC and rapid growth in Small/Medium Panel Driver IC. Non Driver products expected to achieve profitability in Large Panel Small/Medium Panel Non Driver TVs PC Monitors Notebook PCs Smartphones Tablets Consumer Electronics 3


4 Investment Thesis Industry Thesis Large panel displays will bounce back led by 4k TV shipments from China. Low cost smartphone producers will drive higher unit shipments. Suppliers will benefit from high demand for display solutions. Company Thesis Recommendation Himax is the market leader in China where the majority of growth in the display market is occurring. Headwinds from weakness at Samsung are overblown. Growth from Himax s other customers will more than fill the gap. The street is overly cautious on Himax s wearables opportunity after being overly optimistic in Current Price $7.62 Buy Fair Value $9.50 4
5 Industry Thesis LCD Displays 5
6 Shipments in Millions Global TV Shipments Demand for Display Drivers in TVs 4K TV Shipments are growing at an 88% compound quarterly growth grate. Shipments are on track to top 15 million for the year. Chinese manufacturers control approximately 75% of the 4K market E 2014E 2015E 2016E 2017E 2018E After 3 years of declines, TV shipments have sharply rebounded in 2014 and are expected to continue growing led by 4K TV Shipments from China. 6

7 4K TVs Prices of 4K TVs have fallen 85% from $8k to $1k in two years. Chinese manufactures offer the most affordable displays on the market under $1k on average. Adoption is currently outpacing expectations at 6% penetration in North America. As many as 4 out of every 10 TVs shipped will be 4K within 5 years. Content providers (such as Netflix) have plans to offer video in 4K. 7
8 Units (millions) % 45.0% 40.0% 35.0% 30.0% 25.0% 20.0% 15.0% 10.0% 5.0% 0.0% Smart Phone and Tabet Shipments Smartphones and Tablets E 2015E 2016E 2017E 2018E Mobile Phone Tablet Small/Medium Panel YOY Growth E 2015E 2016E 2017E 2018E Low cost competitors are gaining share and rapidly ramping production. Shipments are projected to grow at a 5.7% CAGR through The market is maturing and growth leveling off from as high as 50% YOY to closer to 7%. Particularly high growth is expected in India. Smartphone shipments are on track for 20% YOY growth this year led by Chinese manufacturers. 8


9 Wearable Micro-Displays Huge market potential with applications in Healthcare, Industry, Fitness, and Infotainment. Many companies developing products from Google and Medtronic to Adidas. High degree of uncertainty remains. 9
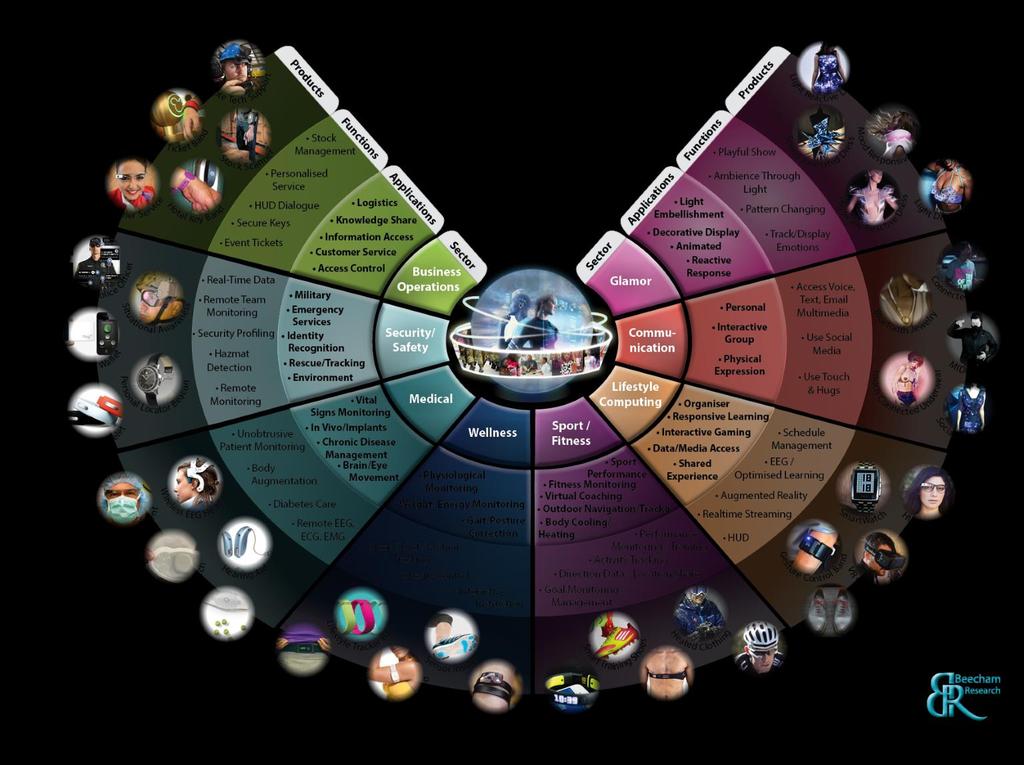
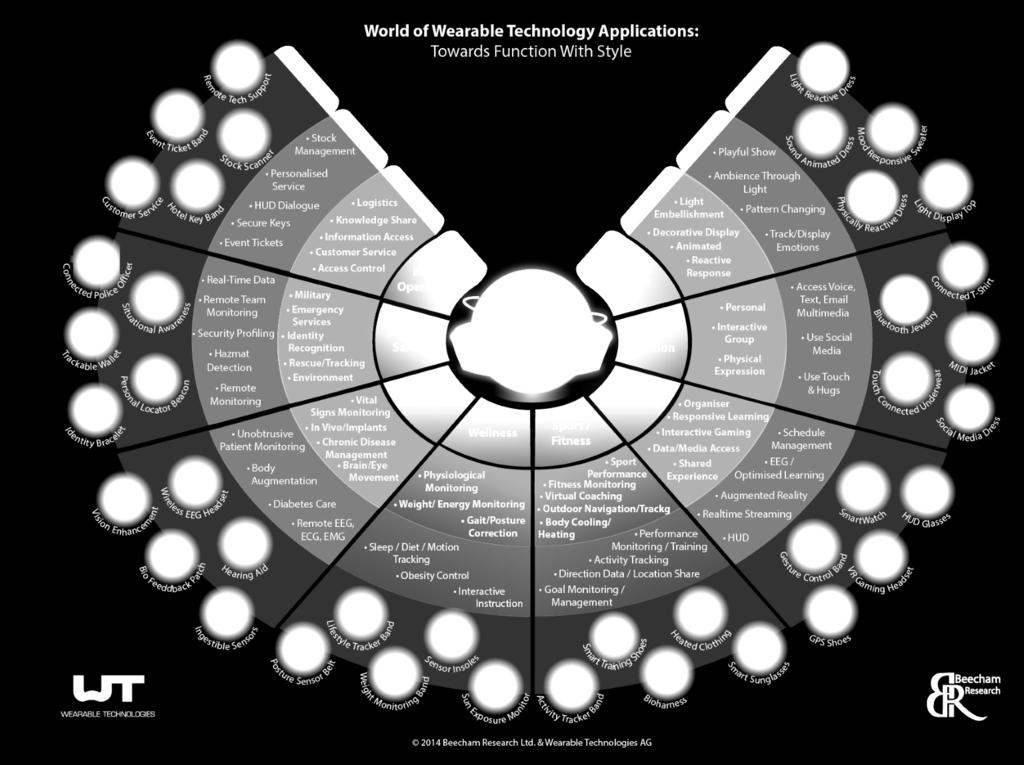
10 Applications of Wearables 10


11 WLO: Array Cameras Current smartphone camera technology has peaked. Array cameras will allow thinner smartphones and higher quality pictures. Himax is one of a few companies with high quality array cameras capable of smartphone integration Credit Suisse estimates that the array camera market could reach $1 billion by end of year
12 Company Thesis Himax Technologies (HIMX) 12

13 Complete Solution Display Drivers Touch Controllers Image Sensors Power IC Himax s diverse product line offers customers a complete solution for their smart phone or tablet production. 13


14 New Competition Touch Controllers Display Drivers The acquisition of Renesas by Synaptics presents a challenge to Himax s competitive advantage. 14
15 Samsung Headwind Himax Revenue by Region 11% 37% 52% China Taiwan Korea and Japan A decline in orders from a Major Korean Customer have been a negative for the stock lately. This customer represents around 10% of Revenue. It remains to be seen if Samsung can turn around its smartphone business. 15
16 Negative Market Sentiment Down 50% YTD 16


17 Taking Market Share Despite headwinds from Samsung and new competition, Himax continues to grow its market share in its core business due to its strong position in the Chinese market. 17


18 New Design Wins Himax Customer Q3 YOY Shipment Growth +211% +40% Credit Suisse research suggests that Himax has partnered with Xiaomi and LG for their 2015 smartphone launches. Himax can continue to grow sales even if Samsung continues to lose share. 18


19 Losing Google? Himax LCoS customers Speculation over losing Google as a customer has driven Himax stock down from $15 to under $6.00 at one point. The market is obsessed with Google s relationship and every rumor moves the stock price considerably. Himax has won over 20 LCoS customers and is no way reliant on Google Glass. Speculation over losing Google is not founded in fact. NDAs prevent Himax from disputing rumors. 19


20 Wearables Market Leader FLCoS OLED Brightness 20,000 nits 900 nits Color Full-Color Single Color Contrast 100:1 10,000:1 Power 50 nits/mw 50 nits/mw Burn-in No Yes Cost $15 $100 Scalability Yes Limited Himax s FLCoS technology is the clear winner among microdisplay technologies. Google s 2013 investment and countless design wins from the likes of Lenovo and Lumus are evidence of their superior technology Current production capacity 200,000 displays per month. Management has discussed ramping this to over 1 million per month 20


21 Million Units Street Overly Cautious Forecasted LCoS Unit Shipments Consensus 2013 Consensus 2014 My Estimates Analysts have pulled a complete 180 from overly optimistic to incredibly pessimistic on LCoS forecasts EPS estimates revised down % in only 9 months. These revisions are based on rumors and speculation which I contend are false. Nomura October 2013 LCoS Forecast Nomura August 2014 LCoS Forecast 21
. Significant insider ownership at 31.7% with majority held by founder Dr Biing-Seng Wu.")

22 Returning Value to Shareholders $485 million returned to shareholders since IPO in the form of dividends and buybacks (the IPO itself was only $465 million). Significant insider ownership at 31.7% with majority held by founder Dr Biing-Seng Wu. Dr Wu helped establish the first flat panel plant in Taiwan and holds over 60 patents. Dividend Yield 12.0% 10.4% 10.0% 8.0% 6.0% 4.0% 4.0% 7.0% 9.1% 5.9% 3.4% 4.4% 4.0% 5.4% 6.4% Dr. Biing-Seng Wu: Founder Chairmen of the board. 2.0% 0.0%
23 Valuation and Recommendation 23
24 Valuation Assumptions Bull Case LCoS ramp in Large Panel market share gains and margin expansion. Small Panel market share gains, steady ASPs, and steady margins. Other Products continue to grow at forecasted rates. Base Case LCoS ramp in Large Panel Driver sales and margins stabilize. Small Panel constant market share, pricing pressure, and margin pressure. Other products continue to grow at forecasted rates. Bear Case LCoS production never ramps beyond current production. Large panel market share loss and margin pressure. Small panel market share loss and very high pricing pressure.. Other products see slightly below forecast growth.
25 Large Panel Projections Large Panel IC Revenue Sales Growth Vs Industry Shipment Growth % 20% 15% % 5% % -5% -10% -15% -20% % -30% E 2015E 2016E 2017E 2018E Shipment Growth Sales Growth My base case models stabilization in large driver IC segment tracking growth in the overall industry. 25
26 Small Panel Projections 600 Small/Medium Panel IC Revenue 50% Sales Growth Vs Industry Shipment Growth % 40% % % 25% 20% 15% 10% 100 5% E 2015E 2016E 2017E 2018E 0% Shipment Growth Sales Growth My base case models rapidly slowing growth in the small driver IC segment. 26
27 USD ($mn) Non-Driver Projections 600 Non-Driver Revenue E 2015E 2016E 2017E 2018E LCoS CMOS and Others ASP Units (millions ) Revenue EPS % contribution 12% 20% 28% 43% 52% 27
28 Revenue and Earnings Mix Revenue by Segment 100% 90% 80% 70% 60% 50% 40% 30% 20% 10% 0% E 2015E 2016E 2017E 2018E LCoS has gross margins around 50%. Significant growth in LCoS will drive rapid margin expansion. Earnings impact will be significant beyond Large Panel Drivers Small and Medium Panel Drivers LCoS CMOS and Others LCoS Gross Margin Impact 1.20 LCoS Earnings Impact 30.0% 29.0% % 27.0% % % 24.0% % 22.0% % E 2015E 2016E 2017E 2018E E 2015E 2016E 2017E 2018E Excluding LCoS Including LCoS Including LCoS Excluding LCoS 28

29 Valuation Tree 2015 EPS Estimate 0.72 Forward P/E Target Price Upside 68.3% 49.6% 20% Fair Value % 8.2% 60% $ % % -21.6% 20% 29
30 Contributions to Valuation
31 Valuation Summary
32 Appendix 32
33 HIMAX TECHNOLOGIES, INC. USD in millions except per share data E 2015E 2016E 2017E 2018E Large Panel Drivers % Growth -24.3% -25.7% -26.2% 12.9% -25.0% 5.9% 10.4% 5.9% 3.4% 2.3% Small and Medium Panel Drivers % Growth 10.1% 46.1% 26.2% 16.6% 26.4% 12.1% 5.1% 5.0% 2.5% 0.9% Total Non-Drivers LCoS % Growth 0% 0% 0% 0% 0% 0% 292.2% 150.0% 100.0% 100.0% 50.0% CMOS and Others % Growth 9.8% 13.6% 53.0% 28.2% 22.3% 20.0% 15.0% 15.0% 15.0% 15.0% Revenue % Growth -16.9% -7.1% -1.6% 16.4% 4.6% 14.1% 11.6% 11.9% 13.9% 11.7% COGS Large Driver IC % Gross Margin 17.8% 18.3% 18.8% 19.0% 19.2% 19.4% 19.2% 19.2% Small Driver IC % Gross Margin 22.0% 25.5% 25.5% 25.2% 25.0% 24.8% 24.8% 24.8% Non Driver Gross Profit % Gross Margin 18.6% 30.0% 33.3% 30.0% 30.0% 30.0% 30.0% 30.0% LCoS Gross Profit % Gross Margin 45.0% 45.0% 45.0% 45.0% 45.0% 45.0% Cost of revenue % of Revenue 80.3% 76.8% 74.9% 75.2% 74.7% 73.8% 72.3% 71.1% Gross profit % Growth -30.4% -4.9% -7.4% 36.8% 13.0% 12.7% 14.1% 15.7% 20.3% 16.7% % Gross Margin 20.5% 21.0% 19.7% 23.2% 25.1% 24.8% 25.3% 26.2% 27.7% 28.9% Operating expenses Research and development % of Sales 10.6% 10.3% 11.8% 12.5% 9.6% 10.4% 9.0% 8.9% 8.8% 8.8% 8.8% Sales, General and administrative % of Sales 3.7% 3.9% 5.0% 4.9% 4.5% 4.8% 4.1% 3.9% 3.9% 3.5% 3.2% Total operating expenses Operating income % Growth -48.2% -38.6% -44.4% 346.7% 13.9% 34.6% 19.9% 20.1% 29.8% 23.4% % Operating Margin 10.2% 6.4% 4.2% 2.4% 9.1% 9.9% 11.7% 12.6% 13.5% 15.4% 17.0% Interest and Taxes Interest Expense Income before taxes Provision for income taxes Tax Rate -14.1% 18.2% 17.1% 41.2% 24.2% 25.3% 25% 25.0% 25.0% 25.0% 25.0% Net income % Growth -61.7% -41.7% -61.9% 537.5% 12.3% 34.4% 19.9% 20.1% 29.8% 23.4% % Net Margin 11.3% 5.2% 3.3% 1.3% 6.9% 7.4% 8.8% 9.4% 10.1% 11.5% 12.7%
34 HIMAX TECHNOLOGIES, INC. USD in millions except per share data E 2015E 2016E 2017E 2018E Large Panel Drivers % Growth -24.3% -25.7% -26.2% 12.9% -25.0% 10.2% 12.5% 8.0% 3.4% 2.3% Small and Medium Panel Drivers % Growth 10.1% 46.1% 26.2% 16.6% 26.4% 19.3% 11.8% 11.7% 6.8% 5.1% Total Non-Drivers LCoS % Growth 0% 0% 0% 0% 0% 0% 292.2% 400.0% 100.0% 50.0% 33.3% CMOS and Others % Growth 9.8% 13.6% 53.0% 28.2% 22.3% 20.0% 15.0% 15.0% 15.0% 15.0% Revenue % Growth -16.9% -7.1% -1.6% 16.4% 4.6% 19.2% 21.0% 19.2% 13.8% 11.6% COGS Large Driver IC % Gross Margin 17.8% 18.3% 18.8% 19.2% 19.5% 19.6% 19.6% 19.6% Small Driver IC % Gross Margin 22.0% 25.5% 25.5% 25.7% 25.9% 26.1% 26.3% 26.5% Non Driver Gross Profit % Gross Margin 18.6% 30.0% 33.3% 30.0% 30.0% 30.0% 30.0% 30.0% LCoS Gross Profit % Gross Margin 45.0% 45.0% 50.0% 50.0% 50.0% 50.0% Cost of revenue % of Revenue 80.3% 76.8% 74.9% 75.0% 72.9% 71.2% 69.8% 68.7% Gross profit % Growth -30.4% -4.9% -7.4% 36.8% 13.0% 19.1% 30.8% 26.7% 19.2% 15.8% % Gross Margin 20.5% 21.0% 19.7% 23.2% 25.1% 25.0% 27.1% 28.8% 30.2% 31.3% Operating expenses Research and development % of Sales 10.6% 10.3% 11.8% 12.5% 9.6% 10.4% 9.0% 8.9% 8.8% 8.8% 8.8% Sales, General and administrative % of Sales 3.7% 3.9% 5.0% 4.9% 4.5% 4.8% 3.9% 3.4% 3.2% 2.9% 2.6% Total operating expenses Operating income % Growth -48.2% -38.6% -44.4% 346.7% 13.9% 46.1% 47.2% 35.3% 25.3% 20.3% % Operating Margin 10.2% 6.4% 4.2% 2.4% 9.1% 9.9% 12.1% 14.8% 16.7% 18.5% 19.9% Interest and Taxes Interest Expense Income before taxes Provision for income taxes Tax Rate -14.1% 18.2% 17.1% 41.2% 24.2% 25.3% 25% 25.0% 25.0% 25.0% 25.0% Net income % Growth -61.7% -41.7% -61.9% 537.5% 12.3% 46.0% 47.2% 35.3% 25.3% 20.3% % Net Margin 11.3% 5.2% 3.3% 1.3% 6.9% 7.4% 9.1% 11.1% 12.6% 13.8% 14.9%
35 HIMAX TECHNOLOGIES, INC. USD in millions except per share data E 2015E 2016E 2017E 2018E Large Panel Drivers % Growth -24.3% -25.7% -26.2% 12.9% -25.0% -0.5% 5.9% 4.8% 2.3% 2.3% Small and Medium Panel Drivers % Growth 10.1% 46.1% 26.2% 16.6% 26.4% 6.2% 0.9% 0.8% -1.1% -2.3% Total Non-Drivers LCoS % Growth 0% 0% 0% 0% 0% 0% 292.2% 0.0% 100.0% 50.0% 66.7% CMOS and Others % Growth 9.8% 13.6% 53.0% 28.2% 22.3% 20.0% 15.0% 15.0% 15.0% 15.0% Revenue % Growth -16.9% -7.1% -1.6% 16.4% 4.6% 9.0% 4.8% 7.0% 5.4% 7.1% COGS Large Driver IC % Gross Margin 17.8% 18.3% 18.8% 19.0% 19.0% 19.0% 19.0% 19.0% Small Driver IC % Gross Margin 22.0% 25.5% 25.5% 25.2% 25.0% 24.8% 24.8% 24.8% Non Driver Gross Profit % Gross Margin 18.6% 30.0% 33.3% 30.0% 30.0% 30.0% 30.0% 30.0% LCoS Gross Profit % Gross Margin 45.0% 45.0% 45.0% 45.0% 45.0% 45.0% Cost of revenue % of Revenue 80.3% 76.8% 74.9% 75.1% 75.2% 74.8% 74.3% 73.4% Gross profit % Growth -30.4% -4.9% -7.4% 36.8% 13.0% 8.1% 4.5% 8.7% 7.5% 10.6% % Gross Margin 20.5% 21.0% 19.7% 23.2% 25.1% 24.9% 24.8% 25.2% 25.7% 26.6% Operating expenses Research and development % of Sales 10.6% 10.3% 11.8% 12.5% 9.6% 10.4% 9.0% 8.9% 8.8% 8.8% 8.8% Sales, General and administrative % of Sales 3.7% 3.9% 5.0% 4.9% 4.5% 4.8% 4.3% 4.3% 4.6% 4.4% 4.1% Total operating expenses Operating income % Growth -48.2% -38.6% -44.4% 346.7% 13.9% 27.5% 4.9% 9.3% 11.1% 16.8% % Operating Margin 10.2% 6.4% 4.2% 2.4% 9.1% 9.9% 11.6% 11.6% 11.8% 12.5% 13.6% Interest and Taxes Interest Expense Income before taxes Provision for income taxes Tax Rate -14.1% 18.2% 17.1% 41.2% 24.2% 25.3% 25% 25.0% 25.0% 25.0% 25.0% Net income % Growth -61.7% -41.7% -61.9% 537.5% 12.3% 27.3% 4.9% 9.3% 11.1% 16.8% % Net Margin 11.3% 5.2% 3.3% 1.3% 6.9% 7.4% 8.7% 8.7% 8.9% 9.4% 10.2%
36 Operating income Tax Rate -14.1% 18.2% 17.1% 41.2% 24.2% 25.3% 25.0% 25.0% 25.0% 25.0% 25.0% NOPAT D&A CAPEX Accounts Recievable Inventories Accounts Payable NWC Change in NWC Days Recievable Days Inventory Days Payable Free Cash Flow % Growth -15.6% 10.8% -56.1% 78.9% 278.7% -31.7% 22.3% 29.8% 32.5%
Samsung Electronics Announces Fourth Quarter & FY 2015 Results
 Samsung Electronics Announces Fourth Quarter & FY 2015 Results SEOUL, Korea January 28, 2016 Samsung Electronics announced financial results for the fourth quarter ended December 31, 2015. Samsung posted
Q3 11 Earnings Release. October 27, 2011
 Q3 11 Earnings Release October 27, 2011 Results are preliminary and unaudited. Therefore, the figures in this material are subject to change during the independent auditing process. Please note that statements
18 August Hong Kong. SSIL 2015 Interim Results Announcement 18 Aug 2015 P. 1
 18 August 2015 18 Hong August Kong 2014 Hong Kong P. 1 Disclaimer This presentation does not constitute an offer or solicitation to anyone in any jurisdiction in which such offer or solicitation is not
Slide title 48 pt 21 july 2011 Slide subtitle 30 pt
 21 july 211 Helena norrman SENIOR VICE PRESIDENT COMMUNICATIONS THIS PRESENTATION CONTAINS FORWARD-LOOKING STATEMENTS. SUCH STATEMENTS ARE BASED ON OUR CURRENT EXPECTATIONS AND ARE SUBJECT TO CERTAIN RISKS
Forward Looking Statement
 Forward Looking Statement This presentation contains forward-looking statements which are statements that refer to expectations and plans for the future and include, without limitation, statements regarding
Forward-Looking and Cautionary Statements
 Peter F. Volanakis President and Chief Operating Officer February 8, 28 Forward-Looking and Cautionary Statements Certain statements in this presentation constitute forwardlooking statements within the
Spreadtrum Communications, Inc.
 Spreadtrum Communications, Inc. Technology for the Mobile World b 2012 Second Quarter Results China United States Korea India Taiwan www.spreadtrum.com 1 Safe Harbor Statement This presentation contains
PRESS RELEASE October 17, 2008
 PRESS RELEASE October 17, 2008 Sony Ericsson reports third quarter results Q3 highlights: Break even results, excluding restructuring charges, as challenging business conditions continued C902 Cyber-shot
As a note, this presentation was released as the dates shown and reflected management views as of these dates. All information in this presentation
 July 2003 1 As a note, this presentation was released as the dates shown and reflected management views as of these dates. All information in this presentation regarding the Company s financial results
2016 Fourth Quarter Earnings. March 2017
 2016 Fourth Quarter Earnings March 2017 Disclaimer The information is provided for informational purposes only, and is not an offer to buy or sell or a solicitation of an offer to buy or sell any security
Conference Call Second Quarter 2003 Financial Results. Jorma Ollila Chairman and CEO
 Conference Call Second Quarter 2003 Financial Results Jorma Ollila Chairman and CEO Olli-Pekka Kallasvuo Executive Vice President and CFO Ulla James Vice President, Investor Relations July 17, 2003 15.00
Fingerprint Cards Q Report
 Fingerprint Cards Q1 2016 Report April 28, 2016 WWW.FINGERPRINTS.COM 1 Strong Q1 2016 results Revenues Margins & profitability Highlights Revenues: MSEK 1,491 (MSEK 140), an increase of 966% y-o-y and
SSIL 2013 Annual Results Announcement 20 Mar 2014 P. 1
 P. 1 Disclaimer This presentation does not constitute an offer or solicitation to anyone in any jurisdiction in which such offer or solicitation is not authorized or to any person to whom it is unlawful
Capital Markets Day Rick Simonson Chief Financial Officer
 Capital Markets Day 2007 Rick Simonson Chief Financial Officer 1 2007 Nokia Capital Markets Day 2007 Revenue growth and strong margins 2 2007 Nokia Capital Markets Day 2007 EPS growth outpacing sales and
Silicon Motion Technology Corporation
 Silicon Motion Technology Corporation Silicon for Mobile Information Investor Presentation March 2006 Safe Harbor Statement This presentation does not constitute or form part of any offer for sale or subscription
Solomon Systech (International) Limited 2010 Annual Results Announcement. 24 March 2011 Hong Kong
 Limited 2010 Annual Results Announcement. 24 March 2011 Hong Kong") Solomon Systech (International) Limited 2010 Annual Results Announcement 24 March 2011 Hong Kong Table of contents Summary Financial Review Business Review Outlook P. 2 Summary P. 3 Results summary Unit
Solomon Systech (International) Limited 2010 Annual Results Announcement 24 March 2011 Hong Kong Table of contents Summary Financial Review Business Review Outlook P. 2 Summary P. 3 Results summary Unit
Fingerprint Cards Q Results
 Fingerprint Cards Q4 2014 Results February 26, 2015 Q4 Summary Key numbers from Q4 2014 results Revenue Margins & profitability Market development Revenue of SEK 105 million, an increase of 59% q o q and
Nokia Corporation January 24, 2013 at 13:00 (CET +1)
") INTERIM REPORT 1(57) Nokia Corporation Q4 and full year 2012 Interim Report FINANCIAL AND OPERATING HIGHLIGHTS Fourth quarter 2012 highlights: Nokia Group non-ifrs EPS in Q4 2012 was EUR 0.06; reported
INTERIM REPORT 1(57) Nokia Corporation Q4 and full year 2012 Interim Report FINANCIAL AND OPERATING HIGHLIGHTS Fourth quarter 2012 highlights: Nokia Group non-ifrs EPS in Q4 2012 was EUR 0.06; reported
TCL Communications (02618.HK/2618 HK)
") (218.HK/218 HK) May 9, 214 Institutional portal: http://research.kgi.com Electronics Hong Kong Outperform Resume coverage 1 Huei-chen Flannery 2 852.2878.427 3 hueichen.flannery@kgi.com 1 Richard Ko (Coordinator)
(218.HK/218 HK) May 9, 214 Institutional portal: http://research.kgi.com Electronics Hong Kong Outperform Resume coverage 1 Huei-chen Flannery 2 852.2878.427 3 hueichen.flannery@kgi.com 1 Richard Ko (Coordinator)
Wi-Fi Perfected. Second Quarter 2017 Earnings Presentation August 7, Proprietary Software. Cloud Analytics. Semiconductors
 Wi-Fi Perfected Semiconductors Proprietary Software Cloud Analytics Second Quarter 2017 Earnings Presentation August 7, 2017 Safe Harbor and Non-GAAP Financial Measures This presentation contains forward-looking
Lenovo Group Limited. 2007/08 Q1 Results. August 2, Lenovo
 Lenovo Group Limited 2007/08 Q1 Results August 2, 2007 2007 Lenovo Wong Wai Ming Senior Vice President & Chief Financial Officer 2007 Lenovo Lenovo Financial Summary Q1 2007/08 US$mn % Y/Y Q/Q Turnover
Samsung Electronics Announces First Quarter Results
 Samsung Electronics Announces First Quarter Results Registers net profit of KRW 7.68 trillion on sales of KRW 50.55 trillion 1Q consolidated operating profit reaches KRW 9.90 trillion SEOUL, Korea April
hird Q uarter R eport
 hird Quarter Report Safe Harbor Statement This presentation contains forward looking statements. Such statements are based on our current expectations and are subject to certain risks and uncertainties
Samsung Electronics Announces Fourth Quarter & FY 2017 Results
 Samsung Electronics Announces Fourth Quarter & FY 2017 Results Registers 4Q net profit of KRW 12.26 trillion on sales of KRW 65.98 trillion 4Q consolidated operating profit reaches KRW 15.15 trillion SEOUL,
Mobile World Congress Claudine Mangano Director, Global Communications Intel Corporation
 Mobile World Congress 2015 Claudine Mangano Director, Global Communications Intel Corporation Mobile World Congress 2015 Brian Krzanich Chief Executive Officer Intel Corporation 4.9B 2X CONNECTED CONNECTED
CORPORATE PRESENTATION 2014
 CORPORATE PRESENTATION 2014 ABOUT DIGITAL GAMING Digital gaming is everywhere Smartphones & Tablets Feature phones TVs & STBs Smartphones, tablets, smart TVs, STBs, smart watches Installed base of 2 billion
Kaufman Brothers 13 th Annual Investor Conference
 Kaufman Brothers 13 th Annual Investor Conference Craig DeYoung, VP Investor Relations New York, New York September 14, 21 / Slide 1 Safe Harbor "Safe Harbor" Statement under the US Private Securities
Sony Ericsson continues to invest for future growth
 PRESS RELEASE April 23, 2008 Sony Ericsson continues to invest for future growth Q1 Highlights: Year-on-year volume growth of 2% Income before taxes at higher end of forecast R&D investment continues to
CORPORATE PRESENTATION 2014
 CORPORATE PRESENTATION 2014 ABOUT DIGITAL GAMING Digital gaming is everywhere Smartphones & Tablets Feature phones TVs & STBs Smartphones, tablets, smart TVs, STBs, smart watches Installed base of 2 billion
Investor Relations Presentation
 A T H E R O S C O M M U N I C A T I O N S, I N C. Investor Relations Presentation Q1 2008 WIRELESS FUTURE. UNLEASHED NOW. ATHEROS COMMUNICATIONS Safe Harbor Statement Some of the information in this presentation
Nanya Technology. CREDIT SUISSE 18th Annual Asian Technology Conference
 Nanya Technology CREDIT SUISSE 18th Annual Asian Technology Conference Presentation to Investors & Analysts, September 6 th -7 th, 2017 Dr. Pei Ing Lee, President & Spokesman Mr. Joseph Wu, AVP & Deputy
Taiwan Mobile Co., Ltd.
 Taiwan Mobile Co., Ltd. 4Q12 Results Summary January 31, 2013 1 Disclaimer The information contained in this presentation, including all forwardlooking information, is subject to change without notice,
Consolidated Financial Results for the Second Quarter, Fiscal 2018
 Consolidated Financial Results for the Second Quarter, Fiscal 2018 Ⅰ. Consolidated Financial Results for the First Half, Fiscal 2018 Consolidated Financial Results for Fiscal 2018 Ⅱ. Supplementary Data
Cincinnati Bell Third Quarter 2011 Results. November 3, 2011
 Cincinnati Bell Third Quarter 2011 Results November 3, 2011 Today s Agenda Performance Highlights Jack Cassidy, President & Chief Executive Officer Review of Wireline, Wireless, IT Services & Hardware
econd Quarter Report
 econd Quarter Report econd Quarter Report HENRY STÉNSON Senior Vice President Communications Safe Harbor Statement This presentation contains forward looking statements. Such statements are based on our
INVESTOR PRESENTATION APRIL 2017
 INVESTOR PRESENTATION APRIL 217 Forward Looking Statements This presentation contains forward-looking statements that involve risks and uncertainties, as well as assumptions that, if proven incorrect,
Continued growth and positive market development. Interim report Jan-Sep 2016 Published November 15th, 2016
 Continued growth and positive market development Interim report Jan-Sep 216 Published November 15th, 216 INTEGRATED IN 24 MOBILE DEVICES 24 mobile devices was launched with Precise BioMatch Mobile in the
Cincinnati Bell Inc. March 4, 2013
 Cincinnati Bell Inc. March 4, 2013 Safe Harbor This presentation and the documents incorporated by reference herein contain forwardlooking statements regarding future events and our future results that
Lenovo Group Limited
 Lenovo Group Limited Credit Suisse Asia Investment Conference 2010 Hong Kong March 22 26, 2010 2010 Lenovo Financial Review 2010 Lenovo Lenovo FY20 Results Highlights Record high market share for three
second QUARTER 2014 July 18, 2014
 second QUARTER 2014 July 18, 2014 HElena norrman Senior Vice President Communications second QUARTER 2014 July 18, 2014 This presentation contains forward-looking statements. Such statements are based
CFA Institute Research Challenge hosted by CFA Society Taiwan National Chengchi University
 CFA Institute Research Challenge hosted by CFA Society Taiwan National Chengchi University Price Per Share This report is published for educational purposes only by students competing in The CFA Institute
Munters third quarter 2018 Sales and earnings growth
 Munters third quarter 2018 Sales and earnings growth Sales and earnings growth Order intake increased by 14% driven by growth in Data Centers and AgHort Net sales increased by 13% with strong growth in
Micronic Mydata Q4, Peter Uddfors, President and CEO Carl-Johan Blomberg, CFO 1 February, 2011
 Micronic Mydata Q4, 2010 Peter Uddfors, President and CEO Carl-Johan Blomberg, CFO 1 February, 2011 Agenda Brief company presentation Key figures Q4, 2010 Market information Outlook Page 2 Micronic Mydata
F-Secure Corporation - Interim report Q2 2011
 F-Secure Corporation - Interim report Q2 2011 (Unaudited) July 27, 2011 Kimmo Alkio, President & CEO Protecting the irreplaceable f-secure.com Q2 highlights Operator channel performed strongly showing
FINGERPRINT CARDS Q INTERIM REPORT OCTOBER 26, 2017
 FINGERPRINT CARDS Q3 2017 INTERIM REPORT OCTOBER 26, 2017 Q3 2017 Summary Revenues Revenues: SEK 841 (1,862) M, a 55% decrease year over year Margins & profitability Gross profit: SEK 277 (904) M Gross
Activity report 2017
 SFAF 9 MARS 2018 Activity report 2017 2 Growth plan: progress to date LEAPFROG 2020 400-500 m G1-Vusion Transition 2015-2020 CAGR +30% 177 153 Historical 2010-15 CAGR +20% Launch of G1 82 81 111 59 63
Company Overview May Silicon Motion Technology Corp. All rights reserved.
 Company Overview May 2017 2015 Silicon Motion Technology Corp. All rights reserved. Safe Harbor Statement This presentation contains "forward-looking statements" within the meaning of Section 27A of the
Samsung Electronics. 10 th KRX Global Investors Conference -1 -
 Samsung Electronics 10 th KRX Global Investors Conference June 2007-1 - Corporate Overview -2 - Business Portfolio TV N-PC DVD/STB Printer Memory System LSI Storage Home Theater Monitor Digital Media 27%
Invest Malaysia Sustainable value creation through internet growth
 Invest Malaysia Sustainable value creation through internet growth 9 June 2014 Malaysia offers opportunities for continued growth Malaysia [1] 30 million population 144% mobile penetration > 85% are prepaid
Samu Konttinen, CEO Q4 / 2017 CORPORATE SECURITY REVENUE GROWTH ACCELERATED TO 16%
 Samu Konttinen, CEO Q4 / 2017 CORPORATE SECURITY REVENUE GROWTH ACCELERATED TO 16% 1 AGENDA Key takeaways from Q4 Key figures Business review for 2017 Outlook 2018 Outlook for 2018-2021 Financials FAQ
TCL COMMUNICATION TECHNOLOGY HOLDINGS LIMITED (02618.HK) Q3 Results Presentation
 Q3 Results Presentation") 2013 TCL COMMUNICATION TECHNOLOGY HOLDINGS LIMITED (02618.HK) Q3 Results Presentation Hong Kong, 24 October 2013 6.45mm AGENDA BUSINESS REVIEW & OUTLOOK FINANCIAL HIGHLIGHTS Q & A 2 BUSINESS REVIEW & OUTLOOK
2013 TCL COMMUNICATION TECHNOLOGY HOLDINGS LIMITED (02618.HK) Q3 Results Presentation Hong Kong, 24 October 2013 6.45mm AGENDA BUSINESS REVIEW & OUTLOOK FINANCIAL HIGHLIGHTS Q & A 2 BUSINESS REVIEW & OUTLOOK
Samsung Electronics Announces Third Quarter 2017 Results
 Samsung Electronics Announces Third Quarter 2017 Results Registers net profit of KRW 11.19 trillion on sales of KRW 62.05 trillion 3Q consolidated operating profit reaches KRW 14.53 trillion SEOUL, Korea
Trends in the HDD Industry
 Trends in the HDD Industry Blount Ventures 650-380-2345 hbqwerty@yahoo.com www.blountventures.com 1 Agenda 2007 Industry Report Card Competitive Analysis 2008 Outlook and Future Consolidation Things to
MANAGEMENT DISCUSSION AND ANALYSIS THIRD QUARTER 2013 MD&A. Total active subscribers (in thousand) Q212 Q312 Q412 Q113 Q213 Q313
 Q212 Q312 Q412 Q113 Q213 Q313") MD&A Q313 Highlights On 23 July 2013, we successfully launched the new 3G 2.1GHz network, together with our existing 2G and 3G 850MHz networks, enabling us to serve our customers with better customer experience
MD&A Q313 Highlights On 23 July 2013, we successfully launched the new 3G 2.1GHz network, together with our existing 2G and 3G 850MHz networks, enabling us to serve our customers with better customer experience
Apacer Technology Inc Investor Conference
 Apacer Technology Inc. 2017 Investor Conference Stock Code:8271 August, 10th, 2017 Disclaimer The predictive information mentioned in the present briefing and as promulgated simultaneously is set up on
ARM Holdings plc Morgan Stanley 7 th Annual TMT Conference 14 November Warren East Chief Executive Officer
 ARM Holdings plc Morgan Stanley 7 th Annual TMT Conference 14 November 2007 Warren East Chief Executive Officer 1 Background Semiconductor Market ARM is a secular growth story with a 25+ year time horizon
Investor Relations 2Q17 August 11, 2017
 Investor Relations 2Q17 August 11, 2017 Disclaimer All financial information contained in this IR material is based on consolidated K-IFRS that have not been reviewed by an independent auditor. NexStreaming
Himax Technologies, Inc. Q Unaudited. Financials and Investor Update Call
 Himax Technologies, Inc. Q3 2017 Unaudited Financials and Investor Update Call Conference Details: Conference Topic: Himax Technologies, Inc. Third Quarter 2017 Earnings Conference Call Conference ID:
MD&A. Growing Subscribers with Slightly Decreasing ARPU CONTENTS
 MANAGEMENT DISCUSSION AND ANALYSIS F Y 2011 MD&A CONTENTS I EXECUTIVE SUMMARY 2011 was a significant year for dtac as we began our entire network upgrade and our 3G HSPA on 850 MHz launch which was our
IDEX company presentation. January 2009
 IDEX company presentation January 2009 About IDEX ASA IDEX ASA is a public company traded on the Oslo OTC list. IDEX is headquartered near Oslo, Norway with its US office in Foster City, California. IDEX
I N V E S T O R S P R E S E N T A T I O N
 I N V E S T O R S P R E S E N T A T I O N Rafi Amit, CEO Moshe Eisenberg, CFO November 2018 SAFE HARBOR The information presented today contains forward-looking statements that relate to anticipated future
Vonage Digital Phone Service 2010 Annual Report
 Vonage Digital Phone Service 2010 Annual Report 1 Our Mission Contents 2010 was a year of accomplishment. The dramatic improvement in our performance is a direct result of the focused efforts of our dedicated
Nokia Strategy and Financial Briefing. Timo Ihamuotila CFO February 11, 2011
 Nokia Strategy and Financial Briefing Timo Ihamuotila CFO February 11, 2011 Mobile Devices Industry and Nokia Assessment Expected Industry Trends: Revenue and Margins Approximate Revenue CAGR by Geographic
Consolidated Financial Highlights 18F First Quarter
 Consolidated Financial Highlights 18F First Quarter 6737 July 31st, 2018 Consolidated Income Statement 17Q1 18Q1 (JPY Million) Amount (%) Amount (%) (%) Net Sales 19,376 100.0 16,540 100.0 85.4 Cost of
3. Results by Business Segment
 3. Results by Business Segment Information on net sales (including intersegment sales) and operating income for the first half broken out by business segment is presented below. Technology Solutions Net
Seagate Technology Revenue: Driven by Product, Cloud Storage?
 Seagate Technology Revenue: Driven by Product, Cloud Storage? By Adam Rogers Apr 03, 2018. 02:24 PM Seagate Technology Stock since Fiscal 2Q18 Results Seagate stock has risen 4% since its fiscal 2Q18 results
This presentation and the documents incorporated by reference herein contain forward-looking statements regarding future events and our future
 This presentation and the documents incorporated by reference herein contain forward-looking statements regarding future events and our future results that are subject to the safe harbor provisions of
Consolidated Financial Results for the First Quarter Fiscal 2015
 Consolidated Financial Results for the First Quarter Fiscal 2015 Ⅰ. Financial Results for Fiscal 2015 Financial Results for Fiscal 2015 Ⅱ. Information by Product Group Ⅲ. Supplementary Data SHARP CORPORATION
As a note, this presentation was released as the dates shown and reflected management views as of
 February 2002 1 As a note, this presentation was released as the dates shown and reflected management views as of these dates. While reviewing this information, the data and information contain certain
Sony Ericsson starts 2007 with strong first quarter
 PRESS RELEASE April 20, 2007 Sony Ericsson starts 2007 with strong first quarter Q1 Highlights: Year-on-year volume & sales growth of 63% and 47% respectively Income before tax rose 139% year-on-year to
TCL COMMUNICATION TECHNOLOGY HOLDINGS LIMITED (2618.HK)
") TCL COMMUNICATION TECHNOLOGY HOLDINGS LIMITED (2618.HK) Interim Results Presentation Hong Kong 12 August 2 AGENDA FINANCIAL HIGHLIGHTS BUSINESS REVIEW & OUTLOOK Q & A FINANCIAL HIGHLIGHTS 4 FINANCIAL HIGHLIGHTS
TCL COMMUNICATION TECHNOLOGY HOLDINGS LIMITED (2618.HK) Interim Results Presentation Hong Kong 12 August 2 AGENDA FINANCIAL HIGHLIGHTS BUSINESS REVIEW & OUTLOOK Q & A FINANCIAL HIGHLIGHTS 4 FINANCIAL HIGHLIGHTS
Taiwan Semiconductor Manufacturing Company Ltd. Announces First Quarter Results for the Period Ended March 31, 2000
 Page 1 FOR IMMEDIATE RELEASE CONTACT IN TAIWAN CONTACT IN NEW YORK Derek Tien or Julie Chan Mami Ogawa Finance Division TSMC Thomson Financial Investor Relations invest@tsmc.com.tw mami.ogawa@thomsonir.com
Business Report for H1 FY ending March 31, 2019 (April-September 2018)
") Business Report for H1 FY ending March 31, 2019 (April-September 2018) Wacom Chapter 2 Wacom Co., Ltd. (TSE 1st Sec. Code: 6727) Contents Index 3 H1 FY 03/19 (April-September 2018) Results Overview 4-5
Business Report for H1 FY ending March 31, 2019 (April-September 2018) Wacom Chapter 2 Wacom Co., Ltd. (TSE 1st Sec. Code: 6727) Contents Index 3 H1 FY 03/19 (April-September 2018) Results Overview 4-5
GN Store Nord. DDF Company Forum 2006, May 30, CFO Jens Due Olsen
 GN Store Nord DDF Company Forum 2, May 3, 2 CFO Jens Due Olsen One company three businesses 2 Following up on The GN Agenda 2-28 Balance profit with organic growth in Hearing Instruments Revenue growth
Consolidated Financial Highlights 17F Third Quarter February 2018
 Consolidated Financial Highlights 17F Third Quarter 6737 February 2018 Consolidated Income Statement (JPY Million) 16Q1-3 17Q1-3 YoY Amount (%) Amount (%) (%) Net Sales 57,837 100.0 61,479 100.0 106.3
Jefferies 2013 Global Technology, Media and Telecom Conference
 Jefferies 2013 Global Technology, Media and Telecom Conference May 9, 2013 Important Notice Please read this management presentation together with the Company s press release issued earlier announcing
TCL Communication Ltd Leveraging Potential in EMs; Initiate at Overweight
 TCL Communication Ltd Leveraging Potential in EMs; Initiate at Overweight Morgan Stanley Asia Limited+ Yunchen Tsai Jasmine Lu TCLC mainly engages in handset manufacturing under two brands TCL and Alcatel.
Nanya Technology. WATERLAND Investment Forum Presentation to Investors & Analysts, August 29 th, 2017 Joseph Wu, AVP & Deputy Spokesman
 Nanya Technology WATERLAND Investment Forum 2017 Presentation to Investors & Analysts, August 29 th, 2017 Joseph Wu, AVP & Deputy Spokesman Safe Harbor The information herein and the presentation made
PRESS RELEASE January 16, 2009 Sony Ericsson reports results for fourth quarter and full year 2008
 PRESS RELEASE January 16, 2009 Sony Ericsson reports results for fourth quarter and full year 2008 Highlights: Global economic slowdown leads to contracting consumer demand Previously announced annual
Lenovo Group Limited
 Lenovo Group Limited 20 Results February 3, 2010 San Francisco/ February 4, 2010 Hong Kong 2010 Lenovo Wong Wai Ming Chief Financial Officer 2010 Lenovo Lenovo FY20 Results Highlights Record high market
Ericsson Second quarter 2018
 Ericsson Second quarter 2018 July 18, 2018 Telefonaktiebolaget LM Ericsson 2018 Second quarter report 2018 July 18, 2018 Page 1 Peter Nyquist Vice President Investor Relations Telefonaktiebolaget LM Ericsson
Ericsson First quarter 2018
 Ericsson First quarter 2018 April 20, 2018 Ericsson Internal 2018-02-21 Peter Nyquist Vice President Investor Relations Ericsson Internal 2018-02-21 First quarter 2018 April 20, 2018 This presentation
18 August 2009 Hong Kong. SSIL 2009 Interim Results Announcement
 18 August 2009 Hong Kong P. 1 Table of contents Summary Financial Review Business Review Outlook P. 2 Summary P. 3 Results summary Unit shipment 41mu Sales US$26.7 million Net loss US$2.3 million Basic
Earnings Release Conference Second Quarter of FY2017
 Earnings Release Conference Second Quarter of FY2017 (July 1, 2017 to September 30, 2017) October 31,2017 Murata Manufacturing Co., Ltd. http://www.murata.com/ir/library/index.html 1. Second Quarter of
MD&A. Operational Summary MANAGEMENT DISCUSSION AND ANALYSIS FIRST QUARTER 2016
 MD&A Executive Summary The competition level in Q116 heightened after the auctions in Q415 with expiration of 900 MHz concession and changes in spectrum holdings among operators. Handset subsidies on prepaid
VTech Holdings Limited
 VTech Holdings Limited FY2017 Annual Results Announcement 16 May 2017 Financial Review 2 (US$ M) Financial Highlights 2017 For the year ended 31 March 2016 Changes Revenue 2,079.3 1,856.5 12.0% Gross Profit
Global 3D NAND Flash Memory Market Research Report 2021
 Published on Market Research Reports Inc. (https://www.marketresearchreports.com) Home > Global 3D NAND Flash Memory Market Research Report 2021 Global 3D NAND Flash Memory Market Research Report 2021
AXT Presentation. Morris S. Young Chief Executive Officer. Raymond Low Chief Financial Officer
 AXT Presentation Morris S. Young Chief Executive Officer Raymond Low Chief Financial Officer May 2013 Safe Harbor Statement This presentation contains forward-looking information about the Company s business
1Q17 RESULTS M AY / 2017
 RESULTS M AY / 2017 Positivo Tecnologia recorded a net revenue of R$453.5 million in, an increase of 20.7% Continuous progress in the diversification of the business, with mobile phones reaching 32.6%
Nokia Conference Call Second Quarter 2005 Financial Results
 Nokia Conference Call Second Quarter 2005 Financial Results Jorma Ollila Chairman and CEO Rick Simonson Executive Vice President and CFO Ulla James Vice President, Investor Relations July 21, 2005 14.30
Nokia Conference Call First Quarter 2010 Financial Results
 Nokia Conference Call First Quarter 2010 Financial Results April 22, 2010 15.00 Helsinki time 8.00 New York time Olli-Pekka Kallasvuo CEO Timo Ihamuotila CFO Kristian Pullola Head of Treasury and Investor
hird Q uarter R eport
 hird Quarter Report Safe Harbor Statement This presentation contains forward looking statements. Such statements are based on our current expectations and are subject to certain risks and uncertainties
Credit Suisse European Technology Conference
 Credit Suisse European Technology Conference Franki D Hoore Director European Investor Relations May 12, 2010 / Slide 1 Safe Harbor "Safe Harbor" Statement under the US Private Securities Litigation Reform
Corporate Presentation Annual Results V Mar 2012 (IPPC)
") Corporate Presentation Annual Results 2011 V.01 22 Mar 2012 (IPPC) Disclaimer This presentation has been prepared by Comba Telecom Systems Holdings Limited (the Company ) for reference only. The information
Corporate Presentation Annual Results 2011 V.01 22 Mar 2012 (IPPC) Disclaimer This presentation has been prepared by Comba Telecom Systems Holdings Limited (the Company ) for reference only. The information
DRAM Forecast Outlook, 3Q03: Price Rises Force Forecast Up
 Forecast Analysis DRAM Forecast Outlook, 3Q03: Price Rises Force Forecast Up Abstract: Reduced supply of dynamic random-access memory has caused prices to rise sooner than expected. Now that the industry
MANAGEMENT DISCUSSION AND ANALYSIS FY 2012 MD&A
 MD&A Executive Summary Solid Results with Strong Net Additional Subscribers dtac 2012 results were strong both financially and operationally. Our total revenues grew healthily to THB 89.5 billion, increasing
Consolidated Financial Highlights 18F First Half
 Consolidated Financial Highlights 18F First Half 6737 October 31st, 2018 Consolidated Income Statement (JPY Million) 17F1 18F1 17F1 vs. 18F1 Amount (%) Amount (%) (%) Net Sales 38,330 100.0 34,711 100.0
2016 JABIL ANALYST & INVESTOR MEETING SEPTEMBER 27, 2016
 2016 JABIL ANALYST & INVESTOR MEETING 1 SEPTEMBER 27, 2016 Forward Looking Statements Forward looking statements: This presentation contains forward-looking statements, including those regarding our anticipated
fourth QUARTER 2017 Jan 31, 2018
 fourth QUARTER 2017 Jan 31, 2018 Peter Nyquist Vice President Investor Relations fourth QUARTER 2017 Jan 31, 2018 This presentation contains forward-looking statements. Such statements are based on our
October 16, Q Investor Presentation Svenn-Tore Larsen, CEO Pål Elstad, CFO
 October 16, 2015 Svenn-Tore Larsen, CEO Pål Elstad, CFO Summary Q3 2015: 2 Record MUSD 53.9 revenue in quarter despite the previously announced guidance Strong Bluetooth Smart Sales at MUSD 34.2 Improvements