eccharts and Metview 4 2 new visualisation systems at ECMWF
|
|
|
- Amanda Summers
- 5 years ago
- Views:
Transcription


1 eccharts and Metview 4 2 new visualisation systems at ECMWF Sylvie Lamy-Thépaut Meteorological Visualisation Section ECMWF Slide 1


2 eccharts and Metview 4 eccharts Web application - Response Time, Monitoring Dedicated to forecasters - Simplicity of the User Interface, High availability WMS server Desktop application - Qt toolkit Dedicated to researchers - Macro language, examiner tools WMS client Metview 4 Slide 2
3 eccharts and Metview 4 : What do they share? Metview 4 and eccharts are both services oriented. - Data access, compute service and visualisation They use the same graphical kernel : Magics++ - The plots have the same look and feel - They share the concepts of visual definitions or styles They both implement a powerful cache system. - A complex visualisation is always the result of some basic data access/computation/visualisation. Every stage is cached. - Metview 4 uses his own one - eccharts uses Memcached Slide 3
4 eccharts and Metview 4 : What is different? The End-User - A forecaster for eccharts - A Researcher for Metview 4 The Dataset - Metview 4 can potentially display any data in any style - eccharts can only display ECMWF latest forecast in predefined styles The technology - Metview 4 uses a classic workstation environment - eccharts is a Web Application The level of operation Slide 4 - eccharts is highly available 24/7


5 eccharts requirements: Simple User Interface Few tools to examine the data Few options to customise user environment High availability Monitoring Response time Slide 5
 Availability Zoom/pan/print Tools: Time series, Epsgrams, Probe Slide 6")
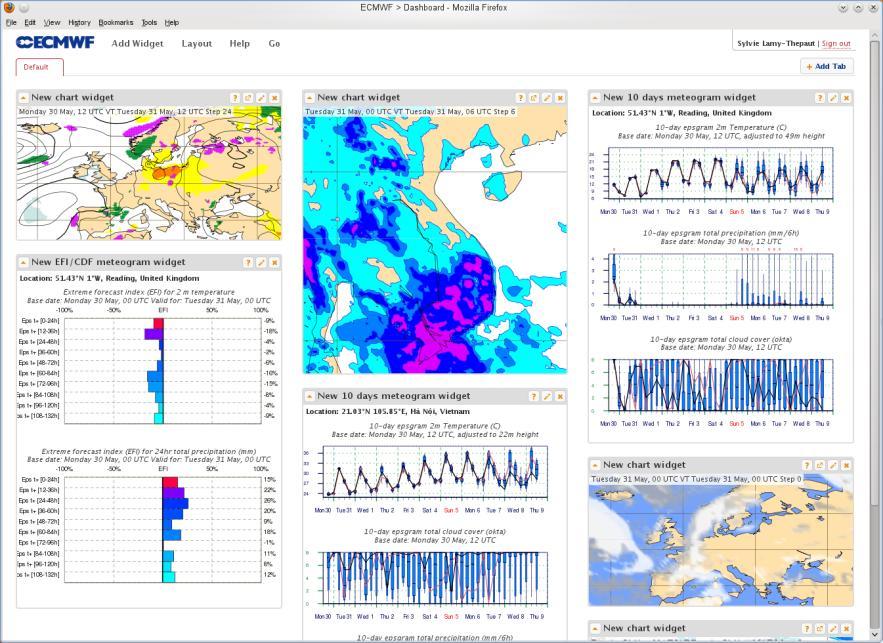
6 eccharts - User Interface The end-user of eccharts is a forecaster He needs a fast and easy to use user-interface to access ECMWF forecast. He needs few tools to navigate through the products (animation, time-series) Availability Zoom/pan/print Tools: Time series, Epsgrams, Probe Slide 6 Animation control

7 eccharts - User Interface eccharts offers a set of predefined products but also a way to create and save some tailored ones A product is a set of layers. A layer is the visual representation of a meteorological parameter. A layer offers a set of styles. A layer can offer basic computation on the parameter. Slide 7


8 eccharts - User Interface A user can create and save his own product A user can export products to his dashboard. Slide 8

9 eccharts - Architecture The products/layers/styles definitions are stored in a mongodb database Everything is replicated Systems are located in different parts of the building, attached to different network routers and different power sources eccharts is highly available Slide 9
10 eccharts - Monitoring The End-User is behind a browser somewhere! To understand what is going on, a powerful monitoring system had to be developed Log every eccharts user request: - Record every request to our web service. - Record data collected within users web browsers: We can query the monitoring database for any request. We can re-run requests to check the results. - Process request data into statistics in RRDs (Round Robin Databases). Continuously in near real-time (10 minutes). Slide 10 Web application to visualise the statistical data.


11 eccharts s Monitoring We can get insight into end-user experience! Web Interface to browse the database for requests - Examine user s result - Resubmit Search Database Get Record details Task Details Task Resubmit User s Result = Resubmit Result Slide 11

12 eccharts s Monitoring Slide 12
13 eccharts - usability and response-time From Miller 1968; Card et al. 1991: second is about the limit for having the user feel that the system is reacting instantaneously - 1 second is about the limit for the user's flow of thought to stay uninterrupted - 10 seconds is about the limit for keeping the user's attention focused on the dialogue - >10s and users will want to perform other tasks while waiting for the computer to finish eccharts get_chart are nominally in the range 1s to 10s. Slide 13 eccharts animation is nominally in the range 10s 60s.
14 eccharts - usability and response-time Response time is a challenge! - eccharts is using high resolution data - eccharts is plotting tailored products that have to be produced from data on-demand - eccharts data changes progressively with every forecast cycle - eccharts caches every data retrieval, every calculation result, every plot and every image rendered Slide 14


15 Metview 4 requirements Flexible visualisation Nice outputs for external publications Full control of the visualisation Powerful computation facilities Tools to examine the data contents Overlay data from different sources ( Slide 15 external databases or local files)


16 Metview 4 - User Interface Full control of the visualisation Print/export Zoom stack Layer management Animation Slide 16

17 Metview 4 - Macro language Powerful high-level meteorologically oriented script language All Metview tasks can be written or saved as macro The Macro editor has been rewritten to ease the creation and debug of macros. Slide 17
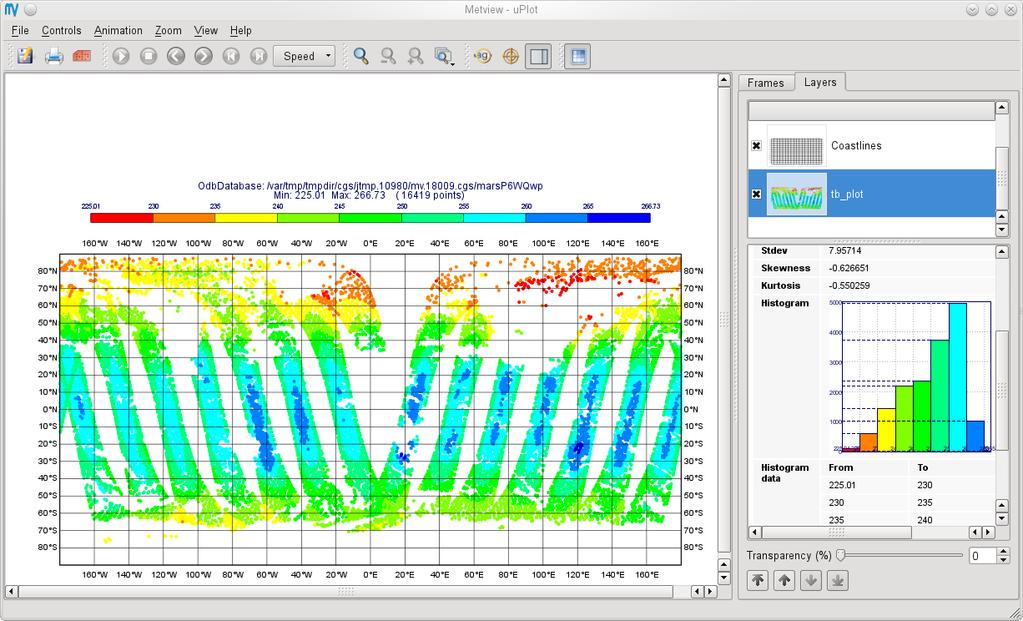
18 Metview 4 Data Examiners Essential tools to inspect data, e.g. to check: contents, structure headers errors or inconsistencies Also useful to compare files produced in different centres Various data types have a built-in examiner in Metview (e.g. GRIB, BUFR, ODB, NetCDF) Slide 18


19 Metview 4 Data Examiners Grib ODB Bufr Slide 19


20 Metview 4 WMS Client Metview has always been able to overlay data coming from different sources Slide 20


21 Metview 4 : WMS Client The getcapabilities function allows the creation of the icon editor. The getmap function allows the retrieval of the map for overlay in a Metview visualisation window. Slide 21


22 Metview 4 WMS client of eccharts WMS server! Slide 22
23 Metview 4 - eccharts : Chicken or egg? eccharts developers need Metview to design new products and new visualisation styles - Export Icons to the eccharts setup. Metview users want to access ECMWF forecasts with the same simplicity as eccharts - Easier access to current forecast - Import Styles to Metview - More Interaction on visualisation in Metview such as paning But, They are definitely cooperative tools! Slide 23


24 Metview 4 eccharts - Conclusion We are very happy with the developments - We took advantage of our new softwares GRIB API and Magics++ We have very good user feedback - We have a lot of new exciting features to implement We have good foundation for the next years! - We have a good Synergie between all Magics based systems. Slide 24
Metview 4 ECMWF s latest generation meteorological workstation
 Metview 4 ECMWF s latest generation meteorological workstation Iain Russell, Stephan Siemen, Fernando Ii, Sándor Kertész, Sylvie Lamy-Thépaut, Vesa Karhila Version 4 builds on the flexible and proven modular
Metview 4 ECMWF s latest generation meteorological workstation
 from Newsletter Number 126 Winter 2010/11 COMPUTING Metview 4 ECMWF s latest generation meteorological workstation doi:10.21957/v4xszl60 This article appeared in the Computing section of ECMWF Newsletter
eccharts Cihan Sahin Slide 1 Meteorological Operational Systems November
 eccharts Cihan Sahin on behalf of the eccharts development team Peter Bispham, Andy Brady, Jose Casado, Ricardo Correa, Tim Orford, Baudouin Raoult, David Richardson, Cihan Sahin, Stephan Slide Siemen,
Metview 4 ECMWF s next generation meteorological workstation
 Metview 4 ECMWF s next generation meteorological workstation Iain Russell Graphics Section ECMWF Slide 1 21 st EGOWS, Reading, 1 4 June 2010 1 What is Metview? (1) Working environment for Operational and
Introduction to Metview
 Introduction to Metview Fernando Ii, Iain Russell, Sándor Slide Kertész 1 Development Section - ECMWF 1 What is Metview? Retrieve/manipulate/visualise meteorological data Working environment for operational
Metview Introduction
 Metview Introduction Fernando Ii Slide 1 Meteorological Visualisation Section ECMWF Metview - Introduction June 2013 1 Outline Introduction Interactive usage demo Slide 2 Metview - Introduction June 2013
Meeting the challenges of the next generation of user interfaces
 Meeting the challenges of the next generation of user interfaces Iain Russell, Sylvie Lamy-Thépaut Graphics Section ECMWF Slide 1 Slide 1 Overview Metview èa meteorological workstation The next generation
Integrating OGC web services into Metview and Magics++
 Integrating OGC web services into Metview and Magics++ Developing ECMWF s tools for OGC web services Sylvie Lamy-Thépaut, Stephan Siemen, Fernando Ii, Slide 1 Sándor Kertész,Vesa Karhila, Iain Russel Graphics
The challenges of the ECMWF graphics packages
 The challenges of the ECMWF graphics packages Sylvie Lamy-Thépaut Graphics Section ECMWF Slide 1 1 Outline Who are we? - ECMWF - The Graphics Section What are our Missions? - Magics - Metview - Wrep :
ECMWF New Users Metview Tutorial
 ECMWF New Users Metview Tutorial Author: Date: URL: Iain Russell 06-Mar-2014 08:43 https://software.ecmwf.int/wiki/display/metv/ecmwf+new+users+metview+tutorial 1 of 12 Table of Contents 1 Preparation
ECMWF Web re-engineering project
 ECMWF Web re-engineering project Baudouin Raoult Peter Bispham, Andy Brady, Ricardo Correa, Sylvie Lamy-Thepaut, Tim Orford, David Richardson, Cihan Sahin, Stephan Siemen, Slide 1 Carlos Valiente, Daniel
Metview s new Python interface
 Metview s new Python interface Workshop on developing Python frameworks for earth system sciences. ECMWF, 2018 Iain Russell Development Section, ECMWF Thanks to Sándor Kertész Fernando Ii Stephan Siemen
Web Services at ECMWF
 Web Services at ECMWF Delivering data and graphical products to our Users Sylvie Lamy-Thépaut, Cristian Codorean, Cihan Sahin, Carlos Valiente, Tim Orford ECMWF March 4, 2017 Web services at ECMWF Which
You will create some icons yourself, but some are supplied for you. If you are at ECMWF then you can copy the icons from the command line like this:
 Metview WMS Tutorial This tutorial explains how to use the WMS (Web Map Service) client within Metview. Requirements Please note that this tutorial requires Metview version 4.0.5 or later. Preparations
Metview s new Python interface first results and roadmap for further developments
 Metview s new Python interface first results and roadmap for further developments EGOWS 2018, ECMWF Iain Russell Development Section, ECMWF Thanks to Sándor Kertész Fernando Ii Stephan Siemen ECMWF October
Metview 5.0 and Beyond, to its Pythonic Future
 Metview 5.0 and Beyond, to its Pythonic Future MOS 2017, ECMWF Iain Russell, Fernando Ii, Sándor Kertész, Stephan Siemen Development Section, ECMWF ECMWF March 02, 2017 What is Metview? Workstation software
Metview and Python - what they can do for each other
 Metview and Python - what they can do for each other Workshop on Python for Earth System Sciences, ECMWF Iain Russell, Fernando Ii, Sándor Kertész, Stephan Siemen Development Section, ECMWF ECMWF November
Anne Fouilloux. Fig. 1 Use of observational data at ECMWF since CMA file structure.
 ODB (Observational Database) and its usage at ECMWF Anne Fouilloux Abstract ODB stands for Observational DataBase and has been developed at ECMWF since mid-1998 by Sami Saarinen. The main goal of ODB is
Data Centre NetCDF Implementation Pilot
 Data Centre NetCDF Implementation Pilot Peter Miu EUMETSAT User Conference Oslo, Sep. 2011 Splinter Session, Facilitating Data Access and Utilisation Slide: 1 EUM/OPS/VWG/11/2600 V.1 What is this Pilot
Generating SVG weather maps and meteorological graphs using Magics++
 Generating SVG weather maps and meteorological graphs using Magics++ Stephan Siemen Graphics Section ECMWF Slide 1 1 Outline What is ECMWF? What is Magics++? How did we implement our SVG output? Some examples
Using ODB at ECMWF. Piotr Kuchta Sándor Kertész. Development Section ECMWF. Slide 1. MOS Workshop, 2013 November 18-20, ECMWF
 Using ODB at ECMWF Piotr Kuchta Sándor Kertész Development Section ECMWF Slide 1 MOS Workshop, 2013 November 18-20, ECMWF 1 History of ODB in a nutshell 1998 2008, Sami Saarinen Database of observations
Metview BUFR Tutorial. Meteorological Visualisation Section Operations Department ECMWF
 Meteorological Visualisation Section Operations Department ECMWF 05/03/2015 This tutorial was tested with Metview version 4.3.0 and some features might not work for previous versions. Copyright 2015 European
D&B Market Insight Release Notes. July 2016
 D&B Market Insight Release Notes July 2016 Table of Contents User Experience and Performance 3 Mapping.. 4 Visualizations.... 5 User Experience and Performance Speed Improvements Improvements have been
Observation feedback archiving in MARS. Acknowledgement:
 Observation feedback archiving in MARS Piotr Kuchta Data and Services Section, ECMWF P.Kuchta@ecmwf.int Acknowledgement: Slide 1 Manuel Fuentes, Baudouin Rault, Erik Andersson, Anne Fouilloux, Lars Isaksen,
Getting Started with Access
 MS Access Chapter 2 Getting Started with Access Course Guide 2 Getting Started with Access The Ribbon The strip across the top of the program window that contains groups of commands is a component of the
Tutorial: Importing static mesh (FBX)
") Tutorial: Importing static mesh (FBX) This tutorial walks you through the steps needed to import a static mesh and its materials from an FBX file. At the end of the tutorial you will have new mesh and
Tutorial: Importing static mesh (FBX) This tutorial walks you through the steps needed to import a static mesh and its materials from an FBX file. At the end of the tutorial you will have new mesh and
We aren t getting enough orders on our Web site, storms the CEO.
 In This Chapter Introducing how Ajax works Chapter 1 Ajax 101 Seeing Ajax at work in live searches, chat, shopping carts, and more We aren t getting enough orders on our Web site, storms the CEO. People
Altium Designer Viewer. Contents
 Altium Designer Viewer Contents What You can do Key Features at-a-glance Supported Output Generation Viewer Environment Viewing Schematic Documents Viewing PCB Documents Searching Live Supplier Data Using
S5409: Custom Iray Applications and MDL for Consistent Visual Appearance Throughout Your Pipeline
 S5409: Custom Iray Applications and MDL for Consistent Visual Appearance Throughout Your Pipeline DAVE HUTCHINSON CHIEF TECHNOLOGY OFFICER DAVE COLDRON PRODUCT DIRECTOR Today we will cover... Lightworks,
LabWare 7. Why LabWare 7?
 LabWare 7 Why LabWare 7? LabWare v1 to v6 were all about adding functionality. LabWare 7 continues that tradition, but places the user experience front and center. This release has been re-designed to
Report of the working group on meteorological visualisation applications. November Convener: Jens Daabeck Report: Iain Russell.
 Report of the working group on meteorological visualisation applications November 2005 Convener: Jens Daabeck Report: Iain Russell Slide 1 Output formats as they relate to meteorological plots Moderator:
Eloqua Insight Intro Analyzer User Guide
 Eloqua Insight Intro Analyzer User Guide Table of Contents About the Course Materials... 4 Introduction to Eloqua Insight for Analyzer Users... 13 Introduction to Eloqua Insight... 13 Eloqua Insight Home
TIGGE and the EU Funded BRIDGE project
 TIGGE and the EU Funded BRIDGE project Baudouin Raoult Head of Data and Services Section ECMWF Slide 1 Slide 1 The TIGGE core dataset THORPEX Interactive Grand Global Ensemble Global ensemble forecasts
MicroStrategy Analytics Desktop
 MicroStrategy Analytics Desktop Quick Start Guide MicroStrategy Analytics Desktop is designed to enable business professionals like you to explore data, simply and without needing direct support from IT.
FLIR Tools+ and Report Studio
 Creating and Processing Word Templates http://www.infraredtraining.com 09-20-2017 2017, Infrared Training Center. 1 FLIR Report Studio Overview Report Studio is a Microsoft Word Reporting module that is
BEAWebLogic. Portal. Overview
 BEAWebLogic Portal Overview Version 10.2 Revised: February 2008 Contents About the BEA WebLogic Portal Documentation Introduction to WebLogic Portal Portal Concepts.........................................................2-2
The EU-funded BRIDGE project
 from Newsletter Number 117 Autumn 2008 COMPUTING The EU-funded BRIDGE project doi:10.21957/t8axr71gg0 This article appeared in the Computing section of ECMWF Newsletter No. 117 Autumn 2008, pp. 29-32.
Construction IC User Guide
 Construction IC User Guide The complete source of project, company, market and theme information for the global construction industry clientservices.construction@globaldata.com https://construction.globaldata.com
Eurostat Regions and Cities Illustrated: Usage guide
 Eurostat Regions and Cities Illustrated: Usage guide With Regions and Cities Illustrated, you can easily visualise regional indicators and view data for regions you are most interested in. This interactive
COPYRIGHTED MATERIAL. Getting Started with Google Analytics. P a r t
 P a r t I Getting Started with Google Analytics As analytics applications go, Google Analytics is probably the easiest (or at least one of the easiest) available in the market today. But don t let the
Understanding users workflows
 Understanding users workflows GloFAS current and future data services Fredrik Wetterhall 1 University of Leeds 6 September 2017 Objective of the talk and exercise 1. Demonstrate how GloFAS data is disseminated
Power BI 1 - Create a dashboard on powerbi.com... 1 Power BI 2 - Model Data with the Power BI Desktop... 1
 Our course outlines are 1 and 2 hour sessions (all courses 1 hour unless stated) that are designed to be delivered presentation style with an instructor guiding attendees through scenario based examples
ECMWF point database: providing direct access to any model output grid-point values
 ECMWF point database: providing direct access to any model output grid-point values Baudouin Raoult, Cihan Şahin, Sylvie Lamy-Thépaut ECMWF ECMWF Slide 1 Why a point database? ECMWF main models output
Easing into DITA Publishing with TopLeaf
 Easing into DITA Publishing with TopLeaf DITA allows authors to quickly start creating topic-based documents. It provides a great deal of out of the box functionality for managing and re-using content.
Distributed Architectures for Environmental Visualisation Systems
 Distributed Architectures for Environmental Visualisation Systems BAUDOUIN RAOULT, BRIAN NORRIS, JENS DAABECK 1 RICARDO CARTAXO MODESTO DE SOUZA, GILBERTO CÂMARA 2 1 European Centre for Medium-Range Weather
Observational DataBase (ODB*) and its usage at ECMWF
 and its usage at ECMWF") Observational DataBase (ODB*) and its usage at ECMWF anne.fouilloux@ecmwf.int Slide 1 *ODB has been developed and maintained by Sami Saarinen Slide 1 Outline Observational usage over the past decades at
Observational DataBase (ODB*) and its usage at ECMWF anne.fouilloux@ecmwf.int Slide 1 *ODB has been developed and maintained by Sami Saarinen Slide 1 Outline Observational usage over the past decades at
for ArcSketch Version 1.1 ArcSketch is a sample extension to ArcGIS. It works with ArcGIS 9.1
 ArcSketch User Guide for ArcSketch Version 1.1 ArcSketch is a sample extension to ArcGIS. It works with ArcGIS 9.1 ArcSketch allows the user to quickly create, or sketch, features in ArcMap using easy-to-use
CSCU9B2 Practical 1: Introduction to HTML 5
 CSCU9B2 Practical 1: Introduction to HTML 5 Aim: To learn the basics of creating web pages with HTML5. Please register your practical attendance: Go to the GROUPS\CSCU9B2 folder in your Computer folder
Agari App for Splunk Quick-Start Guide
 Agari App for Splunk Quick-Start Guide Initial Release (v1.1.0) This document describes how to get started with the Agari App for Splunk. This release is available to Agari customers via SplunkBase (https://splunkbase.splunk.com/app/3568/).
Sign-up Forms Builder for Magento 2.x. User Guide
 eflyermaker Sign-up Forms Builder 2.0.5 for Magento 2.x User Guide 2 eflyermaker Dear Reader, This User-Guide is based on eflyermaker s Signup-Form Builder Plugin for Magento ecommerce. What follows is
V12 Highlights. What s new in Richmond ServiceDesk V12?
 V12 Highlights What s new in? Richmond ServiceDesk v12 incorporates many new features including a new Report Generator, a new CSP Homepage Designer, a new CSP Menu Designer, a new CSP Panels and new CSP
Chapter 4 Printing and Viewing a Presentation Using Proofing Tools I. Spell Check II. The Thesaurus... 23
 PowerPoint Level 1 Table of Contents Chapter 1 Getting Started... 7 Interacting with PowerPoint... 7 Slides... 7 I. Adding Slides... 8 II. Deleting Slides... 8 III. Cutting, Copying and Pasting Slides...
VUEWorks Report Generation Training Packet
 VUEWorks Report Generation Training Packet Thursday, June 21, 2018 Copyright 2017 VUEWorks, LLC. All rights reserved. Page 1 of 53 Table of Contents VUEWorks Reporting Course Description... 3 Generating
Urban SIS D4.4 Visualisation report
 Urban SIS D4.4 Visualisation report Issued by: Swedish Meteorological and Hydrological Institute Date: 29/12/2016 Official deadline: 31/12/2016 REF.: C3S_441 Lot3 Urban SIS D4.4 Copernicus Climate Change
MicroStrategy Desktop
 MicroStrategy Desktop Quick Start Guide MicroStrategy Desktop is designed to enable business professionals like you to explore data, simply and without needing direct support from IT. 1 Import data from
Instituting an observation database
 Instituting an observation database capability in the NCEP GSI Tom Hamill, Jeff Whitaker, Scott Gregory NOAA / ESRL Physical Sciences Division Presentation to DAOS, Exeter England, April 2016 Our intent:
Instituting an observation database (ODB) capability in the GSI
 capability in the GSI") Instituting an observation database (ODB) capability in the GSI Jeff Whitaker, Scott Gregory, and Tom Hamill NOAA / ESRL Physical Sciences Division Presentation to Blueprints for Next-Generation Data Assimilation
Instituting an observation database (ODB) capability in the GSI Jeff Whitaker, Scott Gregory, and Tom Hamill NOAA / ESRL Physical Sciences Division Presentation to Blueprints for Next-Generation Data Assimilation
Microsoft Programming in HTML5 with JavaScript and CSS3
 1800 ULEARN (853 276) www.ddls.com.au Microsoft 20480 - Programming in HTML5 with JavaScript and CSS3 Length 5 days Price $4510.00 (inc GST) Version B Overview This course provides an introduction to HTML5,
Metview FLEXTRA Tutorial. Meteorological Visualisation Section Operations Department ECMWF
 Meteorological Visualisation Section Operations Department ECMWF 05/03/2015 This tutorial was tested with Metview version 4.3.0 and will not work for previous versions. Copyright 2015 European Centre for
WhatsUp Gold 2016 Distributed Edition
 WhatsUp Gold 2016 Distributed Edition Contents Using WhatsUp Gold Distributed Edition 1 About WhatsUp Gold Distributed Edition... 1 About Distributed Edition's reporting capabilities... 2 Installing the
PROFILE DESIGN TUTORIAL KIT
 PROFILE DESIGN TUTORIAL KIT NEW PROFILE With the help of feedback from our users and designers worldwide, we ve given our profiles a new look and feel. The new profile is designed to enhance yet simplify
THE API DEVELOPER EXPERIENCE ENABLING RAPID INTEGRATION
 THE API DEVELOPER EXPERIENCE ENABLING RAPID INTEGRATION Ramchandar Loganathan IBS Solution Architect Banks require application programming interface (API) capabilities to realize the significant benefits
UAccess ANALYTICS A New Look, New Features, and New Functions
 UAccess Analytics has been updated to a new version of software! Naturally, a software update means there are some new features and functions available to UAccess Analytics users. An Updated Look One thing
Using Fusion 360 and A360 for Team Collaboration
 Using Fusion 360 and A360 for Team Collaboration Taylor Stein Autodesk Sachlene Singh - Autodesk CD7050 This class will show attendees how to use Fusion 360 and the Autodesk A360 cloudcomputing platform
JobRouter Product description Version 3.0
 JobRouter Product description Version 3.0 Index Philosophy... 03 Workflow with JobRouter Basics... 04 Defining the term workflow... 04. Displaying processes... 04 Forms of process management... 05 Sequential...
Integrated Software Environment. Part 2
 Integrated Software Environment Part 2 Operating Systems An operating system is the most important software that runs on a computer. It manages the computer's memory, processes, and all of its software
Business Intelligence and Reporting Tools
 Business Intelligence and Reporting Tools Release 1.0 Requirements Document Version 1.0 November 8, 2004 Contents Eclipse Business Intelligence and Reporting Tools Project Requirements...2 Project Overview...2
Python in the Copernicus Climate Change Service
 Python in the Copernicus Service Gionata Biavati C D S : A n e w w a y o f s e r v i n g d a t a Copernicus Services (C3S) (https://climate.copernicus.eu) is providing the Data Store (CDS) (https://cds.climate.copernicus.eu)
Usability and User Interfaces
 Usability and User Interfaces The Importance of User Interface Design A computer system is only as good as the interface it provides to its users. Functionality, easy navigation, elegant design, response
User Manual. Version 2.0
 User Manual Version 2.0 Table of Contents Introduction Quick Start Inspector Explained FAQ Documentation Introduction Map ity allows you to use any real world locations by providing access to OpenStreetMap
Learning vrealize Orchestrator in action V M U G L A B
 Learning vrealize Orchestrator in action V M U G L A B Lab Learning vrealize Orchestrator in action Code examples If you don t feel like typing the code you can download it from the webserver running on
Project "THE4BEES Transnational Holistic Ecosystem 4 Better Energy Efficiency Through Social Innovation"
 Project "THE4BEES Transnational Holistic Ecosystem 4 Better Energy Efficiency Through Social Innovation" Work Package No. T3.5 DELIVERABLE Development of a dashboard for evaluators and high level users
Editor-in-Chief and Deputy Editor Prism Guidelines
 Editor-in-Chief and Deputy Editor Prism Guidelines This document is intended to provide an overview of those features of the Prism Editor Module particular to Editors-in- Chief and Deputy/Division Editors.
Advance Excel Performing calculations on data 1. Naming groups of data 2. Creating formulas to calculate values
 Advance Excel 2013 Getting started with Excel 2013 1. Identifying the different Excel 2013 programs 2. Identifying new features of Excel 2013 a. If you are upgrading from Excel 2010 b. If you are upgrading
How WebTrends reports are constructed
 Working with Reports How WebTrends reports are constructed The reports shown in the WebTrends Desktop consist of three major sections: the calendar frame which controls the time period being viewed the
User manual. Givt dashboard. Version 1.8
 User manual Givt dashboard Version 1.8 1 1 Contents 1 Contents 1 2 Introduction 2 2.1 About this manual 2 2.2 About the Givt dashboard 2 3 Starting with the Givt dashboard 3 3.1 Log in 3 3.1.1 Web-app
Optimizing Your Android Applications
 Optimizing Your Android Applications Alexander Nelson November 27th, 2017 University of Arkansas - Department of Computer Science and Computer Engineering The Problem Reminder Immediacy and responsiveness
Gale Digital Scholar Lab Getting Started Walkthrough Guide
 Getting Started Logging In Your library or institution will provide you with your login link. You will have the option to sign in with a Google or Microsoft Account, this is so you have a personal account
Course 20480: Programming in HTML5 with JavaScript and CSS3
 Course 20480: Programming in HTML5 with JavaScript and CSS3 Overview About this course This course provides an introduction to HTML5, CSS3, and JavaScript. This course helps students gain basic HTML5/CSS3/JavaScript
End User SharePoint 2010 Videos List
 End User SharePoint 2010 Videos List Screencast Name Number Abstract Category A subsite (or simply referred to as site) is created as an interface for hosting pages, lists, libraries and web parts. Creating
alteryx training courses
 alteryx training courses alteryx designer 2 day course This course covers Alteryx Designer for new and intermediate Alteryx users. It introduces the User Interface and works through core Alteryx capability,
Essay & Assignment Preparation using MindGenius
 Essay & Assignment Preparation using MindGenius This workshop is aimed at those of you who struggle gathering and sorting information when beginning to write an essay. Using MindGenius you can plan essays
PV Developing Apps for tempo-spatial meteorological satellite data - using OGC Services. EUMETSAT ImageGallery Key Concepts for better MapApps
 PV 2011 15-17 November 2011 CNES Toulouse, France Developing Apps for tempo-spatial meteorological satellite data - using OGC Services EUMETSAT ImageGallery Key Concepts for better MapApps Uwe Voges (con
COURSE 20480B: PROGRAMMING IN HTML5 WITH JAVASCRIPT AND CSS3
 ABOUT THIS COURSE This course provides an introduction to HTML5, CSS3, and JavaScript. This course helps students gain basic HTML5/CSS3/JavaScript programming skills. This course is an entry point into
RELEASE NOTES. Overview: Introducing ForeSee CX Suite
 RELEASE NOTES Overview: Introducing ForeSee CX Suite FALL 2016 CONTENTS Overview of ForeSee CX Suite...4 First Release of CX Suite... 4 The Login Page... 4 Dashboards... 4 Surveys... 5 Cases... 5 Text
Digital Storytelling with Photo Story 3
 Digital Storytelling with Photo Story 3 Before you begin, upload your digital images and save them into an easily identifiable folder in a convenient location on your hard drive eg. the my pictures directory.
PASSPORT USER GUIDE. This guide provides a detailed overview of how to use Passport, allowing you to find the information you need more efficiently.
 PASSPORT USER GUIDE Passport is a global market research database providing insight on industries, economies and consumers worldwide, helping our clients analyse market context and identify future trends
ISU Market. A website application for buying and selling various items in the ISU domain. ComS 309 Portfolio 2 Group 11: Chao Song & Neh Batwara
 ISU Market A website application for buying and selling various items in the ISU domain ComS 309 Portfolio 2 Group 11: Chao Song & Neh Batwara Contents 1 Overview 1 2 New Concepts and Complexity 2 3 Creation,
Chapter 10 Linking Calc Data
 Calc Guide Chapter 10 Linking Calc Data Sharing data in and out of Calc Copyright This document is Copyright 2006 2013 by its contributors as listed below. You may distribute it and/or modify it under
ADVANCED EXCEL Course Modules for Advance Excel Training Online (MS Excel 2013 Course):
:") Course Modules for Advance Excel Training Online (MS Excel 2013 Course): ADVANCED EXCEL 2013 1 Getting started with Excel 2013 A Identifying the different Excel 2013 programs B Identifying new features
Course Modules for Advance Excel Training Online (MS Excel 2013 Course): ADVANCED EXCEL 2013 1 Getting started with Excel 2013 A Identifying the different Excel 2013 programs B Identifying new features
Using Development Tools to Examine Webpages
 Chapter 9 Using Development Tools to Examine Webpages Skills you will learn: For this tutorial, we will use the developer tools in Firefox. However, these are quite similar to the developer tools found
Access Application Development
 d525883 Ch01.qxd 9/26/03 8:50 AM Page 9 Chapter 1 Access Application Development IN THIS CHAPTER The various versions of Access and how they differ Developing database applications with Access The future
Performance Management
 NN44400-710 Document status: Standard Document issue: 01.04 Document date: 17 December 2009 Product release: Release 7.0 Job function: Administration Type: NTP Language type: English Copyright 2009 Nortel
Kendo UI. Builder by Progress : Using Kendo UI Designer
 Kendo UI Builder by Progress : Using Kendo UI Designer Copyright 2017 Telerik AD. All rights reserved. December 2017 Last updated with new content: Version 2.1 Updated: 2017/12/22 3 Copyright 4 Contents
Using Tableau to report on SharePoint lists and libraries: A step by step guide
 Using Tableau to report on SharePoint lists and libraries: A step by step guide Tableau is one of the most renowned and accepted Business Intelligence tool for visually analyzing the data by organizations
Programming in HTML5 with JavaScript and CSS3
 Programming in HTML5 with JavaScript and CSS3 20480B; 5 days, Instructor-led Course Description This course provides an introduction to HTML5, CSS3, and JavaScript. This course helps students gain basic
Python: Working with Multidimensional Scientific Data. Nawajish Noman Deng Ding
 Python: Working with Multidimensional Scientific Data Nawajish Noman Deng Ding Outline Scientific Multidimensional Data Ingest and Data Management Analysis and Visualization Extending Analytical Capabilities
Microsoft End to End Business Intelligence Boot Camp
 Microsoft End to End Business Intelligence Boot Camp 55045; 5 Days, Instructor-led Course Description This course is a complete high-level tour of the Microsoft Business Intelligence stack. It introduces
Road Map for Essential Studio 2011 Volume 2
 Road Map for Essential Studio 2011 Volume 2 Essential Studio User Interface Edition... 3 Windows Phone... 3 Essential Tools for WP7... 3 Essential Chart for WP7... 3 Essential Gauge for WP7... 3 ASP.NET...
Product Overview. All text and design is copyright 2009 Seavus, All rights reserved
 Product Overview All text and design is copyright 2009 Seavus, All rights reserved TABLE OF CONTENT 1. WELCOME TO SEAVUS DROPMIND 2 1.1 INTRODUCTION... 2 2 SEAVUS DROPMIND FUNCTIONALITIES 4 2.1 BASIC FUNCTIONALITY...