Techno Level 1: Basic Level 1. Overview of OBIEE Real Time Project
|
|
|
- Alice Patterson
- 5 years ago
- Views:
Transcription
1 Techno Level 1: Basic Level 1. Overview of OBIEE Real Time Project 1.1. Why OBIEE? As an excellent source to get a job quickly. To get excellent and handsome salary. The Future is secured and steady in OBIEE Stream. Help in Settle quickly. Refer From Fig What is OBIEE? Oracle Definition: Oracle Business Intelligence Enterprise Edition 11g (OBIEE) is an unmatched and comprehensive business intelligence and analytics platform that delivers a full range of capabilities - including interactive dashboards, ad hoc queries, mobile analytics, notifications and alerts, enterprise and financial reporting, scorecard and strategy management, business process invocation, unstructured search and collaboration, integrated systems management and more. OBIEE 11g is built on a proven and modern technological foundation that supports the highest workloads and most complex deployments, while providing timely insights to users across an enterprise at a low overall total cost of ownership. Our Definition: OBIEE or OBI is a reporting tool or application used by business users to query or requests the organization data stored over a period of time or in data warehouse or OLAP to obtain answers or results or reports for the analysis of business and make better decisions. Fig OBIEE Real Time Project Types OBIEE without ETL (Directly from OLTP or any Database) Fig OBIEE with ETL (OLAP using ETL Tools like Informatica, DAC, and ODI) Fig8
2 OBIEE with OBIA or Oracle BI Apps (Using OBIA , OBIA ) Fig OLTP vs OLAP OLTP (OnLine Transaction Processing) OLAP (OnLine Analytical Processing) 1. Source of data is transactions. 1. Source of data is from various OLTP Databases. 2. It is useful to store transactional or operational data. 2. It is useful to store consolidated data. 3. The nature of data is current and 3. The nature of data is historical and Detail. summarized. 4. Useful to RUN the Business. 4. Useful to ANALYZE the Business. 5. OLTP supports CRUD(create,Read,update,delete) 5. OLAP supports Read only. 6. OLTP is volatile. 6. OLAP is non-volatile 7. Querying or processing is very fast. 7. Querying or processing depends on amount of data. Improved by creating indexes. 8. OLTP uses normalized schemes. 8. OLAP mostly uses De-normalized schemes. 9. OLTP is isolation depends on Application. 9. OLAP is integrated as per subject area. 10. OLTP is accessed by large number of users. Ex: Customers, Employees OLAP is accessed by less number of users. Ex: CEO, CFO, COO, GM, Managers I1. What is multi-dimensional data source?-----brillio (Bangalore) 1.5. OBIEE 11g Installation Certification Matrix Fig Downloads (OTN & edelivery) i. Go to Oracle.com or edelivery.oracle.com ii. Get from Front Office in Institute Installation Types Fig 11 and Fig Installation
3 On Windows Server Refer to 1.OBIEE Installation Folder provide to you On Linux Server Refer to 1.OBIEE Installation Folder provide to you Bugs and Patches (Oracle Support) For Bugs and Patches login to Oracle Support. Just Type Oracle Support in any web browser and login. I2. Did you work any Sev-1 Issue?-----Dell (Bangalore) Try Interview Level Expected Questions Section: I. Introduction

4 2. OBIEE Introduction 2.1. History of OBIEE Siebel Systems Inc. acquired privately-held nquire Software Inc. and integrated and shipped nquire's scalable analytic server and intelligent Web products with Siebel 7, the e-business application suite. San Mateo, California and Minnesota-based nquire launched its nquire suite of products in late 1999 to monitor and deliver real-time intelligence based on any factbased problem or opportunity by initiating an or page to any device, such as a laptop, pager, PDA, RIM, U.S. and European mobile phones. Siebel 7 is an integrated suite of applications for customer relationship management (CRM -- including applications for partner relationship management (PRM) and employee relationship management (ERM) -- all based on a common Web architecture. Siebel Enterprise Analytic Platform 7.7 includes Siebel Analytics Server for calculation and integration, logical business model and metadata management, and caching. Other components include the Intelligent Interaction Management module for data mining; Interactive Dashboard, which provides a portal interface to the data.
5

")
6 In 2006, Oracle purchased Seibel analytics and renamed as Oracle Business Intelligence 10g (OBIEE 10g) OBIEE 10g:

7 OBIEE 11g: Summary: 2000: nquire formed 2001: nquire courted by Siebel. 2002: Siebel purchases nquire 2005: Oracle purchases Siebel : OBIEE 10G or Siebel : OBIEE11g Version Released 2015: OBIEE 12c Version Released Following are major releases: Siebel Analytics Siebel Analytics Siebel Analytics Siebel Analytics and Siebel Analytics / Oracle Business Intelligence and OBIEE 10gR3, Jan 2007 (MAUI) OBIEE 10gR3, Apr 2007 OBIEE 10gR3, Aug 2007 OBIEE 10gR3, Oct 2007 OBIEE 10gR3, Dec 2007 OBIEE 10gR3, May 2007
8 OBIEE 10gR3, Aug 2008 OBIEE 10gR3, Apr 2009 OBIEE 11g-July 2010 OBIEE 12c-Oct 2015 OBIEE 11g versions 1. OBIEE OBIEE OBIEE OBIEE OBIEE OBIEE 12c versions 1. OBIEE OBIEE (latest) 2.2. Components and Types OBIEE components are mainly divided into two types of components Server Components Client Components Server Components: Will be discussed in Section Titled: 7. OBIEE Architecture Client Components: There are two types, Windows based or Non Web based (Non Browser based) clients. Non Web based (Non Browser based) clients 1. BI Administration tool: The Oracle BI Administration Tool is a Windows application that you can use to create and edit repositories (RPD).The Administration Tool can connect directly to the repository in offline mode, or it can connect to the repository through the Oracle BI Server(online mode). Fig14 2. Catalog Manager: Catalog Manager is a tool that lets you perform online and offline management of Presentation Catalogs and Catalog items like reports, dashboards, permissions, Renaming reports, Migration etc.
9 3. Job Manager: The Job Manager is a Windows tool that is the interface with the Oracle BI Scheduler. Through Job Manager, you can connect to, start and stop the Oracle BI Scheduler, add and manage jobs, and manage job instances. 4. ODBC Client: Open Database Connectivity (ODBC) is an industry standard interface for connecting to databases. A Data Source Name (DSN) is used to store the information about connecting to a given database as a given database user over ODBC. Ex: nqcmd, BI analytics etc. Fig13 Web based or Browser based clients 1. BI Analytics (11g)/BI Answers (10g): Oracle BI Analysis Editor is a set of graphical tools that are used to build, view, and modify Oracle BI analyses. The analysis are queries against an organization s data. It allows us to include the views that you create in an analysis for display in dashboards. 2. BI Interactive Dashboards: Dashboards provide personalized views of corporate and external information.a dashboard consists of one or more pages. Pages can display anything that you can access or open with a web browser, including, the results of analyses, Images,Text etc., 3. BI Delivers: BI Delivers is the interface that is used to create alerts based on Oracle Business Intelligence Analyses. You can use Delivers to detect specific results and notify appropriate persons or groups using the web, wireless, mobile, and other communication channels. 4. BI Publisher: Oracle BI Publisher is the reporting solution to author, manage, and deliver all pixelperfect standardized reports and documents easier and faster than traditional reporting tools. 5. OFMW Enterprise Manager: Fusion Middleware Control is a web based,graphical user interface that used to centrally manage, monitor, and configure Oracle Business Intelligence system
10 components. For example, the Oracle BI Server, Oracle BI Presentation Services, and Oracle BI Scheduler. 6. OWLS Administration Console: The Administration Console is a Web browser-based, graphical user interface that you use to manage a WebLogic Server domain. WebLogic Server Administration Console enables you to monitor status, configure security and manage the Administration Server and Managed Servers and more 2.3 Data Modelling Elements Columns String Columns: i) Dimensional Columns Dimensional Columns or Dimensions are categories of attributes by which the business is defined. EX: Time periods, Products, Customers Within a given dimension, there may be many attributes. For example, the time period dimension can contain the attributes day, week, month, quarter, and year. Exactly what attributes a dimension contains depends on the way the business is analyzed. I3. What is a dimension? Oracle India (Bangalore),Brillio (Bangalore),TCS (Bangalore) I4. What is a Conformed dimension? Genpact (Hyderabad),TCS (Bangalore) I5. What is a Slowly Changing Dimensions (SCD)? ---capegemini (Mumbai) I6. What is a degenerate dimension? capegemini (Mumbai) I7. What is a junk dimension? Sapient (Bangalore) ii) Dimensional Hierarchical Columns Dimensional Hierarchical Columns typically contain hierarchies, which are sets of top-down relationships between members within a dimension. Ex: Year quarter month week day Measure or Numeric Columns: i) Fact Columns or Measure: Facts are the metrics that business users would use for making business decisions by joining them with their associated dimensions. Generally, facts are mere numbers.
11 Ex: Revenue, shipped quantity, billed quantity Note: The data in the dimension tables are less compared to the data in the fact tables. The data in the dimension table is static and descriptive in nature whereas the fact table contains numeric and will change regularly. Facts tables are the key performance indicators of the business. I8. What is a fact or measure?----brillio (Bangalore), Oracle India (Bangalore),Dell (Bangalore) I9. What are fact types? I10. What is an Implicit fact column?--- Genpact (Hyderabad),Oracle India(Bangalore),Accenture (Kolkata) ii) Aggregated Columns: Aggregated columns stores precomputed (typically summed) or calculated results of facts. Ex: Total Revenue, Total Shipped quantity Key Columns: A Key columns are used to identify each row/record in a database table. Or if after summing a numeric column is given a valid value then it is a Fact column otherwise it is a key column. Ex: Primary key, foreign key, Surrogate key, Chronological key I11. What is primary key and foreign key? I12. What is Surrogate key or ROW_WID, Candidate Key and Super Key? Genpact (Hyderabad) I13. What is Chronological Key? TCS (Bangalore),HCL (Chennai) Note: Cubes: In Mutli dimensional Source are made up of Cubes. Cubes are made up of measures and organized by dimensions. Because they are already dimensional, each cube maps easily to the logical fact and dimension tables in the business model. I14. What is a Cube? Do you have used Cubes?---- Brillio (Bangalore)
12 Tables i) Dimensional Tables: Dimension tables contain attributes that describe business entities (such as Customer Name, Region, Address, Country and so on). Dimension tables also contain primary keys that identify each member. EX: W_CUSTOMER_D, W_ORGANIZATION_D, W_PO_VENDORS_D ii) Dimensional Hierarchical Tables: Dimensional Hierarchical Tables has Columns typically contain hierarchies, which are sets of top- down relationships between members within a dimension. Ex: W_CALENDER_DH, W_PRODUCTS_DH I15. What are the tables or Dimensions or fact tables used in your projects or in your Data warehouse? Accion Labs (Malaysia),Deyaar (Dubai) iii) Fact Tables: Fact Tables contains facts or measures which are the key performance indicators of the business when joined with related dimensions. Ex: W_AP_INVOICE_F, W_GL_COGS_F, W_ORDERS_F I16. Did you created any dummy tables in rpd? Why? ---- TCS (Bangalore) I17. What is Factless fact table? TCS (Bangalore) iv) Aggregated Tables: Aggregate tables store precomputed results that are aggregated measures (typically summed) over a set of dimensional attributes. Using aggregate tables is a typical technique used to improve query response times in decision support systems. Ex: W_AP_INVOICE_A, W_GL_COGS_A, W_ORDERS_A Schemes A Scheme is a collection of database objects (tables, views, sequences, indexes etc.,) in a database. There may be one or more schemes in a database. Fig14 OBIEE Schemes 1. Star Scheme: A star schema is a set of dimensional schemas (stars) that each have a single fact table with foreign key join relationships to several dimension tables Fig15
13 2. Snow flake Scheme: A snow flake schema is a set of dimensional schemas (stars) that each have a single fact table with foreign key join relationships to several dimension tables and primary key join with other dimensional tables. Fig16 3. Normalized Schemas: Normalized schemas (OLTP) distribute data entities into multiple tables to minimize data storage redundancy and optimize data updates Fig17 4. Fully Denormalized Schemas: This type of dimensional schema combines the facts and dimensions as columns in one table. Ex: Flat files (excel), prebuilt summarization or OLAP cubes, star scheme, snow flake schemes. 5. Mixed schemes: It is a combination of star scheme and snow flake schemes joined by means of conformed dimensions. It is combination of some stars or snowflakes or both. I18.What are Schemes used in OBIEE? Difference between Star and Snowflake? Oracle India (Hyderabad), Brillio (Bangalore), Genpact (Hyderabad) Try Interview Level Expected Questions Section: I. Introduction
14 3. BI ADMIN TOOL I.19. On a scale of 5, how you rate yourself in BI Admin Tool? [OR] On a scale of 10, how you rate yourself in OBIEE? --- Oracle India (Hyderabad),PWC (Bangalore), Capegemini (Mumbai),Accenture (Kolkata),Dubai Islamic Bank (UAE) Physical Layer 1) The Physical layer defines the data sources to which Oracle BI Server submits queries and the relationships between physical databases and other data sources that are used to process multiple data source queries. 2) The recommended way to populate the Physical layer is by importing metadata from databases and other data sources. The data sources can be of the same or different varieties. 3) You can import schemas or portions of schemas from existing data sources. Additionally, you can create objects in the Physical layer manually. 4) When you import metadata, many of the properties of the data sources are configured automatically based on the information gathered during the import process. 5) After import, you can also define other attributes of the physical data sources, such as join relationships, that might not exist in the data source metadata. 6) There can be one or more data sources in the Physical layer, including databases, flat files, XML documents, and so forth. Here we will import and configure tables from the BISAMPLE schema from Oracle Database Hands on Main Objectives To build the Physical layer of a repository, you perform the following steps: 1. Creating a New Repository 2. Importing Metadata 3. Verifying Connection 4. Creating Aliases 5. Creating Physical Keys and Joins
15 Creating a New Repository 1. Select Start > Programs > Oracle Business Intelligence > BI Administration to open the Administration Tool. 2. Select File > New Repository 3. Select the Binary method 4. Enter the Name for the Repository i.e., BISAMPLE. 5. Leave the default location as is. It points to the default repository directory. C:\OBIEE11g_HOME\instances\instance1\bifoundation\OracleBIServerComponent\ coreapplication_obis1\repository 6. Leave Import Metadata set to Yes. 7. Enter and retype a password for the repository. BISAMPLE123 is the repository password. 8. Click Next. Importing Metadata 1. Change the Connection Type to OCI 10g/11g. The screen displays connection fields based on the connection type you selected. 2. Enter a data source name. In this example the data source name is orcl. This name is the same as the tnsnames.ora entry for this Oracle database instance. 3. Enter user name and password for the data source. In this example the username and password are both BISAMPLE. 4. Click Next. 5. Accept the default metadata types and click Next. 6. In the Data source view, expand the BISAMPLE schema. 7. Use Ctrl+Click to select the following tables from BISAMPLE schema: SAMP_ADDRESSES_D SAMP_CUSTOMERS_D SAMP_PRODUCTS_D SAMP_REVENUE_F SAMP_TIME_DAY_D 8. Click the Import Selected button to add the tables to the Repository View. 9. The Connection Pool dialog box appears. Accept the defaults and click OK.
16 10. The Importing message appears. 11. When import is complete, expand BISAMPLE in the Repository View and verify that the five tables are visible. 12. Click Finish to open the repository 13. Expand orcl > BISAMPLE and confirm that the five tables are imported into the physical layer of the repository. I20. What is a Connection Pool? How many are there in your project?---- Oracle India (Hyderabad), HCL (Chennai) I21. How can we know the features supported by database in OBIEE?---Oracle India (Hyderabad) I22. Do you Isolation Levels? What are they?----- Capegemini (Mumbai) Verifying Connection 1. Select Tools > Update All Row Counts. 2. When update row counts completes, move the cursor over the tables and observe that row count information is now visible, including when the row count was last updated. 3. Expand tables and observe that row count information is also visible for individual columns. 4. Right-click a table and select View Data to view the data for the table. 5. Close the View Data dialog box when you are done. It is a good idea to update row counts or view data after an import to verify connectivity. Viewing data or updating row count, if successful, tells you that your connection is configured correctly. Creating Aliases 1. It is recommended that you use table aliases frequently in the Physical layer to eliminate unrelated joins and to include best practice naming conventions for physical table names. Right-click SAMP_TIME_DAY_D and select New Object > Alias to open the Physical Table dialog box. 2. Enter D1 Time in the Name field 3. In the Description field, enter Time Dimension Alias at day grain. Stores one record
17 for each day. 4. Click the Columns tab. Note that alias tables inherit all column definitions from the source table 5. Click OK to close the Physical Table dialog box. 6. Repeat the steps and create the following aliases for the remaining physical tables. SAMP_ADDRESSES_D = D4 Address SAMP_CUSTOMERS_D = D3 Customer SAMP_PRODUCTS_D = D2 Product SAMP_REVENUE_F = F1 Revenue I23. What is an Alias? Difference between Alias and Duplicate?---- Genpact (Hyderabad) Creating Keys and Joins 1. Select the five alias tables in the Physical layer 2. Right-click one of the highlighted alias tables and select Physical Diagram > Selected Object(s) Only to open the Physical Diagram. Alternatively, you can click the Physical Diagram button on the toolbar. 3. Rearrange the alias table objects so they are all visible 4. You may want to adjust the objects in the Physical Diagram. If so, use the toolbar buttons to zoom in, zoom out, fit the diagram, collapse or expand objects, select objects, and so forth: 5. Click the New Join button on the toolbar. 6. Click the F1 Revenue table and then the D1 Time table. The Physical Foreign Key dialog box opens. It matters which table you click first. The join creates a one- to-many (1:N) relationship that joins the key column in the first table to a foreign key column in the second table. 7. Select the D1 Time. CALENDAR_DATE column, and then select F1 Revenue.BILL_DAY_DT to join the tables. Ensure that the Expression edit box (at the bottom) contains the following expression: "orcl".""."bisample"."d1 Time"."CALENDAR_DATE" = "orcl".""."bisample"."f1 Revenue"."BILL_DAY_DT"
18 8. Click OK to close the Physical Foreign Key dialog box. The join is visible in the Physical Diagram. 9. Repeat the steps to create joins for the remaining tables. Use the following expressions as a guide. Please notice that D4 Address joins to D3 Customer. "orcl".""."bisample"."d2 Product"."PROD_KEY" = "orcl".""."bisample"."f1 Revenue"."PROD_KEY" "orcl".""."bisample"."d3 Customer"."CUST_KEY" = "orcl".""."bisample"."f1 Revenue"."CUST_KEY" "orcl".""."bisample"."d4 Address"."ADDRESS_KEY" = "orcl".""."bisample"."d3 Customer"."ADDRESS_KEY" 10. Click the Auto Layout button on the toolbar. 11. Your diagram should look similar to the screenshot: 12. Click the X in the upper right corner to close the Physical Diagram. 13. Select File > Save or click the Save button on the toolbar to save the repository.

19 13. Click No when prompted to check global consistency. Note : Some of the more common checks are done in the Business Model and Mapping layer and Presentation layer. Since these layers are not defined yet, bypass this check until the other layers in the repository are built. I24. What are joins in OBIEE?---- Genpact (Hyderabad),HCL (Chennai),Oracle India (Hyderabad), Sapient (Banglore),KPMG (Bangalore) I25. Can we create tables in physical Layer or Did you created any views in OBIEE? Genpact (Hyderabad),Capegemini (Bangalore)
20 3.2. BMM Layer 1. The Business Model and Mapping layer (BMM) of the Administration Tool defines the business, or logical model of the data and specifies the mappings between the business model and the Physical layer schemas. 2. This layer is where the physical schemas are simplified to form the basis for the users view of the data. 3. The Business Model and Mapping layer of the Administration Tool can contain one or more business model objects. 4. A business model object contains the business model definitions and the mappings from logical to physical tables for the business model. 5. The main purpose of the business model is to capture how users think about their business using their own vocabulary. 6. The business model simplifies the physical schema and maps the users business vocabulary to physical sources. Most of the vocabulary translates into logical columns in the business model Hands on Main Objects To build the Business Model and Mapping layer of a repository, you perform the following steps: 1. Creating a Business Model 2. Examining Logical Joins 3. Examining Logical Columns 4. Examining Logical Table Sources 5. Renaming Logical Objects Manually 6. Renaming Logical Objects Using the Rename Wizard 7. Deleting Unnecessary Logical Objects 8. Creating Simple Measures Creating a Business Model 1. Right-click the white space in the Business Model and Mapping layer and select New Business Model to open the Business Model dialog box.
21 2. Enter Sample Sales in the Name field. Leave Disabled checked. 3. Click OK. The Sample Sales business model is added to the Business Model and Mapping layer. 4. In the Physical layer, select the following four alias tables: D1 Time D2 Product D3 Customer F1 Revenue Do not select D4 Address at this time. 5. Drag the four alias table from the Physical layer to the Sample Sales business model in the Business Model and Mapping layer. The tables are added to the Sample Sales business model. Note: Notice that the three dimension tables have the same icon, whereas the F1 Revenue table has an icon with a # sign, indicating it is a fact table. Examining Logical Joins 1. Right-click the Sample Sales business model and select Business Model Diagram > Whole Diagram to open the Business Model Diagram. 2. If necessary, rearrange the objects so that the join relationships are visible. Note: Because you dragged all tables simultaneously from the Physical layer onto the business model, the logical keys and joins are created automatically in the business model. This is because the keys and join relationships were already created in the Physical layer. However, you typically do not drag all physical tables simultaneously, except in very simple models. Later in this tutorial, you learn how to manually build logical keys and joins in the Business Model and Mapping layer. The process is very similar to building joins in the Physical layer. 3. Double-click any one of the joins in the diagram to open the Logical Join dialog box. In this example the join between D1 Time and F1 Revenue is selected. 4. Click OK to close the Logical Join dialog box. 5. Click the X to close the Business Model Diagram. I26. We already have joins in Physical layer then why we need to create logical joins in BMM layer or question comes in this way that why we need to
22 create logical joins? Tek Systems (Hyderabad) I27. What is cardinality? Accenture (Kolkata) I28. What the use of driving table?----- Accenture (Kolkata) Examining Logical Columns Expand the D1 Time logical table. Notice that logical columns were created automatically for each table when you dragged the alias tables from the Physical layer to the BMM layer. Examining Logical Table Sources (LTS) 1. Expand the Sources folder for the D1 Time logical table. Notice there is a logical table source, D1 Time. This logical table source maps to the D1 Time alias table in the Physical layer. 2. Double-click the D1 Time logical table source (not the logical table) to open the Logical Table Source dialog box. 3. On the General tab, rename the D1 Time logical table source to LTS1 Time. Notice that the logical table to physical table mapping is defined in the "Map to these tables" section. 4. On the Column Mapping tab, notice that logical column to physical column mappings are defined. If mappings are not visible, select Show mapped columns 5. You learn more about the Content and Parent-Child Settings tabs later in this tutorial when you build logical dimension hierarchies. Click OK to close the Logical Table Source dialog box. If desired, explore logical table sources for the remaining logical tables. Renaming Logical Objects Manually 1. Expand the D1 Time logical table. 2. Click on the first logical column, BEG_OF_MONTH_WID, to highlight it. 3. Click on BEG_OF_MONTH_WID again to make it editable. 4. Rename BEG_OF_MONTH_WID to Beg of Mth Wid. This is the manual method for renaming objects. You can also rename an object and select Rename to manually rename an object.
23 Renaming Objects Using the Rename Wizard 1. Select Tools > Utilities > Rename Wizard > Execute to open the Rename Wizard. 2. In the Select Objects screen, click Business Model and Mapping in the middle pane. 3. Expand the Sample Sales business model. 4. Expand the D1 Time logical table. 5. Use Shift+Click to select all of the logical columns except for the column you already renamed, Beg of Mth Wid. 6. Click Add to add the columns to the right pane. 7. Repeat the steps for the three remaining logical tables so that all logical columns from the Sample Sales business model are added to the right pane. 8. Click Next to move to the Select Types screen.notice that Logical Column is selected. If you had selected other object types, such as logical tables, the type would have appeared here. 9. Click Next to open the Select Rules screen. 10. In the Select Rules screen, select All text lowercase and click Add to add the rule to the lower pane. 11. Add the rule Change each occurrence of '_' into a space. 12. Add the rule First letter of each word capital. 13. Click Next to open the Finish screen. Verify that all logical columns will be named according to the rename rules you selected. 14. Click Finish. 15. In the Business Model and Mapping layer, expand the logical tables and confirm that all logical columns have been renamed as expected In the Physical layer, expand the alias tables and confirm that all physical columns have not been renamed. The point here is you can change object names in the BMM layer without impacting object names in the Physical layer. When logical objects are renamed, the relationships between logical objects and physical objects are maintained by the logical column to physical column mappings.
24 Deleting Unnecessary Logical Objects 1. In the BMM layer, expand Sample Sales > F1 Revenue. 2. Use Ctrl+Click to select all F1 Revenue logical columns except for Revenue and Units. 3. Right-click any one of the highlighted logical columns and select Delete. Alternatively you can select Edit > Delete or press the Delete key on your keyboard. 4. Click Yes to confirm the delete 5. Confirm that F1 Revenue contains only the Revenue and Units columns. Creating Simple Measures Double-click the Revenue logical column to open the Logical Column dialog box. 1. Click the Aggregation tab. 2. Change the default aggregation rule to Sum. 3. Click OK to close the Logical Column dialog box. Notice that the icon has changed for the Revenue logical column indicating that an aggregation rule has been applied. Repeat the steps to define the SUM aggregation rule for the Units logical column. Note: Measures are typically data that is additive, such as total dollars or total quantities. The F1 Revenue logical fact table contains the measures in your business model. You aggregated two logical columns by summing the column data. 4. Save the repository without checking global consistency. Congratulations! You have successfully built a business model in the Business Model and Mapping layer of a repository and created business measures.
25 3.3. Presentation Layer 1. The Presentation layer exposes the business model objects in Oracle BI user interfaces so that users can build analyses and dashboards to analyze their data. 2. You have created the initial Sample Sales business model in the repository. 3. You now create the Presentation layer of the repository Hands on Main Objects To build the Presentation layer you perform the following steps: 1. Creating a Subject Area 2. Creating Presentation Tables 3. Creating Presentation Columns 4. Renaming Presentation Columns 5. Reordering Presentation Columns Creating a Subject Area 1. Right-click the white space in the Presentation layer and select New Subject Area to open the Subject Area dialog box. 2. On the General tab, enter Sample Sales as the name of the subject area. 3. Click OK to close the Subject Area dialog box. The Sample Sales subject area is added to the Presentation layer. Creating Presentation Tables 1. Right-click the Sample Sales subject area and select New Presentation Table to open the Presentation Table dialog box. 2. On the General tab, enter Time as the name of the presentation table. 3. Click OK to close the Presentation Table dialog box. The Time presentation table is added to the Sample Sales subject area 4. Repeat the process and add three more presentation tables: Products, Customers and Base Facts. Note: Please note that you are using the manual method for creating Presentation layer objects. For simple models it is also possible to drag objects from the BMM layer to
26 the Presentation layer to create the Presentation layer objects. When you create presentation objects by dragging from the BMM layer, the business model becomes a subject area, the logical tables become presentation tables, and the logical columns become presentation columns. Note that all objects within a subject area must derive from a single business model. Creating Presentation Columns 1. In the BMM layer, expand the D1 Time logical table 2. Use Ctrl+ Click to select the following logical columns: Calendar Date Per Name Half Per Name Month Per Name Qtr Per Name Week Per Name Year. 3. Drag the selected logical columns to the Time presentation table in the Presentation layer. 4. Repeat the process and add the following logical columns to the remaining presentation tables: Products: Drag Brand, Lob, Prod Dsc, Type from D2 Product. Customers: Drag Cust Key, Name from D3 Customer. Base Facts: Drag Revenue, Units from F1 Revenue. Renaming Presentation Columns 1. In the Presentation layer, expand the Products presentation table. 2. Double-click the Lob presentation column to open the presentation column dialog box. On the General tab notice that "Use Logical Column Name" is selected. When you drag a logical column to a presentation table, the resulting presentation column inherits the logical column name by default. In this example the Lob presentation column inherits the name of the logical column "Sample Sales"."D2 Product"."Lob". 3. Deselect Use Logical Column Name. The Name field is now editable. 4. Enter Line of Business in the Name field. 5. Click OK to close the Presentation Column dialog box. Notice that the presentation column name is now changed to Line of Business in the Presentation layer.
27 6. In the BMM layer, expand D2 Product. Notice that the Lob logical column name is not changed. The point here is you can change object names in the Presentation layer without impacting object names in the BMM or Physical layers. 7. In the BMM layer, rename the Prod Dsc logical column to Product. Notice that the name change is inherited by the corresponding presentation column 8. Make the following name changes to logical objects in the BMM layer so that the names of the corresponding presentation columns are also changed: For the D3 Customer logical table: Change Cust Key to Customer Number. Change Name to Customer Name 9. Confirm that the corresponding presentation column names are changed. Reordering Presentation Columns 1. In the Presentation layer, double-click the Time presentation table to open the Presentation Table dialog box. 2. Click the Columns tab. 3. Select columns and use the up and down arrows, or drag the columns. to rearrange the presentation columns into the following order from top to bottom: Per Name Year Per Name Half Per Name Qtr Per Name Month Per Name Week Calendar Date 4. Click OK to close the Presentation Table dialog box and confirm that the present- ation column order is changed in the Presentation layer. 5. Repeat the steps to reorder the columns in the Products presentation table: Brand Line of Business Type Product
28 6. Save the repository without checking global consistency. Congratulations! You have successfully built the Presentation layer of a repository. Note: Create another subject area sample sales DM and copy Time, Product and Revenue from samples sales subject area and paste in sample sales DM. save RPD. I. Can a Subject area refer two Business models at time? How?--- Cognizant (Bangalore) I. Can two Subject area refer Business models at time? ----Cognizant (Bangalore) I. Can we disable a particular Subject Area or any object in Presentation layer? How?------PWC (Bangalore)
29 3.4. Testing and Validating a RPD 1. You have finished building an initial business model and now need to test and validate the repository before continuing. 2. You begin by checking the repository for errors using the consistency checking option. 3. Next you load the repository into Oracle BI Server memory. 4. You then test the repository by running an Oracle BI analysis and verifying the results. 5. Finally, you examine the query log file to observe the SQL generated by Oracle BI Server. To test and validate a repository you perform the following steps: 1. Checking Consistency 2. Loading the Repository 3. Disabling Cache 4. Setting Up Query Log 5. Creating and Running Analysis 6. Checking the Query Log Checking Consistency 1. Select File > Check Global Consistency 2. You should receive the message Business model "Sample Sales" is consistent. Do you want to mark it as available for queries? 3. Click Yes. You should receive the message: Consistency check fixed certain object(s); there are no errors, warnings or best practice violations left to report. Note: If you do not receive this message, you must fix any consistency check errors or warnings before proceeding. 4. Click OK. Notice that the Sample Sales business model icon in the BMM layer is now green, indicating it is available for queries. 5. Save the repository without checking global consistency again. 6. Select File > Close to close the repository. Leave the Administration Tool open.
30 4. OFMW Enterprise Manager 4.1. Overview Fusion Middleware Control is used to centrally manage, monitor, and configure Oracle Business Intelligence system components. For example, the Oracle BI Server, Oracle BI Presentation Services, and Oracle BI Scheduler. Fusion Middleware Control enables you to manage system components by performing tasks such as monitoring status, starting and stopping processes, scaling out, resolving issues, and configuring components. You can also manage some aspects of Java components. For example, you can monitor their status and start and stop them. Locking mechanism With large deployments, you might have multiple administrators accessing the system concurrently to view the state of the system while other administrators might want to make configuration changes. Fusion Middleware Control and Oracle WebLogic Server prevent concurrent updates of the same configuration settings by multiple administrators by using a locking mechanism that allows only one administrator to make changes at any one time. 4.2 Loading the Repository 1. Open a browser and enter the following URL to navigate to Oracle Enterprise Manager: name>:7001/em Ex: Log in as an administrative user. Typically you use the administrative user name and password provided during the Oracle BI installation. In this example the user name is weblogic and password is weblogic In the left navigation pane, expand Business Intelligence and click coreapplication. 2. In the right pane, click the Deployment tab. 3. Click the Repository subtab. 4. Click Lock and Edit Configuration. 5. Click Close when you receive the confirmation message "Lock and Edit Configuration - Completed Successfully."
31 6. In the "Upload BI Server Repository" section, click Browse to open the Choose file dialog box. 7. By default, the Choose file dialog box should open to the repository directory. If not, navigate to the repository directory with the BISAMPLE repository. If not, browse to EX:D:\OBIEE11g_Home\instances\instance1\bifoundation\ OracleBIServerComponent\coreapplication_obis1\repository. 8. Select the BISAMPLE.rpd file and click Open. 9. Enter BISAMPLE123 as the repository password and confirm the password. I. Can we change the path or location of RPD? How?--- Raqmiyat (Dubai) I. What is the size of your RPD in your Project? British Telecom(BT) (Bangalore) Loading the Catalog 10. In the BI Presentation Catalog section, click on the catalog location and move the cursor to the end and then remove SampleApplite and give BISAMPLE name. 11. Click Apply 12. In the BI Server Repository section, confirm that the Default RPD is now BISAMPLE with an extension. In this example the file name is BISAMPLE_BIXXXX. 13. Click Activate Changes. 14. Allow Active Changes processing to complete. Click Close when you receive the confirmation message Activate Changes - Completed Successfully. 15. On the Availability > Processes page, select Restart all. 16. Click Yes when you receive the message Are you sure you want to restart all components? 17. Allow the Restart All In Progress processing to complete. This may take a few moments.
32 18. Click Close when you receive the confirmation message Restart All Completed Successfully". 19. Confirm that all components are running. Oracle BI cache is now disabled and the BISAMPLE repository is loaded into BI Server. 20. Leave Oracle Enterprise Manager open. 21. Go to the catalog folder using the below path and check catalog folder MSITCAT Path: is created. Ex:C:\OBIEE11g_HOME\instances\instance1\bifoundation\OracleBIPresentationServ icescomponent\coreapplication_obips1\catalog I. What happen or error if empty catalog is loaded in BI Server?---Dell (Bangalore) 4.3 Disabling Cache 1. In the right pane of Oracle Enterprise Manager. Click the Capacity Management tab. 2. Click the Performance sub tab 3. Locate the Enable BI Server Cache section. Cache is enabled by default. 4. Click Lock and Edit Configuration 5. Click Close when you receive the confirmation message "Lock and Edit Configuration - Completed Successfully." 6. Deselect Cache enabled. Caching is typically not used during development. Disabling cache improves query performance. 7. Click Apply. 8. Click Activate Changes. 9. Click Close when you receive the confirmation message Activate Changes Completed Successfully.
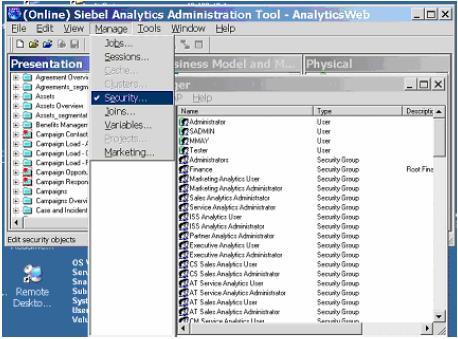
33 4.4 Setting Up Query Log 1. Return to the Administration Tool, which should still be open. 2. Select File > Open > Online to open the repository in online mode. You use online mode to view and modify a repository while it is loaded into the Oracle BI Server. The Oracle BI Server must be running to open a repository in online mode. 3. Enter BISAMPLE123 as the repository password and enter your administrative user name and password. 4. Click Open to open the repository in online mode 5. Select Manage > Identity to open Identity Manager. 6. In the left pane, select BI Repository. 7. Select Action > Set Online User Filter. 8. Enter an asterisk and click OK to fetch users from the identity store. 9. In the right pane, double-click your administrative user to open the User dialog box. In this example the administrative user is weblogic 10. In the User dialog box, on the User tab, set Logging level to Click OK to open the Check Out Objects dialog box. 12. In the Check Out Objects dialog box, click Check Out. When you are working in a repository open in online mode, you are prompted to check out objects when you attempt to perform various operations. 13. Select Action > Close to close Identity Manager. 14. Select File > Check In Changes. Alternatively, you can click the Check In Changes icon on the toolbar. 15. Save the repository. There is no need to check consistency. 16. Select File > Copy As to save a copy of the online repository with the security Changes.
34 17. In the Save Copy As dialog box, save the file as BISAMPLE.rpd, replacing the existing BISAMPLE repository. 18. Click Yes when asked if you want to replace the existing BISAMPLE repository. This will create a new BISAMPLE repository with query logging set for the weblogic user. 19. Select File > Close to close the repository. 20. Click OK when you receive the following message: "In order for your online changes to take effect, you will have to manually restart each non-master Oracle BI Server instance in the cluster." 21. Leave the Administration Tool open. 22. Open Enterprise Manager and restart all components. I. How to get the SQL generated by BI Server for analysis or report? ----Oracle India (Hyderabad) I. With want the SQL in the log file starts with?----oracle India (Hyderabad)
35 5. BI Analytics 5.1. Accessing Analytics for First Time 1. Oracle BI Analysis Editor is a set of graphical tools that are used to build, view, and modify Oracle BI analyses. 2. The analysis are queries against an organization s data. It allows us to include the views that you create in an analysis for display in dashboards. Logging In 1. Open any Mozilla or chrome or IE web browser and type below addresses a. In a browser window, enter for Enterprise Installation for Simple Installation Ex: b. The Oracle Business Intelligence Sign In page is displayed. Enter your User ID and Password and click Sign In. 2. When you sign in, the Home page is displayed. 3. Home Page contains global header, Create New section, Catalog Management section, Get Started section with links to additional help and BI tools, Recent section displaying the recently viewed or created analysis or dashboards, and Most Popular section. You can always operate these features from the global header as well Creating or Developing First Analysis Creating an Analysis and Using the Analysis Editor 1. To build an analysis, do the following: From the home page, click New > Analysis. 2. The Select Subject Area pop-up appears.
36 3. In the Select Subject Area pop-up, select Sample Sales. The Analysis Editor is displayed. Note: In this example: The selected subject area is Sample Sales The four tabs - Criteria, Results, Prompts and Advanced are displayed at the top of the Editor 4. Selected columns pane is empty as you are yet to choose the columns and Filters is empty as well waiting for the column selections and further criteria 5a. Select the following columns for your analysis. Folder Customers Products Base Facts Columns Customer Name Product Revenue b. While selecting the columns, click the plus sign to expand the folders and double click the required column names to get them in the Selected Columns section. In this example, expand the Customers folder, and then double click Customer name to get it in the Selected Columns section. Note: In the Selected Columns section, you can reorder the columns in your analysis by clicking and dragging them. 6. Click the Results tab. The default Compound Layout is displayed. Note1: The Compound Layout is a composition of many views. By default, both a Title and Table view are defined for you when using attribute and measure columns. A Pivot Table view is automatically created when using hierarchical columns in your analysis. Note2: In the Compound Layout, you can create different views of the analysis results such as graphs, tickers, and pivot tables. These are covered in this tutorial going forward.
37 Filtering, Sorting, and Saving your Analysis Filtering An Analysis: 1. Perform the following steps to filter, sort and save the previously created analysis. 2. Click the Criteria tabbed page. Select the column Customer name to create a filter. You can create a filter by hovering over the specific column's toolbar by selecting the more drop-down menu. 3. In the More drop-down menu, select Filter. The column selected for this example is Customer name. 4. The New Filter dialog box is displayed. Accept the default value for the operator, that is is equal to / is in, and enter a column value (or a range of column values) for this condition. To do this, click the drop-down list for Value, and click the desired checkboxes. 5. Click OK. The Filters pane displays the newly created filter. 6. Click OK. Saving an Analysis: 7. Click the Save icon to save your analysis. 8. Navigate to My Folders and click the New Folder icon. The New Folder dialog box appears. 9. Name the folder Revenue Details and click OK. 10. Name the analysis Revenue by Customer and click OK. 11. The analysis is saved to the catalog folder Revenue Details
38 Sorting An Analysis: 1. Go to Home page, and in the Recent area, click the Edit link for the Revenue Details analysis. Now you will add a sort to this analysis. 2. On the Criteria tabbed page, click the More Options icon for Revenue column. 3. Select Sort > Sort Descending. Note: Observe that a sort icon is added to Revenue. The order of the sort is indicated by an arrow; in this case, the arrows points down, indicating that it is descending. Additionally, if multiple sorts are added, a subscript number will also appear, indicating the sequence for the sort order. 4. Save your analysis again. 5. Click the Results tabbed page to verify the filter and sort are being applied to your analysis. The Compound Layout display the filtered and sorted analysis. I. Can we add images to analysis or report? How?----ITC Infotech (Bangalore) 5.3. Enhancing an Analysis by Adding Views 1. Create a new analysis by using new columns. Click New > Analysis on the global header. Use Sample Sales Subject Area. 2. Add Per Name Year from Time, Product from Products, and Revenue from Base Facts to Selected Columns. 3. Save the analysis to your Revenue Detail folder, as Revenue by Year as the analysis name. 4. You will now add a graph to this analysis. 5. Click the Results tabbed page, and click the New View icon. 6. Select Graph > Bar > Default (Vertical) from the menus. The default Graph view appears below the Table view. 7. Click the Remove View from Compound Layout icon for both Title and Table views.
39 8. Both views are removed from the Compound Layout. Note however, that they are still available for use from the Views pane. 9. Save the analysis. I. Can we add a logo to a report or analysis?-----pwc (Bangalore) I. If copy and paste options are disabled how will you do changes to a report? ---- PWC (Bangalore)
40 6. BI Interactive Dashboards 6.1. Exploring and Editing My Dashboard To open My Dashboard, perform the following steps: 1. Open any Mozilla or chrome or IE web browser and type below addresses In a browser window, enter 2. Click the Dashboards link on the global header and then click My Dashboard. An empty My Dashboard page appears. Note: When you open a dashboard, including My Dashboard, the content appears in one or more dashboard tabbed pages. Pages contain the columns and sections that hold the content of a dashboard, and every dashboard has at least one page. Multiple pages are used to organize content. 3. This example shows an empty My Dashboard page with no content. Hover over the Edit icon to edit the dashboard and add content. 4. Click the Edit icon ( ) to add content to your empty dashboard page. The Dashboard Builder appears and automatically creates page 1 of your dashboard 5. Using the Dashboard Builder, you can add pages and objects to a dashboard and control the page layout. The Dashboard Builder is composed of the following: 6. Dashboard Toolbar: The toolbar allows you to perform tasks such as adding or deleting pages, previewing, saving, and so on. 7. In the Dashboard Toolbar, the Tools toolbar button provides options to set dashboard properties, set page report links, and so on. 8. The Dashboard Objects pane provides you with a list of objects to add as content to a dashboard page. You will have to drag the object to the Page Layout pane on the right.
OBIEE. Oracle Business Intelligence Enterprise Edition. Rensselaer Business Intelligence Finance Author Training
 OBIEE Oracle Business Intelligence Enterprise Edition Rensselaer Business Intelligence Finance Author Training TABLE OF CONTENTS INTRODUCTION... 1 USER INTERFACE... 1 HOW TO LAUNCH OBIEE... 1 TERMINOLOGY...
A Case Study Building Financial Report and Dashboard Using OBIEE Part I
 A Case Study Building Financial Report and Dashboard Using OBIEE Part I This is a 1 st document in the series of building financial reports and dashboard taking Essbase as Data Source. This document briefs
1Z0-526
 1Z0-526 Passing Score: 800 Time Limit: 4 min Exam A QUESTION 1 ABC's Database administrator has divided its region table into several tables so that the west region is in one table and all the other regions
Oracle FLEXCUBE Universal Banking 12.0 OBIEE Repository Development Guide
 Oracle FLEXCUBE Universal Banking 12.0 OBIEE Repository Development Guide Release 1.0 May 2012 Contents 1 Preface... 3 1.1 Audience... 3 1.2 Related documents... 3 1.3 Conventions... 3 2 Introduction...
SAS Data Integration Studio 3.3. User s Guide
 SAS Data Integration Studio 3.3 User s Guide The correct bibliographic citation for this manual is as follows: SAS Institute Inc. 2006. SAS Data Integration Studio 3.3: User s Guide. Cary, NC: SAS Institute
Analytics: Server Architect (Siebel 7.7)
") Analytics: Server Architect (Siebel 7.7) Student Guide June 2005 Part # 10PO2-ASAS-07710 D44608GC10 Edition 1.0 D44917 Copyright 2005, 2006, Oracle. All rights reserved. Disclaimer This document contains
Analytics: Server Architect (Siebel 7.7) Student Guide June 2005 Part # 10PO2-ASAS-07710 D44608GC10 Edition 1.0 D44917 Copyright 2005, 2006, Oracle. All rights reserved. Disclaimer This document contains
1Z Oracle Business Intelligence Foundation Suite 11g Essentials
 1Z0-591 - Oracle Business Intelligence Foundation Suite 11g Essentials 1.When a customer wants to get sales numbers by day, how is data stored in the Star Schema, if the data is loaded nightly? A. The
ER/Studio Enterprise Portal User Guide
 ER/Studio Enterprise Portal 1.1.1 User Guide Copyright 1994-2009 Embarcadero Technologies, Inc. Embarcadero Technologies, Inc. 100 California Street, 12th Floor San Francisco, CA 94111 U.S.A. All rights
1Z0-630 Questions & Answers
 1Z0-630 Questions & Answers Number: 1Z0-630 Passing Score: 800 Time Limit: 120 min File Version: 38.2 http://www.gratisexam.com/ 1Z0-630 Questions & Answers Exam Name: Siebel7.7 Analytics Server Architect
PASS4TEST. IT Certification Guaranteed, The Easy Way! We offer free update service for one year
 PASS4TEST IT Certification Guaranteed, The Easy Way! \ http://www.pass4test.com We offer free update service for one year Exam : 1Z0-630 Title : Siebel7.7 Analytics Server Architect Professional Core Exam
Instructor : Dr. Sunnie Chung. Independent Study Spring Pentaho. 1 P a g e
 ABSTRACT Pentaho Business Analytics from different data source, Analytics from csv/sql,create Star Schema Fact & Dimension Tables, kettle transformation for big data integration, MongoDB kettle Transformation,
Contents Using the Primavera Cloud Service Administrator's Guide... 9 Web Browser Setup Tasks... 10
 Cloud Service Administrator's Guide 15 R2 March 2016 Contents Using the Primavera Cloud Service Administrator's Guide... 9 Web Browser Setup Tasks... 10 Configuring Settings for Microsoft Internet Explorer...
Designing Adhoc Reports
 Designing Adhoc Reports Intellicus Enterprise Reporting and BI Platform Intellicus Technologies info@intellicus.com www.intellicus.com Copyright 2010 Intellicus Technologies This document and its content
Question: 1 What are some of the data-related challenges that create difficulties in making business decisions? Choose three.
 Question: 1 What are some of the data-related challenges that create difficulties in making business decisions? Choose three. A. Too much irrelevant data for the job role B. A static reporting tool C.
Managing Load Plans in OTBI Enterprise for HCM Cloud Service
 Managing Load Plans in OTBI Enterprise for HCM Cloud Service Copyright 2014, Oracle and/or its affiliates. All rights reserved. 1 Objective After completing this lesson, you should be able to use Configuration
Information Design Tool User Guide SAP BusinessObjects Business Intelligence platform 4.0 Support Package 4
 Information Design Tool User Guide SAP BusinessObjects Business Intelligence platform 4.0 Support Package 4 Copyright 2012 SAP AG. All rights reserved.sap, R/3, SAP NetWeaver, Duet, PartnerEdge, ByDesign,
Oracle 1Z0-640 Exam Questions & Answers
 Oracle 1Z0-640 Exam Questions & Answers Number: 1z0-640 Passing Score: 800 Time Limit: 120 min File Version: 28.8 http://www.gratisexam.com/ Oracle 1Z0-640 Exam Questions & Answers Exam Name: Siebel7.7
Top 24 Obiee Interview Questions & Answers
 Top 24 Obiee Interview Questions & Answers 1) Mention what is Obiee? Obiee stands for Oracle Business Intelligence Enterprise Edition (OBIEE). It is a business intelligence system for the enterprise that
Oracle 1Z0-591 Exam Questions and Answers (PDF) Oracle 1Z0-591 Exam Questions 1Z0-591 BrainDumps
 Oracle 1Z0-591 Exam Questions 1Z0-591 BrainDumps") Oracle 1Z0-591 Dumps with Valid 1Z0-591 Exam Questions PDF [2018] The Oracle 1Z0-591 Oracle Business Intelligence Foundation Suite 11g Essentials exam is an ultimate source for professionals to retain
Oracle 1Z0-591 Dumps with Valid 1Z0-591 Exam Questions PDF [2018] The Oracle 1Z0-591 Oracle Business Intelligence Foundation Suite 11g Essentials exam is an ultimate source for professionals to retain
EnterpriseTrack Reporting Data Model Configuration Guide Version 17
 EnterpriseTrack EnterpriseTrack Reporting Data Model Configuration Guide Version 17 October 2018 Contents About This Guide... 5 Configuring EnterpriseTrack for Reporting... 7 Enabling the Reporting Data
User Guide. DataInsight-Web
 User Guide DataInsight-Web Table of Contents DataInsight-Web... i Table of Contents... i Overview... 2 Documentation and Support... 2 Finding Data... 3 Keyword Search... 3 Basic Search... 3 Advanced Search...
Liquidity Management OBIEE Setup Oracle Banking Liquidity Management Release [November] [2017]
![Liquidity Management OBIEE Setup Oracle Banking Liquidity Management Release [November] [2017]](/thumbs/93/113005666.jpg "Liquidity Management OBIEE Setup Oracle Banking Liquidity Management Release [November] [2017]") Liquidity Management OBIEE Setup Oracle Banking Liquidity Management Release 14.0.0.0.0 [November] [2017] Table of Contents 1. Starting BI Server... 3 1.2 Upload OBIEE Reports... 4 2.REPORT CREATION...
Liquidity Management OBIEE Setup Oracle Banking Liquidity Management Release 14.0.0.0.0 [November] [2017] Table of Contents 1. Starting BI Server... 3 1.2 Upload OBIEE Reports... 4 2.REPORT CREATION...
OBIEE Metadata Repository Deployment Guide Oracle FLEXCUBE Universal Banking Release [May] [2017]
![OBIEE Metadata Repository Deployment Guide Oracle FLEXCUBE Universal Banking Release [May] [2017]](/thumbs/72/66450564.jpg "OBIEE Metadata Repository Deployment Guide Oracle FLEXCUBE Universal Banking Release [May] [2017]") OBIEE Metadata Repository Deployment Guide Oracle FLEXCUBE Universal Banking Release 12.4.0.0.0 [May] [2017] Table of Contents 1. OBIEE METADATA REPOSITORY DEPLOYMENT GUIDE... 1-1 1.1 INTRODUCTION... 1-1
OBIEE Metadata Repository Deployment Guide Oracle FLEXCUBE Universal Banking Release 12.4.0.0.0 [May] [2017] Table of Contents 1. OBIEE METADATA REPOSITORY DEPLOYMENT GUIDE... 1-1 1.1 INTRODUCTION... 1-1
Quality Gates User guide
 Quality Gates 3.3.5 User guide 06/2013 1 Table of Content 1 - Introduction... 4 2 - Navigation... 5 2.1 Navigation tool bar... 5 2.2 Navigation tree... 5 2.3 Folder Tree... 6 2.4 Test history... 7 3 -
Oracle Utilities Analytics for Oracle Utilities Extractors and Schema and Oracle Utilities Analytics Dashboards
 Oracle Utilities Analytics for Oracle Utilities Extractors and Schema and Oracle Utilities Analytics Dashboards User s Guide Release 2.5.0 E48997-01 December 2013 Oracle Utilities Analytics for Oracle
Call: SAS BI Course Content:35-40hours
 SAS BI Course Content:35-40hours Course Outline SAS Data Integration Studio 4.2 Introduction * to SAS DIS Studio Features of SAS DIS Studio Tasks performed by SAS DIS Studio Navigation to SAS DIS Studio
Copyright 2010, Oracle. All rights reserved.
 Agenda Interactive Dashboards Master-Detail Linking New Prompt Controls Pivot Table Interactions Enhanced Dashboard Builder Analysis Editor Overview Working with the analysis editor step by step Praxisteil
Analytics Installation and Configuration Guide
 Analytics Installation and Configuration Guide 16 R2 October 2016 Contents About This Guide... 5 About Primavera Analytics... 5 About the Primavera Data Warehouse... 7 Primavera Data Warehouse and Primavera
Table of Contents. Table of Contents
 Powered by 1 Table of Contents Table of Contents Dashboard for Windows... 4 Dashboard Designer... 5 Creating Dashboards... 5 Printing and Exporting... 5 Dashboard Items... 5 UI Elements... 5 Providing
Braindumps.1z QA
 Braindumps.1z0-591.120.QA Number: 1z0-591 Passing Score: 800 Time Limit: 120 min File Version: 4.4 http://www.gratisexam.com/ 1z0-591 Oracle Business Intelligence Foundation Suite 11g Essentials I found
SAS. Information Map Studio 3.1: Creating Your First Information Map
 SAS Information Map Studio 3.1: Creating Your First Information Map The correct bibliographic citation for this manual is as follows: SAS Institute Inc. 2006. SAS Information Map Studio 3.1: Creating Your
Business Insight Authoring
 Business Insight Authoring Getting Started Guide ImageNow Version: 6.7.x Written by: Product Documentation, R&D Date: August 2016 2014 Perceptive Software. All rights reserved CaptureNow, ImageNow, Interact,
My Sysco Reporting Job Aid for CMU Customers. My Sysco Reporting. For CMU Customers (Serviced by Program Sales)
") My Sysco Reporting For CMU Customers (Serviced by Program Sales) 1 Accessing My Sysco Reporting... 2 Logging In... 2 The Reporting Dashboard... 3 My Sysco Reporting Process... 6 Generating a Report...
My Sysco Reporting For CMU Customers (Serviced by Program Sales) 1 Accessing My Sysco Reporting... 2 Logging In... 2 The Reporting Dashboard... 3 My Sysco Reporting Process... 6 Generating a Report...
OBIEE Course Details
 OBIEE Course Details By Besant Technologies Course Name Category Venue OBIEE (Oracle Business Intelligence Enterprise Edition) BI Besant Technologies No.24, Nagendra Nagar, Velachery Main Road, Address
Colligo Engage Outlook App 7.1. Connected Mode - User Guide
 7.1 Connected Mode - User Guide Contents Colligo Engage Outlook App 1 Benefits 1 Key Features 1 Platforms Supported 1 Installing and Activating Colligo Engage Outlook App 2 Checking for Updates 3 Updating
Enterprise Data Catalog for Microsoft Azure Tutorial
 Enterprise Data Catalog for Microsoft Azure Tutorial VERSION 10.2 JANUARY 2018 Page 1 of 45 Contents Tutorial Objectives... 4 Enterprise Data Catalog Overview... 5 Overview... 5 Objectives... 5 Enterprise
Introducing V3 Analytics A U G U S T
 Introducing V3 Analytics A U G U S T 2 0 1 7 Table of Contents Document Versioning 2 Introduction 3 Terminology 3 Analytics Platforms: V1 Analytics versus V2 Analytics versus V3 Analytics 3 Schedule 3
ZENworks Reporting System Reference. January 2017
 ZENworks Reporting System Reference January 2017 Legal Notices For information about legal notices, trademarks, disclaimers, warranties, export and other use restrictions, U.S. Government rights, patent
Getting Started Guide. ProClarity Analytics Platform 6. ProClarity Professional
 ProClarity Analytics Platform 6 ProClarity Professional Note about printing this PDF manual: For best quality printing results, please print from the version 6.0 Adobe Reader. Getting Started Guide Acknowledgements
Oracle 1Z0-620 Exam Questions & Answers
 Oracle 1Z0-620 Exam Questions & Answers Number: 1Z0-620 Passing Score: 800 Time Limit: 120 min File Version: 35.7 http://www.gratisexam.com/ Oracle 1Z0-620 Exam Questions & Answers Exam Name: Siebel7.7
City College of San Francisco Argos Training Documentation
 City College of San Francisco Argos Training Documentation Prepared by Edgar Coronel Strata Information Group Updated March 21, 2013 Contents Login into Argos... 2 Navigation Area... 3 Explorer view...
Imagine. Create. Discover. User Manual. TopLine Results Corporation
 Imagine. Create. Discover. User Manual TopLine Results Corporation 2008-2009 Created: Tuesday, March 17, 2009 Table of Contents 1 Welcome 1 Features 2 2 Installation 4 System Requirements 5 Obtaining Installation
Colligo Manager 5.4 SP3. User Guide
 5.4 SP3 User Guide Contents Enterprise Email Management for SharePoint 2010 1 Benefits 1 Key Features 1 Platforms Supported 1 Installing and Activating Colligo Email Manager 2 Checking for Updates 4 Updating
Lesson 1: Creating and formatting an Answers analysis
 Lesson 1: Creating and formatting an Answers analysis Answers is the ad-hoc query environment in the OBIEE suite. It is in Answers that you create and format analyses to help analyze business results.
SAS BI Dashboard 3.1. User s Guide Second Edition
 SAS BI Dashboard 3.1 User s Guide Second Edition The correct bibliographic citation for this manual is as follows: SAS Institute Inc. 2007. SAS BI Dashboard 3.1: User s Guide, Second Edition. Cary, NC:
Style Report Enterprise Edition
 INTRODUCTION Style Report Enterprise Edition Welcome to Style Report Enterprise Edition! Style Report is a report design and interactive analysis package that allows you to explore, analyze, monitor, report,
Course Contents: 1 Business Objects Online Training
 IQ Online training facility offers Business Objects online training by trainers who have expert knowledge in the Business Objects and proven record of training hundreds of students Our Business Objects
UP L11 Using IT Analytics as an Alternative Reporting Platform Hands-On Lab
 UP L11 Using IT Analytics as an Alternative Reporting Platform Hands-On Lab Description IT Analytics has a diverse and powerful way of displaying data to your users. In this lab, you will learn how to
Intellicus Enterprise Reporting and BI Platform
 Designing Adhoc Reports Intellicus Enterprise Reporting and BI Platform Intellicus Technologies info@intellicus.com www.intellicus.com Designing Adhoc Reports i Copyright 2012 Intellicus Technologies This
1Z Oracle Business Intelligence (OBI) Foundation Suite 11g Essentials Exam Summary Syllabus Questions
 Foundation Suite 11g Essentials Exam Summary Syllabus Questions") 1Z0-591 Oracle Business Intelligence (OBI) Foundation Suite 11g Essentials Exam Summary Syllabus Questions Table of Contents Introduction to 1Z0-591 Exam on Oracle Business Intelligence (OBI) Foundation
1Z0-591 Oracle Business Intelligence (OBI) Foundation Suite 11g Essentials Exam Summary Syllabus Questions Table of Contents Introduction to 1Z0-591 Exam on Oracle Business Intelligence (OBI) Foundation
Day 1 Agenda. Brio 101 Training. Course Presentation and Reference Material
 Data Warehouse www.rpi.edu/datawarehouse Brio 101 Training Course Presentation and Reference Material Day 1 Agenda Training Overview Data Warehouse and Business Intelligence Basics The Brio Environment
P6 EPPM BI Publisher Configuration Guide
 P6 EPPM BI Publisher Configuration Guide 16 R2 September 2016 Contents About Configuring BI Publisher... 5 Getting Started with BI Publisher Reports... 5 Configuring P6 for Reporting... 7 Configuring
Hands-On Lab. Lab: Developing BI Applications. Lab version: Last updated: 2/23/2011
 Hands-On Lab Lab: Developing BI Applications Lab version: 1.0.0 Last updated: 2/23/2011 CONTENTS OVERVIEW... 3 EXERCISE 1: USING THE CHARTING WEB PARTS... 5 EXERCISE 2: PERFORMING ANALYSIS WITH EXCEL AND
OneStop Reporting 4.5 OSR Administration User Guide
 OneStop Reporting 4.5 OSR Administration User Guide Doc. Version 1.2 Updated: 10-Dec-14 Copyright OneStop Reporting AS Contents Introduction... 1 Who should read this manual... 1 What s included in this
[ Getting Started with Analyzer, Interactive Reports, and Dashboards ] ]
![[ Getting Started with Analyzer, Interactive Reports, and Dashboards ] ]](/thumbs/88/117545107.jpg "[ Getting Started with Analyzer, Interactive Reports, and Dashboards ] ]") Version 5.3 [ Getting Started with Analyzer, Interactive Reports, and Dashboards ] ] https://help.pentaho.com/draft_content/version_5.3 1/30 Copyright Page This document supports Pentaho Business Analytics
Version 5.3 [ Getting Started with Analyzer, Interactive Reports, and Dashboards ] ] https://help.pentaho.com/draft_content/version_5.3 1/30 Copyright Page This document supports Pentaho Business Analytics
Introduction...5. Chapter 1. Installing System Installing Server and ELMA Designer... 7
 Chapter 1 Contents Installing System Contents Introduction...5 Chapter 1. Installing System... 6 1.1. Installing Server and ELMA Designer... 7 1.2. Verifying ELMA Server and ELMA Designer Installation...
Cognos also provides you an option to export the report in XML or PDF format or you can view the reports in XML format.
 About the Tutorial IBM Cognos Business intelligence is a web based reporting and analytic tool. It is used to perform data aggregation and create user friendly detailed reports. IBM Cognos provides a wide
1. Attempt any two of the following: 10 a. State and justify the characteristics of a Data Warehouse with suitable examples.
 Instructions to the Examiners: 1. May the Examiners not look for exact words from the text book in the Answers. 2. May any valid example be accepted - example may or may not be from the text book 1. Attempt
Product Documentation. ER/Studio Portal. User Guide. Version Published February 21, 2012
 Product Documentation ER/Studio Portal User Guide Version 1.6.3 Published February 21, 2012 2012 Embarcadero Technologies, Inc. Embarcadero, the Embarcadero Technologies logos, and all other Embarcadero
ER/Studio Enterprise Portal User Guide
 ER/Studio Enterprise Portal 1.0.3 User Guide Copyright 1994-2009 Embarcadero Technologies, Inc. Embarcadero Technologies, Inc. 100 California Street, 12th Floor San Francisco, CA 94111 U.S.A. All rights
Colligo Engage Outlook App 7.1. Offline Mode - User Guide
 Colligo Engage Outlook App 7.1 Offline Mode - User Guide Contents Colligo Engage Outlook App 1 Benefits 1 Key Features 1 Platforms Supported 1 Installing and Activating Colligo Engage Outlook App 3 Checking
SharePoint: Fundamentals
 SharePoint: Fundamentals This class will introduce you to SharePoint and cover components available to end users in a typical SharePoint site. To access SharePoint, you will need to log into Office 365.
Talend Open Studio for MDM Web User Interface. User Guide 5.6.2
 Talend Open Studio for MDM Web User Interface User Guide 5.6.2 Talend Open Studio for MDM Web User Interface Adapted for v5.6.2. Supersedes previous releases. Publication date: May 12, 2015 Copyleft This
Analytics Installation and Configuration Guide for On-Premises
 Analytics Installation and Configuration Guide for On-Premises Version 18 December 2018 Contents About this Guide... 5 About Primavera Analytics... 5 About Primavera Data Warehouse... 5 About Oracle Business
SSAS 2008 Tutorial: Understanding Analysis Services
 Departamento de Engenharia Informática Sistemas de Informação e Bases de Dados Online Analytical Processing (OLAP) This tutorial has been copied from: https://www.accelebrate.com/sql_training/ssas_2008_tutorial.htm
Cube Designer User Guide SAP BusinessObjects Financial Consolidation, Cube Designer 10.0
 Cube Designer User Guide SAP BusinessObjects Financial Consolidation, Cube Designer 10.0 Copyright 2011 SAP AG. All rights reserved.sap, R/3, SAP NetWeaver, Duet, PartnerEdge, ByDesign, SAP BusinessObjects
SharePoint: Fundamentals
 SharePoint: Fundamentals This class will introduce you to SharePoint and cover components available to end users in a typical SharePoint site. To access SharePoint, you will need to log into Office 365.
EMC Ionix ControlCenter (formerly EMC ControlCenter) 6.0 StorageScope
 6.0 StorageScope") EMC Ionix ControlCenter (formerly EMC ControlCenter) 6.0 StorageScope Best Practices Planning Abstract This white paper provides advice and information on practices that will enhance the flexibility of
EMC Ionix ControlCenter (formerly EMC ControlCenter) 6.0 StorageScope Best Practices Planning Abstract This white paper provides advice and information on practices that will enhance the flexibility of
Test Information and Distribution Engine
 SC-Alt Test Information and Distribution Engine User Guide 2018 2019 Published January 14, 2019 Prepared by the American Institutes for Research Descriptions of the operation of the Test Information Distribution
HYPERION SYSTEM 9 PERFORMANCE SCORECARD
 HYPERION SYSTEM 9 PERFORMANCE SCORECARD RELEASE 9.2 NEW FEATURES Welcome to Hyperion System 9 Performance Scorecard, Release 9.2. This document describes the new or modified features in this release. C
Upload, Model, Analyze, and Report
 May / June 2016 Upload, Model, Analyze, and Report by Mark Rittman Quickly load information to Oracle Business Intelligence Cloud Service and share the reporting with your coworkers. Oracle Business Intelligence
Oracle Financial Services Governance, Risk, and Compliance Workflow Manager User Guide. Release February 2016 E
 Oracle Financial Services Governance, Risk, and Compliance Workflow Manager User Guide Release 8.0.2.0.0 February 2016 E65393-01 Oracle Financial Services Governance, Risk, and Compliance Workflow Manager
1z0-591.exam.70q.
 1z0-591.exam.70q Number: 1z0-591 Passing Score: 800 Time Limit: 120 min 1z0-591 Oracle Business Intelligence Foundation Suite 11g Essentials Exam A QUESTION 1 Query limits tab can be accessed through.
Creating a target user and module
 The Warehouse Builder contains a number of objects, which we can use in designing our data warehouse, that are either relational or dimensional. OWB currently supports designing a target schema only in
MicroStrategy Analytics Desktop
 MicroStrategy Analytics Desktop Quick Start Guide MicroStrategy Analytics Desktop is designed to enable business professionals like you to explore data, simply and without needing direct support from IT.
Aggregating Knowledge in a Data Warehouse and Multidimensional Analysis
 Aggregating Knowledge in a Data Warehouse and Multidimensional Analysis Rafal Lukawiecki Strategic Consultant, Project Botticelli Ltd rafal@projectbotticelli.com Objectives Explain the basics of: 1. Data
Introduction to DWH / BI Concepts
 SAS INTELLIGENCE PLATFORM CURRICULUM SAS INTELLIGENCE PLATFORM BI TOOLS 4.2 VERSION SAS BUSINESS INTELLIGENCE TOOLS - COURSE OUTLINE Practical Project Based Training & Implementation on all the BI Tools
Spatial Data Standards for Facilities, Infrastructure, and Environment (SDSFIE)
") Spatial Data Standards for Facilities, Infrastructure, and Environment (SDSFIE) Model Builder User Guide Version 1.3 (24 April 2018) Prepared For: US Army Corps of Engineers 2018 Revision History Model
Spatial Data Standards for Facilities, Infrastructure, and Environment (SDSFIE) Model Builder User Guide Version 1.3 (24 April 2018) Prepared For: US Army Corps of Engineers 2018 Revision History Model
ER/Studio Enterprise Portal 1.1 User Guide
 ER/Studio Enterprise Portal 1.1 User Guide Copyright 1994-2009 Embarcadero Technologies, Inc. Embarcadero Technologies, Inc. 100 California Street, 12th Floor San Francisco, CA 94111 U.S.A. All rights
Using the Drag-and-Drop Report Builder
 Using the Drag-and-Drop Report Builder Salesforce, Spring 16 @salesforcedocs Last updated: January 7, 2016 Copyright 2000 2016 salesforce.com, inc. All rights reserved. Salesforce is a registered trademark
Oracle Financials Cloud Creating Analytics and Reports for Financials. Release 13 (update 18C)
") Creating Analytics and Reports for Financials Release 13 (update 18C) Release 13 (update 18C) Part Number E98421-01 Copyright 2011-2018, Oracle and/or its affiliates. All rights reserved. Authors: Sanjay
Creating Analytics and Reports for Financials Release 13 (update 18C) Release 13 (update 18C) Part Number E98421-01 Copyright 2011-2018, Oracle and/or its affiliates. All rights reserved. Authors: Sanjay
Siebel Analytics Platform Installation and Configuration Guide. Version 7.8.4, Rev. A February 2006
 Siebel Analytics Platform Installation and Configuration Guide Version February 2006 Siebel Systems, Inc., 2207 Bridgepointe Parkway, San Mateo, CA 94404 Copyright 2006 Siebel Systems, Inc. All rights
BANNER 9 QUICK NAVIGATION GUIDE
 Application Navigator Application Navigator provides a single interface to navigate the Banner 9 JAVA pages. It is a tool that allows you to go back and forth between the current Banner forms and the new
 Page 1 of 6 Procedures > Pages > Procedures Use -the-system > MI-generate-report MI - Generate Report I Like It Tags & Notes MI - Generate Report This is an explanation of how to access, view and filter
SIEBEL ANALYTICS SERVER ADMINISTRATION GUIDE
 SIEBEL ANALYTICS SERVER ADMINISTRATION GUIDE VERSION 7.5.3 JULY 2003 12-FRKILT Siebel Systems, Inc., 2207 Bridgepointe Parkway, San Mateo, CA 94404 Copyright 2003 Siebel Systems, Inc. All rights reserved.
Learning Portal AE: Customization and Configuration in Microsoft Dynamics CRM 2016 Hands-On-Lab
 2 Learning Portal 80729AE: Customization and Configuration in Microsoft Dynamics Hands-On-Lab 80729AE: Customization and Configuration in Microsoft Dynamics Table of Contents 80729AE: Customization and
Customizing and Administering Project Server Access
 WEB Customizing and Administering Project Server Access In this chapter Creating and Deleting Users from Project Server 2 Managing User Groups Project Server User Security 4 Using Categories to Control
Reading Sample. Creating New Documents and Queries Creating a Report in Web Intelligence Contents. Index. The Authors
 First-hand knowledge. Reading Sample In this sample chapter, you l l start in Chapter 2 by creating your first document and query in SAP BusinessObjects BI. In this process, we ll explore the query panel,
WebSphere. Clips and Tacks: Getting started with the IBM BPM suite of products
 WebSphere Clips and Tacks: Getting started with the IBM BPM suite of products ii IBM WebSphere Clips and Tacks: Getting started with the IBM BPM suite of products Contents Chapter 1. Introduction........
Portfolios Creating and Editing Portfolios... 38
 Portfolio Management User Guide 16 R1 March 2017 Contents Preface: Using Online Help... 25 Primavera Portfolio Management Overview... 27 Portfolio Management Software for Technology Leaders... 27 Solution
BBVA Compass Spend Net Payables
 User Guide BBVA Compass Spend Net Payables User Guide Vault Services Table of Contents Introduction 2 Technical Requirements 2 Getting started 3 Sign In 3 General Navigation 4 Upload/Create Payment 5
Data Warehouses Chapter 12. Class 10: Data Warehouses 1
 Data Warehouses Chapter 12 Class 10: Data Warehouses 1 OLTP vs OLAP Operational Database: a database designed to support the day today transactions of an organization Data Warehouse: historical data is
OSR Composer 3.7 User Guide. Updated:
 OSR Composer 3.7 User Guide Updated: 2013-01-31 Copyright OneStop Reporting AS www.onestopreporting.com Table of Contents Introduction... 1 Who should read this manual... 1 What s included in this manual...
We start by providing you with an overview of the key feature of the IBM BPM Process Portal.
 Lab 1 Process Portal 1.1 Overview This lab exercise will make you familiar with the key capabilities of the ready-to-use Process Portal included with IBM Business Process Manager (BPM). You will experience
Roxen Content Provider
 Roxen Content Provider Generation 3 Templates Purpose This workbook is designed to provide a training and reference tool for placing University of Alaska information on the World Wide Web (WWW) using the
Using SAP NetWeaver Business Intelligence in the universe design tool SAP BusinessObjects Business Intelligence platform 4.1
 Using SAP NetWeaver Business Intelligence in the universe design tool SAP BusinessObjects Business Intelligence platform 4.1 Copyright 2013 SAP AG or an SAP affiliate company. All rights reserved. No part
Talend Open Studio for Data Quality. User Guide 5.5.2
 Talend Open Studio for Data Quality User Guide 5.5.2 Talend Open Studio for Data Quality Adapted for v5.5. Supersedes previous releases. Publication date: January 29, 2015 Copyleft This documentation is
Oracle BI 11g R1: Build Repositories Course OR102; 5 Days, Instructor-led
 Oracle BI 11g R1: Build Repositories Course OR102; 5 Days, Instructor-led Course Description This Oracle BI 11g R1: Build Repositories training is based on OBI EE release 11.1.1.7. Expert Oracle Instructors
Kendo UI. Builder by Progress : Using Kendo UI Designer
 Kendo UI Builder by Progress : Using Kendo UI Designer Copyright 2017 Telerik AD. All rights reserved. December 2017 Last updated with new content: Version 2.1 Updated: 2017/12/22 3 Copyright 4 Contents
Guide to User Interface 4.3
 Datatel Colleague Guide to User Interface 4.3 Release 18 June 24, 2011 For corrections and clarifications to this manual, see AnswerNet page 1926.37. Guide to User Interface 4.3 All Rights Reserved The