User Guide. DataInsight-Web
|
|
|
- Patricia Berry
- 5 years ago
- Views:
Transcription
1 User Guide DataInsight-Web
2 Table of Contents DataInsight-Web... i Table of Contents... i Overview... 2 Documentation and Support... 2 Finding Data... 3 Keyword Search... 3 Basic Search... 3 Advanced Search... 4 Category Search... 5 Data Sources... 5 Building a Category Search... 6 Saving Data... 9 Workbooks... 9 Using the Context Menu for Workbooks Working with Series in a Workbook Viewing Data Picking Columns To Display Series Graph/Information Display Switching from the Series List to a Data Table Actions Preferences Global Preferences and Workbook Settings Exporting Data Exporting to Excel Applying Functions i Contents
3 Overview DataInsight-Web is a browser-based data navigation and retrieval tool, with desktop-class performance. You can use DataInsight-Web to: Find the series you need Save your series in workbooks View and pivot data on-screen Export data to Excel Documentation and Support For the most up-to-date information about DataInsight, and our business in general, check our web site, For telephone support: In the United States, contact the Client Resource Center at Outside of the United States, please contact your sales representative. For support, send your request to Support@globalinsight.com. 2 Overview Documentation and Support


4 Finding Data Use keyword and category search to find series to view, export, or store in a workbook. Keyword Search Use keyword search to find series based on a set of words or phrases, similar to using a search engine to find Web pages on the Internet. Basic Search To perform a keyword search, select Keyword Search in the left-hand side data source pane, type some keywords, and hit return or press Go. Series that match your keywords will appear in the main results area, right below where you typed your keywords. 3 Finding Data Keyword Search
.")
5 Advanced Search Advanced search allows you to specify additional criteria to be used in addition to any keywords. Clicking on Advanced will expand the options available to you. Advanced search allows you to limit results to series that match certain criteria: Data Source, Series Name, Frequency, and Bank (which can be selected from a list). To select multiple banks use Shift+Click and Ctrl+Click (or Command-Click on the Macintosh platform). 4 Finding Data Keyword Search

6 Category Search Use category search to find series based on specific criteria such country, industry, concept, brand, or vehicle type. Data Sources Related series are grouped into "datagroups" or "categories" such as U.S. Regional, Global Economy, and Financial Markets. The actual categories available to you will depend on your specific Global Insight subscription. 5 Finding Data Category Search
, and the Available Criteria will appear for the")

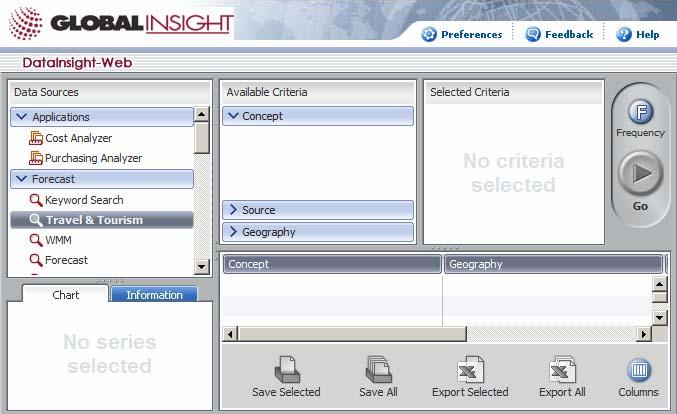
7 Building a Category Search To perform a category search: 1. Select a category (Global Economy in this example), and the Available Criteria will appear for the chosen category. Depending on the category you have selected, there may be several different criteria that can be specified, such as Geography, Concept, or Industry. In this example Geography and Concept are available. 6 Finding Data Category Search


8 2. Select your criteria by using checkboxes. As you make your selections they will appear to the right in Selected Criteria area. In this example three geographies have been selected: China, India, and Indonesia. 3. Optionally, use can use the Frequency and Scenario buttons to further limit matching series. (Note that not all categories have the Scenario button). 4. When you have finished selecting criteria, click Go to see your results. 7 Finding Data Category Search

9 8 Finding Data Category Search
 or, to save all, click the Save All icon (or right-click on Save All ).")

10 Saving Data Workbooks Workbooks are containers you can create to save, organize, and manage series. Once you have found series, you can save some, or all, in a workbook. or Select some series and click the Save Selected icon (or right-click on Save ) or, to save all, click the Save All icon (or right-click on Save All ). The Browse Workbook window will show all of your existing workbooks (if any) and allow to you select an existing workbook as the destination for your series, or you can create a new workbook by clicking on the New button. If you have clicked "New", a new, untitled workbook will be added to your list of workbooks. The name of the new workbook will be highlighted and ready to be re- 9 Saving Data Workbooks
 to save your series in the new workbook.")

11 named. Rename your workbook and click "OK" (or press "Enter") to save your series in the new workbook. To select your workbook in the future, simply click on it in your list of workbooks. Using the Context Menu for Workbooks Right click on a workbook in your list of workbooks to display a context menu of actions you can perform on the selected workbook. 10 Saving Data Workbooks


12 Context Menu Options Option Delete Description Removes the workbook and its contents completely. You will receive a confirmation window before removal. You can also select the workbook and use your delete key. Copy Creates a copy of your workbook, which will appear at the bottom of your list of workbooks. Rename Makes the name of the selected workbook editable. 11 Saving Data Workbooks

13 Move Moves a workbook to another place in your list of workbooks. You will see the Browse Workbook window; where you can select where you would like your workbook to appear. You can also rearrange your list of workbooks by placing workbooks directly where you would like them using drag-and-drop. Export Exports your series into Excel. Depending on your operating system and how your browser is configured, Excel may launch immediately, an Excel sheet may load directly in your browser, or you may see a "file download" window giving you the option to Open or Save the Excel document. 12 Saving Data Workbooks


14 Note: If using Internet Explorer, your files by default may be saved in Internet Explorer's temporary internet files folder of Internet Explorer. You can use Internet Explorer s menu options of Tools > Internet Options > General tab > Settings > Move Folder to change the default location for file downloads. View Data Table Displays the Data Table page with the series data in it. This table is also accessible from within a workbook by clicking the "Data Table" tab. 13 Saving Data Workbooks

15 Working with Series in a Workbook Series in a workbook can be moved, copied, and deleted by drag-and-drop or by using the context menu (available by right-click). You can also use the Delete key to delete any selected series. Note: Workbooks are limited to a maximum of 1,000 series. Using the Context Menu for Series in a Workbook To use the context menu for the series in a workbook, select one or more series and then right-click for the menu. When you move or copy series using this menu, a Browse Workbooks dialog box appears for you to choose the target workbook from a list or create a new workbook as the target. 14 Saving Data Workbooks

16 15 Saving Data Workbooks


17 Viewing Data After you click on the Search button, the results of your category search will appear in the columns in the middle of the page. There are many options available to control how data is formatted and presented. See the section on Preferences for more information. The following sections will show you how to: Rearrange, add, or remove data columns using the Columns button. Select series to graph and view series information. View the series in a data table. Picking Columns To Display Use the Columns button, at the bottom of the page, to display the Custom Columns dialog where you can add, remove, and reorder the columns you would like displayed for your series. You can change the selected columns by drag-and-drop, and you can also double-click on a column to flip it from right to left or vice-versa. 16 Viewing Data Picking Columns To Display
, then drag the column to the desired size.")


18 To expand a column s width, place your cursor on the line between the column headings slowly until it displays as a two-sided arrow (shown in a red box below), then drag the column to the desired size. Series Graph/Information Display At the bottom left of your screen, there is a dual-purpose panel for displaying a graph or information for one or more series that you select in the results area. Displays a graph of the selected series (you can choose up to 5 series for your graph). Click on this chart to see a larger version, with an option to switch between bar and line chart types. Displays information for the last series selected. 17 Viewing Data Switching from the Series List to a Data Table


19 Switching from the Series List to a Data Table The View Data Table option of the Workbook context menu displays the Data Table page in the selected workbook with the series data in it. Alternately, you can click on the Data Table tab in the workbook to see the table. 18 Viewing Data Switching from the Series List to a Data Table
20 Actions There are several actions you can take on series in a workbook: Button Series List What it does... Exports the selected series of the open workbook to Excel. Exports all series of the open workbook to Excel Allows you to apply functions (such as percent change) to selected series. See Applying Functions in the Exporting Data section for more information. 19 Viewing Data Switching from the Series List to a Data Table


21 Data Table View Exports the series of the open workbook to Excel and opens Excel when you choose the Open button. Toggles the orientation of the table Values Down: Values Across: Opens a new, full-size window containing only the table. When available, will group or ungroup the data values in your table. 20 Viewing Data Switching from the Series List to a Data Table
22 Preferences To have your data display look exactly the way you want it after it downloads, DataInsight-Web offers many options to customize the way your data will display and export. Options are available at a global level, where defaults can be specified for the entire application, as well as at the workbook level, where an individual workbook may have its own unique settings. Use Preferences (in the upper-left of your browser) to set global defaults that apply by default across all DataInsight-Web functions. Use a workbook's Settings button to specify settings for one particular, overriding any global default settings for that workbook. Most options can be set at either the global or workbook level. Note that at the workbook level you can chose to use application defaults, or to use settings specific to a workbook. 21 Preferences Switching from the Series List to a Data Table

23 22 Preferences Switching from the Series List to a Data Table
24 Global Preferences and Workbook Settings Tab Option Description Export Style Fancy This style displays a table that has formatting applied to it to make it more attractive and easier to see the column and row headers. Results are grouped, with each "grouping item" having its own row header with the members of the group below it. (So if grouping is by country, there will be a row with the name of the country and the following rows will contain the series for that country.) Data that has "Data Edge" information associated with it will be displayed according to the Highlight Forecast selection of the Format tab. Plain This style is an Excel spreadsheet without formatting and is recommended when the sheet is being used programmatically or as the input to another process, where style information and grouping could be a problem. With plain style each "grouping item" does not appear on a row by itself (like in Fancy). Instead, the grouping items are repeated in their own column, so each row has this information. Note: When series are exported directly from your results or the series list (not the data table) they are grouped according to the first column in the results. (So if first column is Concept the results will be grouped by concept). In the data table series are grouped according to the "Group by" selector. Format Location Orientation Decimal Places The cell location (row number and column number) where you would like the data to start in the generated Excel document. Indicate whether you want values in rows or columns by making a selection here. Select the number of decimal places to be displayed. Note: When exporting data, full values will be exported to Excel, this setting determines the format Excel will apply to Preferences Switching from the Series List to a Data Table 23


25 the data. Once in Excel data can be reformatted to show additional decimal places if needed. Display dates as For dates that do not pertain to a single calendar day, such as "2000 Q1" or "2000", select whether these dates should be passed to Excel as the start or end of the period in question. Example: For 2001 Q1 data, export this to Excel as 1 Jan 2001 (start of period) or 31 Mar 2001 (end of period). Date Range Highlight Forecasts Set amount of history and forecast For data where a "data edge" is reported, this preference lets you display forecast values in the highlight color of your choice. Select the date range in a number of years, quarters, months or observations in the future and in the past. Note: This selects the date range relative to TODAY -- it does not try to determine the data edge of individual series. Custom Start Date First available value: Select to export timeseries data, beginning with the first observation of the data that exists in our database. Number of values before or after today: Enter the number of observations, years, quarters, or months to export, starting with today and going back into time for historical data or ahead into the future for forecast data. Number of values up to end date: Enter the number of observations, years, quarters, or months to export, going back into time from the end date you specify in the following 24 Preferences Switching from the Series List to a Data Table

26 section. Fixed Date: Enter a start date or select it using the calendar tool provided. End Date Last value: Select to export timeseries data, ending with the last observation of the data that exists in our database. Today: Select to use today s date as the end date. Number of values before or after today: Enter the number of observations, years, quarters, or months to export, starting with today and going back into time for historical data or ahead into the future for forecast data. Fixed Date: Enter an end date or select it using the calendar tool provided. Advanced Default order for Category Search Billing code Maximum number of results When ordering series by concept (by clicking on the column header to sort ascending or descending), the default behavior is to sort alphabetically. This control lets you change the sorting behavior so that sorting is not done alphabetically, but is done by the order of the concept in Available Criteria in category search. For example, if concepts appear in category search in "Available Criteria" in this order -- Sales, Cost of Goods Sold, Gross Profit, Expenses, Net Profit -- this preference, when set for "Concept (Order in Tree)," will display results in this same order, not alphabetically. An optional billing code, which is recorded during your data usage and can be used to track data usage for billing purposes, for those users that accrue data usage related charges. Select the maximum number of results, from 1,000 to 9,000, that will be returned by search. Note that a workbook is limited to 1,000 series, so to export 25 Preferences Switching from the Series List to a Data Table
27 more than 1,000 series at a time, you must export from search results, and not from within a workbook. This also means it is not possible to save all of the results from a search that returns more than 1,000 series. (Only the first 1,000 results will be saved). 26 Preferences Switching from the Series List to a Data Table

28 Exporting Data Series can be exported into Excel quickly and easily from all areas of DataInsight-Web: keyword search, category search, and workbooks. There are a wide array of preferences to control the appearance and behavior of export, please see Preferences for more information. The following sections will show you how to: Export some or all series data to Excel. Apply functions to timeseries. Exporting to Excel To export category search data or workbook data to Excel: 1. Select one series in the Series List by clicking on it or, to select multiple adjacent series, use Shift-click or, to select multiple non-adjacent series, use Ctrl-click. 2. Select either the Export Selected or Export All option. 3. Select Open or Save on the File Download dialog box that appears. 27 Exporting Data Exporting to Excel


29 If you select Open, Excel will display a preformatted table that you can adjust using Excel functionality, and then print or save. If you select Save, a Save As dialog box appears for you to save the workbook, after renaming it if necessary, to any location on your system. A Download Complete dialog will appear after the file saves. 28 Exporting Data Exporting to Excel

30 29 Exporting Data Applying Functions

31 Applying Functions You can apply a function directly to a series, replacing it, or you can create a new series (a new row) to hold the series with the function applied to it. To apply a function to a series: 1. Select one or more series from the Series List: 2. Click on the Function button at the bottom of your screen and select a function. 3. (Optional) Un-select the Replace selection option if you want to see each series you selected repeated with the function applied to it as a separate row. 30 Exporting Data Applying Functions
32 31 Exporting Data Applying Functions
ECR, AD&S, M&T, Chem Tech. DataInsight-Web v4.3 User Guide
 ECR, AD&S, M&T, Chem Tech DataInsight-Web v4.3 User Guide May 1, 2018 2018 IHSM Markit. For internal use only. No portion of this publication may be reproduced, reused, or otherwise distributed in any
Excel Tables and Pivot Tables
 A) Why use a table in the first place a. Easy to filter and sort if you only sort or filter by one item b. Automatically fills formulas down c. Can easily add a totals row d. Easy formatting with preformatted
Excel Tables & PivotTables
 Excel Tables & PivotTables A PivotTable is a tool that is used to summarize and reorganize data from an Excel spreadsheet. PivotTables are very useful where there is a lot of data that to analyze. PivotTables
Training for ICDL Spreadsheets Spreadsheets 261
 261 Module Goals 1 Introduction 2 What is a Spreadsheet? 2 Section 1 Using the Application 3 1.1. Working with 3 1.2. Enhancing Productivity 11 Section 2 Cells 15 2.1. Inserting and Selecting Data 15 2.2.
Searching and Favorites in Datatel Web UI 4.3
 Searching and Favorites in Datatel Web UI 4.3 Search Field The Search field uses icons and text prompts (see Figure 1) to switch between Person Search and Form Search. You can click the icon to the left
SPREADSHEET (Excel 2007)
") SPREADSHEET (Excel 2007) 1 U N I T 0 4 BY I F T I K H A R H U S S A I N B A B U R Spreadsheet Microsoft Office Excel 2007 (or Excel) is a computer program used to enter, analyze, and present quantitative
SPREADSHEET (Excel 2007) 1 U N I T 0 4 BY I F T I K H A R H U S S A I N B A B U R Spreadsheet Microsoft Office Excel 2007 (or Excel) is a computer program used to enter, analyze, and present quantitative
Spreadsheet definition: Starting a New Excel Worksheet: Navigating Through an Excel Worksheet
 Copyright 1 99 Spreadsheet definition: A spreadsheet stores and manipulates data that lends itself to being stored in a table type format (e.g. Accounts, Science Experiments, Mathematical Trends, Statistics,
1. Right-click the worksheet tab you want to rename. The worksheet menu appears. 2. Select Rename.
 Excel 2010 Worksheet Basics Introduction Page 1 Every Excel workbook contains at least one or more worksheets. If you are working with a large amount of related data, you can use worksheets to help organize
Working with Data in Microsoft Excel 2010
 Working with Data in Microsoft Excel 2010 This document provides instructions for using the sorting and filtering features in Microsoft Excel, as well as working with multiple worksheets in the same workbook
Kenora Public Library. Computer Training. Introduction to Excel
 Kenora Public Library Computer Training Introduction to Excel Page 2 Introduction: Spreadsheet programs allow users to develop a number of documents that can be used to store data, perform calculations,
Basic Microsoft Excel 2007
 Basic Microsoft Excel 2007 Contents Starting Excel... 2 Excel Window Properties... 2 The Ribbon... 3 Tabs... 3 Contextual Tabs... 3 Dialog Box Launchers... 4 Galleries... 5 Minimizing the Ribbon... 5 The
WAAT-PivotTables Accounting Seminar
 WAAT-PivotTables-08-26-2016-Accounting Seminar Table of Contents What does a PivotTable do?... 2 How to create PivotTable:... 2 Add conditions to the PivotTable:... 2 Grouping Daily Dates into Years, Quarters,
Using Numbers, Formulas, and Functions
 UNIT FOUR: Using Numbers, Formulas, and Functions T o p i c s : Using the Sort function Create a one-input data table Hide columns Resize columns Calculate with formulas Explore functions I. Using the
Excel 2013 Workshop. Prepared by
 Excel 2013 Workshop Prepared by Joan Weeks Computer Labs Manager & Madeline Davis Computer Labs Assistant Department of Library and Information Science June 2014 Excel 2013: Fundamentals Course Description
Working with Actions Stratum.Viewer 6
 Working with Actions Stratum.Viewer 6 Getting Started Access to Actions Accessing Actions Functionality Introduction to Actions Quick Start Set up an Action Tasks Add an Email Action Add a File Share Action
How to Create Excel Dashboard used in Solutions Conference By Matt Mason
 How to Create Excel Dashboard used in Solutions Conference 2017 By Matt Mason The following is a step by step procedure to create the Dashboard presented by Matt Mason in the Excel Tips and Tricks session
Making Excel Work for Your Tribal Community
 Making Excel Work for Your Tribal Community Excel Basics: Intermediate Skills PHONE: 1-800-871-8702 EMAIL: INFO@CBC4TRIBES.ORG WEB: TRIBALINFORMATIONEXCHANGE.ORG MAKING EXCEL WORK FOR YOUR TRIBAL COMMUNITY
PM4 + Partners Knowledge Articles
 PM4 + Partners Knowledge Articles Customizing your PM4+ user experience r 1 November 30, 2108 PM4+ Partners Workspace - customize your experience Page 2 Contents Customizing Your Workspace... 1 Customizing
Data. Selecting Data. Sorting Data
 1 of 1 Data Selecting Data To select a large range of cells: Click on the first cell in the area you want to select Scroll down to the last cell and hold down the Shift key while you click on it. This
Microsoft Excel Basics Ben Johnson
 Microsoft Excel Basics Ben Johnson Topic...page # Basics...1 Workbook and worksheets...1 Sizing columns and rows...2 Auto Fill...2 Sort...2 Formatting Cells...3 Formulas...3 Percentage Button...4 Sum function...4
THE EXCEL ENVIRONMENT... 1 EDITING...
 Excel Essentials TABLE OF CONTENTS THE EXCEL ENVIRONMENT... 1 EDITING... 1 INSERTING A COLUMN... 1 DELETING A COLUMN... 1 INSERTING A ROW... DELETING A ROW... MOUSE POINTER SHAPES... USING AUTO-FILL...
Sort, Filter, Pivot Table
 Sort, Filter, Pivot Table Sort A common database task is to rearrange the information based on a header/field or headers/fields. This is called Sorting or Filtering. Sorting rearranges all of the information
Rev. C 11/09/2010 Downers Grove Public Library Page 1 of 41
 Table of Contents Objectives... 3 Introduction... 3 Excel Ribbon Components... 3 Office Button... 4 Quick Access Toolbar... 5 Excel Worksheet Components... 8 Navigating Through a Worksheet... 8 Making
Microsoft Excel 2013: Part 3 More on Formatting Cells And Worksheet Basics. To apply number formatting:
 Microsoft Excel 2013: Part 3 More on Formatting Cells And Worksheet Basics Formatting text and numbers In Excel, you can apply specific formatting for text and numbers instead of displaying all cell content
Advanced Excel. Click Computer if required, then click Browse.
 Advanced Excel 1. Using the Application 1.1. Working with spreadsheets 1.1.1 Open a spreadsheet application. Click the Start button. Select All Programs. Click Microsoft Excel 2013. 1.1.1 Close a spreadsheet
Data Should Not be a Four Letter Word Microsoft Excel QUICK TOUR
 Toolbar Tour AutoSum + more functions Chart Wizard Currency, Percent, Comma Style Increase-Decrease Decimal Name Box Chart Wizard QUICK TOUR Name Box AutoSum Numeric Style Chart Wizard Formula Bar Active
Excel 2007 New Features Table of Contents
 Table of Contents Excel 2007 New Interface... 1 Quick Access Toolbar... 1 Minimizing the Ribbon... 1 The Office Button... 2 Format as Table Filters and Sorting... 2 Table Tools... 4 Filtering Data... 4
Chapter 4. Microsoft Excel
 Chapter 4 Microsoft Excel Topic Introduction Spreadsheet Basic Screen Layout Modifying a Worksheet Formatting Cells Formulas and Functions Sorting and Filling Borders and Shading Charts Introduction A
Using Microsoft Excel
 Using Microsoft Excel Table of Contents The Excel Window... 2 The Formula Bar... 3 Workbook View Buttons... 3 Moving in a Spreadsheet... 3 Entering Data... 3 Creating and Renaming Worksheets... 4 Opening
Microsoft Excel 2010
 Microsoft Excel 2010 omar 2013-2014 First Semester 1. Exploring and Setting Up Your Excel Environment Microsoft Excel 2010 2013-2014 The Ribbon contains multiple tabs, each with several groups of commands.
Introduction to Microsoft Access 2016
 Introduction to Microsoft Access 2016 A database is a collection of information that is related. Access allows you to manage your information in one database file. Within Access there are four major objects:
Introduction to Excel 2007
 Introduction to Excel 2007 These documents are based on and developed from information published in the LTS Online Help Collection (www.uwec.edu/help) developed by the University of Wisconsin Eau Claire
Enhancements Guide. Applied Business Services, Inc. 900 Wind River Lane Suite 102 Gaithersburg, MD General Phone: (800)
") Enhancements Guide Applied Business Services, Inc. 900 Wind River Lane Suite 102 Gaithersburg, MD 20878 General Phone: (800) 451-7447 Support Telephone: (800) 451-7447 Ext. 2 Support Email: support@clientaccess.com
Enhancements Guide Applied Business Services, Inc. 900 Wind River Lane Suite 102 Gaithersburg, MD 20878 General Phone: (800) 451-7447 Support Telephone: (800) 451-7447 Ext. 2 Support Email: support@clientaccess.com
Quick Guide for Excel 2015 Data Management November 2015 Training:
 http://pfw.edu Quick Guide for Excel 2015 Data Management November 2015 Training: http://pfw.edu/training Excel 2016 Data Management AutoFill and Custom Lists AutoFill 1. Select the range that contains
Rev. B 12/16/2015 Downers Grove Public Library Page 1 of 40
 Objectives... 3 Introduction... 3 Excel Ribbon Components... 3 File Tab... 4 Quick Access Toolbar... 5 Excel Worksheet Components... 8 Navigating Through a Worksheet... 9 Downloading Templates... 9 Using
MS Office 2016 Excel Pivot Tables - notes
 Introduction Why You Should Use a Pivot Table: Organize your data by aggregating the rows into interesting and useful views. Calculate and sum data quickly. Great for finding typos. Create a Pivot Table
Freestyle Reports DW DIG Crosstabs, Hotspots and Exporting
 Exporting a Report You can export a report into other file formats. Acrobat (.pdf) Before exporting a report to.pdf format, make sure the columns in your report provide ample space for their contents.
To complete this workbook, you will need the following file:
 CHAPTER 4 Excel More Skills 13 Create PivotTable Reports A PivotTable report is an interactive, cross-tabulated Excel report used to summarize and analyze data. PivotTable reports are used to ask questions
Designing Adhoc Reports
 Designing Adhoc Reports Intellicus Enterprise Reporting and BI Platform Intellicus Technologies info@intellicus.com www.intellicus.com Copyright 2010 Intellicus Technologies This document and its content
Excel Basics. TJ McKeon
 Excel Basics TJ McKeon What is Excel? Electronic Spreadsheet in a rows and columns layout Can contain alphabetical and numerical data (text, dates, times, numbers) Allows for easy calculations and mathematical
Day : Date : Objects : Open MS Excel program. Subject : * Open Excel application. Select : start. Choose: programs. Choose : Microsoft Office
 1 2 Day : Date : Objects : Open MS Excel program. Subject : * Open Excel application. Select : start Choose: programs Choose : Microsoft Office Select: Excel * Close the Excel program Click on the Close
Business Process Procedures
 Business Process Procedures 14.40 MICROSOFT EXCEL TIPS Overview These procedures document some helpful hints and tricks while using Microsoft Excel. Key Points This document will explore the following:
Astra Scheduling Grids
 Astra Scheduling Grids To access the grids, click on the Scheduling Grids option from the Calendars tab. A default grid will be displayed as defined by the calendar permission within your role. Choosing
Introduction to Excel
 Office Button, Tabs and Ribbons Office Button The File menu selection located in the upper left corner in previous versions of Excel has been replaced with the Office Button in Excel 2007. Clicking on
MS Excel Advanced Level
 MS Excel Advanced Level Trainer : Etech Global Solution Contents Conditional Formatting... 1 Remove Duplicates... 4 Sorting... 5 Filtering... 6 Charts Column... 7 Charts Line... 10 Charts Bar... 10 Charts
Office 2016 Excel Basics 25 Video/Class Project #37 Excel Basics 25: Power Query (Get & Transform Data) to Convert Bad Data into Proper Data Set
 to Convert Bad Data into Proper Data Set") Office 2016 Excel Basics 25 Video/Class Project #37 Excel Basics 25: Power Query (Get & Transform Data) to Convert Bad Data into Proper Data Set Goal in video # 25: Learn about how to use the Get & Transform
Office 2016 Excel Basics 25 Video/Class Project #37 Excel Basics 25: Power Query (Get & Transform Data) to Convert Bad Data into Proper Data Set Goal in video # 25: Learn about how to use the Get & Transform
Pivot Tables and Pivot Charts Activities
 PMI Online Education Pivot Tables and Pivot Charts Activities Microcomputer Applications Updated 12.16.2011 Table of Contents Objective 1: Create and Modify PivotTable Reports... 3 Organizing Data to Display
Numbers Basics Website:
 Website: http://etc.usf.edu/te/ Numbers is Apple's new spreadsheet application. It is installed as part of the iwork suite, which also includes the word processing program Pages and the presentation program
Using Tables, Sparklines and Conditional Formatting. Module 5. Adobe Captivate Wednesday, May 11, 2016
 Slide 1 - Using Tables, Sparklines and Conditional Formatting Using Tables, Sparklines and Conditional Formatting Module 5 Page 1 of 27 Slide 2 - Lesson Objectives Lesson Objectives Explore the find and
Patricia Andrada Quick Guide Excel 2010 Data Management-July 2011 Page 1
 Patricia Andrada Quick Guide Excel 2010 Data Management-July 2011 Page 1 Excel 2010 Data Management AutoFill and Custom Lists AutoFill 1. Select the range that contains the initial value(s) of the series
Microsoft Excel 2013/2016 Pivot Tables
 Microsoft Excel 2013/2016 Pivot Tables Creating PivotTables PivotTables are powerful data analysis tools. They let you summarize data in various ways and instantly change the view you use. A PivotTable
Contents. 1. Managing Seed Plan Spreadsheet
 By Peter K. Mulwa Contents 1. Managing Seed Plan Spreadsheet Seed Enterprise Management Institute (SEMIs) Managing Seed Plan Spreadsheet Using Microsoft Excel 2010 3 Definition of Terms Spreadsheet: A
SPS Commerce Enterprise Analytics User Guide
 SPS Commerce Enterprise Analytics User Guide P 973-616-2929 6 Upper Pond Road, 3 rd Floor Parsippany, NJ 07054 spscommercecom 1 Table of Contents Introduction 5 Additional Resources 5 Logging In 6 Changing
Creating and Using an Excel Table
 Creating and Using an Excel Table Overview of Excel 2007 tables In earlier Excel versions, the organization of data in tables was referred to as an Excel database or list. An Excel table is not to be confused
Intermediate Microsoft Excel 2010 Tables and Printing
 John W. Jacobs Technology Center 450 Exton Square Parkway Exton, PA 19341 610.280.2666 ccljtc@ccls.org www.ccls.org Intermediate Microsoft Excel 2010 Workshop Topics: Tables o Create tables, use automatic
Les s on Objectives. Student Files Us ed. Student Files Crea ted
 Lesson 10 - Pivot Tables 103 Lesson 10 P ivot T ables Les s on Topics Creating a Pivot Table Exercise: Creating a Balance Summary Formatting a Pivot Table Creating a Calculated Field Les s on Objectives
Introductory Excel Walpole Public Schools. Professional Development Day March 6, 2012
 Introductory Excel 2010 Walpole Public Schools Professional Development Day March 6, 2012 By: Jessica Midwood Agenda: What is Excel? How is Excel 2010 different from Excel 2007? Basic functions of Excel
Intermediate Microsoft Excel 2010
 P a g e 1 Intermediate Microsoft Excel 2010 ABOUT THIS CLASS This class is designed to continue where the Microsoft Excel 2010 Basics class left off. Specifically, we will cover additional ways to organize
Hands-On Lab. Developing BI Applications. Lab version: Last updated: 2/23/2011
 Hands-On Lab Developing BI Applications Lab version: 1.0.0 Last updated: 2/23/2011 CONTENTS OVERVIEW... 3 EXERCISE 1: USING THE CHART WEB PART... 4 Task 1 Add the Chart Web Part to the page... 4 Task 2
USING MICROSOFT EXCEL 2016 Guided Project 4-3
 Guided Project 4-3 Clemenson Imaging analyzes expense reports from field representatives as well as patient and image data. To complete the worksheets, you format data as a table and build an advanced
INTRODUCTION... 1 UNDERSTANDING CELLS... 2 CELL CONTENT... 4
 Introduction to Microsoft Excel 2016 INTRODUCTION... 1 The Excel 2016 Environment... 1 Worksheet Views... 2 UNDERSTANDING CELLS... 2 Select a Cell Range... 3 CELL CONTENT... 4 Enter and Edit Data... 4
Astra Scheduling Grids
 Astra Scheduling Grids To access the grids, click on the Scheduling Grids option from the Calendars tab. A default grid will be displayed as defined by the calendar permission within your role. Choosing
Hands-On Lab. Lab: Developing BI Applications. Lab version: Last updated: 2/23/2011
 Hands-On Lab Lab: Developing BI Applications Lab version: 1.0.0 Last updated: 2/23/2011 CONTENTS OVERVIEW... 3 EXERCISE 1: USING THE CHARTING WEB PARTS... 5 EXERCISE 2: PERFORMING ANALYSIS WITH EXCEL AND
REPORT WRITER MANUAL (Version 10)
") REPORT WRITER MANUAL (Version 10) 2 Report Writer - Navigation You may access Report Writer by choosing view from your toolbar and selecting Report Writer or by choosing the Report Writer option when you
REPORT WRITER MANUAL (Version 10) 2 Report Writer - Navigation You may access Report Writer by choosing view from your toolbar and selecting Report Writer or by choosing the Report Writer option when you
Excel Tutorial 2: Formatting Workbook Text and Data
 Excel Tutorial 2: Formatting Workbook Text and Data Microsoft Office 2013 Objectives Change fonts, font style, and font color Add fill colors and a background image Create formulas to calculate sales data
Tableau Tutorial Using Canadian Arms Sales Data
 Tableau Tutorial Using Canadian Arms Sales Data 1) Your data comes from Industry Canada s Trade site. 2) If you don t want to download the data yourself, use this file. You can also download it from the
Introduction to Microsoft Excel 2010
 Introduction to Microsoft Excel 2010 This class is designed to cover the following basics: What you can do with Excel Excel Ribbon Moving and selecting cells Formatting cells Adding Worksheets, Rows and
This book is about using Microsoft Excel to
 Introducing Data Analysis with Excel This book is about using Microsoft Excel to analyze your data. Microsoft Excel is an electronic worksheet you can use to perform mathematical, financial, and statistical
Designing Adhoc Reports
 Designing Adhoc Reports Intellicus Web-based Reporting Suite Version 4.5 Enterprise Professional Smart Developer Smart Viewer Intellicus Technologies info@intellicus.com www.intellicus.com Copyright 2009
IRA Basic Running Financial Reports
 IRA Basic Running Financial Reports Updated 6-7-2013 1 Training Index Part I Introduction to the IRA Reporting Tool IRA Resources (3) Logging onto the system (4) Navigating the Dashboard (5-9) Running
IRA Basic Running Financial Reports
 IRA Basic Running Financial Reports Dartmouth College maintains a data warehouse of institutional finances, student data, advancement giving and other important measures. Institutional Reporting and Analysis
Microsoft How to Series
 Microsoft How to Series Getting Started with EXCEL 2007 A B C D E F Tabs Introduction to the Excel 2007 Interface The Excel 2007 Interface is comprised of several elements, with four main parts: Office
Workshare Professional 10. Getting Started Guide
 Workshare Professional 10 Getting Started Guide Introducing Workshare Professional 10 Workshare is dedicated to helping professionals compare, protect and share their documents. New features Compare Excel
Training Guide. Microsoft Excel 2010 Advanced 1 Using Conditional and Custom Formats. Applying Conditional Formatting
 Microsoft Excel 2010 Advanced 1 Using Conditional and Custom Formats Applying Conditional Formatting Excel lets you quickly apply Conditional Formatting to help you explore and analyze data visually, detect
IHS Enerdeq Desktop International Training Guide
 IHS > Decision Support Tool IHS Enerdeq Desktop International Training Guide May 2009 Version 1.5.2 2009 IHS, All Rights Reserved. All trademarks belong to IHS or its affiliated and subsidiary companies,
Power BI Desktop Lab
 Power BI Desktop Lab Fil Schwartz fschwartz@manersolutions.com (517) 323-7500 POWER BI DESKTOP LAB This is a hands on lab for users that have little or no experience with Power BI. We will go through a
Advisor Workstation Quick Start Guide
 SM Morningstar Advisor Workstation Morningstar Advisor Workstation provides financial advisors with tools for investment planning, portfolio analysis, security research, and sales presentations. This is
Excel Level 1
 Excel 2016 - Level 1 Tell Me Assistant The Tell Me Assistant, which is new to all Office 2016 applications, allows users to search words, or phrases, about what they want to do in Excel. The Tell Me Assistant
ANALYTICS. Performance User Guide. Volume 1
 ANALYTICS Performance User Guide Volume 1 September, 2015 2 TABLE OF CONTENTS Introduction 9 Additional Resources 9 Logging In 11 Changing your password 11 The Portal Homepage 12 Administration 12 My Reports
MicroStrategy Analytics Desktop
 MicroStrategy Analytics Desktop Quick Start Guide MicroStrategy Analytics Desktop is designed to enable business professionals like you to explore data, simply and without needing direct support from IT.
Introduction to Microsoft Excel 2007
 Introduction to Microsoft Excel 2007 Microsoft Excel is a very powerful tool for you to use for numeric computations and analysis. Excel can also function as a simple database but that is another class.
Introduction to Microsoft Excel 2010
 Introduction to Microsoft Excel 2010 This class is designed to cover the following basics: What you can do with Excel Excel Ribbon Moving and selecting cells Formatting cells Adding Worksheets, Rows and
Basic tasks in Excel 2013
 Basic tasks in Excel 2013 Excel is an incredibly powerful tool for getting meaning out of vast amounts of data. But it also works really well for simple calculations and tracking almost any kind of information.
Using Spreadsheets, Selection Sets, and COGO Controls SPECTRA PRECISION SURVEY OFFICE TUTORIAL
 Using Spreadsheets, Selection Sets, and COGO Controls SPECTRA PRECISION SURVEY OFFICE TUTORIAL Corporate office: Spectra Precision 10355 Westmoor Drive Suite #100 Westminster, CO 80021 USA Phone: +1-720-587-4700
Tutorial 5: Working with Excel Tables, PivotTables, and PivotCharts. Microsoft Excel 2013 Enhanced
 Tutorial 5: Working with Excel Tables, PivotTables, and PivotCharts Microsoft Excel 2013 Enhanced Objectives Explore a structured range of data Freeze rows and columns Plan and create an Excel table Rename
Working with Workbooks
 Working with Workbooks In Datameer, you can create a workbook to get to new insights with your data. Inside the workbook, you can add additional data sources, change the column and sheet names, collapse
1 THE PNP BASIC COMPUTER ESSENTIALS e-learning (MS Excel 2007)
") 1 THE PNP BASIC COMPUTER ESSENTIALS e-learning (MS Excel 2007) 2 THE PNP BASIC COMPUTER ESSENTIALS e-learning (MS Excel 2007) TABLE OF CONTENTS CHAPTER 1: GETTING STARTED... 5 THE EXCEL ENVIRONMENT...
1 THE PNP BASIC COMPUTER ESSENTIALS e-learning (MS Excel 2007) 2 THE PNP BASIC COMPUTER ESSENTIALS e-learning (MS Excel 2007) TABLE OF CONTENTS CHAPTER 1: GETTING STARTED... 5 THE EXCEL ENVIRONMENT...
Advanced Excel Selecting and Navigating Cells
 Advanced Excel 2007 One major organizational change in Excel 2007, when compared to 2003, is the introduction of ribbons. Each ribbon reveals many more options depending on what tab is selected. The Help
CHAPTER 4: MICROSOFT OFFICE: EXCEL 2010
 CHAPTER 4: MICROSOFT OFFICE: EXCEL 2010 Quick Summary A workbook an Excel document that stores data contains one or more pages called a worksheet. A worksheet or spreadsheet is stored in a workbook, and
Sections in this manual
 1 Sections in this manual Argus Analytics 2 The service 2 Benefits 2 Launching Argus Analytics 3 Search Interface breakdown 4 Add-in Navigation 5 Search: Free text & Facet 5 Search: Facet filter 6 Filters
Project 4 Financials (Excel)
") Project 4 Financials (Excel) Project Objective To offer an introduction to building spreadsheets, creating charts, and entering functions. Part 1 - Financial Projections One of the most important aspects
Project 4 Financials (Excel) Project Objective To offer an introduction to building spreadsheets, creating charts, and entering functions. Part 1 - Financial Projections One of the most important aspects
New Finance Officer & Staff Training
 New Finance Officer & Staff Training Overview MUNIS includes many programs and tools to allow for the management of the District financials. As newer finance officers and staff, you are charged with understanding,
The Streetscape User Guide Dynamic Watch List
 Overview The Streetscape User Guide 1.756501.100 The enables you to track and monitor securities by grouping them into lists or portfolios based on one or more common characteristics. You can create an
Highline Excel 2016 Class 09: Date Functions
 Highline Excel 2016 Class 09: Date Functions Table of Contents Date Functions... 2 Examples of EOMONTH, EDATE and DATE functions:... 2 Fiscal Year... 3 Example of Data Set with Date Helper Columns, including
Using Reports and Graphs
 Using Reports and Graphs Information in this section explains how to generate and use PCS Axis reports and graphs. The information is intended for PCS Axis users with SysAdmin, User, and Read Only user
Working with PDF s. To open a recent file on the Start screen, double click on the file name.
 Working with PDF s Acrobat DC Start Screen (Home Tab) When Acrobat opens, the Acrobat Start screen (Home Tab) populates displaying a list of recently opened files. The search feature on the top of the
Excel. Spreadsheet functions
 Excel Spreadsheet functions Objectives Week 1 By the end of this session you will be able to :- Move around workbooks and worksheets Insert and delete rows and columns Calculate with the Auto Sum function
USER MANUAL. Contents. Advanced Reporting Tool PRO for vtiger
 USER MANUAL Advanced Reporting Tool PRO for vtiger Contents Contents... 1 ADVANCED REPORTING TOOL FEATURE OVERVIEW... 2 PRE-DEFINED REPORT LIST AND FOLDERS... 3 REPORT AND CHART SETTINGS OVERVIEW... 5
Getting Started Guide. ProClarity Analytics Platform 6. ProClarity Professional
 ProClarity Analytics Platform 6 ProClarity Professional Note about printing this PDF manual: For best quality printing results, please print from the version 6.0 Adobe Reader. Getting Started Guide Acknowledgements
Excel 2013 Charts and Graphs
 Excel 2013 Charts and Graphs Copyright 2016 Faculty and Staff Training, West Chester University. A member of the Pennsylvania State System of Higher Education. No portion of this document may be reproduced