User's Guide (Website Management Functions Edition)
|
|
|
- Eustace Murphy
- 5 years ago
- Views:
Transcription


1 Systemwalker Service Quality Coordinator User's Guide (Website Management Functions Edition) Windows/Solaris/Linux J2X ENZ0(00) May 2011
2 Preface Purpose of this manual This manual explains how to use the Website administration functions of Systemwalker Service Quality Coordinator. Target audience Systemwalker Service Quality Coordinator is designed to visually express the quality of the various services provided by IT systems, and optimize business costs. This manual is aimed at individuals who use Systemwalker Service Quality Coordinator to manage Websites. Organization of Systemwalker Service Quality Coordinator manuals The Systemwalker Service Quality Coordinator manuals are organized as follows: - Systemwalker Service Quality Coordinator Technical Guide Provides an overview of the functions of Systemwalker Service Quality Coordinator. - Systemwalker Service Quality Coordinator Installation Guide Explains how to install and set up Systemwalker Service Quality Coordinator. - Systemwalker Service Quality Coordinator User's Guide Explains how to use the functions of Systemwalker Service Quality Coordinator. - Systemwalker Service Quality Coordinator User's Guide (Console Edition) Explains how to use those functions related to console windows. - Systemwalker Service Quality Coordinator User's Guide (Dashboard Edition) Explains how to use dashboard functions. - Systemwalker Service Quality Coordinator Reference Guide Explains commands, data formats, messages and so on. - Systemwalker Service Quality Coordinator Troubleshooting Guide Explains how to handle any problems that may occur. - Systemwalker Service Quality Coordinator User's Guide (Website Management Functions Edition) Explains the Systemwalker Service Quality Coordinator functions that relate to analyzing Web usage and monitoring Web content tempering. - Systemwalker Service Quality Coordinator Glossary This manual explains Systemwalker Service Quality Coordinator terminology. Organization of this manual This manual is broadly divided into the following five sections: - Overview - Installation (Basic) - Installation (Advanced) - User Guide - i -
3 - Reference Each part and appendix is comprised as follows: - Part 1 Overview - Chapter 1 Overview This chapter provides an overview of the Website administration functions. - Chapter 2 SQC operating configurations This chapter explains the operation mode used for performing basic operations. - Part 2 Installation (Basic) - Chapter 3 General Procedure for Basic Installation This chapter explains the installation procedure for basic operation. - Chapter 4 Environment Settings for the Managed Server This chapter explains how to prepare the environment of a managed server. - Chapter 5 Environment Settings for the Management Server This chapter explains how to prepare the environment of an admin server. - Chapter 6 Environment Settings for the Report Server This chapter explains how to prepare the environment of a report server. - Chapter 7 Configuring the Operating Environment This chapter explains how to configure the operating environment from the Website administration window. - Chapter 8 Checking Operation This chapter explains how to check operation. - Part 3 Installation(Application) - Chapter 9 Web Marketing This chapter explains how to perform Web site analysis for Web marketing. - Chapter 10 Monitoring for Tampering with Web Contents This chapter explains the settings used to monitor public Web content for tampering. - Part 4 User s Guide - Chapter 11 Analyzing Web Site Usage This chapter explains how to use the usage analysis function. - Chapter 12 Evaluating the Usage This chapter explains how to output usage analysis reports. - Chapter 13 Using the Contents Tampering Monitor This chapter explains how to monitor public Web content for tampering. - Part 5 References - Chapter 14 Setting the Web Site Management Window This chapter explains the settings in the Website administration window. - Chapter 15 SQC file types This chapter explains the format of definition files. - ii -
4 - Chapter 16 Troubleshooting This chapter explains how to address any problems that may occur. - Chapter 17 Messages This chapter provides a list of error messages and their meanings. - Chapter 18 Command Reference This chapter explains the various commands that can be used. - Chapter 19 Environment Maintenance This chapter explains how to maintain the operating environment. Positioning of this document This manual is common to the following Systemwalker Service Quality Coordinator products for Windows, Linux and Oracle Solaris: - Systemwalker Service Quality Coordinator Enterprise Edition V Systemwalker Service Quality Coordinator Standard Edition V Abbreviations - Microsoft Windows NT Server network operating system Version 4.0 and Microsoft Windows NT Workstation operating system Version 4.0 are abbreviated as "Windows NT ". - Microsoft Windows 2000 Professional operating system, Microsoft Windows 2000 Server operating system, and Microsoft Windows 2000 Advanced Server operating system are all abbreviated as "Windows 2000". - Microsoft Windows 98 operating system is abbreviated as "Windows 98". - Microsoft Windows XP Professional is abbreviated as "Windows XP". - Microsoft Windows Server 2003 Enterprise Edition, Microsoft Windows Server 2003 Standard Edition and Microsoft Windows Server 2003 Web Edition are all abbreviated as "Windows 2003". - Microsoft Windows Server 2008 Enterprise and Microsoft Windows Server 2008 Standard are abbreviated as "Windows 2008". - Windows Vista Home Basic, Windows Vista Home Premium, Windows Vista Business, Windows Vista Enterprise and Windows Vista Ultimate are abbreviated as " Windows Vista ". - Windows 7 Home Premium, Windows 7 Professional, Windows 7 Enterprise and Windows 7 Ultimate are abbreviated as "Windows 7" - Microsoft SQL Server TM is abbreviated as "SQL Server". - Microsoft Cluster Server is abbreviated as "MSCS". - Oracle Solaris might be described as Solaris, Solaris Operating System, or Solaris OS. - Systemwalker Centric Manager is abbreviated as "Centric Manager". - Symfoware Server is abbreviated as "Symfoware". - Interstage Application Server is abbreviated as "Interstage". - Oracle Database is abbreviated as "Oracle". - Systemwalker Resource Coordinator is abbreviated as "Resource Coordinator". - Versions of Systemwalker Service Quality Coordinator that operate under Windows are referred to as "Windows versions". - Versions of Systemwalker Service Quality Coordinator that operate under Solaris are referred to as "Solaris versions". - iii -
5 - Versions of Systemwalker Service Quality Coordinator that operate under Linux are referred to as "Linux versions". - Solaris and Linux versions of Systemwalker Service Quality Coordinator are referred to collectively as "UNIX versions". - The term "Agent" is used to refer to articles common to both Agent for Server and Agent for Business. Conventions used in this document - Edition-specific information This manual deals mainly with the Standard Edition and Enterprise Edition of Systemwalker Service Quality Coordinator. The following symbols appear in the title or text of an article to distinguish between the Standard Edition (standard specification) and the Enterprise Edition. This indicates that the article relates specifically to Systemwalker Service Quality Coordinator Enterprise Edition. This indicates that the article relates specifically to Systemwalker Service Quality Coordinator Standard Edition. - Information specific to Windows or UNIX versions This document contains information common to both Windows versions and UNIX versions of Systemwalker Service Quality Coordinator. Information specific to only the Windows versions and information specific to only the UNIX versions are distinguished from common information by attaching the following symbols: [Windows] This indicates that the article relates specifically to Windows versions. [UNIX] This indicates that the article relates specifically to UNIX versions. The symbols [Solaris], [Linux], [AIX], and [HP-UX] are used to distinguish Solaris, Linux, AIX, and HP-UX versions of Systemwalker Service Quality Coordinator. If notice should be paid, the information is distinguished from common information by attaching the following symbols: This indicates that the article relates specifically to Solaris versions. Symbols The symbols used with commands are explained below. [Entry example] [ PARA = { a b c... } ] [Meaning of each symbol] Symbol Meaning [] Items enclosed in square brackets are optional. {} Select one of the items enclosed in braces ( { } ). - iv -
6 Symbol Meaning When all optional items enclosed in square brackets ( [ ] ) are omitted, the default value indicated by an underscore ( _ ) is used. Select one of the items separated by vertical bars.... The item immediately before the ellipsis (...) can be repeatedly specified. Trademarks - MS-DOS, Microsoft, Windows, the Windows logo and Windows NT are trademarks or registered trademarks of Microsoft Corporation in the United States and other countries. - Oracle and Java are registered trademarks of Oracle and/or its affiliates. Other names may be trademarks of their respective owners. - UNIX is a registered trademark of The Open Group in the United States and other countries. - Oracle is a registered trademark of ORACLE Corporation in the United States. - Linux is a trademark or registered trademark of Mr. Linus Torvalds in the United States and other countries. - Red Hat, RPM and all Red Hat-based trademarks and logos are trademarks or registered trademarks of Red Hat, Inc. in the United States and other countries. - Intel, Pentium and Itanium are registered trademarks of Intel Corporation. - Systemwalker is a registered trademark of Fujitsu Limited. - Interstage is a registered trademark of Fujitsu Limited. - Symfoware is a registered trademark of Fujitsu Limited. - Other company names and product names are trademarks or registered trademarks of their respective companies. Acknowledgement This product includes software developed by the OpenSSL Project for use in the OpenSSL Toolkit. ( May 2011 Request - No part of the content of this manual may be reproduced without the written permission of Fujitsu Limited. - The contents of this manual may be changed without notice. Copyright FUJITSU LIMITED v -
7 Contents Part 1 Overview...1 Chapter 1 Overview Overview of Each Function Trend Viewer Supported log formats Functional configuration Usage Analysis Function components SQC extended log Contents Tampering Monitor Function overview and features Function configuration...10 Chapter 2 SQC operating configurations Basic Form Locating methods of the analysis data Operation of the Managed Server Operation of the Management Server Group Operation Server grouping Configuration for tampering monitoring...14 Part 2 Installation (Basic)...16 Chapter 3 General Procedure for Basic Installation System Configuration Environment Settings procedures Estimating Resources Management Server Usage Analysis Space estimation in the Usage DB Space estimation of the CSV format log file Space estimation of SQC extended log Tamper Monitor Managed Server Trend Viewer...21 Chapter 4 Environment Settings for the Managed Server Settings for Web Server Microsoft Internet Information Services Apache HTTP Server Netscape Enterprise Server InfoProvider Pro (packaged with Interstage Application Server) Environment Settings for Usage Analysis Defining httpd.conf Defining the usage DB environment definition file Enhancing public Web server security Settings for service start...32 Chapter 5 Environment Settings for the Management Server Settings for Web Server Windows Setting virtual directories Handler mapping settings Setting virtual directories property Setting of basic attestation vi -
8 5.1.2 UNIX Environment Settings for Usage Analysis Registering System Configuration Settings for Service Start...44 Chapter 6 Environment Settings for the Report Server Setting a virtual directory Setting a virtual directory property...46 Chapter 7 Configuring the Operating Environment Registering a Management Server Web Site Management Registering a Managed Server Managed server information Registering a Managed Server Registering an Analysis Target Server Registering a usage service Registering a Group Group Information Registering a Report Server...60 Chapter 8 Checking Operation Displaying the Usage Analysis Window Displaying a Report...64 Part 3 Installation(Application)...72 Chapter 9 Web Marketing Determining an Analysis Method and Configuration Overview of analysis type Traffic display Response analysis page Analyzing cyclic transition Analysis that identifies users Analysis using CSV output Analysis using the analysis window and analysis using CSV output Integrated analysis with data on the backbone system Overview of integrated analysis with data on the backbone systm Method of integrated analysis with data on the backbone system If you would like to analyze response SQC Extended Log Collectin Response logs Outline Making settings for log collection Stopping log collection Log format SQC extended log file File name Capacity estimation Switching the SQC extended log file Setting an extended log environment definition file File storage location Example of definition Setting a usage DB environment definition file Analysis using the usage analysis window Analyzing response using the management server If you would like to analyze user types Specifying users vii -
9 Environment settings Setting a Web server log output Setting a usage DB environment definition file Analysis using the usage analysis window If you would like to make analysis in subnetwork units Environment settings Setting an option definition file Analysis using the usage analysis window If you would like to make analysis with specific subnetworks excluded Environment settings Setting an option definition file Analysis using the usage analysis window If you would like to make analysis with specific URLs excluded Environment settings Setting an option definition file Analysis using the usage analysis window Notes Date and time Operation when moving to other URL Extension name display Host name/ip address display when DNS conversion is not possible Handling of the URL name to be analyzed Notes on selecting the URL based breakdown from the analysis method box Notes on selecting the URL extension based breakdown from the analysis method box Notes on displaying analysis results of mass log data Chapter 10 Monitoring for Tampering with Web Contents Overview of Monitoring Environment Settings Setting the send environment for tampering detection reports Registering Monitoring Requirements Specifying a content publish location Specifying an execution frequency for tampering inspection Specifying a tampering detection reporting destination Registering Contents Distributing a content publish notifier Notifying content publish (contents administrator job) Part 4 User s Guide Chapter 11 Analyzing Web Site Usage Usage DB Engine Usage DB Registration Engine Outline Start operation Stop operation Start up time URL extensions valid for analysis Space estimation in the Usage DB Usage DB switching Notes on use of Usage DB Registration Engine Usage DB Reference Engine Outline Start operation Usage DB reference port number Stop operation Usage DB backup and restore Backing up the Usage DB viii -
10 Restoring the Usage DB Deleting the Usage DB Analysis Window Outline Start operation Before startup Start Operation Stop operation Configuring the analysis window Analysis window features Analysis window options Traffic display Response analysis page Operation of analysis page Performing data analysis Notes Date and time Operation when moving to other URL Extension name display Host name/ip address display when DNS conversion is not possible Handling of the URL name to be analyzed Notes on selecting the URL based breakdown from the analysis method box Notes on selecting the URL extension based breakdown from the analysis method box Notes on displaying analysis results of mass log data CSV Output Outline Start operation Startup SQC Extended Log Collection Response log Outline Making settings for log collection Stopping log collection Log format Navigation Guide for the Usage Analysis Window Analyzing changes in the number of Web site visitors Analysis using the usage analysis window If you would like to make analysis in page units Analysis using the usage analysis window Analyzing site navigation Analyzing site navigation for an entire Web site Analyzing site navigation for a specific customer Analyzing site navigation for a specific URL Chapter 12 Evaluating the Usage Registered Report Window OutLine Start operation Quit operation Window configuration Registry of report Window OutLine Start operation Quit operation Window configuration Generate of report window OutLine ix -
11 Start operation Quit operation Window configuration History of Reports Window OutLine Start operation Quit operation Window configuration Report paramters Category and Report type Other report parameters Common items Report Object and Select Condition Report contents... 0 Chapter 13 Using the Contents Tampering Monitor Viewing the Environment Settings Window Contents Tampering Monitor window (menu window) Tamper Monitor URL Entry window Tamper Monitor URL Modify window Confirm URL Delete window Environment Properties window Action Statement window Tampering Detection Notice notice Customization If you would like to make tampering inspection with a shorter interval If you would like to make tampering inspection at an optional time... 0 Part 5 References... 0 Chapter 14 Setting the Web Site Management Window Environment Settings Window Management Server Settings window Managed server setting window Managed Server Information window Usage service information window Report Server Settings window Group Settings window Group Information window Notes Deleting unnecessary temporary files... 0 Chapter 15 SQC file types List of SQC file types SQC Definition Files Usage DB Environment Definition File File storage location File internal configuration File internal format (basic) File internal format (analysis target server definition block) File internal format (log definition block to be analyzed) Extended Log Environment Definition File File storage location File internal configuration File internal format (basic) File internal format (extended log definition block) Option Definition File x -
12 File storage location File internal configuration File internal format (analysis definition block for each subnetwork) File internal format (definition block with analysis of a specific subnetwork omitted) File internal format (definition block with analysis of a specific URL omitted) Usage DB Output file Usage DB Output file format Capacity estimation SQC extended log file File name Capacity estimation Switching a SQC extended log file over to another Usage Log file Usage Log file format Capacity estimation Deleting a Usage Log file Report data file Report data file Report data file format Chapter 16 Troubleshooting Usage Analysis Report Display Contents Tampering Monitor Chapter 17 Messages Contents Tampering Monitor messages Contents Tampering Monitor - settings windows Content publish notifier Tampering inspection program Usage Analysis Function Usage DB Registration Engine Usage DB Reference Engine Analysis window CSV output command Common messages Chapter 18 Command Reference Contents Tampering Monitor Contents Tampering Monitor Content publish notifier MpupdtCntnts command location MpupdtCntnts command specifications Content list file format Usage Analysis Function Trend Viewer dbprt Chapter 19 Environment Maintenance Management Server Resources Database Usage DB Managed Server Resources Database Usage DB xi -
13 Part 1 Overview Part 1 gives an overview of the SQC Website Management functionality and the modes in which Systemwalker Service Quality Coordinator Usage Analysis can operate. Chapter 1 Overview...2 Chapter 2 SQC operating configurations
14 Chapter 1 Overview Chapter 1 gives an overview of the Systemwalker Service Quality Coordinator Website Management functionality Overview of Each Function 1.1 Overview of Each Function Trend Viewer Contents Tampering Monitor Trend Viewer The Web Site Trend Viewer is used for analyzing the usage of systems that are comprised of Web servers and proxy servers. On the Web server and Proxy server, access information from the user is accumulated in the log file. From this log file, the Web site Trend Viewer can extract and analyze such details as URL, user (user name, IP address, host name, and ID set in Cookie), and time. This user-access analysis enables timely decision-making on the services constructed on your Internet/ Intranet. Point If, for example, a page on employment information is published using the Internet, you can use the Web site Trend Viewer to readily find out which schools the students referencing the recruit page attend. If a Proxy server is set up to reduce the network load, it is easy to determine whether the Proxy server setting is effective by analyzing the cache hit rate and traffic. The Trend Viewer provides the following functions: - Site access analysis Usage in terms of access to Web sites, such as the extent of access to Web sites, such as which pages are popular, who accesses Web pages and how often, and which links are used. - Site navigation analysis Usage in terms of customer behavior, such as which page the customers view, how long they view each page, and how they navigate through pages. The Web site Trend Viewer edits data on the usage of the Web server and Proxy server and displays it on the Web browser (Web page) in table or graph form. It can be used on any Web browser connected to the Web server and network. Data types and periods can be analyzed from a variety of viewpoints; buttons on the Web page enable you to switch views easily. An advanced-analysis function is also provided so you can carry out analyses focused on specific URLs and clients. The usage of the Web site Trend Viewer is roughly classified into the following two modes: 1. Display trend data by switching the analysis window according to the analysis type. 2. Use the regular report function to report regular analysis results such as daily reports and monthly reports. The Web site Trend Viewer displays the results by switching the analysis window depending on the analysis type. For example, you can use the Trend Viewer to make the following analyses: - 2 -
15 Web server Analysis type to view a usage summary for the entire server Analyzed Data type to be used View a summary of the analysis results. The summary displays the following report data: - Session count (total) - Request count (total) - Traffic (total) - Cache hit count (total) - Error count (total) To find how popular the Web service is To find which page of the Web service is most popular To find the order the Web services pages accessed by the user To find whether any unauthorized access or site link disconnection has occurred View the session report. In the session report, the number of people who visited the site can be checked. Multiple accesses to a page from the same person are counted as one person. View the request report. In the request report, which pages are popular and which types of user view such pages can be checked. View the page navigation report. In the page navigation report, you can see the order in which Web service pages are accessed. View the error report. Errors detected by the server include access by unauthorized persons and missing links when such links are referenced on the site. Checking for the occurrence of such errors can enable uses to find of whether any unauthorized access or site link disconnection has taken place. Contents of errors that have occurred are displayed on the analysis window in the error report. Proxy server Analysis type To view a usage summary for the entire server Analyzed data type to be used View a summary of the analysis results. The summary displays the following report data: - Session count (total) - Request count (total) - Traffic (total) - Cache hit count (total) - Error count (total) To know the validity of the number of sessions To know the validity of URL for caching To know the validity of the caching amount View the session report. You can learn how many users in the Proxy server access external servers at one time View the request report. You can observe which external pages are accessed from within the Proxy server and who accesses most often. View the traffic report. You can observe how much data is received in response to accessing of external servers from within the Proxy server. Based on this result, you - 3 -
16 Analysis type If you want to know caching effects Analyzed data type to be used can decide whether improvement is required if the caching amount on the server is small. View the cache report. You can determine how effectively the cache definition on the server is working. You can examine the hit rate for cache information held by the Proxy server with respect to access to external servers from within the Proxy server or access from outside the Proxy server. You can make more detailed analyses by carrying out the above analyses focusing on the following methods: Analysis method type Client host name Description Analyses are carried out using the host name obtained by converting the client IP address by using DNS as a key. Any IP address that cannot be converted by DNS is displayed as is without conversion. The client here is the following: - In the Web server analysis, any user who accesses the Web service. - In the Proxy server analysis, any user who accesses external servers from within the Proxy server. However, in the case of the Proxy server in reverse operation, the client has the same meaning as that of the Web server. Client IP address Authorization user name User agent Referrer host name Referrer IP address Remote host name Remote IP address URL Entry URL Analyses are made using the client IP address as a key. If the Web server or Proxy server performs authorization, the user name for the authorization is used for analysis. Analyses are made using the browser used by the user to access the Web server or Proxy server as a key. Analyses are made regarding through which links the constructed Web service is reached, using the referrer host name as a key. Analyses are made regarding through which links the constructed Web service is reached, using the referrer IP address as a key. Analyses are made on the Proxy server using the host name of the page accessed from within the Proxy server as a key. In the case of a Proxy server in reverse operation, to which Web server a request was made from outside is analyzed, using the host name as a key. Analyses are made on the Proxy server using the IP address of the page accessed from within the Proxy server as a key. In the case of a Proxy server in reverse operation, to which Web server a request was made from outside is analyzed, using the IP address as a key. Analyses are made using the URL name accessed from the client as a key. Analyses are made using URL as an entry point of the URL accessed from the client as a key
17 Analysis method type Exit URL Referrer URL URL extension Access ID Subnet Description Analyses are made using URL as an exit point of the URL accessed from the client as a key. Analyses are made regarding through which links the constructed Web service is reached, using the referrer URL as a key. Analyses are made regarding which extension is accessed most often, using the extension as a key. Analyses are made using ID set in Cookie as a key. If the user is authenticated by CGI on the Web server, setting ID in Cookie can make analyses in which users are identified. Analyses are made using a subnet, which groups client IP addresses, as a key. See For details on how to specify the analyzed data type and analysis method type, refer to "11.2 Analysis Window". The Trend Viewer can output collected/accumulated information in the CSV file format. By entering this information for such OLAP/mining tool as "SymfoWARE e-business Intelligence Suite", information can be utilized at a higher level; for example, analyses can be executed that combine data on the backbone system, enabling the more effective use of Web sites by your business. The analysis results can also be printed for reference Supported log formats The Web site Trend Viewer supports the following log formats. Other logs can be analyzed if their log formats are defined. For information on how to define log formats, refer to "4.2 Environment Settings for Usage Analysis" (Managed server) and "5.2 Environment Settings for Usage Analysis" (Management server) No Log format Server name 1 W3C (CERN) Common log format W3C httpd (CERN httpd) 2 Apache Common log format Apache Web Server 3 Apache Custom log format Apache Web Server 4 Microsoft IIS log format Microsoft Internet Information Services 5 NCSA Common log format Microsoft Internet Information Services 6 W3C Extended log format Microsoft Internet Information Services 7 Netscape Enterprise Server Common log format 8 Netscape Enterprise Server Flexible log format 9 Netscape Enterprise Server Custom log format Netscape Enterprise Server Netscape Enterprise Server Netscape Enterprise Server - 5 -
18 No Log format Server name 10 Fujitsu InfoProvider Pro Common log format 11 Fujitsu InfoProvider Pro Extended log format 12 Netscape Proxy Server Common log format 13 Netscape Proxy Server Extended log format 14 Netscape Proxy Server Extended2 log format 15 Netscape Proxy Server Flexible log format 16 Netscape Proxy Server Custom log format Fujitsu InfoProvider Pro Fujitsu InfoProvider Pro Netscape Proxy Server Netscape Proxy Server Netscape Proxy Server Netscape Proxy Server Netscape Proxy Server 17 Squid Common log format Squid 18 Squid Native log (version 1.1) format Squid 19 DeleGate Common log format DeleGate 20 DeleGate Custom log format DeleGate 21 DeleGate Default log format DeleGate 22 Fujitsu InfoProxy Common log format 23 Fujitsu InfoProxy Common log format 24 Microsoft Proxy Server Webproxy log format Fujitsu InfoProxy Fujitsu InfoProxy Microsoft Proxy Server 25 SQC Extended log format Systemwalker Service Quality Coordinator Note "SQC Extended log format" in No. 25 is a format of log files accumulated by collecting the SQC extended logs. For more details, refer to "11.4 SQC Extended Log Collection". The Web Site Trend Viewer saves the log with the character code and LF(line feed) code according to the operating OS where it runs. The combinations are as follows: [Windows] Character Code ASCII LF code CR + LF [UNIX] - 6 -

19 Character Code ASCII LF code LF Note Normal operation is not guaranteed if the combination differs the above combinations. Notice should be paid especially when network file on a remote network is involved Functional configuration Web Trend Viewer is composed of the Web service analysis function and the extended log collector. As shown in the following figures, two functional configurations of the Web site Trend Viewer are available; one for analyses made on the Managed Server, and one for analyses made on the Management Server. Carry out analyses on the Management Server in the following types of operation: - The Web site is configured using multiple Web servers and the entire Web site should be analyzed. - Analyses should not be made in the DMZ. - Load on the Web server due to analyses should be avoided. In the following figures, a Web server or Proxy server machine on which SQC-A is installed is called a "Managed Server", a machine on which SQC-M is installed is called a "Management Server", and a person who carries out analyses is called an "analyzer". Analyses made on the Managed Server - 7 -

20 Analyses made on the Management Server See For information on the operational methods to use to make analyses on the Management Server, refer to "Chapter 3 General Procedure for Basic Installation" Usage Analysis Function components Web Site Trend Viewer is used to perform availability analyses of Web services based on logs related to the Web service. Web Site Trend Viewer includes the following features: Usage DB Registration Engine An engine on the Managed Server or Management Server that extracts data from various logs related the Web server and stores it in the database or Usage DB specific to this product. Usage DB Reference Engine An engine on the Managed Server or Management Server that retrieves data from the Usage DB. This engine provides the interface (using HTTP communication) to extract data from the Usage DB in response to a request from the "analysis window". Analysis window A GUI, running in a Web browser on the client machine, used to carry out data analyses and display results. Usage DB data edited in the interface of "Usage DB Reference Engine" is obtained and displayed in graph or table form
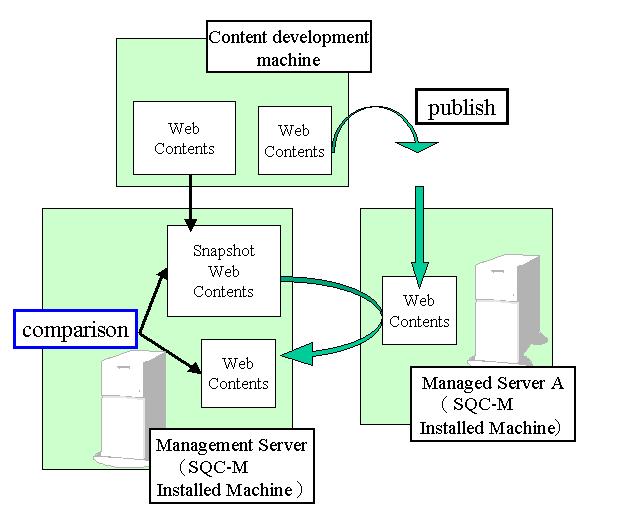
21 Analysis report A function used to display or output analysis results as regular reports. Clicking the "Trend Reporter" button on the "Web Site Management" window on the Management Server and then selecting a Trend Viewer report can use this function. CSV output A command, running on the Managed Server or Management Server, used to output Usage DB data to a file in the CSV format SQC extended log SQC extended log, a specific log adopted by this product, contains data on the response time of the CGI program viewed from the Web browser. Since the SQC extended log is one of a number of logs handled by the "Usage DB registration engine", its data can be referenced by "analysis window" and by "CSV output". SQC extended log can be used, for example, when the search service via the CGI program is provided on the Web page, and the analyst needs to find out how long it takes to return search results to the Web page user. Data collection function A Java TM applet for collecting the SQC extended logs. The applet is set for each Web page for which a SQC extended log is to be collected. Data accumulation function A CGI program for accumulating SQC extended logs. This function is called by using the data collection function to accumulate SQC extended logs Contents Tampering Monitor This section provides an overview of the Contents Tampering Monitor Function overview and features The Contents Tampering Monitor detects tampering with Web content at an early stage and reports it to the system administrator. Early detection minimizes the damage, such as loss of credibility and loss of business opportunities, that can result from security problems on a Web site. - Highly accurate detection of tampering In addition to checking the consistency between published Web content and original content, this function distinguishes between content that has failed publication and content that has been tampered with. - Tamper detection on a remote server Web server load is minimized because only data on public Web content on a remote Web server is collected and checked for tampering. - Tamper monitoring on multiple servers Data on Web content is collected from multiple Web servers and placed on a remote server where it is checked for tampering. - Alert with and system logs (event log and syslog) An alert function is supported so that the system administrator can quickly recognize tampering of open Web contents and take quick action
22 Function configuration The following diagram shows the configuration of the Contents Tampering Monitor. Content Tamper Monitoring system Data on Web content from the Content Tamper Monitoring system on the Managed Server is collected and tampering with Web content is monitored on the Management Server. Content Publish Notifier The Content Publish Notifier is executed on the site where content is created. This registers, on the Managed Server, data regarding the Web content that is to be published
 is installed to manage Managed Servers (Web server and proxy servers) in which an")
23 Chapter 2 SQC operating configurations Chapter 2 gives an overview of configurations for SQC operation Basic Form 2.1 Basic Form Web Site Management Functionality enables the Management Server in which the manager product (SQC-M) is installed to manage Managed Servers (Web server and proxy servers) in which an agent product (SQC-A) is installed. Because the HTTP protocol is used to perform communication between the management and Managed Servers, no special settings are required to perform it in the DMZ environment Locating methods of the analysis data Group Operation Configuration for tampering monitoring Locating methods of the analysis data The Systemwalker Service Quality Coordinator analysis data is located in the following two methods. Managed Server Operation Management Server Operation When analysis data is located on the Managed Server When analysis data of the Managed Server is located on the Management Server When you execute Usage Analysis, select one of operation of the Managed Server or operation of the Management Server. The following explains the operation for each case

24 Operation of the Managed Server The following is the configuration when the Usage Analysis is executed in form of the operation of Managed Server. When the Managed Server is operated, data extracted from log information of Web Server is cumulated on Usage Analysis DB of the Managed Server. The Managed Server is used to analyze usage status. When the Managed Server is accessed from the Web Site Management Window, it is accessed on demand and displayed on the screen Operation of the Management Server The following is the configuration when the Usage Analysis is executed in form of the operation of Management Server

25 When the Management Server is operated, log information of Web server is transferred to the Management Server and data extracted from log information cumulated on the Usage Analysis DB of the Management Server. The Management Server is used to analyze usage status. Use this operation to avoid placing on the Web server loads caused by the analysis Group Operation Systemwalker Service Quality Coordinator groups two or more management targets together to manage them collectively Generally, the following two grouping methods are available. Grouping unit Management method Example Server When two or more physical Managed Servers (Web and Proxy servers) are managed, they are grouped into one. Environment where loads are distributed in logical Server units using the load balancer. Example: Hosting environment where more than one domain is operated on one server Read the following for details Server grouping In virtual host and hosting environment, more than 1 domain can be managed by grouping them into a group. By registering the servers in domain unit and defining the group, Systemwalker Service Quality Coordinator enables this feather

26 See For details on grouping servers together, refer to " Group Settings window" and "7.3 Registering a Group" Configuration for tampering monitoring The following shows the system configuration when tampering monitoring operation is performed
27 - 15 -
28 Part 2 Installation (Basic) Part II provides examples of specific systems to explain the installation procedures used when the basic operation is performed. Chapter 3 General Procedure for Basic Installation...17 Chapter 4 Environment Settings for the Managed Server...22 Chapter 5 Environment Settings for the Management Server...33 Chapter 6 Environment Settings for the Report Server...45 Chapter 7 Configuring the Operating Environment...47 Chapter 8 Checking Operation
29 Chapter 3 General Procedure for Basic Installation From Chapter 3 to Chapter 7, specific system examples are provided to explain the method of environment settings for the Systemwalker Quality Coordinator Web Site Management Functionality System Configuration Environment Settings procedures Estimating Resources 3.1 System Configuration Part 2 explains the procedure for the Web Site Management Functionality operation assuming that it is operated on the following system for the F*Garden flower arrangement site. At the F*Garden flower arrangement site, loads are distributed over two Web servers, HostA1 and HostA2. HostA1 and HostA2 are operating article search page, purchase/payment CGI, and the server for usage analysis. The following lists management server and managed server environments. Management server Item Host name Manager IP address Platform Web Site Management window URL Windows2000 Server Assumed contents Managed server
30 Item Host name HostA1 IP address SQC-A URL Platform Solaris 7 Web server Article search page URL Purchase/payment CGI URL Apache Assumed contents Managed server 2 Item Host name HostA2 IP address SQC-A URL Platform Solaris 7 Web server Article search page URL Purchase/payment CGI URL apache Assumed contents The settings for managing this site in management server operation are explained from Chapter 3 to Chapter 7. Point By grouping the load-distributing servers, the entire servers can be managed as a whole. 3.2 Environment Settings procedures Environment settings are made in the sequence, managed server, management server, and report server. The following lists the setting sequences, explanation locations in the online manual, and setting points. Item No Explanation location in online manual 1 Chapter 4 Environment Settings for the Managed Server Setting point The following settings need to be consistent: - Web server settings - Usage DB environment definition files
31 Item No Explanation location in online manual Point Setting point Here, settings need to be made for HostA1 and HostA2. Explanation is given with HostA1 used as an example. Replace the host name and IP address with the actual ones of your Web server. 2 Chapter 5 Environment Settings for the Management Server The following settings need to be consistent: - Settings for managed server usage analysis - Settings for management server usage analysis Note In case of cluster operation, apply the settings on the node where management business is in operating. In case of double-operation of Manager, apply the settings for each server. 3 Chapter 6 Environment Settings for the Report Server Settings for virtual directory properties. When all settings from Item No. 1 to No. 3 are finished, check the following points to see whether the settings are made correctly. Item No Check point Viewpoint 1 Web server settings are completed. 2 Environment settings for usage analysis are completed on the management and managed servers. 3 Management server settings are completed. 4 Report server settings are completed. - Make a check, paying attention to the following points: Check if the DB environment definition file for usage of the managed and the management servers are specified for management server operation setting. Check the environment settings related to the managed server. Check that the property settings for a virtual directory are correct. Note - Execution environment and execution permission for Java TM applets is required. For systems where Java VM is not included, (Windows 2003, etc), Java VM should be installed. - If the level of Microsoft(R) Win32 Virtual Machine for Java TM (called JavaVM in this document) used on Microsoft(R) Internet Explorer is not or later, the analysis window may not be displayed normally
32 If the analysis window is not displayed normally and the JavaVM level satisfies this condition, obtain the update patch from the Microsoft site and apply it. The JavaVM level can be checked using one of the following methods: - If the use of the Java console is enabled, select Java Console from the View menu. The JavaVM level is displayed in the first line of the Java console. - Retrieve msjava.dll from the directory of the system and open the properties. The JavaVM level is displayed in the Version field. - If Java TM Plug-in is enabled, the analysis window is not normally displayed under the following conditions: - The Proxy server and Proxy exceptions are set on the Web browser, and - The Proxy server is set so that the Web browser settings are used in Java TM Plug-in, and - The machine on which this product is installed corresponds to the Proxy exception. 3.3 Estimating Resources This section explains resources required for operating the Web Site Management Functionality Management Server Managed Server Management Server This section explains resources required for operating the Web Site Management Functionality in management server operation Usage Analysis Space estimation in the Usage DB In management server operation, space in the Usage DB on the management server is the summary of the space in the Usage DB's for all the managed servers. See For the detailed information on the space in one usage DB, refer to " Space estimation in the Usage DB" Space estimation of the CSV format log file This section includes an example of space estimation under the conditions shown below. When you estimate, you should use the actual period of the CSV format log file and other actual conditions. Conditions Data type Size per line Access count Visit information About 250 bytes (may change depending on the length of the client host name and URL) About 10,000/day
33 Approximate maximum size per day About 250 bytes * about 10,000 = About 2.5 MB (/day) Space estimation of SQC extended log The formula for estimating the space per day is as follows. Characters shown in blue indicate variables. (Space per day) = (50 + A + B) * C Symbol A B C Meaning Average number of bytes of the client field Average number of bytes of the document field Average access count to the document per day Tamper Monitor The product stores setting information and notice data used for the tamper monitor function in the following locations. [Windows] Under <Installation directory (variable)>\etc\seq\dat [UNIX] Under /etc/opt/fjsvssqc/seq/dat The following table lists the formulas for estimating capacity. The value obtained by each following formula is the maximum value of capacity required. Information type Setting information Notice data Formula 5.3 KB * number of registered URLs 1.2 KB * number of notified URLs Managed Server This section explains resources required for operating the Web Site Management Functionality in managed server operation Trend Viewer Refer to " Usage Analysis"
34 Chapter 4 Environment Settings for the Managed Server Point The following provides a point on this chapter: - The log settings for the usage DB environment definition file must be the same as those for the Web server. Chapter 4 explains how to set the environment for the managed server. Do the settings for every server. Use the following procedure to set the environment for the managed server. Item No Reference Settings for Web Server Environment Settings for Usage Analysis Settings for service start 4.1 Settings for Web Server To communicate with the Management Server, a virtual directory must be registered with the Web server. This subsection explains the registration procedures, using the following Web servers as examples: Microsoft Internet Information Services Apache HTTP Server Netscape Enterprise Server InfoProvider Pro (packaged with Interstage Application Server) Point If the Web server is Microsoft(R) Internet Information Services 5.0, normally, the WEB server is set automatically during installation Microsoft Internet Information Services 5.0 [Windows] 1. Start the Internet Service Manager from the Windows' Start menu. [Start] -> [Programs] -> [Control Tools] -> [Microsoft Internet Information Server] -> [Internet Service Manager]
35 Note If your environment is different from the above, change it so that it matches. 2. Create a virtual directory. Right-click the Web site to which a virtual directory is to be added, and from the shortcut menu select New -> [Virtual directory]. The wizard for creating a new virtual directory is started. Make the following settings: Alias: SQC Physical path: Installation directory\www Access right: Read access is permitted 3. Set the execution right of the CGI program to the directory cgi-bin under the created virtual directory. Right-click the directory cgi-bin, and from the shortcut menu select [Properties]. The Properties window is displayed. Make the following setting in [Application settings] Access right: Execution (including the scripts) Apache HTTP Server [Windows] 1. Open the configuration file. For example, in the standard Apache installation. [Start] -> [Programs] -> [Apache HTTP Server] -> [Configure Apache Server] -> [Edit the Apache httpd.conf Configuration File] Note If your environment is different from the above, change it so that it matches. 2. Set a virtual directory. Add the following lines to the end of the file: # Systemwalker Service Quality Coordinator Agent ScriptAlias /SQC/cgi-bin/ "C:/Program Files/SystemwalkerSQC/www/cgi-bin/" <Directory "C:/Program Files/SystemwalkerSQC/www/cgi-bin"> Options ExecCGI AllowOverride None Order allow,deny Allow from all </Directory> Alias /SQC/ "C:/Program Files/SystemwalkerSQC/www/"
36 <Directory "C:/Program Files/SystemwalkerSQC/www"> Options None AllowOverride None Order allow,deny Allow from all </Directory> Note The above has three references to C:/Program Files/SystemwalkerSQC. This is the default installation directory for this product. If your installation directory is different, change the references to match your installation directory. Also, change such settings as the access rights, as required. See Setup of virtual directory depends on versions of Apache. For details, please refer to the manual of Apache. 3. Make settings so that a file with the extension cgi is started as a CGI program. If the following line in the file is marked as a comment, remove the comment mark. AddHandler cgi-script.cgi 4. Apply the new settings. Close the editor after updating the entries. If Apache HTTP Server is active, stop the server and then restart it. [UNIX] 1. Open the configuration file using a text editor. 2. Set a virtual directory. Add the following lines to the end of the file: # Systemwalker Service Quality Coordinator ScriptAlias /SQC/cgi-bin/ "/opt/fjsvssqc/www/cgi-bin/" <Directory "/opt/fjsvssqc/www/cgi-bin"> Options ExecCGI AllowOverride None Order allow,deny Allow from all </Directory> Alias /SQC/ "/opt/fjsvssqc/www/" <Directory "/opt/fjsvssqc/www"> Options None AllowOverride None Order allow,deny Allow from all </Directory>
37 Note Change such settings as the access rights as required. See Virtual directory settings depend on the Apache version. Refer to the Apache manuals for details. 3. Make settings so that a file with the extension cgi is started as a CGI program. If the following line in the file is marked as a comment, remove the comment mark. AddHandler cgi-script.cgi 4. Apply the new settings. Close the editor after updating the entries. If Apache HTTP Server is active, stop the server and then restart it Netscape Enterprise Server 3.0 [Windows] 1. Start the Netscape(R) Enterprise Server 3.0 from the Windows' Start menu. For example, in the standard Netscape Server installation: [Start] -> [Programs] -> [Netscape SuiteSpot] -> [Administration] Note If your environment is different from the above, change it so that it matches. 2. Select the server to which a virtual directory is to be added and display the server manager page. Create a virtual directory. Click the [Content Management] button and then click [Additional Document Directories] in the list on the left. The [Additional Document Directories] page is displayed. Make the settings shown below: URL Prefix: SQC Map To Directory: Installation directory\www Click OK. The [Save and Apply Changes] page is displayed. Click the [Save and Apply] button. 3. Set the execution rights of the CGI program to the directory cgi-bin under the created virtual directory. Click the [Programs] button and then click [CGI Directory] in the list on the left. The [CGI Directory] page is displayed. Make the settings shown below:
38 URL Prefix : SQC/cgi-bin CGI Directory: Installation directory\www\cgi-bin Click [OK]. The [Save and Apply Changes] page is displayed. Click the [Save and Apply] button InfoProvider Pro (packaged with Interstage Application Server) [Windows] 1. Open the environment definition file of InfoProvider Pro using a text editor. 2. Set a virtual directory. Add the following lines to the end of the file: # Systemwalker Service Quality Coordinator Agent V12.0L10 cgi-path-idnt: C:\PROGRA~1\SYSTEM~1\www\cgi-bin SQC/cgi-bin link: SQC C:\PROGRA~1\SYSTEM~1\www Point The above has a reference to C:\PROGRA~1\SYSTEM~1 (8.3format) is the default installation setting. If your installation setting is different, change the references to match. 3. Apply the new settings. Close the editor after updating the entries. If InfoProvidor Pro is active, close it down and then restart it. Note If your InfoProvider Pro is older than the one bundled in Interstage Standard Edition V2.0L20, the above settings are not possible due to functional restrictions. Instead, make the settings shown below: 1. Create a virtual directory equivalent to the above one. Create a new directory SQC under the top directory published by the Web server, and then copy to this new directory all files under the directory www under the installation directory of this product, excluding cgi-bin. Open viewer.html at the copy destination using a text editor and then add the <PARAM> tag between the <APPLET> tags as shown below: <APPLET codebase="./classes/" archive="viewer.jar" code="viewer.class" width=950 height=512> <PARAM name= CGI value= </APPLET> Note Replace the term xxx.yyy.com above with the actual host address of your Web server. 2. Open the environment definition file of InfoProvider Pro using a text editor and add the following lines to the end of the file: # Systemwalker Service Quality Coordinator Agent cgi-path-idnt: C:\PROGRA~1\SYSTEM~1\www\cgi-bin SQC-cgi-bin
39 Note The above has a reference to C:\PROGRA~1\SYSTEM~1 (8.3 format), which is the default installation setting. If your installation setting is different, change the references to match. 3. Apply the new settings. Close the editor after updating the entries. If InfoProvidor Pro is active, close it down and then restart it [Solaris] 1. Open the environment definition file of InfoProvider Pro using a text editor. 2. Set a virtual directory. Add the following lines to the end of the file: # Systemwalker Service Quality Coordinator Agent cgi-path-idnt: /opt/fjsvssqc/www/cgi-bin SQC/cgi-bin link: SQC /opt/fjsvssqc/www/cgi-bin 3. Apply the settings. Close the editor after updating the entries. If InfoProvider Pro is active, close it down and then restart it. Note If your InfoProvider Pro is older than the one bundled in INTERSTAGE Standard Edition 3.0, the above settings are not possible due to functional restrictions. Instead, make the settings shown below: 1. Create a virtual directory equivalent to the above one. Create a new directory SQC under the top directory published by the Web server, and then copy to this new directory all files under the directory www under the installation directory of this product, excluding cgi-bin. Open viewer.html at the copy destination using an editor and then add the <PARAM> tag between the <APPLET> tags as shown below: <APPLET codebase="./classes/" archive="viewer.jar" code="viewer.class" width=950 height=512> <PARAM name= CGI value= </APPLET> Note Replace the term xxx.yyy.com above with the actual host address of your Web server. 2. Open the environment definition file of InfoProvider Pro using a text editor and then add the following lines to the end of the file: # Systemwalker Service Quality Coordinator Agent 12.0 cgi-path-idnt: /opt/fjsvssqc/www/cgi-bin SQC-cgi-bin 3. Apply the new settings. Close the editor after updating the entries. If InfoProvider Pro is active, close it down and then restart it
40 4.2 Environment Settings for Usage Analysis The following settings need to be made on the managed server to make usage analysis: 1. Log setting of Web server 2. Settings for usage DB environment definition file The following explains how to make these settings: Defining httpd.conf Defining the usage DB environment definition file Enhancing public Web server security Defining httpd.conf The following shows httpd.conf file settings when the managed server is Apache HTTP Server. Example The following shows an example of definition. CustomLog /usr/local/apache/logs/access_log common Point If the CustomLog specification in httpd.conf is changed, the log for Web servers needs to be re-created. The following provides the procedure for re-creating the log for Web servers. 1. Shutdown the Web server. # /usr/local/apache/bin/apachectl stop 2. Save the log for the Web server before the log format is changed. # mv /usr/local/apache/logs/access_log /tmp/access_log.back 3. Start up the Web server. # /usr/local/apache/bin/apachectl start Note When the Web server is other than Apache HTTP Server, set the log format to the purpose, refer to " File internal format (log definition block to be analyzed)". When the Web server is IIS, not all required tokens are logged out by the default setting. Changed the default setting to make IIS log out all required tokens specified in " File internal format (log definition block to be analyzed)"
41 4.2.2 Defining the usage DB environment definition file Use the following sample files to create and store usage DB environment definition files. [UNIX] When you set the environment in "3.1 System Configuration", refer to the following table. Sample file File Storage destination of usage DB environment definition file Path /opt/fjsvssqc/sample/databaseconfig /etc/opt/fjsvssqc/databaseconfig [Windows] When the managed server is Window, refer to the following table. Sample file File Storage destination of usage DB environment definition file Path <installation directory>\databaseconfig <installation directory(variable)>\\control \DatabaseConfig The following gives a definition example of the usage DB environment definition file. Example: The definition example is shown below. [Server] Symbol = HostA1 Name = HostA1 Type = web Domain = xxx.yyy.com DatabaseInterval = week(sun) SearchDNS = yes RequestURLSuffix = html,htm,shtml,shtm,stm,cgi,asp,pl,tcl,sh DatabaseMode = both [Log] Symbol = HostA1 Name = HostA1 Path = /usr/local/apache/logs/access_log Format = Common Region = Note Note the following settings
42 Setting item Name Format Domain Remarks Use Name under [Server] to specify the name of the analysis target server that is defined in the environment setting window for the managed server. Accord to the log format of the Web server. When the Web server is Apache HTTP Server, accord to the log format specified in httpd.conf CustomLog. Defines the domain name of the analysis target server. For details, refer to " File internal format (analysis target server definition block)". See See " Usage DB Environment Definition File" in the online manual for details on setting the usage DB definition file. Point After the settings above have been made, check that the usage DB registration engine starts. [UNIX] Use the following procedure to check whether the settings have been made correctly: 1. Execute the command. /opt/fjsvssqc/bin/dbregmng 2. Check the log. Check the output message of the following log file. /var/opt/fjsvssqc/log/dbreg.log If the following message is displayed after the command is executed, the usage DB has been created correctly. dd/mmm/yyyy:hh:mm:ss dbreg[22262] DBReg_Main: i "[server=hosta1][log=hosta1]database register engine started" dd/mmm/yyyy:hh:mm:ss dbreg[22262] DBReg_Main: i "[server=hosta1][log=hosta1]database register engine stopped." Check that: - A pair of messages shown above is displayed. - No error message is displayed between the first and second messages. See If the usage DB is not correctly created, see this section and " Start operation" to review the settings
43 [Windows] In case of Windows, check as follows: 1. Execute the command. 1. <installation directory>\bin\dbregmng.exe 2. Check the log. Check the output message of the following log file. 1. <installation directory(variable)>\log\dbreg.log If the following message is displayed after the command is executed, the usage DB has been created correctly. dd/mmm/yyyy:hh:mm:ss dbreg[22262] DBReg_Main: i "[server=hosta1][log=hosta1]database register engine started" dd/mmm/yyyy:hh:mm:ss dbreg[22262] DBReg_Main: i "[server=hosta1][log=hosta1]database registration engine stopped." Check that: - A pair of messages shown above is displayed. - No error message is displayed between the first and second messages. See If the usage DB is not correctly created, see this section and " Start operation", to review the settings Enhancing public Web server security [Windows] If this product is installed on an Internet public Web server or Proxy server, you can enhance security by changing the access authority to the installed resources. Follow the procedure below. Note Using the following command can change the access authority. However, this command is valid only for NTFS. Access authority to directories/files Change the access authority by using the sqcsetfilesec.exe command. <Installation directory>\bin\sqcsetfilesec.exe <installation directory (variable)> By executing the above command, the access authority to the installed resources is changed as follows: Administrators: Full control Everyone: Read/execute authorities only
44 SQC extended log If the access authority is changed by the method, no SQC extended log can be collected. If the SQC extended log needs to be collected, restore the access authority to the state when installed by following the method below. (However, security risks will be greater.) <installation directory>\bin\sqcsetfilesec.exe -u <installation directory(variable)>\extend-log <installation directory>\bin\sqcsetfilesec.exe -u <installation directory(variable)>\log [UNIX] Access authority to directories and files The access authorities for the installed resources are set during installation as shown below: Super user: Read/Write/Execute authorities Others: Read/Execute authorities only SQC extended log After the installation, the SQC extended log cannot be collected. If the SQC extended log needs to be collected, log in as a super user and then change the access authority by following the method below. (However, security risks will become greater.) # chmod 777 /var/opt/fjsvssqc/extend-log # chmod 777 /var/opt/fjsvssqc/log 4.3 Settings for service start For the service start, refer to " Start operation"
45 Chapter 5 Environment Settings for the Management Server Point The points of this chapter are as follows: - Make consistent settings for usage analysis between the management server and Managed Servers. - Make the following settings consistent between the setting window on the Managed Server and use trend database environment definition file: - "Agent URL" in the setting window on the Managed Server - "Name" of definition block for the server to be analyzed in DatabaseConfig The management server environment is set up according to the following procedure: No. Reference Settings for Web Server Environment Settings for Usage Analysis Registering System Configuration Settings for Service Start 5.1 Settings for Web Server On the Management Server, a virtual directory for the Web server of the installation must be set. A virtual directory is set so that the Web Site Management Window can be displayed from the Web browser. The following explains how to set the virtual directories Windows UNIX Windows [Windows] For Windows, virtual directories must be set. Also set up basic authentication for the environment setup window if access to the environment setup window must be restricted Setting virtual directories Virtual directory is not set automatically when the Management Server is installed. If necessary, execute the following IIS command to build an environment
46 Before performing this procedure The WWW service (World Wide Web Publishing Service) must be running before the following setup command is executed. Also check that a site designated as "Existing Web site" exists. Note The commands referred to below may generate an error if any of the following conditions exist: - IIS is not installed - Windows Scripting Host is not assigned (Microsoft(R) Internet Information Services 5.0, 5.1 or 6.0) - The command line management tool (appcmd.exe) is not installed (Microsoft(R) Internet Information Services 7.0/7.5) - The setup procedure has already been performed Command to execute Run the following command to set up the virtual directory: <Installation directory>\bin\sqcsetiisreg.exe -m For Microsoft(R) Internet Information Services(IIS)6.0 When using Microsoft(R) Internet Information Services 6.0, run the command shown below after sqcsetiisreg.exe. IIS 6.0 is bundled as a standard feature with Windows Server Note Switch the current directory to <installation directory>\bin before running the following command: Installation directory\bin\sqcmsetc.bat For Microsoft(R) Internet Information Services(IIS)7.0/7.5 When using Microsoft(R) Internet Information Services 7.0/7.5, run the command shown below after sqcsetiisreg.exe. Note Switch the current directory to <installation directory>\bin before running the command. Note that in Windows Vista(R) and Microsoft(R) Windows Server(R) 2008, this command must be executed using administrator privileges. To do so, select [Programs] and then [Accessories] from the [Start] menu and then right-click on [Command Prompt] and select [Run as Administrator] from the pop-up menu that appears. Enter the following command in the [Command Prompt] window that appears. Installation directory\bin\sqcmsetc_iis7.bat
47 This creates the following virtual directories in Microsoft Internet Information Services. Service Setting item Settings WWW service Alias SQC Directory Access right <Installation directory>\www Example) C:\Program Files\SystemwalkerSQC\www Reading Execution (including scripts) Make the above settings also when virtual directories are set manually. See For details on how to set the virtual directory, refer to the online documentation for Microsoft(R) Internet Information Services Handler mapping settings Handler mapping settings are required when using Microsoft(R) Internet Information Services 7.0/7.5. Before performing this procedure In order to set up handler mapping, it is necessary for [CGI] to be enabled in the [Application Development Function] of the [World Wide Web Service] component of the Internet Information Services. Before performing this procedure, check the status of the [CGI] setting and enable it if is not enabled. Procedure 1. Select the virtual directory name "SQC" in the Microsoft(R) Internet Information Services setup window. 2. Double click [Handler Mapping] in the function view on the right. 3. [Add Module Map] from the operation menu on the right. 4. Specify the following information in the [Add Module Map] dialog box and click the [OK] button: - Request path: *.cgi - Module: CgiModule - Name: CGI-.cgi Setting virtual directories property Procedure For Microsoft(R) Internet Information Services(IIS)5.0,5.1 or 6.0 In Microsoft(R) Internet Information Services 5.0, 5.1 and 6.0, the setup procedure is as follows:
48 1. Select the virtual directory name "SQC" in the Microsoft(R) Internet Information Services setup window. 2. Click the [Directory Security] tab in the [Properties] window of the above virtual directory. 3. Set an account that has administrator privileges (the account used when installing the Operation Management Client) as the account that will be used for anonymous access. 4. Clear the [Basic authentication] check box if authenticated access is to be used. For Microsoft(R) Internet Information Services(IIS)7.0/7.5 In Microsoft(R) Internet Information Services 7.0/7.5, the setup procedure is as follows: 1. Select the virtual directory name "SQC" in the Microsoft(R) Internet Information Services setup window. 2. Double click [Authentication] in the function view. 3. Check that [Anonymous Authentication] is enabled, then click [Anonymous Authentication] and select [Edit] from the operation menu on the right. 4. When the [Edit Anonymous Authentication Credentials] dialog box appears, select [Specific user] and click the [Set] button. 5. Specify the user name and password of a user with administrator privileges in the [Set Credentials] dialog box. After the above settings are made, the Web Site Management Window can be displayed by specifying the following URL on the Web browser: If the management server is Windows: management server's host name/sqc/default.htm Setting of basic attestation Procedure 1. Register a user account with Windows Register a user account for accessing the Management Console startup HTML or the user startup HTML. - The user who will access the Management Console can use the account with administrator privileges that is normally used or create a new account. - There are no special restrictions on the account type (access rights) that is created when creating a new account to access the Management Console or when creating an account to access the user startup HTML, as long as the account is able to grant read permissions to the file specified in set in Step 2 "Set file access control" below. Register users via [Users and Passwords] (in Windows(R) 2000 Professional) or [User Accounts] (in Windows(R) XP Professional) in the Control Panel. The registration procedure is explained in the Windows help file. 2. Set file access control In Windows(R) XP Professional, open an instance of Windows Explorer and select [Folder Options] from the [Tools] menu, then click the [View] tab and clear the [Use simple file sharing] check box in the [Advanced settings:] pane
49 Note Because this will disable simple file sharing, which is enabled by default in Windows(R) XP, examine the Windows(R) XP help file thoroughly to ensure that this will not have any adverse effect on the operation of the system. [Reference: Extract from folder option help] "Simplified sharing lets you share folders with everyone on your workgroup or network and make folders in your user profile private." 1. Use Explorer to open the following folder: <Manager installation folder>\www 2. Right-click "EnvSetting_jp.html" and "EnvSetting_en.html" and then select [Properties] from the pop-up menu to open the [Properties] window. 3. Click the [Security] tab and register a user who will be allowed access in the [Group or user names] pane. When doing so, remove any users who are currently registered but who should not be granted access. 4. Grant at least read permissions (access rights) to the users who will be permitted access. 5. Click the [OK] button to apply the settings. 3. File security settings in IIS The following procedure is used to specify file security settings in IIS: 1. Select the virtual directory name "SQC" in the Microsoft(R) Internet Information Services setup window. 2. Select "EnvSetting_jp.html" and "EnvSetting_en.html" in the window on the right, click the right mouse button, and then select [Properties] from the pop-up menu to open the [Properties] window. 3. Click the [File Security] tab and then click the [Edit] button for [Anonymous Access and Authentication Control]. 4. Clear the [Anonymous access] check box and select the [Basic authentication] check box in the [Authenticated Access] field. If any check boxes relating to other authentication methods are selected, clear them. 5. Click the [OK] button to apply the definition. The above settings will cause an authentication window to appear when the environment setup window is displayed UNIX This subsection explains the setting procedure using, as an example, the following Web server configuration: - Apache HTTP Server Sun WebServer - InfoProvider Pro (bundled in Interstage Application Server V3.0) [Solaris/Linux] Apache HTTP Server 1. Open httpd.conf using an editor. httpd.conf is located at the following: - Apache supplied as standard with Solaris: Under /etc/apache
50 - Apache supplied as standard with Linux: Under /etc/httpd/conf - Apache other than the above: Under /usr/local/apache/conf 2. Set the virtual directory. Add the following record to the end of the file: # Systemwalker Service Quality Coordinator # Alias /SQC/cgi-bin/ "/opt/fjsvssqc/www/cgi-bin/" <Directory "/opt/fjsvssqc/www/cgi-bin"> Options ExecCGI AllowOverride None Order allow,deny Allow from all </Directory> # Alias /SQC/ "/opt/fjsvssqc/www/" <Directory "/opt/fjsvssqc/www"> Options None AllowOverride None Order allow,deny Allow from all </Directory> 3. Make settings so a file with extension cgi is started as a CGI program. If the following line in the file is marked as a comment, remove the comment mark. AddHandler cgi-script.cgi 4. There is a possibility of causing the garble in the state of the first stage of Apache2.0. Please set it in the following if necessary. 5. Save the file and then close the editor. 6. If apache HTTP Server is active, stop the server and then restart it. After the above settings are made, the Web Site Management Window can be displayed by specifying the following URL on the Web browser: When the management server is Solaris, Linux:
51 [Solaris] Sun WebServer 1. Open httpd.conf using the editor. You can find httpd.conf at the following location: - Under /etc/http/ 2. Set a virtual directory: Add a virtual directory to the following section in the file: [Correction section] server { } or url virtual server URL{ } server{} : Set for all servers by default. You can make this setting if you do not perform virtual server operation. url{} : Set for specific virtual servers only. If you operate Systemwalker Service Quality Coordinator on a virtual server, set for the applicable section of the virtual server to be operated. [Setting Record] cgi_enable "yes" map /SQC/ /opt/fjsvssqc/www/ map /SQC/cgi-bin/ /opt/fjsvssqc/www/cgi-bin/ cgi cgi_enable: If the record already exists, rewrites the value only without adding the record. map: Add "cgi" to the end so that the extension cgi can be recognized as a CGI program. 3. Save the file and then close the editor. 4. If Sun Web Server is active, stop the server and then restart it. After the above settings are made, the Web Site Management Window can be displayed by specifying the following URL on the Web browser: If management server is Solaris: /index.html [Solaris] InfoProvider Pro 1. Open HTTPD.conf using the editor. You can find HTTPD.conf at the following location: - Under /etc/opt/fsunprovd/ 2. Set a virtual directory. Add the following record to the end of the file
52 # Systemwalker Service Quality Coordinator cgi-path-idnt: /opt/fjsvssqc/www/cgi-bin SQC-A/cgi-bin link: /opt/fjsvssqc/www 3. Save the file and then close the editor. 4. If InfoProvider Pro is running, stop the server and then restart it. Note If your InfoProvider Pro is older than the one bundled in INTERSTAGE Standard Edition V2.0L20, then functional restrictions prevent the above settings. Instead, use the symbolic link function of the UNIX file system as shown below: 1. Open HTTP.conf from the editor: You can find httpd.conf at the following location: - Under /etc/opt/fsunprovd/ 2. Set the directory in which the CGI application is stored. Add the following record to the end of the file. # Systemwalker Service Quality Coordinator cgi-path-idnt: /opt/fjsvssqc/www/cgi-bin SQC/cgi-bin 3. Check the public directory defined by "acstop". 4. Save the file and then close the editor. 5. Execute the following command: cd public directory defined by "acstop" ln -s /opt/fjsvssqc/www SQC 6. If InfoProvider Pro is active, stop the server and then restart it. After the above settings are made, the Web Site Management Window can be displayed by specifying the following URL on the Web browser: If management server is Solaris: server's host name/index.html 5.2 Environment Settings for Usage Analysis Use the following sample file to create a use trend database environment definition file and store it in the file show below:
53 [Windows] When you set the environment according to "3.1 System Configuration", refer to this table. Sample file File Storage destination of use trend database environment definition file Path <Installation directory>\sample \DatabaseConfig <Installation directory (variable)>\control \DatabaseConfig [UNIX] Sample file File Storage destination of use trend database environment definition file Path /opt/fjsvssqc/sample/databaseconfig /etc/opt/fjsvssqc/databaseconfig An example of the use trend database environment definition file is shown below. Example A sample definition is shown below: [Server] Symbol = HostA1 Name = HostA1 Type = web Domain = xxx.yyy.com DatabaseInterval = week(sun) SearchDNS = yes RequestURLSuffix = html,htm,shtml,shtm,stm,cgi,asp,pl,tcl,sh DatabaseMode = db [Log] Symbol = HostA1 Name = HostA1 Path = "C:\SystemwalkerSQC\database\csv\HostA1\*.csv" Format = SQC-CSV Region = [Server] Symbol = HostA2 Name = HostA2 Type = web Domain = xxx.yyy.com DatabaseInterval = week(sun)
54 SearchDNS = yes RequestURLSuffix = html,htm,shtml,shtm,stm,cgi,asp,pl,tcl,sh DatabaseMode = db [Log] Symbol = HostA2 Name = HostA2 Path = "C:\SystemwalkerSQC\database\csv\HostA2\*.csv" Format = SQC-CSV Region = Note Note the following settings: Name Path Format Region For "Name" under [Server], specify the name of the server to be analyzed defined in the Managed Server setting window for environment settings. <Installation directory (variable)>\database\csv\<server>\db*.csv Accord the format to the log format specified by CustomLog of Httpd.conf. When you operate the Management Server, specify "SQC-CSV" Here, specify the region of time by the time difference from GMT (Greenwich Mean Time). When you operate the Management Server: Specify "+0000" as the Region definition of the Management Server side. Specify "+0900" as the Region definition of the Managed Server side. Note However, in case of IIS5.0 or more, specify "+0000" as the Region definition of the Managed Server side. See For detail of the setting of a use trend database environment definition file, refer to " File internal format (log definition block to be analyzed)". Point After the above settings are finished, check whether the settings are correct according to the following procedure:
55 Note In order to check the settings, the system configuration must be registered. For details on registering system configuration, refer to "5.3 Registering System Configuration". [Windows] 1. Check that the use trend database registration engine starts normally. 2. Enter the command Enter the following command: <Installation directory>\bin\dbregmng.exe 3. Check the log file Check the output messages in the following log file: <Installation directory (variable)>\log\dbreg.log If the following messages are output as the result of the command, the use trend database was created normally. dd/mmm/yyyy:hh:mm:ss dbreg[22262] DBReg_Main: i "[server=hosta1][log=hosta1]the database registration engine started." dd/mmm/yyyy:hh:mm:ss dbreg[22262] DBReg_Main: i "[server=hosta1][log=hosta1] The database registration engine ended." Check that no error messages are output between the above 2 messages. See If the use trend database was not normally created, check the settings while referring to "Chapter 4 Environment Settings for the Managed Server" in the online manual. [UNIX] When the Managed Server is Solaris, check whether the setting is proper or not according to the following procedure. 1. Enter the command /opt/fjsvssqc/bin/dbregmng 2. Check the log Check the following log file output message. /var/opt/fjsvssqc/log/dbreg.log If the following messages are output as the result of the command, the use trend database was created normally. dd/mmm/yyyy:hh:mm:ss dbreg[22262] DBReg_Main: i "[server=hosta1][log=hosta1]the database registration engine started."
56 dd/mmm/yyyy:hh:mm:ss dbreg[22262] DBReg_Main: i "[server=hosta1][log=hosta1]the database registration engine ended." Check from the following points of view: - Above messages were outputted in pairs. - No error message was output between the first message and the second message. See If the use trend database was not normally created, check the settings while referring to "Chapter 4 Environment Settings for the Managed Server". 5.3 Registering System Configuration For information on registering system configuration, refer to "Chapter 7 Configuring the Operating Environment". 5.4 Settings for Service Start For information on service start, refer to " Start operation"
57 Chapter 6 Environment Settings for the Report Server The report server environment is set up according to the following procedure: Note Web Site Management Functionality uses the Operation Management Client as report server. Web Site Management Functionality uses the Operation Management Client as report server. No. Reference Setting a virtual directory Setting a virtual directory property 6.1 Setting a virtual directory Commonly, the virtual directory is automatically set during the installation of the report server. If the report server is installed into an environment where Microsoft Internet Information Services is not installed, you should install the Microsoft Internet Information Services, and then run the following IIS setting command to build the environment. <installation directory of the Operation Management Client>\bin\sqcSetIISreg.exe -c Note Before performing installation or executing the IIS setting command, the WWW service (World Wide Web Publishing Service) must be started. If the version of Microsoft(R) Internet Information Services is 5.0 or 6.0, check whether a site set as "defined Web site" exists. This creates the following virtual directories in Microsoft Internet Information Services. Service Setting item Settings WWW service Alias Directory Access right SSQC <Installation directory of operation management client> \www Example) C:\Program Files\SystemwalkerSQC-C\www Read Execution (including scripts) Make the above settings also when a virtual directory is set manually. See For details on how to set the virtual directory, refer to the online documentation for the Microsoft Internet Information Services
58 6.2 Setting a virtual directory property It is necessary to set up the property of a virtual directory manually. Set an account with the Administrator authority to be used for anonymous access. Please make the following settings: 1. Select the virtual directory name SSQC from the setting window of Microsoft(R) Internet Information Services. 2. Make the following directory security settings in the Properties window of the above virtual directory: 1. Select the "Anonymous access" check box. 2. Set an account with the Administrator authority to be used for anonymous access. 3. Clear the "Basic authentication" check box. Note If a report is continuously created when the version of Microsoft(R) Internet Information Services is 4.0, the following phenomena may occur. - Microsoft Internet Explorer The message "Error: ExtendCopy()" is displayed. This is a phenomenon resulting from the specification of Microsoft(R) Internet Information Services. In order to avoid this phenomenon, please open a 60-second or more interval and create a report, or reboot Microsoft(R) Internet Information Services after adding the following registry entries. HKEY_LOCAL_MAHCINE\SYSTEM\CurrentControlSet\Services\Inetinfo\Parameters Value name DisableMemoryCache Type of value DWORD value data 1 Point After the report server environment is set to this stage, check the settings are correct according to the following procedure 1. [Check whether reports can be displayed from the Web Site Management Window. Click the [Trend Reporter] button on the Web Site Management Window to check whether the registered reports list can be displayed. See If the registered reports list can not be displayed, check the settings while referring to "16.2 Report Display" in the Troubleshooting Guide
59 Chapter 7 Configuring the Operating Environment This chapter explains how to configure the Web Site Management Functionality operating environment with the Web Site Management Window, using the system in "3.1 System Configuration" as an example. Operations for configuring the Web Site Management Functionality operating environment The following operations must be performed before the Web Site Management Functionality can be used. Operation Reference section Remarks Registering a management server Registering managed server 7.1 Registering a Management Server 7.2 Registering a Managed Server Required Registering with the "7.1.1 Web Site Management" window is required. Required " Registering a Managed Server" and "7.2.2 Registering an Analysis Target Server" are required. Registering a group 7.3 Registering a Group Register a group if it is needed to manage multiple servers together. Registering a report server Make settings here. 7.4 Registering a Report Server Register a report server if it is needed to use report. Make settings here. Starting the Web Site Management window [Web Site Management] windows can be started by visiting the following URL with a Web browser. [Windows] If management server is Windows: server's host name/sqc/default.htm [UNIX] If management server is Solaris, Linux: server's host name/sqc/index.html Starting the Console Console can be started by visiting the following URL with a Web browser. management client's host name/ssqc/console.html Registering a Management Server

60 - 7.2 Registering a Managed Server Registering a Group Registering a Report Server 7.1 Registering a Management Server Management server can be registered with the following windows Web Site Management Web Site Management Click the [Environment Setting] button on the [Web Site Management] window to open the environment settings pages. Click the [Management Server] button on the environment settings pages to display the [Management Server Settings] windows. Set data for the management server
61 Setting item Example of settings Content of settings Management Server Specify the IP address or host name for the management server. Port Not specified Specify the port number for the Web server used by the management server. This can be omitted if the default port 80 is used. Proxy server Not specified If a default proxy is used in the environment managed by the Systemwalker Service Quality Coordinator, set the data for the following items: Address Specify the host name or IP address of the proxy server. Port Specify the port number for the proxy server

62 7.2 Registering a Managed Server This section explains how to register a Managed Server and management target: analysis target server. It is required that SQC-A is installed on the managed server. Here, it is required those two servers: HostA1 and HostA2 be registered Managed server information Registering an Analysis Target Server Managed server information The following types of information need to be registered for registration of a Managed Server 1. Information on the Managed Server 2. Information on the Analysis Target Server This section explains how to register information on the manager server Registering a Managed Server Click the [Managed Server] button on the Environment Settings page, and set information on the Managed Server. Click the [Add] button below the Managed Server field. The [Managed Server Information] window appears. Add information by repeating this operation, as many times as there are Managed Servers. Here, HostA1, and HostA2 must be added
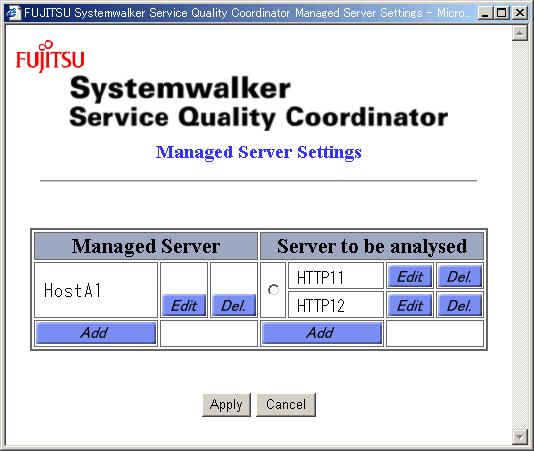
63 - 51 -
64 The following explains the information to be set, using the case of adding HostA1 as an example. [Basic information] Setting item Examples of settings Contents of settings Server name HostA1 Specify the entry name for the Managed Server. Each server name must be unique among all Managed Servers. IP address Specify the IP address of the Managed Server. Subnet mask Specify the subnet mask of the Managed Server

65 Setting item Examples of settings Contents of settings Proxy server Not checked If communication between the manager and agent is performed via a proxy server, select the check box. Proxy server address Not specified If the proxy server check box is selected, specify the address of the proxy server. Proxy server port Not specified If the proxy server check box is selected, specify the port of the proxy server. See For more information, see " Managed server setting window" in the online manual. [Attributes of Managed Server] Setting item Example of settings Contents of settings Systemwalker Service Quality Coordinator agent Select the check box. - Agent URL Specify the URL of agent. The format is as following: " For the "host", specify the IP address or host name (with domain name). Match the setting with "Name" two lines below [Server] in the use trend database environment definition file Registering an Analysis Target Server The following analysis target servers must be added here
66 1. Use trend target server - Use trend 1 of Managed Server HostA1 - Use trend 1' of Managed Server HostA2 Select the option button on the right side of the name of the Managed Server for which services are to be added, and click the [Add] button below the service field. The [Use Trend Service Information] window appears. Add all services. How to register each analysis target server is explained as follows Registering a usage service [Web Site Management] window-> [Environment Settings] window-> [Managed Server Settings] window-> Select the option button on the right side of the name of the Managed Server for which analysis target servers are to be added, and click the [Add] button below the analysis target server field. The following window displayed
67 In the [Use Trend Service Information] window, set the Use Trend Service Information for the Managed Server. Note With the Managed Server selected on the [Managed Server Setting] window, if [Systemwalker Service Quality Coordinator Agent] check box is OFF when setting [Managed Server Information] window, analysis target server cannot be set. The following explains the settings for an example of adding HostA1 use trend services. Setting item Examples of settings Contents of settings Target server name HostA1 Specify the name of the server to be analyzed. The specified name must be unique among all use trend services regardless of the Managed Servers that add service
68 Setting item Examples of settings Contents of settings Point The specified name must match the character string specified for "Name" in the use trend database environment definition file that is used when the Trend Viewer is defined. Use trend database location Use trend database port Management server Specify whether the use trend database for the use trend service is to be managed on the Managed Server or management server The use trend database port is usually Change this setting if this has been changed to any other port number. Otherwise, there is no need to change the default value (2365). Note [Windows/Linux] The use trend database port is set up when SQC-A is installed. [Solaris] The use trend database port is not set up when SQC-A is installed. See Refer to " Start operation" for details on how to set up the use trend database port. Similarly, add use trend services also for HostA2. Repeat the procedure explained in this section. See See " Usage service information window" for details. 7.3 Registering a Group When multiple analysis target servers configure a virtual server or hosting, the multiple servers can be registered as a group. When the group is registered, the analysis target servers can be managed together. This section explains how to set with an example of grouping HostA1 and HostA
![- 7.3.1 Group Information 7.3.1 Group Information Open the [Group Settings] window following the following procedure.](/docs-images/86/94875035/images/69-0.jpg "Click the [Environment Settings] button on the [Web Site Management] window ->Click the [Grouping] button - 57 -")
69 Group Information Group Information Open the [Group Settings] window following the following procedure. Click the [Environment Settings] button on the [Web Site Management] window ->Click the [Grouping] button
![Click the [Grouping] button below Server](/docs-images/86/94875035/images/70-0.jpg "field. The following window appears.")
70 Click the [Grouping] button below Server field. The following window appears
71 The following explains the settings for the HTTP1_1/HTTP1_2 of the HostA1/HostA2. Setting item Examples of settings Contents of settings Group name Group1 Specify the entry name for the group of servers. The specified name is used to indicate the group in each function window. Component server Select the HTTP1_1 of the HostA1, and the HTTP1_2 of the HostA2. Check the checkboxes of the servers from the server list of the servers that composed the server group. Also set the HTTP2 of the HostA1/HostA2. Similarly

72 See For the settings about the group, refer to " Group Settings window". 7.4 Registering a Report Server Click the [Environment Settings] button on the [Web Site Management] window to open the Environment Settings page. Click [Report Server] button to open [Report Server Settings] window. The following explains the settings for adding a report server, using the system in "3.1 System Configuration" as an example. Note Web Site Management Functionality uses the operation management client as the report server
73 Setting item Examples of settings Contents of settings Address Specify the address of the report server. Port 80 - In the system used as an example, the management server and report server are installed on the same machine. So, specify the IP address of the management server
74 Chapter 8 Checking Operation This chapter explains how to verify the following functions: Displaying the Usage Analysis Window Displaying a Report 8.1 Displaying the Usage Analysis Window This section explains how to display the usage analysis window. Note It is required that the service of the usage DB reference engine be started in advance. Refer to " Start operation" for details. To display the analysis window, do the following on the Web Site Management window of the SQC-M. 1. Click the [Trend Viewer] button on the [Web Site Management] window to display the [Trend Viewer-agent selection] page
75 2. Choose the agent to be analyzed in [Trend Viewer-Agent selection] window and click the [OK] button

76 3. The following window appears. See The Trend Viewer uses JavaTM applet. For details on the Java TM applet, refer to "3.2 Environment Settings procedures". 8.2 Displaying a Report This section explains how to display a report. Note It is required that the service of the usage DB reference engine be started in advance. Refer to " Start operation" for details
![1. Click the [Trend Reporter] button on](/docs-images/86/94875035/images/77-0.jpg "the [Web Site Management] window.")
77 1. Click the [Trend Reporter] button on the [Web Site Management] window
![2. Click the [Generate] button on the](/docs-images/86/94875035/images/78-0.jpg "[List of registered reports] page.")
78 2. Click the [Generate] button on the [List of registered reports] page
79 3. After all items on the left of [Registry of report] are set, click [TEST] button. The following screen is displayed
80 4. Make sure the report conditions are correct and click the [Register] button. 5. Click [Generate] button on the left of Registered report name that is registered the report conditions in [List of registered reports] screen. In this case, hosta1http1 is selected
81 - 69 -
82 6. Make sure the registered report name is HostA1HTTP1. Click the [Generate] button
83 7. The report is displayed on the right of the screen
84 Part 3 Installation(Application) Chapter 9 Web Marketing...73 Chapter 10 Monitoring for Tampering with Web Contents
85 Chapter 9 Web Marketing This chapter explains how to operate Trend Viewer Determining an Analysis Method and Configuration Notes 9.1 Determining an Analysis Method and Configuration Overview of analysis type Analyzing cyclic transition Analysis that identifies users Analysis using CSV output Integrated analysis with data on the backbone system If you would like to analyze response If you would like to analyze user types If you would like to make analysis in subnetwork units If you would like to make analysis with specific subnetworks excluded If you would like to make analysis with specific URLs excluded Overview of analysis type Trend Viewer can be used as follows: - Analysis by the use of trend analysis window - Analysis by constant reporting Analysis by the use trend analysis screen Click the [Trend Viewer] button on the [Web Site Management] window to use this analysis. Analysis can be done interactively. Use the analysis by the of use trend analysis screen when the detail of the Web site usage is needded to be analyzed. Analysis by constant reporting First click the [Trend Reporter] button on the [Web Site Management] window, then select a report type for use trend analysis to use this analysis. Because that frequently used report can be registered and the report can be printed, in case where periodical analysis as weekly report or monthly report is required, or int the case that the result should be saved this analysis by constant reporting is effective. Analysis types Trend Viewer displays analysis results of availability of the following two servers and one Web site group (analysis target server type): - Web server - Proxy server - Web site group
86 Analysis results (analyzed data types) are classified into the eight types listed below. The Web server can display all of the eight types, and the Proxy server can display six types. - Summary (total of each report of analysis target servers) - Session report - Request report - Traffic report - Cache report - Error report - Response report (Web server and Web site group) - Page navigation report (Web server only) - Number of actually visiting users report(trend reporter of Web server only) Trend Viewer uses various analysis methods (URL base and client base) to display editing results in a graph and list Traffic display Traffic is displayed in kilobytes on each page that analyzes traffic status and displays other traffic (or total traffic and total of successful request traffic). A value from one byte to less than 1,000 bytes is displayed as one kilobyte Response analysis page Response analysis pages differ in the following points from other analysis pages. Relation with SQC extended log collection Response analysis analyzes data, based on the data that is stored in the SQC extended log file by collecting SQC extended logs. If SQC extended logs are not collected, execution of data analysis obtains no data analysis results. Display data A response analysis page displays the three values listed below. These values are displayed in descending order of average times (from lower response to higher response) in the table. - Average (average response time in analysis period) - Maximum (longest response time in analysis period (slow response)) - Minimum (shortest response time in analysis period (quick response) The following table lists the display units and the number of digits. Item Numeric value unit Number of digits Display range Seconds Explanation 4 integer numbers and 2 decimal places (third decimal place rounded up) 0.01 to 3, seconds (less than 1 hour) (Less than 10 ms is displayed as 0.01 second.)
87 Item Value exceeding the display range Displayed as 1 hour or longer Explanation One hour ( seconds) or longer is displayed as "One hour or longer," but an actual value is used for the average value. Graph display/switching For graph display on the response analysis page in the use trend analysis window, the average, maximum, and minimum are put into graphs for only one line (one URL or client) that is selected from the table, unlike other analysis pages. By default, the graph for only the URL or client whose average time is Top1 (the top line in the table) is displayed. Use the mouse to select a line from the table to display the corresponding graph. A name (URL or client name) that is selected from the table is displayed as a graph display target name under the analysis type name in the analysis information part (upper part of the graph) of the analysis page. Note Note that this operation is the same as "Carrying out advanced analysis" in " Operation of analysis page" described later, but no drill down analysis is carried out for response analysis Analyzing cyclic transition By specifying "Session report" and "Request report" as analyzed data types, you can analyze transitions in session and request reports in each period by various methods such as URL. Analysis of transitions in each period enables the following kinds of questions to be answered: - Which pages in which time zones are accessed a lot? - Which pages are accessed most on weekends? - How is the number of accesses affected by promotions such as advertising campaigns? Because values and average values of previous terms can also be displayed during analysis, usage and transitions are easily compared and analyzed Analysis that identifies users To analyze customer trends, you can perform analysis that identifies users. Users can be identified in the following ways: - Identifying users by user name authenticated on the Web server If authentication is performed on the Web server, authorization user names can be used as a key for analysis. The following is the procedure for analysis that identifies users by authentication of user name on the Web server. 1. Set the Web server log so that information about authorization user names is output to the Web server log. 2. In the usage DB environmental definition file of Systemwalker Service Quality Coordinator, add tokens (c-user) for the authorization user names of clients to the record format definition of the log file to be analyzed. 3. Select "Authorization user name base" as the analysis method on the analysis window before performing an analysis
88 - Identifying users by IDs set in a cookie If authentication is performed on the Web server using CGI, no information about authorized users is output to the Web server log. You can perform analysis that identifies users by setting user names authenticated by CGI in a cookie. If authentication is not performed by CGI, you can perform analysis that identifies users by setting for Cookie an identifier that identifies the user on each page of the Web service. The following is the procedure for performing analysis that identifies users with an ID set in a cookie. 1. Set user information in a cookie on each page of the Web service. 2. In the usage DB environmental definition file of Systemwalker Service Quality Coordinator, to the record format definition of the log file to be analyzed, add tokens (c-cookie) in a cookie. 3. Select "Access ID base" as the analysis method on the analysis window before doing the analysis. - Identifying users by client host When the Web server performs no authentication, such as that by the service that publishes information, and no information is set in a cookie, then users can be identified by the client host. For the identification of users by client host, the ID address and host name of the client is used. The following is the procedure for analysis that identifies users by client host. 1. Set the Web server log so that information about client hosts is output to the Web server log. 2. In the usage DB environmental definition file of Systemwalker Service Quality Coordinator, add tokens (c-host) for client hosts to the record format definition of the log file to be analyzed. 3. Select "Client host name base" or "Client IP address base" as the analysis method on the analysis window before doing the analysis. Note For analysis to identify users, content must be created such that authentication is performed or a cookie is set reliably when the Web service to be analyzed is used. If a page in the Web service is accessed directly without authentication or Cookie settings, then analysis that identifies users cannot be done. Analysis that identifies users with an ID set in a cookie cannot be done if the user blocks cookies with a browser setting. In such a case, analysis that identifies users by client host can be used. Note that in analysis in which users are identified by client host, different users are handled as the same client host in the following cases: - IP addresses are allocated dynamically by DHCP (for example, ISP is used to connect). - Access is via a proxy server (for example, corporate users connecting from behind a firewall) Analysis using CSV output This section explains analysis that uses CSV output of the Trend Viewer Analysis using the analysis window and analysis using CSV output In Systemwalker Service Quality Coordinator, the following two methods can be used to analyze the usage of Web sites: - Analysis using the analysis window - Analysis using CSV output In analysis that uses the analysis window, a browser can be used for analysis. The types of analysis that are available are the standard analysis methods provided by Systemwalker Service Quality Coordinator
89 In analysis that uses CSV output, information from data in the usage DB of Systemwalker Service Quality Coordinator output to files in CSV format based on the data type is used to perform various types of analysis, such as analysis using added methods of analysis or analysis that includes other types of information. For analysis that uses the analysis window, up to 300 lines of results are displayed. For analysis that uses CSV output, all cases can be analyzed Integrated analysis with data on the backbone system This section describes the integrated analysis of information on the Web server and data on the backbone system Overview of integrated analysis with data on the backbone systm Systemwalker Service Quality Coordinator provides functions that, through the analysis of the Web site usage using the Web server log, are useful for doing business. The following types of analysis are made possible by integrated analysis of information output by Systemwalker Service Quality Coordinator and sales and customer data on the backbone system: - Product purchase rates and purchased product trends of Web site users (sales data included in analysis) - Behavior on the Web site of users who purchased products (sales data included in analysis) - Usage of the Web site based on region, gender, and age (customer data included in analysis) As shown in the above analysis examples, an analysis that is impossible with only Web server information becomes possible when data on the backbone system is integrated into the analysis. Integrated analysis makes Web sites more effective for business. Systemwalker Service Quality Coordinator collects log data for a Web server and uses products such as the Symfoware e- Business Intelligence Suite, with advanced analysis functions that include data mining, for integrated analysis that uses data on the backbone system Method of integrated analysis with data on the backbone system The following explains how to perform integrated analysis that uses data on the backbone system. 1. In the analysis target server definition block in the Usage DB environmental definition file, specify combined operation with both the Usage DB and CSV-format log file as the Usage DB operation type. DatabaseMode = both 2. Log data for the Web server is output to the following directory as a CSV-format file by the Usage DB Registration Engine. Note: < > indicates a directory
90 (*1) The server directory is created with the name specified in Symbol of the Analysis Target Server Definition Block in the Usage DB environmental definition file. (*2) Variables in the CSV-format log file name are listed below. Year/Month/Day is the date when the Usage DB is switched (created). yyyy Year (1980-) mm Month (01-12) dd Day (01-31) nnn Sequential number ( ) 3. Enter the CSV-format log file output as shown above in the DB used by the analysis product (such as Symfoware e- Business Intelligence Suite) that performs integrated analysis with the data on the backbone system. See " Usage Log file" for information about the format of CSV format log files. 4. The analysis product is used to do the analysis If you would like to analyze response This section explains how to make analysis aiming at response when the customer accesses a page. Analysis aiming at response enables the following information to be recognized and used for Web site operation. - How long does it take for processing on the server system? SQC extended log is used to analyze response SQC Extended Log Collectin The SQC Extended Log Collection is used to collect and accumulate data not collected by the functions provided by the Web service (such as the Web server). Data accumulated by the SQC Extended Log Collection is called the "SQC extended log." The following SQC extended log can be collected and stored Response logs SQC extended log file Response logs Outline The response log is a log in which data on the response time of the CGI program collected in terms of the Web page user is accumulated. The response time is a time interval required to receive a result from the CGI program after the Web page user executes a service that calls the CGI program. For example, in the case of a Web page that executes searches, the response time is a time interval required to display a search result after the search is started. Data is collected and accumulated in the response log by using the following three functions:
91 Data collection function1 Java TM applet (ResLog1.class) that runs on the Web browser. This function is called when the user references the Web pages and executes a service that calls the CGI program; and data is collected. To run this function, refer to "Editing WebPages" in advance. Data collection function2 Java TM applet (ResLog2.class) that runs on the Web browser. This function is called when the Web page user receives a result of a service that calls the CGI program. This applet collects data when a result is received and then sends the response time to the data accumulation function after calculating it together with data of the data collection function1. To run this function, refer to "Editing WebPages" in advance. Data accumulation function CGI program (reslog.cgi) that runs on the Web server (installation machine). The data accumulation function is automatically started when data collection function2 is started. This function accumulates data sent from the data collection function2 in the SQC extended log file Making settings for log collection This section explains how to make settings for response log collection. Before making settings It is necessary to register the CGI program (reslog.cgi) of the data accumulation function with the Web server in advance so that it can be executed. For details of the registration, refer to "4.1 Settings for Web Server". See Java TM applet is used by the data accumulation function (ResLog1.class, ResLog2.class). For details about Java TM applet, refer to "3.2 Environment Settings procedures". Editing WebPages Incorporate the Java TM applet for log collection into the HTML documents of each Web page that makes log collection. Both of the following two related Web pages must be edited:
92 - Web page that calls a service Web page that calls the CGI program of a service For example, a Web page that executes searches when a keyword is given. - Web page that receives results Web page that receives results (displays results) from the CGI program. For example, a Web page that displays search results. Editing Web pages that call a service Incorporate the Java TM applet (ResLog1.class) of data collection function1 into the HTML document of the Web page that calls a service. The following is a sample HTML document. URL in CODEBASE within the sample is described assuming that, like the setting example in "4.1 Settings for Web Server", the physical path of the directory www under the installation directory is registered as the alias "SQC". In the following example, the Java TM applet (ResLog1.class) of the data collection function1 is called when the search button is clicked. <!-- --> <!-- Response log collection page Sample (Part 1) --> <!-- --> <HTML> <HEAD> <TITLE> Search service page (sample) </TITLE> </HEAD> <BODY BGCOLOR=WHITE> <!-- ************ Systemwalker SQC (begin) ****************** --> <APPLET NAME="ResLog1" CODEBASE="/SQC/classes" CODE="ResLog1.class" ARCHIVE="reslog.jar" WIDTH=1 HEIGHT=1> </APPLET> <!-- ************ Systemwalker SQC (end) ******************** --> <CENTER><FONT COLOR=GREEN> Search service page(sample) </FONT></CENTER> <BR><BR> <FONT SIZE=5 COLOR=BLUE> Search service </FONT> <HR> <FORM METHOD="post" ACTION="/cgi-bin/search.cgi"> Search key <INPUT TYPE="text" NAME="key1" SIZE="25"> <BR><BR> <INPUT TYPE="reset" VALUE="Reset"> <INPUT TYPE="submit" VALUE="Search" onclick="document.reslog1.run()"> </FORM>
93 <HR> <FONT COLOR=RED> Notes </FONT> <P> This site records and accumulates response reports of the search service. Results are used exclusively to improve the search service. No violation of privacy is intended. </P> </BODY> </HTML> [Sample explanation] Content Blue character Path to be specified in CODEBASE Explanation Description for incorporating data collection function1 URL of the storage directory of the Java TM class file of this product The above sample is stored at the following storage location after installation. Windows] Installation directory\sample\search_request_jp.html UNIX] /opt/fjsvssqc/sample/search_request_jp.html Editing the Web page that receives results Incorporate the Java TM applet (ResLog2.class) into the HTML document of the Web page that receives displays results. The following is a sample HTML document. URL in CODEBASE within the sample is described assuming that, like the setting example in "4.1 Settings for Web Server" the physical path of the directory www under the installation directory is registered as the alias "SQC". <!-- --> <!-- Response log collection page Sample (Part 2) --> <!-- --> <HTML> <HEAD> <TITLE> Search service page (sample) </TITLE> </HEAD> <BODY BGCOLOR=WHITE> <!-- ************ Systemwalker SQC (begin) ****************** --> <APPLET CODEBASE="/SQC/classes"
94 CODE="ResLog2.class" ARCHIVE="reslog.jar" WIDTH=1 HEIGHT=1> <PARAM NAME=url VALUE="/SQC/cgi-bin/reslog.cgi"> </APPLET> <!-- ************ Systemwalker SQC (end) ******************** --> <CENTER><FONT COLOR=GREEN> Search service page (sample) </FONT></CENTER> <BR><BR> <FONT SIZE=5 COLOR=BLUE> Search service </FONT> <HR> <P> Search result... </P> </BODY> </HTML> [Sample explanation] Windows] Content Blue character Path to be specified in CODEBASE Path to be specified in VALUE Explanation Description for incorporating data collection function2 URL corresponding to the following directory: Installation directory\www\classes URL corresponding to the following file: Installation directory\www\cgi-bin\reslog.cgi The above sample is stored at the following storage location after installation. Installation directory\sample\search_result_jp.html UNIX] Content Blue character Path to be specified in CODEBASE Path to be specified in VALUE Explanation Description for incorporating data collection function2 URL corresponding to the following directory: /opt/fjsvswmag/www/classes URL corresponding to the following file: /opt/fjsvswmag/www/cgi-bin/reslog.cgi The above sample is stored at the following storage location after installation. /opt/fjsvssqc/sample/search_result_jp.html
95 Notes on Web page editing Use the identical string to specify URL in CODEBASE inside the APPLET tag of the Web page that calls a service and that in CODEBASE inside the APPLET tag of the Web page that receives (displays) results. Note that, if the URL is not identical, for example, if one URL is specified using a relative path and the other URL is specified using an absolute path, no response log can be collected. Operation after settings If a Web page with the settings for this log collection is used, log collection is carried out in the sequence show below: Target Operation description 1 Web user: References URL of the Web page using the Web browser. 2 Web user: Executes a service (for example, a search service) that calls the CGI program. 3 Web user: Receives a result from the CGI program. 4 Inside: The response log is collected and accumulated. 5 Inside: The log is registered with the Usage DB by the Usage DB Registration Engine. 6 Analyzer: An analysis can be carried out and results can be displayed on the analysis window. The URL based response analysis and client based response analysis are supported. Note If there is any error in the edited Web page, the response log cannot be collected. Before providing a Web page service, carry out tests to make sure that the response log is actually collected Stopping log collection To stop the response log collection, delete (or comment out) the lines added to the HTML document of the Web page that start log collection. Delete such text from both the HTML page that calls a service and the HTML page that receives results. To be deleted is the blue text in each HTML page as described in " Making settings for log collection". Once deleted, no response log is collected and accumulated even if this Web page is referenced and a service is called Log format A response log with one line of text is accumulated in the SQC extended log file in response to one piece of data sent from data collection function2. The format of one line is as follows. The field is delimited by one blank character. 1.Date 2.Type 3.Version 4.HostName 5.Path 6.Reserve 7.KeyData No. Field Explanation 1. Date Time at the log is accumulated. This time is a local time on the installation machine. Its format is as follows and blue characters are variable: [dd/mon/yyyy:hh:mm:ss SHHMM] The meaning of each field is as follows:
96 No. Field Explanation Field dd mon yyyy hh mm ss S HH MM Day (01-31) Month Meaning ("Jan","Feb","Mar","Apr","May ","Jun","Jul","Aug","Sep","Oct","Nov","Dec") Christian era (1970 -) Hour (00-23) Minutes (00-59) Seconds (00-59) Flag of time difference with the Coordinated Universal Time (UTC) ("+","-") Hour of time difference with the Coordinated Universal Time (UTC) (00 -) Minutes of time difference with the Coordinated Universal Time (UTC) (00 -) 2. Type Data type (code that indicates the log type) The response log corresponds to "2". 3. Version Version level of the log format. Currently only "1" for the response log. 4. HostName (Web page user's) host name or IP address where the browser operates 5. Path Path to the HTML document of the Web page 6. Reserve Reserved Currently always "0" 7. KeyData Response time (in milliseconds) For the file name, capacity estimation, and SQC extended log file switching, refer to " SQC extended log file"
97 SQC extended log file This subsection explains the SQC extended log file. The SQC extended log file is created automatically by the SQC extended log collection when the SQC extended logs are accumulated File name Storage location The SQC extended log file is stored under the following directory. Directory for SQC extended log file Windows] Variable file storage directory\extend-log\ UNIX] /var/opt/fjsvssqc/extend-log/ File name format The SQC extended log file name has the following format. A new file name is created each time the SQC extended log file is switched. Characters shown in blue indicate variables. logyyyymmdd_nn [Explanation of variable characters] Symbol yyyy Year created (1970 -) mm Month created (01 to 12) dd Day created (01 to 31) nn Meaning Serial number of the SQC extended log file among those log files created on the same day (01 to 99) Capacity estimation The formula for estimating the capacity per day is as follows. Characters shown in blue indicate variables. (Capacity per day) = (50 + A + B) * C Symbol Meaning A: Average number of bytes of host name or IP address (of the Web page user) when the browser is operating B: Average number of bytes of path in HTML document of Web page C: Average number of access to HTML document of Web page per day
98 Switching the SQC extended log file To simplify work such as backup of the SQC extended log file, the SQC Extended Log Collection periodically creates a new SQC extended log file (file name described in " File name": logyyyymmdd_nn) to change the accumulation destination of the SQC extended log to a new log file. This is called "SQC extended log file switching." SQC extended log file switching is performed in accordance with the settings in the Extended Log Environment Definition File "ExtendLogConfig". For details on how to set the Extended Log Environment Definition File, refer to " Setting an extended log environment definition file" Setting an extended log environment definition file "Extended log environment definition file" is a file in which SQC extended log accumulation methods are defined. The extended log environment definition file needs to be set before the SQC extended log is collected. This setting is required only when the SQC extended log is collected File storage location The extended log environment definition file is a text file. Use a text editor such as Notepad to create and edit the file. The file path is given below. Windows] Variable file storage directory\control\extendlogconfig UNIX] /etc/opt/fjsvssqc/extendlogconfig A sample of the extended environment definition file is prepared. Edit this sample to facilitate installation. This sample is stored in the following directory. Windows] Installation directory\sample\extendlogconfig UNIX] /opt/fjsvssqc/sample/extendlogconfig The character code is as follows: Windows] ASCII UNIX] ASCII
99 Example of definition A definition example of the extended log environment definition file is given below. See " Extended Log Environment Definition File", in the online manual for details on setting the extended log environment definition file. 01/Jan/2001:00:00: [Log] LogfileInterval = week(sun) 01/Jan/2001:00:00: LogfileInterval is used to define extended log file switching units. The meaning of each option is listed below. <Option> day week(...) month(...) <Meaning> Daily Weekly Monthly For "Week," use the following value to specify the start point for a week in parentheses. <Option> sun mon tue wed thu fri sat <Meaning> Sunday Monday Tuesday Wednesday Thursday Friday Saturday For "month," use the following value to specify the start point for a month in parentheses. However, the last day of the month is specified if the start point is omitted. <Option> Integer number from 1 to 31 <Meaning> Day of the month Note Before providing the Web page service to collect the SQC extended log, execute a test to confirm that the SQC extended log is actually collected
100 Setting a usage DB environment definition file The Usage DB Environment Definition File defines the conditions for creating databases used to store various log data on the Web services. The file also defines the conditions for creating usage DBs. Definitions in the use trend DB environment definition file are required to analyze response reports by using the collected SQC extended log. Specify the analysis target log definition block for the SQC extended log in the use trend DB environment definition file. For detail of the setting of a use trend database environment definition file, refer to " Usage DB Environment Definition File". The following shows a definition example. Windows] [Server] Symbol = PUBLIC <-- omission --> [Log] Symbol = WWW <-- omission --> [Log] Symbol = Response Name = ResponseLog Path = "C:\SystemwalkerSQC\extend-log\log*" Format = SQC-Extend Region = UNIX] [Server] Symbol = PUBLIC <-- omission --> [Log] Symbol = WWW <-- omission --> [Log] Symbol = Response Name = ResponseLog Path = "/var/opt/fjsvssqc/extend-log/log*" Format = SQC-Extend Region = Specify the following as the SQC extended log storage destination to be specified for Path
101 Windows] Path = "variable file directory\extend-log\log*" UNIX] Path = "/var/opt/fjsvssqc/extend-log/log*" Specify "SQC-Extend" as the format. Region uses a time difference from GMT (Greenwich Mean Time) to specify the region for the time Analysis using the usage analysis window To analyze from the standpoint of response,specify the following in the usage analysis window. Item Analysis target server Analyzed data type Analysis method Contents specified Specify the server or group to be analyzed. Response report Specify one of the following: - URL base - Client host name base - Client IP address base Analysis period Specify the analysis target period and its unit Analyzing response using the management server By combining the management server on which SQC-M is installed and the managed server on which SQC-A is installed, you can analyze response reports on the managed server by using the management server. The following explains how to analyze response reports on the managed server by using the management server. Settings for the management server Make the following settings on the management server: 1. Use " Registering a usage service" for the managed server setting in the environment settings to set the management location for the use trend DB in "Management Server." 2. Define the managed server in the analysis target server definition block in the use trend DB environment definition file. Specify the following in the analysis target server definition block. Item Symbol Setting contents Specify the same symbol as that of the use trend DB environment definition file of the managed server
102 Name Item DatabaseMod e Setting contents Specify the server name that is defined in the managed server setting window for environment settings. db To register in the use trend database the log information that is transferred from the managed server and analyze it, specify that database. Specify the following in the analysis target log definition block. Windows] Item Path Format Region Setting contents "<Variable file directory>\database\csv\<server directory>\e*.csv" SQC-ExtCSV Specify the CSV format extended log file as the recording format of the analysis target log file. Specify no time difference as the region definition for the time data that is stored in the analysis target log file. UNIX] Item Path Format Region Setting contents "<Variable file directory>/database/csv/<server directory>/e*.csv" SQC-ExtCSV Specify the CSV format extended log file as the recording format of the analysis target log file. Specify no time difference as the region definition for the time data that is stored in the analysis target log file. *1 The server directory is created with the name that is specified for Symbol in the analysis target server definition block in the use trend DB environment definition file. The following shows a definition example. Windows] [Server] Symbol = PUBLIC <-- omission --> DatabaseMode = db [Log] Symbol = WWW <-- omission -->
103 [Log] Symbol = Response Name = ResponseLog Path = "C:\SystemwalkerSQC\database\csv\PUBLIC\e*.csv" Format = SQC-ExtCSV Region = UNIX] [Server] Symbol = PUBLIC <-- omission --> DatabaseMode = db [Log] Symbol = WWW <-- omission --> [Log] Symbol = Response Name = ResponseLog Path = "/var/opt/fjsvssqc/database/csv/public/e*.csv" Format = SQC-ExtCSV Region = By making the setting above, Web server log information is transferred from the managed server to the management server and stored in the use trend DB of the management server. Settings for the managed server Make the following setting on the managed server. 1. Specify the operation that uses the CSV format log file as a use trend DB operation type in the analysis target server definition block in the use trend db environment definition file. DatabaseMode = csv The following shows a definition example. Windows] [Server] Symbol = PUBLIC <-- omission --> DatabaseMode = csv
104 [Log] Symbol = WWW <-- omission --> [Log] Symbol = Response Name = ResponseLog Path = "C:\SystemwalkerSQC\extend-log\log*" Format = SQC-Extend Region = UNIX] [Server] Symbol = PUBLIC <-- omission --> DatabaseMode = csv [Log] Symbol = WWW <-- omission --> [Log] Symbol = Response Name = ResponseLog Path = "/var/opt/fjsvssqc/extend-log/log*" Format = SQC-Extend Region = The use trend DB registration engine outputs the CSV format extended log file to the following directory. * < > indicates a directory. (*1) The server directory is created with the name that is specified for Symbol in the analysis target definition block in the use trend DB environment definition file. (*2) The name variable (yyyymmdd_nnn) for the CSV format extended log file is given below. The year, month, and date are when the use trend DB is switched (created)
105 yyyy Year (1980 or later) mm Month (01 to 12) dd Date (01 to 31) nnn Serial No. (001 to 999) When the setting above is made, a CSV format extended log file is created as a use trend DB for response report on the managed server, and log information is transferred between the managed server and the management server. Analyzing the managed server Trend Viewer of the management server is used to analyze the managed server log on the management server If you would like to analyze user types This section explains how to make analysis focused on the types of users who access the Web sites. Analysis focused on users enables the following information to be recognized and utilized for Web site operation. - Which users often access membership sites? - Which companies often access Web sites? Specifying users Systemwalker Service Quality Coordinator identifies users as follows: - Identifying users by user name authenticated on the Web server If authentication is performed on the Web server, authorization user names can be used as a key for analysis. - Identifying users by IDs set in a cookie If authentication is performed on the Web server using CGI, no information about authorized users is output to the Web server log. You can perform analysis that identifies users by setting user names authenticated by CGI in a cookie. If authentication is not performed by CGI, you can perform analysis that identifies users by setting for Cookie an identifier that identifies the user on each page of the Web service. - Identifying users by client host When the Web server performs no authentication, such as that by the service that publishes information, and no information is set in a cookie, then users can be identified by the client host. For the identification of users by client host, the ID address and host name of the client is used. Note For analysis to identify users, content must be created such that authentication is performed or a cookie is set reliably when the Web service to be analyzed is used. If a page in the Web service is accessed directly without authentication or Cookie settings, then analysis that identifies users cannot be done. Analysis that identifies users with an ID set in a cookie cannot be done if the user blocks cookies with a browser setting. In such a case, analysis that identifies users by client host can be used. Note that in analysis in which users are identified by client host, different users are handled as the same client host in the following cases: - IP addresses are allocated dynamically by DHCP (for example, ISP is used to connect)
106 - Access is via a proxy server (for example, corporate users connecting from behind a firewall) Environment settings The following environment settings are required to analyze what kind of users visits the Web sites: - Setting a Web server log output - Setting a usage DB environment definition file Setting a Web server log output To analyze what kind of users visited to the Web server, the Web server must be set so that information about the users is output to the Web server log. - Identifying users by user name authenticated on the Web server Information about the user names that are authenticated by the Web server is output to the Web server log. If the information is not output, set the Web server so that it is output to the Web server log. - Identifying users by IDs set in a cookie If authentication is performed on the Web server using CGI, and user names authenticated by CGI are set in a cookie, set the Web server so that the cookie information is output to the Web server log. The following gives a setting example for the Web server. Windows] - Microsoft(R) Internet Information Services Chose from the [Start] menu as shown below to start Internet Service Manager. [Start] -> [Programs] -> [Management tool] -> [Internet Service Manager] Note If the environment is not as shown above, perform operation appropriately for the environment. 2. Set extended log properties. Point the mouse to the Web site for which extended log properties are to be set, then display the extended log property setting window. Check the following and press the [Complete] button. Cookie ( cs(cookie) ) 3. Save the Web server log. If the information to be output to the log is changed in the extended log property setting window, the log output format is changed
107 Note Because the new log output format is defined for Systemwalker Service Quality Coordinator, it differs from the prechange log output format, causing an analysis error. Therefore, save and delete the prechange log. - Apache Windows] 1. Chose from the [Start] menu as shown below and open the configuration file. [Start] -> [Programs] -> [Apache Web Server] -> [Management] -> [Edit Configuration] Note If the environment is not as shown above, perform operation appropriately for the environment. 2. Set the log output format. Add the lines shown below to the log-related definition part. The following gives an example when cookie information output definitions are added to the common format, a default log format. #CustomLog logs/access.log common * Define this line as a comment. CustomLog logs/access.log "%h %l %u %t \"%r\" %>s %b %{cookie}i" See Refer to the Apache manual for details. 3. Reflect the settings. Save by overwriting and quit the editor. If the Apache HTTP server is active, shut down and reboot it. UNIX] 1. Use the editor to open the configuration file. 2. Set the log output format. Add the lines shown below to the log-related definition part. The following gives an example when cookie information output definitions are added to the common format, a default log format. #CustomLog logs/access_log common * Define this line as a comment. CustomLog logs/access_log "%h %l %u %t \"%r\" %>s %b %{cookie}i"
108 See Refer to the Apache manual for details. 3. Reflect the settings. Save by overwriting and quit the editor. If the Apache HTTP server is active, shut down and reboot it. - Identifying users by client host Normally, information about the client hosts is output to the Web server log. If the information is not output, set the Web server so that it is output to the Web server log Setting a usage DB environment definition file Set "Format" that is defined in the analysis target log definition block in the use trend DB environment definition file, based on the user identification method. - Identifying users by user name authenticated on the Web server Specify tokens (c-user) for Format, based on the Web server log output format. - Identifying users by IDs set in a cookie Specify tokens (c-cookie) for Format, based on the Web server log output format. When the tokens (c-cookie) are specified, define the cookie format according to the contents that are output as cookie information. The following gives a definition example. Output format of Web server log cookie information "ID001; " (ID001: user name) [Server] Symbol = PUBLIC <-- omission --> [Log] Symbol = WWW <-- omission --> Format = "s-time{yyyy-mm-dd HH:MM:SS} c-host s-method s-url s-status s-bytes \"ccookie{id;*}\"" <-- omission --> - Identifying users by client host Specify tokens (c-host) for Format, based on the Web server log output format Analysis using the usage analysis window Specify analysis methods in use trend analysis window, based on the user identification method

109 - Identifying users by user name authenticated on the Web server Specify "Authenticated user name base" as an analysis method in the use trend analysis window. - Identifying users by IDs set in a cookie Specify "Access ID base" as an analysis method in the use trend analysis window. - Identifying users by client host Specify "Client host name base" or "Client IP address base" as an analysis method in the use trend analysis window. The following shows the window for analysis with users identified by client host If you would like to make analysis in subnetwork units This section explains how to analyze the usage trend in a subnetwork unit (or a section unit). For example, which content is accessed by persons in which section, where the network is divided by section at the in-house Web site. You can grasp the following information by analysis from the standpoint of the usage trend in the unit of subnetwork and utilize it for Web site operation. - Which content is accessed by persons in which section? - Analysis of accesses from two categories:one from in-house and the other from outside the company Environment settings The following environment setting is required to make analysis in subnetwork units. - Setting for option definition file
110 Setting an option definition file Each subnetwork to be analyzed is defined in the subnetwork-unit analysis definition block in the option definition file. See For information about the storage location of the Option Definition File refer to " File storage location". The following gives an example where subnetworks are defined as listed below for analysis. Subnetwork range Subnetwork name to General affairs department to Sales department I to Sales department II to Manufacturing department to In the above case, the definition of the subnetwork-unit analysis definition block in the option definition file is as follows: [SubnetName] =General_affairs_department =Sales_department_I =Sales_department_II =Manufacturing_department =Manufacturing_department See For the details about the setting, refer to " File internal format (analysis definition block for each subnetwork)" Analysis using the usage analysis window Open the use analysis screen as follows: Click the [Trend Viewer] button on the [Web Site Management] window. ->Select the agent to be analyzed on the [Trend Viewer-Agent selection] window then click the [OK] button. In the [use analysis] screen, analysis target server, analysis data type and analysis method can be selected. Here, select the "Subnet" as the analysis method. The subnet definition block of the Option Definition File is effective in the [use analysis] screen as soon as it is defined. The following shows the window for analysis on the subnetwork base

111 Point The information in the subnetwork-unit analysis definition block that is defined in the option definition file becomes valid from postdefinition analysis. This information enables subnetwork-unit analysis, including the information that has already been registered in the use trend DB If you would like to make analysis with specific subnetworks excluded The use trend of the Web site for outside the company may be analyzed. In this case, however, because access from inhouse for maintenance is also recorded in the Web server log, you would like to exclude such accesses to analyze the usage trend from the standpoint of general users. This section explains how to analyze with specific internal subnetworks (IP address groups) excluded. By analysis excluding accesses from the specific subnetworks, you can grasp the following information and utilize it for the Web site operation. - How many times do general users access? - Which content do general users often visit to? Environment settings The following environment setting is required to make analysis excluding specific subnetworks. - Setting for option definition file
112 Setting an option definition file Define the subnetworks that you want to exclude from the analysis targets in the specific subnetwork analysis exclusion definition block in the option definition file. See For information about the storage location of the Option Definition File refer to " File storage location". The following gives an example of analysis excluding the following subnetworks to to Exclusion target subnetwork range In the above case,the definition of the specific subnetwork analysis exclusion definition block in the option definition file is as follows: [SubnetExcepted] Note The contents that are specified in the specific subnetwork analysis exclusion definition block in the option definition file become valid when the use trend DB registration engine is started next. Out of these contents, the information that has already been registered in the use trend DB does not become valid. See For details about the settings, refer to " File internal format (definition block with analysis of a specific subnetwork omitted)" Analysis using the usage analysis window The specification in the specific-subnetwork analysis exclusion definition block is processed by the usage DB register engine. So the analysis result before the definition is made remains the same as this function is not used. Analysis using the use trend analysis window excludes access from the subnetworks that are specified in the specific subnetwork analysis exclusion definition block in the option definition file. Note Out of the contents that are specified in the specific subnetwork analysis exclusion definition block in the option definition file, the information that has already been registered in the use trend DB does not become valid
113 Therefore, if a period that extends to before the definition setting is selected, access from the subnetworks that are specified in the specific subnetwork analysis exclusion definition block is included for analysis If you would like to make analysis with specific URLs excluded The use trend of a Web site may be analyzed. In this case, however, because access to the URL (content) for maintenance is also recorded in the Web server log, you would possibly like to exclude such access to analyze the use trend paying attention to the content for general users. This section explains how to make analysis, excluding access to a specific URL. Analysis excluding access to a specific URL enables the following information to be recognized and utilized for Web site operation. - How much access to the content for general users, excluding access to the URL for maintenance is made? Environment settings The following environment setting is required to make analysis excluding access to a specific URL. - Setting for option definition file Setting an option definition file Define the URL that you want to exclude from the specific URL analysis exclusion definition block in the option definition file. See For information about the storage location of the Option Definition File refer to " File storage location". The following explains how to make analysis excluding access to the URL that Systemwalker Service Quality Coordinator uses on the managed server for processing. URL to be excluded /SQC/cgi-bin/dbtrans.cgi /SQC/cgi-bin/wmAgtMibGet.cgi /SQC/cgi-bin/wslmget.cgi In the above case,the definition of the specific URL analysis exclusion definition block in the option definition file is as follows: [URLExcepted] /SQC/cgi-bin/dbtrans.cgi /SQC/cgi-bin/wmAgtMibGet.cgi /SQC/cgi-bin/wslmget.cgi
114 Note The contents that are specified in the specific URL analysis exclusion definition block in the option definition file become valid when the use trend DB registration engine is started next. Out of these contents, the information that has already been registered in the use trend DB does not become valid. See For details about the setting, refer to " File internal format (definition block with analysis of a specific URL omitted) " Analysis using the usage analysis window The contents that are specified in the specific URL analysis exclusion definition block in the option definition file are processed when the use trend DB registration engine is running. Therefore, analysis using the use trend analysis window becomes useless. Analysis using the use trend analysis window excludes access to the URL that is specified in the specific URL analysis exclusion definition block in the option definition file. Note Out of the contents that are specified in the specific URL analysis exclusion definition block in the option definition file, the information that has already been registered in the use trend DB does not become valid. Therefore, if a period that extends to before the definition setting is selected, access to the specific URL that is specified in the specific URL analysis exclusion definition block is included for analysis. 9.2 Notes This section includes notes to assist you when using the analysis window Date and time Operation when moving to other URL Extension name display Host name/ip address display when DNS conversion is not possible Handling of the URL name to be analyzed Notes on selecting the URL based breakdown from the analysis method box Notes on selecting the URL extension based breakdown from the analysis method box Notes on displaying analysis results of mass log data Date and time In the analysis window, the current date and time are determined based on the client machine date and time (including the year, month, and day). For example, in the initial window immediately after starting the analysis window, the "Summary" window of the week: day unit including the current year, month, and day is displayed. "Current" in this case means the current date and time on the client machine
115 9.2.2 Operation when moving to other URL If the Web browser used to operate the analysis window is moved to another Web page (URL), the analysis window terminates. If the Web browser returns to the analysis window Web page as a result of using Back or Next on the Web browser, the analysis window is restarted. In this case, settings and the standard mode in the Setup page do not store the former states, just as in the case where the analysis window is terminated and then restarted (Default values are set) Extension name display The display of the extension name depends on the final qualifier in the URL name. The following table lists the details: Final qualifier of URL If the URL name is a.html If the URL name is a.gif If the URL name is a.gif If the URL name has no extension If the URL name is a directory name If the URL name is a domain name of the server If the pathname cannot be obtained Displayed extension name html gif GIF <FILE> <DIRECTORY> <HOMEDIRECTORY> <NOTHING> Host name/ip address display when DNS conversion is not possible If "SearchDNS=yes" is specified in the Usage DB Environment Definition File, host information (host name or IP address) for the client stored in the analysis target log is DNS-converted. If, however, the conversion fails for some reason, the display is as listed below: Host information of the client stored in logs DNS conversion Displayed host name Displayed IP address IP address Success Host name IP address Failure IP address IP address Host name Success Host name IP address Failure Host name Host name Handling of the URL name to be analyzed The URL name of the log file to be analyzed is analyzed faithfully. That is, uppercase and lowercase characters of the string contained in the URL name are distinguished and handled as different URL names Notes on selecting the URL based breakdown from the analysis method box If you select the URL based breakdown from the analysis method box, only the URL names corresponding to the extensions specified in "RequestURLSuffix" of the Usage DB Environment Definition File are displayed
116 9.2.7 Notes on selecting the URL extension based breakdown from the analysis method box If you select the URL extension based breakdown from the analysis method box to execute advanced analysis based on URL, and the extension for advanced analysis is not specified in "RequestURLSuffix" of the Usage DB Environment Definition File, the extension excluded from analysis and "No data in this period" is displayed Notes on displaying analysis results of mass log data If you select the year unit from the period unit box and display analysis results of mass log data, it may take some time before the analysis window is displayed
117 Chapter 10 Monitoring for Tampering with Web Contents The system administrator can use the Contents Tampering Monitor to automatically monitor tampering with Web Contents (hereafter simply referred to as contents) and receive messages if tampering is detected. This chapter explains how to use the Contents Tampering Monitor Overview of Monitoring Environment Settings Registering Monitoring Requirements Registering Contents 10.1 Overview of Monitoring The figure below shows an overview of tamper monitoring. The Contents Administrator registers content information for the Management Server ((1) in the figure) and then uploads the contents to the Web Server ((2) in the figure). The Contents Tempering Monitor, based on the registered content information, checks the contents on the Managed Server ((3) in the figure) and, if tampering is detected, notifies the System Administrator of the event through ((4) in the figure). The figure below shows the internal operations of the Management Server, Managed Server and Contents Administrator's machine. The yellowish portions in the figure show the components of the Contents Tampering Monitor. The operation at (1) in the figure, which is caused when the Contents Administrator executes the Contents Publish Notifier, stores Contents Original Snapshot in the Snapshot DB. The operation at (3) in the figure, which is caused by periodical activation scheduled on the Management Server, compares the Web Contents (snapshot) and Contents Original Copy (snapshot in the Snapshot DB) for inspection. The operation at (4) in the figure is caused when tampering is detected in the operation at (3)
118 Note The Snapshot Collecting Program (CGI) is a component installed together with SQC-A. For this reason, SQC-A must be installed on the Managed Server to be monitored. Snapshots are generated based on the binary of the content, so if, for example, code conversion is performed using the operation in step 2 above, a discrepancy will arise between the registered binary for the content original and the binary for the public content, and tampering will be detected. In order for tamper monitoring to operate correctly, take care during the operation in step 2 of the figure above to ensure that no discrepancy arises between the registered binary for the content original and the binary for the public content. Point " Tampering inspection program " are record and sent as follows: - The operating status is recorded in the Contents Tampering Monitor. The record can be referenced through the " Action Statement window" - Tamper detection is recorded in the Send Log Path - A tamper detection message is recorded in the system log (event log under the Windows version or syslog under the Solaris version). - A tamper detection message is sent to the Alert Address and CC
. However, the function cannot distinguish operations correctly if they are performed in reverse order (operation (1) after operation (2)).")
119 Point - The Contents Tampering Monitor has a function that can correctly distinguish negligence from tampering even if the Contents Administrator forgets to perform the operation at (2) in the figure after the operation at (1). However, the function cannot distinguish operations correctly if they are performed in reverse order (operation (1) after operation (2)). Also, the function cannot distinguish correctly if operation negligence continues. - The load on the Web Server is only snapshot collection for contents (minimum load). - Because of a configuration for remote monitoring from the Management Server, even multiple Web Servers can be monitored in a batch. The following sections explain the tamper monitoring procedures based on the figure right above Environment Settings Set up the environment as follows: 1. Set up the environment for sending tamper detection alert ( ). This section explains how to set up the environment shown below as an example Setting the send environment for tampering detection reports
120 Setting the send environment for tampering detection reports Open the Environment Properties window as follows: 13.1 Viewing the Environment Settings Window -> Contents Tampering Monitor window (menu window) -> Environment Properties window To implement the case of the previous example, set data as shown below and click the [OK] button See For details of the window, refer to " Environment Properties window." 10.3 Registering Monitoring Requirements Register monitoring requirements as follows: 1. Specify the content publish location. 2. Specify the tamper checking frequency. 3. Specify the tamper detection notification destination. This section explains how to register monitoring requirements for the following, as an example

121 Point If there are two or more Contents Administrators, the monitoring requirements should be registered for each Contents Administrator. This enables each tamper detection alert to be sent to the right administrator. If monitoring requirements are registered by the level of importance of contents, the tamper checking frequency can be varied with the level of importance Specifying a content publish location Specifying an execution frequency for tampering inspection Specifying a tampering detection reporting destination Specifying a content publish location Open the Tamper Monitor URL Entry window as follows:
122 13.1 Viewing the Environment Settings Window -> Contents Tampering Monitor window (menu window) -> Tamper Monitor URL Entry window To meet the previous example, set data as shown below: See Please refer to " Tamper Monitor URL Entry window" about the details of a screen. Note The behavior in step 3 of the figure in "10.3 Registering Monitoring Requirements" is performed on the managed server information (the URL for the agent) that matches the host information for the URL set up here. The host information of the URL specified here should be the same as the host information of the agent URL specified in the managed server information. - If a host name is set in the host component of the agent URL of the managed server, a host name should also be set in the host component of this URL. - If an IP address is specified in the host component of the agent URL of the managed server, an IP address should also be set in the host component of this URL
123 Note also that because only one IP address can be specified for a single managed server, in the case of a name-based virtual site, only one virtual site can be monitored using a single IP address. Make sure that the host information for the URL set up here matches the host information for the URL of the agent in the managed server information. The part of the managed server information that needs to be checked has been circled in red in the screen shot below Specifying an execution frequency for tampering inspection To implement the case of the previous example, make an additional setting as shown below:
124 See - Normally, it is enough to perform tamper checking once an hour. If needed, however, the tamper checking interval can be shortened. For more information about this, refer to " If you would like to make tampering inspection with a shorter interval". - Tamper checking can also be performed at optional points. For more information about this, refer to " If you would like to make tampering inspection at an optional time" Specifying a tampering detection reporting destination To implement the case of the previous example, make additional settings as shown below:
125 This ends basic settings. Click the [OK] button. Point The user can check the following to make sure that the settings are correct (when the data specified for "Tamper Monitor URL" indicates a directory): 1. Prepare dummy content. 2. Register dummy content information by referring to " Notifying content publish (contents administrator job)". 3. Upload the dummy content to the Web Server. 4. Perform tamper checking by referring to " If you would like to make tampering inspection at an optional time". 5. Delete the dummy content on the Web Server. 6. Perform tamper checking again by referring to " If you would like to make tampering inspection at an optional time". 7. Open the " Action Statement window" to check that the deletion of the dummy content was detected. If it was detected, the specification of the content publish location is correct. 8. Check that reached the tamper detection alert address. If indicating the deletion of the dummy content reached, the specification of the tamper detection alert notification destination is correct
126 9. Delete the registration of the dummy content information by referring to " Notifying content publish (contents administrator job)" Registering Contents Register contents according to the following procedure: 1. Distribute a Contents Publish Notifier. 2. Notify contents publish (contents administrator job) This section explains how to make settings for the following case as an example

127 Point Contents that are possibly tampered are home pages and other frequently accessed pages. Narrowing the tamper checking targets to these contents can minimize the load on the Web Server and enables effective tamper monitoring Distributing a content publish notifier Notifying content publish (contents administrator job)
128 Distributing a content publish notifier Before the Contents Administrator registers contents information, the System Administrator must distribute a Contents Publish Notifier (MpupdtCntnts command) to the Contents Administrator. For the location of the notifier to be distributed, refer to " MpupdtCntnts command location". Note For distribution, select the proper component for the platform used by the contents administrator Notifying content publish (contents administrator job) Before registering contents information, the Contents Administrator must receive a Contents Publish Notifier (MpupdtCntnts command) from the System Administrator. The following explanation is based on the following work environment of the Contents Administrator. - Platform: Windows - MpupdtCntnts command storage directory: C:\Tool To implement the case of the previous example, enter the command at the command prompt as shown below. For the MpupdtCntnts command specifications, refer to " MpupdtCntnts command specifications". C:\> Tool\MpupdtCntnts -m p 80 -u -f C: \OriginalHTML\index.html Update complete C:\> Tool\MpupdtCntnts -m p 80 -u -f C: \OriginalHTML\image\mark.gif Update complete Point In the above example, the MpupdtCntnts command is entered for each piece of content. Contents can be registered in a batch if a content list file is created. For more information, refer to MpupdtCntnts command specifications
129 Part 4 User s Guide Chapter 11 Analyzing Web Site Usage Chapter 12 Evaluating the Usage Chapter 13 Using the Contents Tampering Monitor

130 Chapter 11 Analyzing Web Site Usage This chapter explains how to use the Web site s Trend Viewer Usage DB Engine Analysis Window CSV Output SQC Extended Log Collection Navigation Guide for the Usage Analysis Window 11.1 Usage DB Engine This section gives an outline of each Usage DB engine of Trend Viewer and briefly explains its operations Usage DB Registration Engine Usage DB Reference Engine Usage DB backup and restore Usage DB Registration Engine Outline The Usage DB Registration Engine registers with the Usage DB the logs related to the Web site and Proxy server running on the system on the installation machine. The Usage DB Registration Engine references various logs periodically, to fetch differences between the old and new portions of data required for update, and stores them in the Usage DB Start operation To carry out an analysis, the log data related to the Web service must be registered with the Usage DB in advance. To support additions of various logs, a setting must be made such that the Usage DB register engine is started periodically to register additions of logs with the Usage DB one by one. This setting is not done in the installation. So in order to use the Usage Analysis Function, start operation must be set. The method is explained as follows. Starting the service
131 [Windows] The Usage DB Registration Engine is a service (name: "Systemwalker SQC dbregsv") that is accessed using the Services dialog via Windows Control Panel on the installation machine. The service is registered during installation, and operates at each starting time set then. To carry out an analysis, this service must be started in advance in the following manner: Log in with the account with Administrator authority and "Start" this service (name: "Systemwalker SQC dbregsv") in the Services dialog accessed from Windows Control Panel. [UNIX] The Usage DB Registration Engine is operated at each starting time set during installation with the command (dbregmng command) started by the clock daemon (Solaris:cron/Linux:crond). Registration with the clock daemon is the following procedure: 1. Login Log in as a superuser. 2. The crontab file editing and reflection Use the crontab command to register the startup definition of the Usage DB Registration Engine in the crontab file. The following is an example of using the crontab command: # crontab -e If the above command is executed, the editor is started so that the crontab file can be edited. For example, add the following startup definition to start at the 15th minute of each hour. # FJSVssqc 15 * * * * /opt/fjsvssqc/bin/dbregmng Save the edited contents and terminate the editor. Changes are automatically reflected in the clock daemon Stop operation Perform the following operation to stop the Usage DB Registration Engine. Note If the Usage DB Registration Engine is stopped, data can no longer be registered with the Usage DB. Stopping the service [Windows] To stop the Usage DB Registration Engine and to suspend the Web service analysis temporarily, stop the Usage DB Registration Engine in the following manner: To stop the Usage DB registration service, log in with the account with the Administrator authority and then "Stop" this service (name: "Systemwalker SQC dbregsv") in the Services dialog accessed from Windows Control Panel. Point If the Startup type of the service is "Automatic" the service is automatically "started" when the installation machine is restarted
132 If the service should remain stopped after restarting the installation machine, change the service s Startup type to "Manual". [UNIX] To stop the Usage DB Registration Engine and to suspend the Web service analysis temporarily, do the following procedure: 1. Login Log in as a superuser. 2. The crontab file editing and reflection Use the crontab command to disable (comment out) the startup definition of the Usage DB Registration Engine in the crontab file. The following is an editing example: # crontab -e If the above command is executed, the editor is started so that the crontab file can be edited. For example, disable the startup definition as shown below: # FJSVssqc #15 * * * * /opt/fjsvssqc/bin/dbregmng Save the edited contents and terminate the editor. Changes are automatically reflected in the clock daemon Start up time Usage DB register engine's start time is in 15 minutes each hour by default. Do the following if the start time and the period between start should be changed. [Windows] 1. Open the definition file by notepad or other text editor. The path is as follows: <installation directory (variable)\control\config 2. Edit the [DatabaseRegisterEngine] section. For example, once a day, start at 12:00 can be defined as follows: [DatabaseRegisterEngine] start = day(12:00) Specify the start time in the "start". The following are the options. <Option> hour(mm) day(hh:mm) <Meaning> every hour every day
133 The token "MM" and "HH" is the start time, and can be specified with the following value: HH MM <token> <value> integer(hour) integer(minute) 1. Save the content and close the editor. 2. Restart the usage DB register engine service. For the method to restart, refer to " Stop operation " and " Start operation". [UNIX] 1. Login Log in as a superuser. 2. The crontab file editing and reflection Use the crontab command to register the startup definition of the Usage DB Registration Engine in the crontab file. The following is an example of using the crontab command: # crontab -e If the above command is executed, the editor is started so that the crontab file can be edited. For example, add the following startup definition to start at once a day and 12:00. # FJSVssqc * * * /opt/fjsvssqc/bin/dbregmng Save the edited contents and terminate the editor. Changes are automatically reflected in the clock daemon URL extensions valid for analysis Extensions that are valid for analysis in the Usage DB Registration Engine are those specified in RequestURLSuffix of " File internal format (analysis target server definition block) " in the Usage DB Environment Definition File. If nothing is defined, the Usage DB Registration Engine adopts the following default values: - html - htm - shtml - shtm - stm - cgi - asp - pl
134 - tcl - sh Space estimation in the Usage DB The usage DB is created inside the server directory together with the information directories and management files. Point Server directory is created with the name specified to the Symbol of the analysis target server definition block in the Usage DB Environment Definition File. The estimation of the space for one server directory is as follows: about 60% of the analysis target log size Note The space of the usage DB varies depending on the following conditions: - URL length - The number of contents - The number of users - The count of request - Analysis contents (DNS search, Referer, User agent, etc) The usage DB space may get 1.5 time larger depending on these conditions. Thus it is recommeded that the estimation should be made periodically. Besides, it is also recommeded that the uncessary (old) usage DB be backuped or removed periodically if the the usage analysis function is used continously. See For information about the backup, removal of the usage DB, refer to " Usage DB backup and restore" Usage DB switching The Usage DB Registration Engine creates a new Usage DB (dbyyyymmdd_nn, exyyyymmdd_nn) periodically to back up the Usage DB. This is called "Usage DB switching". The Usage DB switching is performed in accordance with the settings in the Usage DB Environment Definition File "DatabaseConfig." For details of the settings of the Usage DB Environment Definition File, refer to " Usage DB Environment Definition File" Notes on use of Usage DB Registration Engine
135 When stopping the analysis target server Stop the Usage DB Registration Engine. For information on the stop of the Usage DB Registration Engine, refer to " Stop operation ". When stopping the log collection on the analysis target server Stop the Usage DB Registration Engine. For information on the stop of the Usage DB Registration Engine, refer to " Stop operation ". When changing the log format on the analysis target server Since the Usage DB Registration Engine processes logs in accordance with the log format defined in the Usage DB Environment Definition File, processing may not be possible if logs in different formats are mixed. To change the log format, separate the log files and then set the Usage DB Environment Definition File again. Character code of the logs In processing of analysis target log files, the Usage DB Registration Engine assumes that logs are stored with the character code and line feed code conforming to the operating system that is running. Their possible combinations are as follows: [Windows] Character code ASCII Line feed code CR + LF [UNIX] Character code ASCII LF Line feed code Note that, if the combination is different from the above, correct processing cannot be performed. Especially, you must take care when handling network files on a remote host. Handling logs that do not contain any line feed code The Usage DB Registration Engine handles logs that do not contain any line feed as incomplete logs and excludes them from processing Usage DB Reference Engine Outline The Usage DB Reference Engine is positioned between the Analysis window and Usage DB, and provides an interface (using the HTTP communication via a Web server application) to extract data from the Usage DB for the Analysis window

136 Start operation To carry out an analysis on the Analysis window, a setting must be made such that the Usage DB Reference Engine is started in advance. Point In case of management server operation, do the start operation only on the management server. It is not necessary to do this setting on the managed server. Starting the service [Windows] The Usage DB Reference Engine, a service (name: "Systemwalker SQC dbrefsv") that can be operated in the Services dialog accessed via Windows Control Panel on the installation machine, operates for each request to the Usage DB reference port. This service is registered during installation. To carry out an analysis, this service must be started in advance in the following manner: Log in with account with the Administrator authority and "Start" this service (name: "Systemwalker SQC dbrefsv") in the Services dialog accessed via Windows Control Panel. [Solaris] The Usage DB Reference Engine is operated for each request to the Usage DB reference port set during installation with the command (dbref command) started by the Internet service daemon (inetd). Register the Internet service daemon on the following server. Operation method Management server operation Managed server operation Object server Manager Agent Point Register the Internet service daemon on the server where the use trend database has been registered
137 - Use a management server operation if the security of the agent is to be taken into account. - For management server operations, it is unnecessary to register to the Internet service daemon on the agent. - If the management server itself is a public server, or if managed server operations are being used, the dbref command can be registered with the Internet service daemon, but this involves a significant security risk. Take additional measures (such as TCP wrappers) to ensure that security is maintained. Make settings (with TCP Wrapper, etc) that dbref command can only be accessed from the local server Use the following procedure to register the dbref command with the Internet service daemon, as it is not registered when SQC-A is installed. Note This procedure does not include settings for performing access control. Access control setup methods are different depending on the application used to control access. Refer to the manual for the application being used. 1. Login Log in as a superuser. 2. /etc/services or /etc/inet/services file editing Use an editor to register the Usage DB registration port definition in the /etc/services or /etc/inet/services file. For example, in the case of 2365, add the following definition: # FJSVssqc dbref 2365/tcp Refer to " Usage DB reference port number" for details on the port number for looking up the usage database. 3. /etc/inetd.conf or /etc/inet/inetd.conf file editing Use an editor to edit the /etc/inetd.conf or /etc/inet/inetd.conf file. If the network environment is the Internet, add the following definition: # FJSVssqc dbref stream tcp nowait nobody /opt/fjsvssqc/bin/dbref dbref -a If the network environment is an Intranet, add the following definition: # FJSVssqc dbref stream tcp nowait nobody /opt/fjsvssqc/bin/dbref dbref
138 4. Reflection of changes - At before Solaris 9 OS The change is reflected in inetd by searching for process ID of inetd by using the ps command and the grep command, and using the kill command afterwards. The operation example is as follows. # ps -A grep inetd process ID # kill -HUP process ID - When OS is Solaris 10 The change is reflected by using the inetconv command.the operation example is as follows. # inetconv [Linux] The Usage DB Reference Engine is operated for each request to the Usage DB reference port set during installation with the command (xinetd or dbref command) started by the Internet service daemon (inetd). Registration with the Internet service daemon is carried out during installation. If, however, this engine has not been installed for some reason, register it by the following procedure: - For xinetd 1. Login Log in as a superuser. 2. /etc/services file editing Use an editor to register the Usage DB registration port definition in the /etc/services file. For example, in the case of 2365, add the following definition: # FJSVssqc dbref 2365/tcp See Refer to " Usage DB reference port number" for details on the port number for looking up the usage database. 3. /etc/xinetd.d/dbref file creating Use an editor to create a dbref file under /etc/xinetd.d. If the network environment is the Internet, the contents of the dbref file are as follows. Set the IP address of the local host to xxx.xxx.xxx.xxx
139 # FJSVssqc service dbref { socket_type = stream wait = no user = nobody server = /opt/fjsvssqc/bin/dbref only_from = xxx.xxx.xxx.xxx } If the network environment is an Intranet, the contents of the dbref file are as follows. # FJSVssqc service dbref { socket_type = stream wait = no user = nobody server = /opt/fjsvssqc/bin/dbref } 4. Reflection of changes Use the kill command so that changes are reflected in xinetd. The following is an operation example: # kill -USR2 `cat /var/run/xinetd.pid` - For inetd 1. Login Log in as a superuser. 2. /etc/services file editing Use an editor to register the Usage DB registration port definition in the /etc/services file. For example, in the case of 2365, add the following definition: # FJSVssqc dbref 2365/tcp
140 See Refer to " Usage DB reference port number" for details on the port number for looking up the usage database. 3. /etc/inetd.conf file editing Use an editor to edit the /etc/inetd.conf file. If the network environment is the Internet, add the following definition: # FJSVssqc dbref stream tcp nowait nobody /usr/sbin/tcpd /opt/ FJSVssqc/bin/dbref If the network environment is an Intranet, add the following definition: # FJSVssqc dbref stream tcp nowait nobody /opt/ FJSVssqc/bin/dbref dbref 4. /etc/hosts.allow, /etc/hosts.deny file editing (If the network environment is the Internet) Use an editor to edit the /etc/hosts.allow file and then add the following definition to the head of the file. Set the IP address of the local host to xxx.xxx.xxx.xxx. # FJSVssqc dbref : xxx.xxx.xxx.xxx Use an editor to edit the /etc/hosts.deny file and then add the following definition to the head of the file. Set the IP address of the local host to xxx.xxx.xxx.xxx. # FJSVssqc dbref : ALL EXCEPT xxx.xxx.xxx.xxx Reflection of changes Use the kill command so that changes are reflected in inetd. The following is an operation example: # kill -HUP `cat /var/run/inetd.pid` Usage DB reference port number The default port number used for TCP/IP communication by the Usage DB Reference Engine is as follows: Port number 2365 If this port number is being used by other application so it has been changed, use the changed port number
141 Stop operation Perform the following operation to stop the Usage DB Reference Engine. Note If the Usage DB Reference Engine is stopped, the Usage DB is no longer referenced. Stopping the service [Windows] To suspend the Usage DB and to stop the Usage DB Reference Engine temporarily, do the following procedure: Log in to Windows with account with Administrator authority and then "Stop" this service (name: "Systemwalker SQC dbrefsv") using the Services dialog accessed via Windows Control Panel. Point If the startup type of the service is "Automatic" the service is automatically "started" when the installation machine is restarted. If the service should remain stopped after restarting the installation machine, change the startup type to "Manual". [Solaris] To suspend the Usage DB and to stop the Usage DB Reference Engine temporarily, do the following procedure: 1. Login Log in as a superuser. 2. /etc/services or /etc/inet/services file editing Use an editor to disable (comment out) the Usage DB registration port definition in the /etc/services or /etc/inet/ services file. The following is an editing example: # FJSVssqc #dbref 2365/tcp 3. Edit of "/etc/inetd.conf" or "/etc/inet/inetd.conf" file The edit example deletes the following parts. # FJSVssqc dbref stream tcp nowait nobody /opt/fjsvssqc/bin/dbref dbref -a Or, the following parts are deleted. # FJSVssqc
142 dbref stream tcp nowait nobody /opt/fjsvssqc/bin/dbref dbref 4. Reflection of change - At before Solaris 9 OS The change is reflected in inetd by searching for process ID of inetd by using the ps command and the grep command, and using the kill command afterwards. The operation example is as follows. # ps -A grep inetd Process ID # kill -HUP Process ID - When OS is Solaris 10 Inetd is stopped. # svcadm disable -t inetd The dbref service is deleted. # svccfg delete -f dbref/tcp "/var/svc/manifest/network/dbref-tcp.xml" is deleted. # rm /var/svc/manifest/network/dbref-tcp.xml Inetd.conf is reactivated. # svcadm enable inetd [Linux] The use..situation DB.. reference engine is started, and doesn't reside every time the use state is analyzed. The use state analysis function is not used, and when the reference engine is invalidated, use state DB is operated as follows. - For xinetd 1. Login Log in as a superuser. 2. /etc/services file editing Use an editor to disable (comment out) the Usage DB registration port definition in the /etc/services file. The following is an editing example: # FJSVssqc #dbref 2365/tcp
143 3. Reflection of changes Use the kill command so that changes are reflected in xinetd. The following is an editing example: # kill -USR2 `cat /var/run/xinetd.pid` - For inetd 1. Login Log in as a superuser. 2. /etc/services file editing Use an editor to disable (comment out) the Usage DB registration port definition in the /etc/services file. The following is an editing example: # FJSVssqc #dbref 2365/tcp 3. Reflection of changes Use the kill command so that changes are reflected in inetd. The following is an editing example: # kill -HUP `cat /var/run/inetd.pid` Usage DB backup and restore Backing up the Usage DB The Usage DB is created in a variable file storage directory. ** < > is a directory. (*1) The server directory is created with the name specified as Symbol in of the Analysis Target Server Definition Block of the Usage DB Environment Definition file. (*2) Variables in the directory name of the Usage DB are as follows. The year/month/day is the date on which the Usage DB is switched (created). yyyy Year (1980 -) mm Month (01 to 12)
144 dd Day (01 to 31) nn Serial number (01 to 99) When backing up the usage database, back up all of the files and directories in the server directory above. Note Make sure that the following processes are not running when the usage database is backed up. [Windows] dbregmng.exe dbreg.exe [UNIX] dbregmng dbreg Restoring the Usage DB When restoring the backed up Usage DB, restore it to the same directory as that used for backup. - To restore the backed-up Usage DB in an old period Restore the whole Usage DB directories (dbyyyymmdd_nn, exyyyymmdd_nn) corresponding to the desired period. In this case, do not restore the management files and the Usage DB Information Directories and the SQC Extend-log Usage DB Information Directories under the server directory. Note that if these files and directories are restored, analysis can be performed only for the analysis period the same when the back up was made. - To restore the backed-up Usage DB because an error occurred in the current Usage DB Restore all of the files in the backup server directory to the corresponding server directory. Point Before restoring the database, first back up the server directory on the server where the error occurred. Then delete everything in the server directory on the server where the error occurred before restoring the database. Note Make sure that the following processes are not running when the usage database is restored. [Windows] dbregmng.exe dbreg.exe
145 [UNIX] dbregmng dbreg Deleting the Usage DB If the old Usage DB becomes useless and should be deleted, delete the whole directory within the useless period (dbyyyymmdd_nn, exyyyymmdd_nn). Note - The analysis for the period covered by the deleted usage DB will become unavailable. So it is recommended that you backup the Usage DB before you delete it. For information on backing up the Usage DB, refer to " Backing up the Usage DB". - Do not delete any other files or directories. Usage DB may get damaged. Note Make sure that the following processes are not running when the usage database is deleted. [Windows] dbregmng.exe dbreg.exe [UNIX] dbregmng dbreg 11.2 Analysis Window This section gives an outline of the usage analysis window. See For a details description of the operations of the usage analysis window, refer to the online help Usage DB Reference Engine Start operation Stop operation Configuring the analysis window Analysis window options Operation of analysis page Notes
146 Outline The analysis window is a graphical user interface (GUI) for the user and operates on the client machine. The analysis window is positioned between the user and the Usage DB Reference Engine. It presents data analysis results to the user from a variety of viewpoints, in graphical and tabular forms. The analysis window operates as a Web page (Java TM applet) on the user s Web browser. See For information about Java TM applet, refer to "3.2 Environment Settings procedures". If any operation such as the analysis type or analysis method is specified on the analysis window, the Usage DB Reference Engine is instructed to collect data from the Usage DB in which analysis results are stored. For information on operations of the analysis window, refer to " Operation of analysis page" Start operation The Usage Analysis Windows is a Web page (viewer.html) that can be started from the [Web Site Management] window following the operation described below: 1. Click the [Usage Analysis] button on the top page to display the agent selection page. 2. Select the agent to be analyzed and click the [OK] button. Note Do not edit the source file for viewer.html Before startup To use the analysis window, the following two Usage DB engines must be started in advance. For information on operations for starting each engine, refer to "4.2 Environment Settings for Usage Analysis" (Managed Server), "5.2 Environment Settings for Usage Analysis" (Management Server) and "11.1 Usage DB Engine". - Usage DB registration engine - Usage DB reference engine Point To start the analysis window, this Web page (viewer.html) must be registered with the Web server in advance so that it can be referenced. For details of the registration, refer to "4.1 Settings for Web Server"(Managed Server) and "5.1 Settings for Web Server"(Management Server)
147 Start Operation Do the following operation to start the Usage Analysis Window with the [Web Site Management] window. 1. Click the [Usage Analysis] button on the top page to display the agent selection page. 2. Select the agent to be analyzed and click the [OK] button. The initial window following startup of the analysis window is the following analysis page: Box Analysis target server Data type Analysis method Status Server defined at the start of " Usage DB Environment Definition File". Summary (overall statistical table) None (For a summary, the analysis method cannot be selected) Period unit Day: hour unit including the current year/month/day (*1) Note *1) For information about the current year/month/day, refer to " Date and time" Stop operation The analysis window can be closed by the following method: - Close the Web browser that operates the analysis window Configuring the analysis window The following explains a typical analysis window configuration, name (abbreviated name) of each part and contents. For details of the operations, refer to the following explanations and online help Analysis window features After data is analyzed, an analysis page like the one below is displayed. The initial window following startup is a summary window. No graph is displayed. In this section, explanation is given with the analysis page by client host name of the request situation as a sample

148 Description of the analysis window 1. Analysis target server box - Select the server to be analyzed. If you select a server from the drop-down list, a data analysis is carried out and the "summary window" is displayed. At this point, a drop-down list of the data type corresponding to the selected server type (Web server, Proxy server or Web Site group) is also provided in the data type box. - The server name displayed in this box is the name specified in the Name operand of the " Usage DB Environment Definition File" of the " File internal format (analysis target server definition block)". Note that if the name is too long, the first part of the name is displayed. 2. Data type box Select the type of analysis data required. 3. Analysis method box From the drop-down list, select the required analysis method, to have data of the type selected in <2> analyzed from that point of view. The content of the analysis page that is displayed depends on the selected analysis data type and analysis method. For further information, refer to " Analysis window options". 4. Period unit box Select the period unit for analysis. When you select the period unit for data analysis from the drop-down list, the display of 5. Period selection list changes according to the selected unit. Selecting the period unit for data analysis does not start data analysis
149 5. Period selection list - Select the interval for which data is to be analyzed. 6. Up and Down buttons - To scroll the period list use these buttons: Up - to view earlier periods, click this button at the top of the list Down - to view later periods, click this button at the bottom of the list. 7. Analysis information - The following information about the analysis results is displayed: This part is intended for display only and no operation can be performed. Information Analysis period Extraction name/graph display target name Explanation The period selected in the period selection list is displayed. Only for the following analysis pages, the following contents are displayed below the analysis type name respectively: Advanced analysis page: Displays the extraction names. Response analysis page: Displays graph display target names. The extraction name is a name selected from a line of a table during advanced analysis. For details, refer to "Carrying out advanced analysis" in " Performing data analysis". The graph display target name is a URL name or client name displayed in a graph by selecting a line from a table. For details, refer to " Response analysis page ". 8. The legend - Color codes for the graph and their contents are displayed. If a string for explaining the content is too long, it is displayed in abbreviated form at the top of the graph. For information on the correct content, refer to the table. 9. Numeric axis (vertical scale) - The graph can be re-sized vertically by dragging on the top border with the mouse. Operation Drag up Drag down Double click Result Enlarged (The graduation markings are enlarged) Reduced (The graduation markings are reduced) Scale automatically adjusted (reset to its initial size)
150 10. Time axis (horizontal scale) - The graph can be re-sized horizontally by dragging on the right border with the mouse. Operation Drag to the right Drag to the left Double click Result Enlarged (The graduation markings are enlarged) Reduced (The graduation markings are reduced) Scale automatically adjusted (reset to its initial size) 11. Graph form - Specify this to change the type of graph displayed. Note that the graph forms available for selection depends on the analysis type. 12. Previous period value box - The values for the previous period can be shown or hidden ('No display'). When you select from the drop-down list, values for the previous period are plotted as a line graph, depending on the selection. 13. Title line (Table header) - Displays the title of each column of the table. 14. Data line The total data of the analysis period is displayed in descending order in default. In the order column (the leftmost column), the graph legend is displayed in addition to the numbers. - For the following analysis page, a line selection can be made (by clicking a line) and the action is as listed below: Analysis page Analysis page in which an advanced analysis can be made Analysis data type: response report Action when a line selection is made A line selection can be made (A line can be clicked). An advanced analysis is performed by selecting an advanced analysis destination box. A line selection can be made (A line can be clicked). If a line selection is made, a graph of the selected line is displayed. 15. Traffic total field - Displays the total of the accumulated data. 16. Advanced analysis destination box - Select the analysis method for the advanced analysis destination. If you click the advanced analysis destination box after clicking a 'Data line' and select a destination from the drop-down list, a data analysis (advanced analysis) is performed and a graph or table is displayed. The advanced analysis destination box is displayed only on pages where advanced analyses can be performed
151 17. Number of lines of the table - Select here to modify the number of lines in the table of the analysis window. 18. Display Order - Sclect here to modify the display order of the analysis window. 19. Help 20. Sclect here to display the online help in addition to the analysis window Analysis window options In the analysis window, results of the availability of the following server types (analysis target server types) are displayed: - Web server - Proxy server - Web site group The following eight types of analysis results (analysis data types) are available. All eight types can be displayed on the Web server and six types can be displayed on the Proxy server. - Summary (total of each status of the analysis target server) - Session status - Request status - Traffic status - Cache status - Error status - Response status (Web server and Web site group) - Page navigation status (Web server only) On the analysis window, results edited from a variety of analytical points of view (such as URL or client based) are displayed as graphs or tables for each analysis data type. Regarding part of the analysis pages, supplementary remarks are provided in order. - Traffic display - Response analysis page Traffic display On each page that displays traffic status analysis and other traffic quantity (such as the total traffic quantity and total successful request traffic quantity), the traffic quantity is displayed in unit of kilobyte (KB). Traffic quantity equal to or greater than 1 byte and less than 1,000 bytes is displayed as 1KB
152 Response analysis page The response analysis differs from other analysis pages as follows: Relationship with SQC extended log collection In response analysis, data is analyzed based on the data accumulated in the SQC extended log file by SQC extended log collection. If no SQC extended log collection is created, no data analysis result can be obtained even if an analysis of this data is performed. Display data The following values are displayed on the response analysis pages. In tables, data is displayed in descending order of average time (descending order from the more delayed average response). - Average (average response time in the analysis period) - Maximum (longest [slowest] response time in the analysis period) - Minimum (shortest [fastest] response time in the analysis period) The following table lists the display unit and the number of digits: Item Unit Number of digits Range to be displayed If the display range is exceeded Second Meaning 4-digit integer and two decimal places (Number rounded to second decimal place) 0.01s to 3,599.99s (less than one hour) (Less than 10ms is displayed as 0.01s) Displayed as 1 hour or more In the case of one hour ( seconds), "1 hour or more" is displayed but the actual value is used for the average value. Graph display/switching In contrast to other analysis pages, the response analysis pages provide for the average, maximum and minimum of one selected line (one URL or client) to be displayed as a graph. By default, the graph for only the URL or client whose average time is Top1 (first line in the table) is displayed. After selecting a line from a table, the graph can be switched to display details of the selected line. In the analysis information section (above the graph) of the analysis page, the name (URL name or client name) selected from a table is displayed below the analysis type name as the graph display target name. Note Note that this operation is the same as that in "Carrying out advanced analysis" in " Performing data analysis" described later, but no advanced analysis is carried out for response analysis
153 Operation of analysis page Performing data analysis When data analysis is performed, the analysis page displayed (or updated) is that matching these selected values: "analysis target server type", "analysis data type", "analysis method" and "analysis period". The following table lists the basic flow of data analysis (A down arrow indicates you continue to the next step. An up arrow indicates you can return to the previous step.): Operation Initial window [1] Analysis window startup Summary of the default analysis target server [2] Analysis target server selection [Analysis target server box] Summary [3] Analysis data type selection [data type box] Analysis method: head of the drop-down list [4] Analysis method selection [Analysis method box] [5] Analysis period change [Period unit box and period selection list] Analysis period: Week: day unit including the current year/month/day Analysis results selected in [3] and [4] [6] Advanced analysis execution Advanced analysis results Data analysis is executed for all the operations shown in the table above. Note that the flow of the operations shown in the table is an indicative procedure only. In practice, the procedure need not always be followed; some operations might be omitted or the order of operations might be interchanged. However, selection of the analysis data type other than the summary in [3] is required for [4] Analysis method selection and an analysis page for which an advanced analysis can be carried out must be displayed for [6] Advanced analysis execution. The following explains each of the above operations. For the "analysis window startup", refer to " Start Operation". Analysis target server selection The analysis target server can be selected from the "Analysis target server box". The server selected here must be defined in the Usage DB Environment Definition File in advance. Analysis target server type The analysis target server types are following three types: - Web server - Proxy server - Web site group By selecting an analysis target server, an analysis data type corresponding to that server type can be selected. [Operation method]
154 1. In the analysis window, click "Analysis target server" and select a server from the drop-down list. Data analysis is executed and the data analysis page is updated. [Initial window] The page displayed immediately after selecting the analysis target server has the following details: Box Analysis target server Data type Analysis method Status Selected server Summary (overall statistical table) None (For a summary, the analysis method box cannot be selected) Period unit Week: day unit including the current year/month/day (*1) Note (*1) For information about the current year/month/day, refer to " Date and time". Analysis data type selection Select the analysis data type from the following eight types (six types for the Proxy server). - Summary (total of each status of the analysis target server) - Session status - Request status - Traffic r status - Cache status - Error status - Response status (for the Web server and the Web site group) - Page navigation status (for the Web server) The response status can be selected only if the type of the analysis target server is the Web server or the Web site group. The page navigation status can be selected only if the type of the analysis target server is the Web server. By selecting an analysis data type, drop-down lists of the analysis method box corresponding to the server type and analysis data type are provided. [Operation method] 1. Click the "Data type box" and then select an analysis data type from the displayed drop-down list. Data analysis is executed and the data analysis page is updated. [Initial window] The page displayed immediately after selecting the analysis target server has the following details: Box Analysis target server Selected server Status
155 Data type Box Analysis method Selected analysis data type Status First analysis method in the drop-down list However, no analysis method for a summary (For a summary, the analysis method cannot be selected) Period unit Week: day unit including the current year/month/day (*1) Note (*1) For information about the current year/month/day, refer to " Date and time". Selection of analysis viewpoint list. This list includes all methods applicable to the selected "analysis target server type" and "analysis data type". [Operation method] 1. Click the "Analysis method" box and then select the required analysis method. A data analysis is carried out and the data analysis page is updated/displayed. [Initial window] The page displayed immediately after selecting the analysis method has the following details: Box Analysis target server Data type Analysis method Period unit Status Selected server Selected analysis data type Selected analysis method Same period unit/period as that of the previous analysis page Note - If no data analysis result is displayed: If no data is output as a result of data analyses by a variety of operations, a "No data for this period" message is displayed. For other messages, refer to "17.2 Usage Analysis Function". Changing the analysis period When the analysis period is changed, data analysis is performed so that editing results for a number of periods can be displayed. Also, as with the normal analysis page, the analysis period can be changed on the "Summary" window and advanced analysis page,. To change the analysis period, operate "the required period unit from the Unit box", then select "the required period from the Period selection list". When a period is selected from the period selection list, a data analysis is carried out and an analysis page of the edited results is displayed
156 Carrying out advanced analysis Advanced analysis is analysis focusing on a specific URL, clients or error numbers. To perform an advanced analysis, you select a table line from the analysis page and then from the "Advanced analysis destination box you select the analysis method of the advanced analysis destination. The advanced analysis is executed and the editing results extracted from the selected items are then displayed. For example, if you select an arbitrary line from the table in the URL-based analysis page of the session status and select [Breakdown for each client host name] from the "Advanced analysis destination box" an analysis page for each client host name extracted using only the URL name of the line is displayed. On this page, the total sessions for each client of the specific URLs is displayed. Advanced analysis can be performed only for analysis pages listed on the "Pages where the advanced analysis can be carried out". [Window display of the advanced analysis page] In the analysis information section (above the graph), displayed after an advanced analysis is performed, the name selected from a table is displayed below the analysis type name as the extraction name. For example, if an advanced analysis is performed from a URL based analysis page, the selected URL name is displayed there. [Analysis page where the advanced analysis can be carried out] On analysis pages where the advanced analysis can be performed, the table lines can be selected using the mouse. On analysis pages of the response status, the lines of a table cannot be selected. Line selection from a table in the response analysis is intended for graph display switching instead of the advanced analysis. For details, refer to " Response analysis page ". [Operation method] 1. Display an analysis page where the advanced analysis can be carried out. 2. Select a line to be subjected to advanced analysis (extracted) from the displayed table. 3. Click "Advanced analysis destination" and from the drop-down list select the required analysis method for the advanced analysis destination. An advanced analysis (data analysis) is performed and the data analysis page is updated and displayed. The contents displayed are analysis results (analysis page) based on the line selected from the table. [Initial window] The window displayed immediately after the advanced analysis is performed has the following details: Box Analysis target server Data type Analysis method Extraction name Period unit Selected server Selected analysis data type Status Analysis method selected from the "Advanced analysis destination box" Item name selected from the table line Same period unit/period as that of the previous analysis page
157 Period unit box The period box is displayed as "xx:yy" units. "xx" indicates the analysis period and "yy" indicates the unit (time axis unit) for plotting on graphs. For example, if a data analysis is performed as "Week: day" unit, the result is: Table: The total of results of one week. Graph: Data for one week is plotted for each day. Note that the "yy" unit does not apply to the pie chart and "Summary" window. Refer to "Period unit for pie chart and summaries" in the later section. If the unit of analysis period is selected from the period unit box, the display of the period selection list changes so that a specific analysis period can be selected. No data analysis is executed when you select only the period unit. Period selection list In the period selection list, time intervals of the Unit selected on the analysis page are displayed. For example, a 'Week: day unit' setting results in 7-day Sunday-to-Saturday periods being displayed such as "2000/11/7-2000/11/13". When a period is selected from the list, a data analysis of the period is performed and the result analysis page is displayed. The analysis type is the same as that of the previous analysis page. Period units that can be selected and the contents of period selection list when selected Period unit Displayed contents of the period selection list Explanation of format Year: half-year unit yyyy yyyy: year Year: quarter unit Year: month unit Half-year: month unit Quarter: month unit Month: day unit Week: day unit Day: hour unit yyyy yyyy yyyy/1 - yyyy/6 yyyy/7 - yyyy/12 yyyy/1 - yyyy/3 : yyyy/10 - yyyy/12 yyyy/m yyyy/m/d - yyyy/m/d (from Sunday to Saturday) yyyy/m/d m: month (1 to 12) d: day (1 to 31) [Operation method] 1. Click the "Unit" box and select the required unit from the drop-down list. The period selection list is updated according to the unit selected. (No data analysis is performed at this step.) 2. Select a specific period from the period selection list. Data analysis is performed for the selected period and the analysis page is displayed. (As other settings on the left side of the page have not been changed, the analysis type is the same as that of the analysis page previously displayed.)
158 [Period selection list paging] If the required period is not currently displayed in the period selection list, the list can be scrolled to display the required period. You scroll the list by clicking the Up button above the list or the Down button below the list. Click the Up button to scroll to earlier dates. Click the Down button to scroll to later dates. If the upper limit or lower limit of the display period of the period selection list is reached, each paging button becomes disabled (grayed), as follows: - When the upper limit (any period including 1/1/1980) is displayed, the Up button becomes disabled. - When the lower limit (any period including the current year/month/day) is displayed, the Down button becomes disabled. [Future period] No future period can be selected from the period selection list. Since the current year/month/day is determined based on the client machine time, the client machine time must be correct so that the latest analysis results can be obtained. For the client machine time, refer also to " Date and time". Period unit for pie chart and summaries On analysis pages where pie chart is displayed, the total of the selected period is displayed in graphical form. Thus, editing results are the same for the period units shown below. In addition, a graph totaled for one year is displayed. - Year: half-year unit - Year: quarter unit - Year: month unit Displaying values for the previous period as graph Values for the previous period are the comparison reference for graphical analysis. These values are not displayed by default. By selecting the previous period value box, they can be displayed on the graphs. Previous-period values are always plotted as broken lines, regardless of the graph type. Three modes are available for the display of pervious-period values depending on the display/calculation methods. The display mode can be selected for each analysis type. The selected display mode is stored for each analysis type while the analysis window is active. On analysis pages that display a pie chart, previous-period values cannot be displayed. [Display modes for previous-period values] The following display types of previous-period values are available. They can be selected on all analysis pages, except for the "Summary" page and Page Navigation Status page. Display mode for previous-period values Non-display Graph display Previous-period values are not plotted. This is the default state
159 Display mode for previous-period values Display Average value Graph display The total for each unit of one period prior to the analysis period is plotted as the previous-period value. For example, if the analysis period is "week: day unit", the total for Monday of last week is plotted for Monday. The total for one period prior to the analysis period divided by the number of units is plotted as the previous-period value. For example, if the analysis period is "week: day unit", the value for the previous period is "total of the previous week/7". [Operation method] 1. Click the "Value of pre-period" box. 2. Select the required display mode from the drop-down list. The display of values for the previous period is updated according to the display mode selected. If data for the previous period is unavailable, values for the previous period are not plotted. [What is the previous period?] Current period unit Year: half-year unit Year: quarter unit Year: month unit Half-year: month unit First half Second half Quarter: month unit First quarter Second quarter Third quarter Fourth quarter Month: day unit Week: day unit Day: hour unit Previous period The previous year The previous year The previous year The previous period Second half of the previous year First half of the same year The previous period Fourth quarter of the previous year First quarter of the same year Second quarter of the same year Third quarter of the same year The previous month The previous week The previous day Notes This section includes notes to assist you when using the analysis window Date and time In the analysis window, the current date and time are determined based on the client machine date and time (including the year, month and day)
160 For example, in the initial window immediately after starting the analysis window, the "Summary" window of the week: day unit including the current year, month and day is displayed. "Current" in this case means the current date and time on the client machine. No future period can be selected from the period selection list. Here "future" means any time after the client machine time. Since no analysis period can be selected after the current client machine time, the latest editing results cannot be obtained if the client machine time is delayed. For this reason it is important to ensure that the client machine is always set to the correct date and time Operation when moving to other URL If the Web browser used to operate the analysis window is moved to another Web page(url), the analysis window terminates. If the Web browser returns to the analysis window Web page as a result of using Back or Next on the Web browser, the analysis window is restarted. In this case, settings and the standard mode in the Setup page do not store the former states, just as in the case where the analysis window is terminated and then restarted (Default values are set) Extension name display The display of the extension name depends on the final qualifier in the URL name. The following table lists the details: Final qualifier of URL If the URL name is a.html If the URL name is a.gif If the URL name is a.gif If the URL name has no extension If the URL name is a directory name If the URL name is a domain name of the server If the pathname cannot be obtained Displayed extension name html gif GIF <FILE> <DIRECTORY> <HOMEDIRECTORY> <NOTHING> Host name/ip address display when DNS conversion is not possible If "SearchDNS=yes" is specified in the Usage DB Environment Definition File, host information (host name or IP address) for the client stored in the analysis target log is DNS-converted. If, however, the conversion fails for some reason, the display is as listed below: Host information of the client stored in logs DNS conversion Displayed host name Displayed IP address IP address Success Host name IP address Failure IP address IP address Host name Success Host name IP address Failure Host name Host name

161 Handling of the URL name to be analyzed The URL name of the log file to be analyzed is analyzed faithfully. That is, uppercase and lowercase characters of the string contained in the URL name are distinguished and handled as different URL names Notes on selecting the URL based breakdown from the analysis method box If you select the URL based breakdown from the analysis method box, only the URL names corresponding to the extensions specified in "RequestURLSuffix" of the Usage DB Environment Definition File are displayed Notes on selecting the URL extension based breakdown from the analysis method box If you select the URL extension based breakdown from the analysis method box to execute advanced analysis based on URL, and the extension for advanced analysis is not specified in "RequestURLSuffix" of the Usage DB Environment Definition File, the extension excluded from analysis and "No data in this period" is displayed Notes on displaying analysis results of mass log data If you select the year unit from the period unit box and display analysis results of mass log data, it may take some time before the analysis window is displayed CSV Output This section explains the CSV output of the Trend Viewer Outline Start operation Outline The CSV output is a command for outputting data from the Usage DB of the Trend Viewer to a file in the CSV format, depending on the data type Start operation
162 Startup The CSV output is a command (dbprt command) that operates on the installation machine of SQC-A. To start the CSV output, log in to the installation machine of SQC-A and then execute the command in the following path: [Windows] Installation directory \bin\dbprt.exe [UNIX] /opt/fjsvssqc/bin/dbprt 11.4 SQC Extended Log Collection The SQC Extended Log Collection is used to collect and accumulate data not collected by the functions provided by the Web service (such as the Web server). Data accumulated by the SQC Extended Log Collection is called the "SQC extended log". The following SQC extended log can be collected and accumulated Response log Response log Outline The response log is a log in which data on the response time of the CGI program collected in terms of the Web page user is accumulated. The response time is a time interval required to receive a result from the CGI program after the Web page user executes a service that calls the CGI program. For example, in the case of a Web page that executes searches, the response time is a time interval required to display a search result after the search is started. Data is collected and accumulated in the response log by using the following three functions: Data collection function1 Java TM applet (ResLog1.class) that runs on the Web browser. This function is called when the user references the Web pages and executes a service that calls the CGI program; and data when the service is executed is collected. To run this function, refer to Editing Web pages in advance. Data collection function2 Java TM applet (ResLog2.class) that runs on the Web browser. This function is called when the Web page user receives a result of a service that calls the CGI program. This applet collects data when a result is received and then sends the response time to the data accumulation function after calculating it together with data of the data collection function1. To run this function, refer to Editing Web pages in advance

163 Data accumulation function CGI program (reslog.cgi) that runs on the Web server (installation machine). The data accumulation function is automatically started when data collection function2 is started. This function accumulates data sent from the data collection function2 in the SQC extended log file Making settings for log collection This section explains how to make settings for response log collection. Before making settings It is necessary to register the CGI program (reslog.cgi) of the data accumulation function with the Web server in advance so that it can be executed. For details of the registration, refer to "4.1 Settings for Web Server". Information Java TM applet (ResLog1.class, ResLog2.class) is used by the data accumulation function. For information about the Java TM applet, refer to "3.2 Environment Settings procedures". Editing Web pages Incorporate the Java TM applet for log collection into the HTML documents of each Web page that makes log collection. Both of the following two related Web pages must be edited: - Web page that calls a service Web page that calls the CGI program of a service For example, a Web page that executes searches when a keyword is given. - Web page that receives results Web page that receives results (displays results) from the CGI program. For example, a Web page that displays search results. Editing Web pages that call a service Incorporate the Java TM applet (ResLog1.class) of data collection function1 into the HTML document of the Web page that calls a service
164 The following is a sample HTML document. URL in CODEBASE within the sample is described assuming that, like the setting example in "4.1 Settings for Web Server" the physical path of the directory www under the installation directory is registered as the alias "SQC". In the following example, the Java TM applet (ResLog1.class) of the data collection function1 is called when the search button is clicked. <!-- --> <!-- Response log collection page Sample (Part 1) --> <!-- --> <HTML> <HEAD> <TITLE> Search service page (sample)</title> </HEAD> <BODY BGCOLOR=WHITE> <!-- ************ Systemwalker SQC (begin) ****************** --> <APPLET NAME="ResLog1" CODEBASE="/SQC/classes" CODE="ResLog1.class" ARCHIVE="reslog.jar" WIDTH=1 HEIGHT=1> </APPLET> <!-- ************ Systemwalker SQC (end) ******************** --> <CENTER><FONT COLOR=GREEN> Search service page (sample) </FONT></CENTER> <BR><BR> <FONT SIZE=5 COLOR=BLUE> Search service </FONT> <HR> <FORM METHOD="post" ACTION="/cgi-bin/search.cgi"> Search key <INPUT TYPE="text" NAME="key1" SIZE="25"> <BR><BR> <INPUT TYPE="reset" VALUE="Reset"> <INPUT TYPE="submit" VALUE="Search" onclick="document.reslog1.run()"> </FORM> <HR> <FONT COLOR=RED> Notes </FONT> <P> This site records and accumulates response reports of the search service. Results are used exclusively to improve the search service. No violation of privacy is intended. </P> </BODY> </HTML> [Sample explanation]
165 Blue character Content Path to be specified in CODEBASE Explanation Description for incorporating data collection function1 URL of the storage directory of the Java TM class file of this product The above sample is stored at the following storage location after installation. [Windows] Installation directory \sample\search_request_jp.html [UNIX] /opt/fjsvssqc/sample/search_request_jp.html Editing the Web page that receives results Incorporate the Java TM applet (ResLog2.class) into the HTML document of the Web page that receives (displays) results. The following is a sample HTML document. URL in CODEBASE within the sample is described assuming that, like the setting example in "4.1 Settings for Web Server" the physical path of the directory www under the installation directory is registered as the alias "SQC". <!-- --> <!-- Response log collection page Sample (Part 2) --> <!-- --> <HTML> <HEAD> <TITLE> Search service page (sample) </TITLE> </HEAD> <BODY BGCOLOR=WHITE> <!-- ************ Systemwalker SQC (begin) ****************** --> <APPLET CODEBASE="/SQC/classes" CODE="ResLog2.class" ARCHIVE="reslog.jar" WIDTH=1 HEIGHT=1> <PARAM NAME=url VALUE="/SQC/cgi-bin/reslog.cgi"> </APPLET> <!-- ************ Systemwalker SQC (end) ******************** --> <CENTER><FONT COLOR=GREEN> Search service page (sample) </FONT></CENTER> <BR><BR> <FONT SIZE=5 COLOR=BLUE> Search service </FONT> <HR> <P> Search result
166 </P> </BODY> </HTML> [Sample explanation] [Windows] Content Blue character Path to be specified in CODEBASE Path to be specified in VALUE Explanation Description for incorporating data collection function2 URL corresponding to the following directory: Installation directory\www\classes URL corresponding to the following file: Installation directory\www\cgi-bin\reslog.cgi The above sample is stored at the following storage location after installation. Installation directory\sample\search_result_jp.html [UNIX] Content Blue character Path to be specified in CODEBASE Path to be specified in VALUE Explanation Description for incorporating data collection function2 URL corresponding to the following directory: /opt/fjsvswmag/www/classes URL corresponding to the following file: /opt/fjsvswmag/www/cgi-bin/reslog.cgi The above sample is stored at the following storage location after installation. /opt/fjsvssqc/sample/search_result_jp.html Notes on Web page editing Use the identical string to specify URL in CODEBASE inside the APPLET tag of the Web page that calls a service and that in CODEBASE inside the APPLET tag of the Web page that receives (displays) results. Note that, if the URL is not identical, for example, if one URL is specified using a relative path and the other URL is specified using an absolute path, no response log can be collected. Operation after settings If a Web page with the settings for this log collection is used, log collection is carried out in the sequence as shown below:
167 Target [1]Web user: [2]Web user: [3]Web user: [4]Inside: [5]Inside: [6]Analyzer: Operation description References URL of the Web page using the Web browser. Executes a service (for example, a search service) that calls the CGI program. Receives a result from the CGI program. The response log is collected and accumulated. The log is registered with the Usage DB by the Usage DB Registration Engine. An analysis can be carried out and results can be displayed on the analysis window. The URL based response analysis and client based response analysis are supported. Note If there is any error in the edited Web page, the response log cannot be collected. Before providing a Web page service, carry out tests to make sure that the response log is actually collected Stopping log collection To stop the response log collection, delete the lines added to the HTML document of the Web page that start log collection. Delete such text from both the HTML page that calls a service and the HTML page that receives results. To be deleted is the blue text in each HTML page as described in " Making settings for log collection" Once deleted, no response log is collected and accumulated even if this Web page is referenced and a service is called Log format A response log with one line of text is accumulated in the SQC extended log file in response to one piece of data sent from data collection function2. The format of one line is as follows. The field is delimited by one blank character. 1.Date 2.Type 3.Version 4.HostName 5.Path 6.Reserve 7.KeyData No. Field Explanation 1 Date Time at the log is accumulated. This time is a local time on the installation machine. Its format is as follows and blue characters are variable: [dd/mon/yyyy:hh:mm:ss SHHMM] The meaning of each field is as follows: Fie ld Meaning dd mo n Day (01-31) Month
168 No. Field Explanation yy yy hh m m ss S HH M M ("Jan","Feb","Mar","Apr","May","Jun ","Jul","Aug","Sep","Oct","Nov","De c") Christian era (1970 -) Hour (00-23) Minutes (00-59) Seconds (00-59) Flag of time difference with the Coordinated Universal Time (UTC) ("+","-") Hour of time difference with the Coordinated Universal Time (UTC) (00 -) Minutes of time difference with the Coordinated Universal Time (UTC) (00 -) 2. Type Data type (code that indicates the log type) The response log corresponds to "2". 3. Version Version level of the log format. Currently only "1" for the response log. 4. HostNam e (Web page user's) host name or IP address where the browser operates 5. Path Path to the HTML document of the Web page 6. Reserve Reserved Currently always "0" 7. KeyData Response time (in milliseconds) For the file name, capacity estimation and SQC extended log file switching, refer to " SQC extended log file" Navigation Guide for the Usage Analysis Window This section explains how to analyze the usage of the Web site by using the Trend Viewer Analyzing changes in the number of Web site visitors If you would like to make analysis in page units Analyzing site navigation
169 Analyzing changes in the number of Web site visitors This section explains the method of analysis focusing on the transition of the number of visitors to the Web site. By making analysis focusing on the transition of the number of visitors to the Web site, the following types of information can be obtained and used for effective operation of the Web site. - Number of visitors - Frequently accessed time zone - Frequently accessed period, such as the beginning or end of the month Analysis using the usage analysis window To analyze with focusing on the transition of the number of visitors to the Web site, specify the following items in the usage analysis window: Item Analysis target server Data type Analysis method Analysis period Unit Specification Specify the server or the group to be analyzed. Session status Time segment Specify the analysis period unit and period
170 If Date: hour unit is specified for the Analysis period, the transition of the number of sessions every hour on the specified date. The number of sessions represents the number of persons who visits the site; the period from entering the site to exiting the site is counted as one session. Note If a user makes no access for a given period, the session is assumed ended. If the same user makes an access again, it is counted as another session. Similarly, if the same user visits the site many times within a day, the individual visits are counted as separate sessions If you would like to make analysis in page units This section explains the method of analysis focusing on the usage of each page that makes up the contents of the Web site, such as for checking which page is popular. By making analysis focusing on the usage of each page, the following types of information can be obtained and used for effective operation of the Web site. - Frequently used pages - Usage of pages that the contents provider wants to be used - Effective pages for information supply Analysis using the usage analysis window To analyze with focusing on the usage of each page, specify the following items in the usage analysis window: Item Analysis target server Data type Analysis method Analysis period Unit Specification Specify the server or the group to be analyzed. Session status URL Specify the analysis period unit and period

171 If "Date: hour unit" is specified for the analysis period, the usage of the URL (page unit) on the specified date is displayed. The upper half of the analysis window graphs the session counts of three top ranking URLs and the total session count. The lower half shows the session counts for the specified number of URLs (20 URLs by default). Point Because "Session status" is specified for the analysis data type, usage analysis for each page is performed in units of sessions. In other words, even if the same user frequently accesses the same page within one session, the usage count is one. This analysis thus tells how many different users used the page. "Request status" can also be specified for the analysis data type. In this case, if the same users frequently accesses the same page, the usage count is incremented each time the page is accessed. This analysis thus tells how many times the page was used. Note When URL is specified as the analysis method, the accesses to the URLs having the extensions specified with RequestURLSuffix in the analysis target server definition block in the Usage DB Environment Definition File are analyzed. The default settings are as follows: RequestURLSuffix = "html,htm,shtml,shtm,stm,cgi,asp,pl,tcl,sh" Analyzing site navigation An analysis of page navigation status of customers, such as status dealing with the sequence that a customer accesses the pages of the Web service and whether a customer reaches a desired page easily, provides useful information that can be used to, for example, review the configuration of content provided as the Web service
172 Analyzing site navigation for an entire Web site In a review of organization of the content on an entire Web site, site navigation analysis can reveal how the content of the Web service is being used. In this type of analysis, a page navigation status on the most frequently used patterns on the Web site is displayed, providing reference material that can be used to focus on the organization of content on URL pages. The following is an example of using site navigation analysis for an entire Web site. 1. Specify the following items on the analysis screen to perform the analysis. Item Analysis data type Analysis method Specified content Page navigation status Whole Web site When the analysis is complete, a page navigation status on the most frequently used patterns for the Web site is displayed. 1. For a more detailed analysis of the page navigation status that focuses on a displayed URL page, specify the URL you want to analyze and then select "Next page" or "Previous page" as the drill-down destination. 2. For even greater detail, repeat the process of selecting the above URL and drilling down further Analyzing site navigation for a specific customer Use site navigation analysis that focuses on a specific customer to analyze the sequence in which a particular customer using the Web service accesses the pages of the Web site. The following is an example of using site navigation analysis that focuses on a specific customer 1. Specify the following items on the analysis screen to perform the analysis. Item Analysis data type Analysis method Specification Session status Request status Client host name base Client IP address base Authorization user name base Access ID base A list of customers that matches the specified analysis data type and analysis method is displayed. 2. Specify the customer on the displayed customer list that you want to analyze and then select "Page navigation" as the drill-down destination

173 When the analysis is complete, a page navigation status on the most frequently used patterns for the customer is displayed
174 1. For a more detailed analysis of the page navigation status that focuses on a displayed URL page, specify the URL you want to analyze and then select "Next page" or "Previous page" as the drill-down destination. In case of session analysis, the page navigation of the most user's pattern is used as the basis. For example, if the most pattern is: A.html B.html C.html In this case, if "B.html" is selected, and "Next page" is selected for advanced analysis, the result of next pages for users navigating from "A.html" to "B.html" is displayed in large amount order (the "C.html" is the most). But in case of request analysis, the result has nothing to do with the page navigation patterns to the selected URL. The page navigation pattern analysis from the selected URL is performed on all the page navigation patterns (within the specified period of time). 1. For even greater detail, repeat the process of selecting the above URL and drilling down further Analyzing site navigation for a specific URL Use site navigation analysis that focuses on a specific URL to analyze the navigational sequences used to access a URL page that has been made public as Web site content and the origin of access to the URL page. The following is an example of using site navigation analysis that focuses on a specific URL

175 1. Specify the following items on the analysis screen to perform the analysis. Item Analysis data type Analysis method Specification Session status Request status URL base EntryURL base ExitURL base A list of URLs that matches the specified analysis data type and analysis method is displayed. 2. In the displayed URL list, specify the URL you want to analyze and then select "Next page" or "Previous page" as the drill-down destination. When the analysis is complete, a list of page navigation status (next page or previous page) for the specified URL is displayed
176 In case of session analysis, selecting a URL from the result of session analysis for optional method URL or EntryURL leads to the analysis regarding the selected URL as the first URL when user visited the Web site. Similaryly, selecting a URL from the result of the session analysis for optional method ExitURL leads to analysis regarding the selected URL as the last URL. But for request analysis, selecting a URL from the result of optional method URL leads to the analysis regarding the selected URL as just one URL while navigating the Web site. 1. Repeat the process of selecting the above URL and drilling down to obtain a more detailed analysis of the page navigation status. Point In case of session analysis, the selected URL is used as the destination from the URL selected in the previous advanced analysis. But in case of request analysis, it has nothing to do with the URL that selected for the previous advanced analysis. The analysis is made on all the navigation patterns (within the specified period of time) from the selected URL
177 Chapter 12 Evaluating the Usage The Reporter can be used to evaluate the usage of the Web site. If the conditions for creating reports to be referenced are registered in advance, the Reporter can be used to evaluate the usage as needed. Reports created in the past can also be referenced. This chapter explains how to use the Reporter Registered Report Window Registry of report Window Generate of report window History of Reports Window Report paramters 12.1 Registered Report Window This section provides a function overview of the registered report window and explains how to use the functions OutLine Start operation Quit operation Window configuration OutLine For the Reporter, the conditions for generating reports (hereafter referred to as "the report conditions") must be registered before generating reports. The List of registered reports window lists the report conditions already registered. The window is thus used for report management. The following functions can be called from this window: - Registering, editing or deleting the report conditions - Generating a report according to the registered report conditions - Referencing reports that were generated previously Start operation The registered report window is started by clicking the [Trend Report] button on the top page of the Web Site Management window
178 Quit operation To quit the List of registered reports window, click the [Close] button on the bottom of the window
179 Window configuration This section shows the window configuration of the List of registered reports window and explains the components of the window
180 Report table The report table lists the report conditions already registered. Each line of the report table corresponds to one set of report conditions and consists of a registered report name and operation buttons for the report conditions. On the bottom line of the report table, the operation buttons for displaying the report history and registering new report conditions are provided. Column Description Gene./Hist. Generate Clicking this button activates the Generate of report window and generates a report based on the report condition. Refer to " Start operation" for the Generate of report window. History Registered report name Clicking this button activates the History of reports window displaying the reports that were generated previously. Refer to " Start operation" for the History of reports window. The report names registered in the report registration window are listed. Refer to " Window configuration" of the Registry of report window. To register new report conditions, click the [Register] button on the bottom line. Refer to " Start operation" for the Registry of report window. Edit/Del. Edit Clicking this button displays the Registry of report window so that the registered report conditions can be edited. Refer to " Start operation" for the Registry of report window
181 Column Del. Description Clicking this button deletes the corresponding report conditions. Buttons Button Close Function Closes the List of registered reports window Registry of report Window This section provides a function overview of the Registry of report window and explains how to use the functions OutLine Start operation Quit operation Window configuration OutLine The Registry of report window allows the user to: - Set and register new report conditions. - Edit and update the contents of the report conditions already registered Start operation To open the Registry of report window: - Click the [Register] button in the List of registered reports window. - Click the [Edit] button for the target report conditions in the List of registered reports window
182 Quit operation To quit the Registry of report window, close the Web browser that displays the window Window configuration This section shows the configuration of the Registry of report window and explains the components of the window
183 Report conditions Setting item Registered Report Name Category Description Specify the name to be displayed in the report table in the List of registered reports window. Specify the name with up to 36 alphanumeric characters and/or symbols, excluding the following symbols: $ " ' [ ] < > /? ; : * \ &,. = Select the report category from the pull-down menu. The following categories can be selected. Refer to " Category and Report type" for details. - Analyze usage (Summary) - Analyze usage (Session Report) - Analyze usage (Request Report) - Analyze usage (Traffic Report) - Analyze usage (Cache Report) - Analyze usage (Error Report) - Analyze usage (Response Report)
184 Setting item Description - Analyze usage (Page Navigation Report) - Analyze usage (Actual Visit User Count) Report Type Select the report type from the pull-down menu. The pull-down menu lists the report types corresponding to the selected category. Refer to " Category and Report type" for details. Generation conditions Set the conditions for generation reports. The settings for the generation conditions vary depending on the combination of the selected category and report type. Refer to " Other report parameters" for details. Point If the [Registry of report] window is started by clicking the [Edit] button on the [Registered Report] window, the content registered or edited last time is displayed. Buttons Test Register Button Function Report according to the report condition is displayed on the right side of the window. This is for the checking of the report condition settings. Report is displayed but the history is not added by this operation. Register the report condition set. If you want to quit the registering, quit the Registry of Report window according to " Quit operation" Generate of report window This section provides a function overview of the Generate of report window and explains how to use the functions OutLine Start operation Quit operation Window configuration OutLine The Generate of report window is used to generate a report according to the report conditions that were registered previously Start operation To open the Generate of report window, click the [Generate] button of the target report conditions in the List of registered reports window
185 Quit operation To quit the Generate of report window, close the Web browser that displays the window Window configuration This section shows the configuration of the Generate of report window and explains the components of the window
186 Report conditions The report conditions that were set in the Registry of report window are displayed in the report condition setting items in the Generate of report window. Of the setting items, the generation conditions can be changed in this window. The settings for the generation conditions vary depending on the combination of the selected category and report type. Refer to " Other report parameters" for details. Note The changes made to the generation conditions in this window are not reflected in the report conditions that were already registered. Buttons Generate Button Function Generates a report according to the report conditions. The generated report is displayed on the right side of the window. For the contents of the generated report, refer to " Report contents"

187 12.4 History of Reports Window This section provides a function overview of the History of Reports window and explains how to use the functions OutLine Start operation Quit operation Window configuration OutLine The History of Reports window is used to display reports that were generated in the past Start operation To open the History of Reports window, click the [History] button in the List of registered reports window Quit operation To quit the History of Reports window, click the [Close] button on the bottom of the window Window configuration This section shows the configuration of the History of Reports window and explains the components of the window
188 History table The history table lists the reports that were generated in the past. Each line of the history table is corresponding to an operation of the report generation. The history table lists up to 50 reports in order of generation dates beginning from the latest generation date. Older reports than these latest 50 reports are automatically deleted from the oldest reports. Column Run Date Entry Name Period of Report Description The date and time when the report was generated is displayed. The registered report name of a report that was generated is displayed. The period selected for generating a report is displayed. Point If a relative period of report such as Yesterday was selected for report generation, the actual period of report is displayed. Show Report button Clicking this button opens another window to display a report. For the format of the report displayed, refer to " Report contents". Buttons
189 Close Button Closes the report history window. Function 12.5 Report paramters This section explains the individual reports supported by the Reporter Category and Report type Other report parameters Report contents Category and Report type The table below summarizes the categories and the corresponding report types supported by the Reporter. No Category Report type Outline 1 Analyze usage (Summary) 2 Analyze usage Summary Time Segment A summary of analysis results is output. Transition in each period is analyzed. 3 (Session Report) Client Host Name Usage is analyzed for each host name that is obtained by DNS conversion of the client IP address. 4 Client IP Address Usage is analyzed for each client IP address. 5 Authorization User Name If authentication is performed on the WWW server or Proxy server, usage is analyzed for each authentication user name. 6 User Agent Usage is analyzed for each agent that is used by the user who accesses the WWW server or Proxy server. 7 Referrer Host Name The link that was used to reach the WWW server is reported for each referrer host name. 8 Referrer IP Address The link that was used to reach the WWW server is reported for each referrer IP address. 9 Remote Host Name In the Proxy server, usage is analyzed for each host name of the page that was accessed from inside the Proxy server. When the Proxy server is used in reverse operation mode, the WWW server to which a request was made from the outside is reported for each host name. 10 Remote IP Address In the Proxy server, usage is analyzed for each IP address of the page that was accessed from inside the Proxy server. When the Proxy server is used in reverse operation mode, the WWW server to which a request was made from the outside is reported for each IP address
190 No Category Report type Outline 11 URL Usage is analyzed for each URL name that was accessed from clients. 12 Entry URL Usage is analyzed for each entry URL of the URL that was accessed from clients. 13 Exit URL Usage is analyzed for each exit URL of the URL that was accessed from clients. 14 Referrer URL The link that was used to reach the WWW service is reported for each referrer URL. 15 Access ID Usage is analyzed for each ID that was set in Cookie. 16 Directory Usage is analyzed for each directory using the URL name accessed from clients. 17 Subnetwork Usage is analyzed for each subnetwork that groups client IP addresses. 18 Analyze usage Time Segment Transition in each period is analyzed. 19 (Request Report) Client Host Name Usage is analyzed for each host name that is obtained by DNS conversion of the client IP address. 20 Client IP Address Usage is analyzed for each client IP address. 21 Authorization User Name If authentication is performed on the WWW server or Proxy server, usage is analyzed for each authentication user name. 22 Remote Host Name In the Proxy server, usage is analyzed for each host name of the page that was accessed from inside the Proxy server. When the Proxy server is used in reverse operation mode, the WWW server to which a request was made from the outside is reported for each host name. 23 Remote IP Address In the Proxy server, usage is analyzed for each IP address of the page that was accessed from inside the Proxy server. When the Proxy server is used in reverse operation mode, the WWW server to which a request was made from the outside is reported for each IP address. 24 URL Usage is analyzed for each URL name that was accessed from clients. 25 URL Extension Usage is analyzed for each extension (which extensions were frequently accessed). 26 Access ID Usage is analyzed for each ID that was set in Cookie. 27 Directory Usage is analyzed for each directory using the URL name accessed from clients as the key. 28 Subnetwork Usage is analyzed for each subnetwork that groups client IP addresses
191 No Category Report type Outline 29 Analyze usage Time Segment Transition in each period is analyzed. 30 (Traffic Report) Client Host Name Usage is analyzed for each host name that is obtained by DNS conversion of the client IP address. 31 Client IP Address Usage is analyzed for each client IP address. 32 Authorization User Name If authentication is performed on the WWW server or Proxy server, usage is analyzed for each authentication user name. 33 Remote Host Name In the Proxy server, usage is analyzed for each host name of the page that was accessed from inside the Proxy server. When the Proxy server is used in reverse operation mode, the WWW server to which a request was made from the outside is reported for each host name. 34 Remote IP Address In the Proxy server, usage is analyzed for each IP address of the page that was accessed from inside the Proxy server. When the Proxy server is used in reverse operation mode, the WWW server to which a request was made from the outside is reported for each IP address. 35 URL Usage is analyzed for each URL name that was accessed from clients. 36 URL Extension Usage is analyzed for each extension (which extensions were frequently accessed). 37 Access ID Usage is analyzed for each ID that was set in Cookie. 38 Subnetwork Usage is analyzed for each subnet that groups client IP addresses. 39 Analyze usage (Cache Report) 40 Analyze usage Hit Location Error Location Cache hits are analyzed for each hit location. Errors are analyzed for each error location. 41 (Error Report) Server Error Code Server errors are analyzed for each server error code. 42 Client Error Code Client errors are analyzed for each client error code. 43 Remote Error Code Remote errors are analyzed for each remote error code. 44 Analyze usage (Response URL Usage is analyzed for each URL name that was accessed from clients. 45 Report) Client Host Name Usage is analyzed for each host name that is obtained by DNS conversion of the client IP address. 46 Client IP Address Usage is analyzed for each client IP address. 47 Analyze usage Entire Site Page navigation (in which order the WWW service pages were accessed) is analyzed
192 No Category Report type Outline (Page Navigation Report) 48 Analyze usage (Actual Visit User Count) Specified Server The number of users who actually visited each client IP address per day is reported Other report parameters This section explains the generation conditions to be set in the Registry of report window. The section explains them separately for each category Common items This section explains the items common to all categories. Period of report Select the period for generating a report. Upper field In the upper field, select the period type that represents the period for generating a report from the pull-down menu. The following period types can be selected. Today is selected by default. Yesterday Today Period type (Select the day from the following) Last week This week (Select the week from the following) Last month This month (Select the month from the following) (Select the year from the following) Description A report for the day before the day on which report generation is executed is generated. A report for the day on which report generation is executed is generated. When generating a report, select the report period from the list of days in the field below. A report for the week before the week during which report generation is executed is generated. A report for the week during which report generation is executed is generated. When generating a report, select the report period from the list of weeks in the field below. A report for the month before the month in which report generation is executed is generated. A report for the month in which report generation is executed is generated. When generating a report, select the report period from the list of months in the lower field. When generating a report, select the report period from the list of years in the lower field
193 Note Some items may not be selected depending on the combination of the selected category and report type. Lower field If (Select the day from the following) is selected in the upper field, select a specific day from the lower field. The lower field first lists seven days including today beginning from Sunday. To move the range of the days listed in the present field to the past or future, click the move button above or below the field. If (Select the week from the following) is selected in the upper field, select a specific week from the lower field. The lower field first lists seven weeks including this week. To move the range of the weeks listed in the present field to the past or future, click the move button above or below the field. If (Select the month from the following) is selected in the upper field, select a specific month from the lower field. The lower field first lists seven months including this month. To move the range of the months listed in the present field to the past or future, click the move button above or below the field. If (Select the year from the following) is selected in the upper field, select a specific year from the lower field. The lower field first lists seven years including this year. To move the range of the years listed in the present field to the past or future, click the move button above or below the field. Note The report period selected from the lower field in the Registry of report window is not reflected in the report conditions. Select the report period again from the lower field in the Generate of report window Report Object and Select Condition This section explains the items specific to the following categories: - Analyze usage (Summary) - Analyze usage (Session Report) - Analyze usage (Request Report) - Analyze usage (Traffic Report) - Analyze usage (Cache Report) - Analyze usage (Error Report) - Analyze usage (Response Report) - Analyze usage (Page Navigation Report) - Analyze usage (Actual Visit User Count) Selecting the service or Web site Select the object of the report generation by the option button. Object Service Description Selects the service as the object of the report generation. The service name corresponds to the analysis target server name on the [Use Trend Service Information] window
194 Object Web site Description Selects the Web site as the object of the report generation. The Web site includes the server group and service group. See For the managed server and Web site(group), refer to "Chapter 7 Configuring the Operating Environment". Name of service, Web site Select the report target from pulldown menu according to the selected service or Web site. Note In the pulldown menu, some items that are not applicable to the selected Category, Reprot Type are also displayed. If those items are selected, Message indicating no data in the period is displayed. Only the usage analysis services of the managed server in management operation can become the report target. In case of managed server operation, even if selected from the pulldown menu, the message indicating no data in the period is displayed. Focusing conditions When a report is generated, data that satisfy the condition specified by the focusing conditions is analyzed. The focusing condition is specified in the following form: - Analysis method = Value Select the analysis method from the pull-down menu. Specify by inputting the value directly that you want to focus about the specified analysis method. The specification examples are as follows: - When the analysis method is client IP address": Specify " " In this case, a report is generated about the accesses from the user whose client IP address is " ". - When the analysis method is URL": Specify "/SQC/TopPage_en.html." In this case, a report is generated about the accesses to URL "/SQC/TopPage_en.html." Note When you specify the focusing condition, a report is generated on the data exactly the same as the specified characters. Wild card cannot be specified Report contents This section explains the format of a report generated in the Generate of report window

195 Report conditions The contents of the report conditions set when generating a report in the Generate of report window are displayed
196 Graphical data Data collected and analyzed according to the report conditions is displayed in graphical format. The displayed type of the graph and the number of graphs vary depending on the combination of the selected category and report type. Table data Data collected and analyzed according to the report conditions is displayed in a table form. The displayed table items vary depending on the combination of the selected category and report type. Link Print report Link Download data Description Clicking this link to print the report. Clicking this link to download the data used for report generation as a CSV file. If it does not work, right-click the link and select Save to file or Save the link as from the menu to download the data. For the CSV file format, refer to " Report data file"
197 Chapter 13 Using the Contents Tampering Monitor The system administrator can use the Contents Tampering Monitor to automatically monitor tampering with Web contents (hereafter referred to as contents) and receive messages if tampering is detected. This chapter explains how to use the Contents Tampering Monitor Viewing the Environment Settings Window Tampering Detection Notice Customization 13.1 Viewing the Environment Settings Window Environment Settings window for tamper monitoring can be opened from the Management Console window on the Management Server. Click the "Environment Settings" button in the Management Console window to display the Environment Settings window, and then click the "Contents Tampering Monitor" button Contents Tampering Monitor window (menu window) Tamper Monitor URL Entry window Tamper Monitor URL Modify window
198 Confirm URL Delete window Environment Properties window Action Statement window Contents Tampering Monitor window (menu window) The Contents Tampering Monitor window, which is a menu window for tamper monitoring, appears. The window configuration varies depending on whether monitoring conditions have been registered. [URL ENTRY] button Displays the " Tamper Monitor URL Entry window". Use this button when registering new monitoring conditions. [URL MODIFY] button Displays the " Tamper Monitor URL Modify window". Use this button when modifying monitoring conditions already registered. [URL DELETE] button Displays the " Confirm URL Delete window". Use this button when deleting monitoring conditions already registered
199 [ENVIRONMENT PROPERTY] button Displays the " Environment Properties window". Use this button when defining the operating environment for the Contents Tampering Monitor. [ACTION STATEMENT] button Displays the " Action Statement window". Use this button when checking the tamper checking status. List The URLs that represent the monitoring conditions already registered are listed. When modifying or deleting monitoring conditions already registered, specify the URL that represents the target monitoring conditions Tamper Monitor URL Entry window The Tamper Monitor URL Entry window is used to register monitoring conditions
200 Tamper Monitor URL Specify the URL of the content or the directory containing the content. If a directory is specified, the content right under the directory is to be monitored. Specify the URL up to 1,023 characters excluding the following: ^ [ ] { } < > ( ) & $ # " ' *,? Example 1: To specify content Example 2: To specify a directory Point The URL specified here is used as to represent monitoring conditions in the Contents Tampering Monitor window, Action Statement window and the detection notification. Mode If this check box is selected when a directory is specified in [Tamper Monitor URL], all contents under the directory are to be monitored. Frequency Specify the frequency of tamper checking. Tamper Monitor directory Specify the absolute path of the file or directory on the Web server machine corresponding to the URL specified in [Tamper Monitor URL]. Specify the path up to 1,023 characters excluding the following: ^ [ ] { } < > ( ) & $ # " ' *,? [Windows] Example 1: To specify a file C:\www\index.html Example 2: To specify a directory C:\www [UNIX] Example 1: To specify a file /var/www/index.html Example 2: To specify a directory /var/www Alert Address Specify only one address to which a tamper detection notification is to be sent
201 Specify the address up to 1,023 characters excluding the following: ^ [ ] { } < > ( ) & $ # " ' *,? CC Specify the address to which a copy of tamper detection notification is to be sent as needed. If two or more addresses are specified, delimit them with a semicolon(;). Specify the address up to 1,023 characters excluding the following: ^ [ ] { } < > ( ) & $ # " ' *,? Example: To specify two addresses user1@fujitsu.com;user5@fujitsu.com Send Log Path If the send log file for tamper detection notification is to be changed from the default to another, specify the absolute path of the new file. Specify the path up to 1,023 characters excluding the following: ^ [ ] { } < > ( ) & $ # " ' *,? The default send log file is as follows: [Windows] Example: <installation directory>\etc\seq\log\send.log [UNIX] Example: /etc/opt/fjsvssqc/seq/log/send.log Point The default send log file is renamed to send.log~ (past log is deleted) every time the amount of logged data exceeds a given level. The default log file thus contains only the recent log. To retain the past log, change the send log file from the default to another Tamper Monitor URL Modify window The Tamper Monitor URL Modify window is used to modify monitoring conditions already registered
202 [Tamper Monitor URL] The URL registered for monitoring is displayed. [Mode] Refer to Mode in the Tamper Monitor URL Entry window. [Frequency] Specify the frequency of tamper checking. If "invalidity" check box is selected, checking is stopped with the registered information left as is. [Tamper Monitor directory] Refer to Tamper Monitor directory in the Tamper Monitor URL Entry window. [Alert Address] Refer to Alert Address in the Tamper Monitor URL Entry window. [CC] Refer to CC in the Tamper Monitor URL Entry window
203 [Send Log Path] Refer to Send Log Path in the Tamper Monitor URL Entry window Confirm URL Delete window The Confirm URL Delete window is used to delete monitoring conditions already registered Environment Properties window The Environment Properties window is used to set the environment for sending tamper detection messages
204 [Host Name] Specify the host name of the SMTP server. Specify the host name up to 1,023 characters excluding the following: ^ [ ] { } < > ( ) & $ # " ' *,? Note Be sure to use the default value (25) for the port number of the SMTP server [Sender Address] Specify the sender address to be included in tamper detection messages. Specify the address up to 1,023 characters excluding the following: ^ [ ] { } < > ( ) & $ # " ' *,? Action Statement window The Action Statement window is used to check how tamper checking has been performed. This window displays the cumulative records of checking results in chronological order. The following example shows the results of tamper checking over one monitoring condition

205 Start date This is the date and time when tamper checking started. End date This is the date and time when tamper checking ended. URL This is Tamper Monitor URL registered as a monitoring condition. Phase If check for monitoring conditions was executed separately, a serial number is indicated. Tamper checking is basically performed with a monitoring condition as a unit. However, if the number of contents included in the monitoring conditions exceeds a given level, the given level becomes a unit. The serial number is displayed. The phase is not displayed if the number of contents included in the monitoring conditions do not reach the given level. Mode This is Mode registered as a monitoring condition. Tamper Monitor directory This is Tamper Monitor directory registered as a monitoring condition
206 Note If Tamper Monitor directory is not found at Tamper checking, the following message is displayed and the below items are not displayed. "Tamper Monitor directory is not found." Number of Web contents This is the total number of contents included in the monitoring conditions. If [Phase] is displayed, it is the number of contents to be checked with the check as a unit. Modified file list This is the list of the contents that might have been tampered (modified). Deleted file list This is the list of the contents that might have been tampered (deleted) Tampering Detection Notice Tamper detection notices are given by the following ways: - notice - Event message An event message is the message outputted to the system log. For the message contents, refer to " Tampering inspection program." Note If a tamper detection notice is given, confirm the contents on the Web server and take action properly notice notice When the Alert Address had been set as a monitoring condition, if a tamper is detected, an is sent to the address. The following is an example of an notice
207 URL This is Tamper Monitor URL registered as the monitoring conditions. Phase If check for monitoring conditions was executed separately, a serial number is indicated. Tamper checking is basically performed with a monitoring condition as a unit. However, if the number of contents included in the monitoring conditions exceeds a given level, the given level becomes a unit. The serial number is displayed. The phase is not displayed if the number of contents included in the monitoring conditions do not reach the given level. Start date This is the date and time when tamper checking started. End date This is the date and time when tamper checking ended. Tamper Monitor directory This is Tamper Monitor directory registered as a monitoring condition Note If Tamper Monitor directory is not found at Tamper checking, message is displayed after End date and the below items are not displayed. "Tamper Monitor directory is not found."
208 Number of tampered files The number of contents that might have been tampered. code This is the code that indicates the type of tamper. The meaning of the code is provided after the file list Customization If you would like to make tampering inspection with a shorter interval If you would like to make tampering inspection at an optional time If you would like to make tampering inspection with a shorter interval As the standard, the shortest frequency of tamper checking is once per hour. If the user wants to shorten the interval, customize the frequency of checking on the Management Server as follows: 1. Open the " Tamper Monitor URL Entry window" or " Tamper Monitor URL Modify window" and set the [Frequency] to [Once hourly]. 2. Open the start control definition file dmcoll.ini using a text editor, and change the value of the polling parameter, which indicates the start interval in the section [SEQ], to the desired value. The path of dmcoll.ini is as follows: [Windows] < variable file storage directory >\control\data\dmcoll.ini [UNIX] /etc/opt/fjsvssqc/data/dmcoll.ini One of the following values (in minutes) can be specified for the polling parameter: 5, 10, 20, 30, Restart the start control. The restart procedure is as follows: [Windows] Open the service window on the control panel. Stop the next service and then restart it. Systemwalker SQC sqcschdle [UNIX] Execute in the following order: # /opt/fjsvssqc/bin/ssqcsch stop
209 # /opt/fjsvssqc/bin/ssqcsch start 1. Check the results in the " Action Statement window" If you would like to make tampering inspection at an optional time As a standard, the tamper checking is scheduled once a day or once per hour. However, the user can perform tamper checking when desired. Do the following on the Management Server: 1. Directly run the tamper checking program (tamper_detect.exe command). The procedures to run the program are as follows: [Windows] C:\> <installation directory>\bin\tamper_detect.exe [UNIX] # /opt/fjsvssqc/bin/tamper_detect.sh 2. Check the results in the " Action Statement window"
210 Part 5 References Chapter 14 Setting the Web Site Management Window Chapter 15 SQC file types Chapter 16 Troubleshooting Chapter 17 Messages Chapter 18 Command Reference Chapter 19 Environment Maintenance
211 Chapter 14 Setting the Web Site Management Window The necessary settings for management server can be performed with the [Environment Settings] window, which is started from the [Web Site Management] window. Specifying the following URL with a Web browser can start the [Web Site Management] window. [Windows] When the Management Server is a Windows version: server host name/sqc/default.htm [UNIX] When the Management Server is a Solaris or Linux version: server host name/sqc/index.html Point If the Management Server is used in cluster operation mode, specify the virtual address (logical IP address or host name) for the host name of the Management Server. Enterprise Edition provides the cluster operation function
![Click the [Environment Settings] button to display the environment setting window. - 14.1 Environment Settings Window 14.](/docs-images/86/94875035/images/212-0.jpg "1 Environment Settings Window Settings for services and group of managed servers can be performed with the environment settings window.")
212 Click the [Environment Settings] button to display the environment setting window Environment Settings Window 14.1 Environment Settings Window Settings for services and group of managed servers can be performed with the environment settings window. This section explains how to make settings for servers and group settings for Managed Servers

213 Explanation of buttons The table below summarizes the usage of the buttons that can be selected from the Environment Settings window. Button Management Server Usage Used to set information about the host in which the Management Server is installed and about the Default Proxy Server used in the environment managed by Systemwalker Service Quality Coordinator. Point Always make this setting before using each function. For the setting procedure, refer to " Management Server Settings window". Managed server Settings for management target servers and for those analysis target servers what should be registered to the managed servers (in order to use all sorts of functions) can be performed. Agent is installed on some Managed Servers and not installed on other Managed Servers
214 Button Point Usage Always make this setting after a server to be managed is added. For the setting procedure, refer to " Managed server setting window". Group Report Server Settings for grouping the analysis target servers that registered to the managed servers can be performed. For the setting procedure, refer to " Group Settings window". Used to sets information about the host in which a Report Server is installed, in the Report Server Settings window. Point Always make this setting before using each function. For the setting procedure, refer to " Report Server Settings window" Management Server Settings window Managed server setting window Report Server Settings window Group Settings window Notes Management Server Settings window In the Management Server Settings window, set information on the host in which the Management Server is installed and on the Default Proxy Server used in the environment managed by Systemwalker Service Quality Coordinator
215 Information setting items Item Requirement Description (Management Server) Address You must set. Specify the IP address or host name of the Management Server. When the Management Server runs in a cluster, specify a virtual address (logical IP address or logical host name) common to the active and standby systems. Set for each servers in case of doubled management server operation. Note This item cannot be changed after a Managed Server is added. If the setting for this item needs to be changed, delete all managed servers. (Management Server) Port You do not have to set. Specify the port number of the Web server that runs on the Management Server. This item need not be set if default port number 80 is used
216 Item Requirement Description Note This item cannot be changed after a Managed Server is added. If the setting for this item needs to be changed, delete all Managed Servers. (Default Proxy Server) Address (Default Proxy Server) Port You do not have to set. You do not have to set. If a Default Proxy Server is used in the environment managed by Systemwalker Service Quality Coordinator, specify the IP address or host name of the Default Proxy Server. If a Default Proxy Server is used in the environment managed by Systemwalker Service Quality Coordinator, specify the port number of the Default Proxy Server. Point Information on default proxy server is used only when the proxy server for the specific managed server is not specified. Window manipulation buttons Button Apply Reset Cancel Function Applies the information specified for the items and closes the window. Restores the item values to those with which the window opened. Closes the window without applying the information specified for the items Managed server setting window In the Managed Server Settings window, set information on the server to be managed and on the services that are registered in the server to use each function

217 Table components The table below summarizes the columns of the table displayed in the Managed Server Settings window. Column Managed Server Target Server Description The names of added Managed Servers are listed. Analysis target server names for usage analysis function added to the managed servers are displayed. Operation for changing information To change the information set for the managed server and target server, do as follows:
218 Processing Operation Number in figure Adding a Managed Server Editing Managed Server Information Deleting a Managed Server Adding a target server Editing target server information Deleting a target server Click the [Add] button on the bottom of the Managed Server column. An empty Managed Server Information window appears. Click the [Edit] button on the right side of the Managed Server to be edited Managed Server Information window having the current settings appears. Click the [Del.] button on the right side of the Managed Server to be deleted. The entry of the Managed Server disappears. Select the option button on the right side of the Managed Server for which a target server is to be added, and click the [Add] button on the bottom of the Target Server column. If the Service Quality Coordinator Agent check box for the Managed Server on which the target service is registered is cleared, Use trend is not displayed in the pull-down menu in the Service Type Select window. Click the [Edit] button on the right side of the service to be edited Usage service information window having the current settings appears. Click the [Del.] button on the right side of the service to be deleted. The entry of the service disappears. (1) (2) (3) (4) (5) (6) Window manipulation buttons Button Apply Cancel Function Applies the changes made in this window and in various information windows opened from this window, and closes the window. Closes the window without applying the changes made previously. If this button is clicked after a change is made, a prompt message appears asking whether to close the window without applying changes. Note To close this window, use the [Apply] or [Cancel] button. If these buttons are not used, a temporary file remains in the work area on the Management Server. Information For information on how to delete the remaining temporary file, refer to " Deleting unnecessary temporary files"
219 Managed Server Information window In the Managed Server Information window, set information on the servers that are managed by Systemwalker Service Quality Coordinator. Information setting items Basic information
220 Item Requirement Description Server name You must set. Specify the Managed Server entry name. The server name must be unique among all managed servers. You cannot specify two or more character string that becomes same when if upper/lower characters are not distinguished. You cannot modify the server name of the existing managed server to the character string that becomes same when if upper/lower characters are not distinguished. If specified, registered in advance character-line is used. Specify the server name up to 64 alphanumeric characters and/or symbols, excluding the following: $ \ " ', : [ ] < > = & All of server name cannot be specified in number. One or more English letter must be included in the server name. Note If the name of a server that has been running is changed, past data can no longer be collected such as by the report display function. IP address You must set. Specify the IP address of the Managed Server. Subnet mask You must set. Specify the subnet mask of the Managed Server. Proxy Server (Proxy Server) Address (Proxy Server) Port You do not have to set. You do not have to set. You do not have to set. Select the check box if a Proxy Server is used for communication between the manager and agent. Specify the address of the Proxy Server that is used specifically for this managed server. If the address is not specified, the default Proxy Server address in the Management Server Settings window is used. Specify the port of the Proxy Server that is used specifically for this Managed Server. If the port is not specified, the Default Proxy Server port in the Management Server Settings window is used. Attributes of managed server Item Requirement Description Service Quality Coordinator agent You do not have to set. Select the check box if Systemwalker Service Quality Coordinator is installed. Point If this check box is not selected, the lower two settings are disabled
221 Item Requirement Description Agent URL You do not have to set. Specify the alias URL for the Web server that has been set in the environment settings for the managed server. Use the following format for this setting: " For the "host" part, set either the IP address or the host name (including the domain). Also, if the Web server on the managed server is using a port number other than the well-known port (80), the "port" specification must be made as well. See Refer to "4.1 Settings for Web Server", for details on the Web server settings for the managed server. Note This item cannot be changed if analysis target server is added. If it needs to be changed, delete all use trend services. Window manipulation buttons Button OK Reset Cancel Function Ends specifying data for items and closes the window. Restores the item values to those with which the window opened. Closes the window without applying the information specified for the items Usage service information window In the Use Trend Service Information window, set information on each Web log subjected to the Trend Viewer
222 Information Setting Item Item Requirement Description Target server name You must set. Specify the name of the server to be analyzed. The analysis target server name must be unique throughout the use trend services regardless of the Managed Server for which a service is added. You cannot specify two or more character string that becomes same when if upper/lower characters are not distinguished as the analysis target server. If specified, it is recognized as used. You cannot modify the analysis target server name of the existing service to the character string that becomes same when if upper/lower characters are not distinguished. If specified, the registered in advance is used
223 Item Requirement Description Specify the server name up to 20 alphanumeric characters and/ or symbols, excluding the following:$ \ " ', : [ ] < > = &All of analysis target server name cannot be specified in number. One or more English letter must be included in the analysis target server name. The specified name must match the character string specified for "Name" in the use trend database environment definition file that is used when the Trend Viewer is defined. For details of the use trend DB environment definition file, refer to " Usage DB Environment Definition File". Use trend database location Use trend database port You must set. You must set. Specify whether the use trend DB for the use trend service is to be managed on the Managed Server or Management Server. If the service is entered in a group, select Management Server. This item cannot be changed after the service is entered in a group. If the item needs to be changed, exclude the service from the group. For information on the use trend DB management location, refer to "2.1.1 Locating methods of the analysis data". This item must match the "DatabaseMode" item in the use trend DB environment definition file on the Managed Server. For details of the use trend DB environment definition file, refer to " Usage DB Environment Definition File". The use trend database port is usually Change this setting if this has been changed to any other port number. Otherwise, there is no need to change the default value (2365). [Windows/Linux] The use trend database port is set up when SQC-A is installed. [Solaris] The use trend database port is not set up when SQC-A is installed. Refer to " Start operation" for details on how to set up the use trend database port. This item is shared between all use trend services on the managed server. If there are multiple services, any changes made to one will be applied to all the others. Window manipulation buttons Button OK Reset Cancel Function Ends specifying data for items and closes the window. Restores the item values to those with which the window opened. Closes the window without applying the information specified for the items
224 Report Server Settings window In the Report Server Settings window, set information on the host in which the Report Server is installed. Information setting items Item Requirement Description (Report Server) Address (Report Server) Port You must set. You do not have to set. Specify the IP address or host name of the Report Server. Specify the port number of the Web server running on the Report Server. No specification is needed if default port number 80 is used. Window manipulation buttons

225 Button Apply Reset Cancel Action Applies the information specified for the items and closes the window. Restores the item values to those with which the window opened. Closes the window without applying the information specified for the items Group Settings window Settings for grouping the analysis target servers registered to the managed servers can be performed with the Group Settings window. Table components The table below summarizes the columns of the table displayed in the Group Settings window. Group Column Target Server Description The names of added groups are listed. Analysis target server names for the usage analysis services that configuration the group are displayed
User's Guide (Website Management Functions Edition)
") Systemwalker Service Quality Coordinator User's Guide (Website Management Functions Edition) Windows/Solaris/Linux J2X1-7664-01ENZ0(00) July 2012 Preface Purpose of this manual This manual explains how
Systemwalker Service Quality Coordinator User's Guide (Website Management Functions Edition) Windows/Solaris/Linux J2X1-7664-01ENZ0(00) July 2012 Preface Purpose of this manual This manual explains how
Systemwalker Service Quality Coordinator. Technical Guide. Windows/Solaris/Linux
 Systemwalker Service Quality Coordinator Technical Guide Windows/Solaris/Linux J2X1-6800-03ENZ0(00) May 2011 Preface Purpose of this manual This manual explains the functions and usage of Systemwalker
Systemwalker Service Quality Coordinator. Technical Guide. Windows/Solaris/Linux
 Systemwalker Service Quality Coordinator Technical Guide Windows/Solaris/Linux J2X1-6800-02ENZ0(00) November 2010 Preface Purpose of this manual This manual explains the functions and usage of Systemwalker
User's Guide (Systemwalker User Management and Single Sign-On Edition)
") Systemwalker Service Quality Coordinator User's Guide (Systemwalker User Management and Single Sign-On Edition) Windows/Solaris/Linux J2X1-7665-02ENZ0(00) January 2013 Preface Purpose of this manual This
Systemwalker Service Quality Coordinator User's Guide (Systemwalker User Management and Single Sign-On Edition) Windows/Solaris/Linux J2X1-7665-02ENZ0(00) January 2013 Preface Purpose of this manual This
User's Guide (Console Edition)
") Systemwalker Service Quality Coordinator User's Guide (Console Edition) Windows/Solaris/Linux J2X1-6830-02ENZ0(00) November 2010 Preface Purpose of this manual This manual explains how to use the operation
Systemwalker Service Quality Coordinator User's Guide (Console Edition) Windows/Solaris/Linux J2X1-6830-02ENZ0(00) November 2010 Preface Purpose of this manual This manual explains how to use the operation
Systemwalker Service Quality Coordinator. Installation Guide. Windows/Solaris/Linux
 Systemwalker Service Quality Coordinator Installation Guide Windows/Solaris/Linux J2X1-7658-01ENZ0(01) September 2012 Preface Purpose of this manual This manual explains how to install Systemwalker Service
Structure and Overview of Manuals
 FUJITSU Software Systemwalker Operation Manager Structure and Overview of Manuals UNIX/Windows(R) J2X1-6900-08ENZ0(00) May 2015 Introduction Purpose of This Document Please ensure that you read this document
User's Guide (Console Edition)
") Systemwalker Service Quality Coordinator User's Guide (Console Edition) Windows/Solaris/Linux J2X1-6830-03ENZ0(00) May 2011 Preface Purpose of this manual This manual explains how to use the operation
Systemwalker Service Quality Coordinator User's Guide (Console Edition) Windows/Solaris/Linux J2X1-6830-03ENZ0(00) May 2011 Preface Purpose of this manual This manual explains how to use the operation
Systemwalker Service Quality Coordinator. Reference Guide. Windows/Solaris/Linux
 Systemwalker Service Quality Coordinator Reference Guide Windows/Solaris/Linux J2X1-6840-03ENZ0(00) May 2011 Preface Purpose of this manual This manual explains the different commands and messages used
Systemwalker Service Quality Coordinator. Reference Guide. Windows/Solaris/Linux
 Systemwalker Service Quality Coordinator Reference Guide Windows/Solaris/Linux J2X1-6840-02ENZ0(00) November 2010 Preface Purpose of this manual This manual explains the different commands and messages
User's Guide (Console Edition)
") walker Service Quality Coordinator User's Guide (Console Edition) Windows/Solaris/Linux J2X1-7660-02ENZ0(00) January 2013 Preface Purpose of this manual This manual explains how to use the operation windows
walker Service Quality Coordinator User's Guide (Console Edition) Windows/Solaris/Linux J2X1-7660-02ENZ0(00) January 2013 Preface Purpose of this manual This manual explains how to use the operation windows
ETERNUS SF Express V15.3/ Storage Cruiser V15.3/ AdvancedCopy Manager V15.3. Migration Guide
 ETERNUS SF Express V15.3/ Storage Cruiser V15.3/ AdvancedCopy Manager V15.3 Migration Guide B1FW-5958-06ENZ0(00) June 2013 Preface Purpose This manual describes how to upgrade to this version from the
User's Guide - Master Schedule Management
 FUJITSU Software Systemwalker Operation Manager User's Guide - Master Schedule Management UNIX/Windows(R) J2X1-3170-14ENZ0(00) May 2015 Preface Purpose of This Document This document describes the Master
ETERNUS SF AdvancedCopy Manager Operator's Guide for Cluster Environment
 ETERNUS SF AdvancedCopy Manager 14.2 Operator's Guide for Cluster Environment J2X1-7452-04ENZ0(00) June 2011 Preface Purpose This manual explains the installation and customization of ETERNUS SF AdvancedCopy
FUJITSU Storage ETERNUS SF Express V16.3 / Storage Cruiser V16.3 / AdvancedCopy Manager V16.3. Migration Guide
 FUJITSU Storage ETERNUS SF Express V16.3 / Storage Cruiser V16.3 / AdvancedCopy Manager V16.3 Migration Guide B1FW-6000-04ENZ0(00) October 2015 Preface Purpose This manual describes how to upgrade to this
User's Guide (Console Edition)
") walker Service Quality Coordinator User's Guide (Console Edition) Windows/Solaris/Linux J2X1-7660-01ENZ0(01) September 2012 Preface Purpose of this manual This manual explains how to use the operation
walker Service Quality Coordinator User's Guide (Console Edition) Windows/Solaris/Linux J2X1-7660-01ENZ0(01) September 2012 Preface Purpose of this manual This manual explains how to use the operation
ETERNUS SF AdvancedCopy Manager V13.3 Message Guide
 B1WW-8881-05ENZ0 (00) ETERNUS SF AdvancedCopy Manager V13.3 Message Guide ii Preface About This Manual This manual explains the messages output by ETERNUS SF AdvancedCopy Manager. Intended Reader This
Systemwalker Service Quality Coordinator. User's Guide. Windows/Solaris/Linux
 Systemwalker Service Quality Coordinator User's Guide Windows/Solaris/Linux J2X1-7659-01ENZ0(01) September 2012 Preface Purpose of this manual This manual describes the management functions provided by
FUJITSU Software Systemwalker Operation Manager. Upgrade Guide. UNIX/Windows(R)
") FUJITSU Software Systemwalker Operation Manager Upgrade Guide UNIX/Windows(R) J2X1-3150-16ENZ0(00) May 2015 Preface Purpose of This Document This document describes the migration method, and notes when
FUJITSU Software Systemwalker Operation Manager Upgrade Guide UNIX/Windows(R) J2X1-3150-16ENZ0(00) May 2015 Preface Purpose of This Document This document describes the migration method, and notes when
FUJITSU Storage ETERNUS SF Express V16.5 / Storage Cruiser V16.5 / AdvancedCopy Manager V16.5. Migration Guide
 FUJITSU Storage ETERNUS SF Express V16.5 / Storage Cruiser V16.5 / AdvancedCopy Manager V16.5 Migration Guide B1FW-6000-06ENZ0(01) June 2017 Preface Purpose This manual describes how to upgrade to this
Systemwalker User's Guide - Systemwalker User Management and Single Sign-On. UNIX/Windows(R)
") Systemwalker User's Guide - Systemwalker User Management and Single Sign-On UNIX/Windows(R) J2X1-7470-05ENZ0(00) April 2012 Preface Purpose of This Document This document explains how to install the Systemwalker
Systemwalker User's Guide - Systemwalker User Management and Single Sign-On UNIX/Windows(R) J2X1-7470-05ENZ0(00) April 2012 Preface Purpose of This Document This document explains how to install the Systemwalker
ETERNUS SF AdvancedCopy Manager Overview
 ETERNUS SF AdvancedCopy Manager 14.2 Overview J2X1-7443-04ENZ0(00) June 2011 Preface Purpose This manual provides an overview of the ETERNUS SF AdvancedCopy Manager. This manual describes the ETERNUS SF
ETERNUS SF Express V15.1/ Storage Cruiser V15.1/ AdvancedCopy Manager V15.1. Migration Guide
 ETERNUS SF Express V15.1/ Storage Cruiser V15.1/ AdvancedCopy Manager V15.1 Migration Guide B1FW-5958-03ENZ0(00) August 2012 Preface Purpose This manual describes how to upgrade to this version from the
ETERNUS SF AdvancedCopy Manager Operator's Guide for Tape Server Option
 ETERNUS SF AdvancedCopy Manager 14.0 Operator's Guide for Tape Server Option J2X1-7453-01ENZ0(00) July 2009 Preface Purpose This manual describes the functionality of ETERNUS SF AdvancedCopy Manager for
ETERNUS SF AdvancedCopy Manager V15.0. Quick Reference
 ETERNUS SF AdvancedCopy Manager V15.0 Quick Reference B1FW-5967-02ENZ0(00) April 2012 Preface Purpose This manual describes the pre-installation requirements, installation procedure, configuration procedure,
Interstage Big Data Complex Event Processing Server V1.0.0
 Interstage Big Data Complex Event Processing Server V1.0.0 User's Guide Linux(64) J2UL-1665-01ENZ0(00) October 2012 PRIMERGY Preface Purpose This manual provides an overview of the features of Interstage
FUJITSU Software Systemwalker Software Configuration Manager. Release Notes. Windows/Linux
 FUJITSU Software Systemwalker Software Configuration Manager Release Notes B1X1-0125-05ENZ0(00) August 2014 Preface Purpose of this Document This document presents an overview of the functions that have
Troubleshooting Guide
 Systemwalker Runbook Automation Troubleshooting Guide Windows/Linux B1X1-0122-03ENZ0(00) July 2012 Preface Purpose of This Document This document describes how to deal with problems that occur with the
Setup Guide for Wily Introscope Integration
 Interstage Business Process Manager Analytics V11.1 Setup Guide for Wily Introscope Integration Windows/Solaris/Linux B1X1-0028-01ENZ0(00) July 2010 About this Manual This document provides how to setup
FUJITSU Software Systemwalker Operation Manager. Release Guide. UNIX/Windows(R)
") FUJITSU Software Systemwalker Operation Manager Release Guide UNIX/Windows(R) B1X1-0251-02ENZ0(00) May 2015 Preface Purpose of This Document This document describes the migration method, notes, and incompatible
FUJITSU Software Systemwalker Operation Manager Release Guide UNIX/Windows(R) B1X1-0251-02ENZ0(00) May 2015 Preface Purpose of This Document This document describes the migration method, notes, and incompatible
FUJITSU Storage ETERNUS SF Storage Cruiser V16.3 / AdvancedCopy Manager V16.3. Cluster Environment Setup Guide
 FUJITSU Storage ETERNUS SF Storage Cruiser V16.3 / AdvancedCopy Manager V16.3 Cluster Environment Setup Guide B1FW-6006-04ENZ0(00) October 2015 Preface Purpose This manual provides information on installation
ETERNUS SF AdvancedCopy Manager V13.2 Operator's Guide (Linux)
") J2UZ-8170-03ENZ0(A) ETERNUS SF AdvancedCopy Manager V13.2 Operator's Guide (Linux) ii Preface ++ Purpose This manual describes the operations available on ETERNUS SF AdvancedCopy Manager. ++ Intended Readers
J2UZ-8170-03ENZ0(A) ETERNUS SF AdvancedCopy Manager V13.2 Operator's Guide (Linux) ii Preface ++ Purpose This manual describes the operations available on ETERNUS SF AdvancedCopy Manager. ++ Intended Readers
Interstage Shunsaku Data Manager Operator s Guide
 Interstage Shunsaku Data Manager Operator s Guide Operator s Guide Trademarks Trademarks of other companies are used in this manual only to identify particular products or systems. Product Microsoft, Visual
FUJITSU Storage ETERNUS SF Storage Cruiser V16.5 / AdvancedCopy Manager V16.5. Cluster Environment Setup Guide
 FUJITSU Storage ETERNUS SF Storage Cruiser V16.5 / AdvancedCopy Manager V16.5 Cluster Environment Setup Guide B1FW-6006-06ENZ0(00) May 2017 Preface Purpose This manual provides information on installation
Troubleshooting Guide
 Systemwalker Runbook Automation Troubleshooting Guide Windows/Linux B1X1-0122-04ENZ0(00) September 2012 Preface Purpose of This Document This document describes how to deal with problems that occur with
FUJITSU Software Interstage Studio V11.1. Installation Guide
 FUJITSU Software Interstage Studio V11.1 Installation Guide B1WD-3159-02ENZ0(00) November 2013 Preface Purpose This manual, the Interstage Studio Installation Guide, explains how to setup Interstage Studio.
ETERNUS SF AdvancedCopy Manager V13.1 Operator's Guide for Tape Backup Option
 J2S2-0560-02ENZ0(A) ETERNUS SF AdvancedCopy Manager V13.1 Operator's Guide for Tape Backup Option Preface ++ Purpose This manual describes the functionality of ETERNUS SF AdvancedCopy Manager for Tape
ETERNUS SF AdvancedCopy Manager V13.1 GUI User s Guide
 B1WW-8871-02ENZ0(00) ETERNUS SF AdvancedCopy Manager V13.1 GUI User s Guide Preface ++ Purpose This manual explains how to operate the Web-GUI with ETERNUS SF AdvancedCopy Manager. ++ Reader This manual
ETERNUS SF AdvancedCopy Manager Glossary
 ETERNUS SF AdvancedCopy Manager 14.1 Glossary J2X1-7455-02ENZ0(00) January 2010 Preface Purpose This manual describes the terminology used in the ETERNUS SF AdvancedCopy Manager manuals. Intended Readers
Interstage Shunsaku Data Manager Using the Shunsaku Manuals
 Interstage Data Manager Using the Manuals Using the Manuals Trademarks Trademarks of other companies are used in this manual only to identify particular products or systems. Product Microsoft, Visual C++,
EXPRESSCLUSTER X SingleServerSafe 3.3 for Windows. Installation Guide. 01/29/2016 3rd Edition
 EXPRESSCLUSTER X SingleServerSafe 3.3 for Windows Installation Guide 01/29/2016 3rd Edition Revision History Edition Revised Date Description 1st 02/09/2015 New manual 2nd 04/20/2015 Corresponds to the
ETERNUS SF Storage Cruiser V15.0. Quick Reference
 ETERNUS SF Storage Cruiser V15.0 Quick Reference B1FW-5963-02ENZ0(00) April 2012 Preface Purpose This manual describes the pre-installation requirements, installation procedure, configuration procedure,
Systemwalker Service Quality Coordinator. Reference Guide. Windows/Solaris/Linux
 Systemwalker Service Quality Coordinator Reference Guide Windows/Solaris/Linux J2X1-7662-01ENZ0(01) September 2012 Preface Purpose of this manual This manual explains the different commands and messages
Microsoft Windows NT Microsoft Windows Softek AdvancedCopy Manager Operator's Guide V10.0L30
 Microsoft Windows NT Microsoft Windows 2000 Softek AdvancedCopy Manager Operator's Guide V10.0L30 Preface ++ Purpose This manual describes the operations on Softek AdvancedCopy Manager. ++ Intended Readers
FUJITSU Software Interstage Information Integrator V Message Guide. Windows/Solaris/Linux
 FUJITSU Software Interstage Information Integrator V11.0.0 Message Guide Windows/Solaris/Linux B1X1-0298-02ENZ0(00) October 2013 Preface This document deals with the following products: - Interstage Information
Dashboard / Output Guide
 Interstage Business Process Manager Analytics V11.0 Dashboard / Output Guide Windows/Solaris/Linux J2U3-0053-01(00) December 2009 About this Manual This document describes how to use the Dashboard to display
Process Discovery (BPM-E) Web Flow Viewer User's Guide
 Web Flow Viewer User's Guide") Interstage Business Process Manager Analytics V11.1 Process Discovery (BPM-E) Web Flow Viewer User's Guide Windows B1X1-0030-01ENZ0(00) July 2010 About this Manual This manual explains the web-based flow
Interstage Business Process Manager Analytics V11.1 Process Discovery (BPM-E) Web Flow Viewer User's Guide Windows B1X1-0030-01ENZ0(00) July 2010 About this Manual This manual explains the web-based flow
FUJITSU Software Systemwalker Software Configuration Manager. Operator's Guide. Windows/Linux
 FUJITSU Software Systemwalker Software Configuration Manager Operator's Guide Windows/Linux B1X1-0129-04ENZ0(00) March 2014 Preface Purpose of this Document This document explains patch management procedures
ETERNUS SF AdvancedCopy Manager V13.2 GUI User s Guide
 B1WW-8871-03ENZ0(00) ETERNUS SF AdvancedCopy Manager V13.2 GUI User s Guide ii Preface ++ Purpose This manual explains how to operate the Web-GUI with ETERNUS SF AdvancedCopy Manager. ++ Reader This manual
FUJITSU Software Systemwalker Software Configuration Manager. Parameter Reference. Windows/Linux
 FUJITSU Software Systemwalker Software Configuration Manager Parameter Reference /Linux B1X1-0313-03ENZ0(00) November 2015 Preface Purpose of this Document This document explains the parameter information
EXPRESSCLUSTER X SingleServerSafe 3.3 for Windows. Installation Guide. 10/02/2017 6th Edition
 EXPRESSCLUSTER X SingleServerSafe 3.3 for Windows Installation Guide 10/02/2017 6th Edition Revision History Edition Revised Date Description 1st 02/09/2015 New manual 2nd 04/20/2015 Corresponds to the
FUJITSU Software Interstage Business Process Manager Analytics V Migration Guide. Linux
 FUJITSU Software Interstage Business Process Manager Analytics V12.2.1 Migration Guide Linux B1X1-0160-04ENZ0(00) December 2014 Preface This chapter provides a general introduction to this user guide,
High Availability System Guide
 FUJITSU Software Interstage Application Server High Availability System Guide Windows/Solaris/Linux B1WS-1092-03ENZ0(00) April 2014 Preface Purpose of this Document This manual provides information on
FUJITSU Storage ETERNUS SF Express V16.2 / Storage Cruiser V16.2 / AdvancedCopy Manager V16.2. Installation and Setup Guide
 FUJITSU Storage ETERNUS SF Express V16.2 / Storage Cruiser V16.2 / AdvancedCopy Manager V16.2 Installation and Setup Guide B1FW-5999-03ENZ0(02) July 2015 Preface Purpose This manual provides information
User's Guide for Tenant Users
 ServerView Resource Orchestrator Cloud Edition V3.0.0 User's Guide for Tenant Users Windows/Linux J2X1-7615-01ENZ0(05) April 2012 Preface Purpose This document explains how to operate the ROR Console provided
Microsoft Windows NT Microsoft Windows SystemWalker/StorageMGR. Installation Guide V10.0L10
 Microsoft Windows NT Microsoft Windows 2000 SystemWalker/StorageMGR Installation Guide V10.0L10 Preface ++Purpose This manual explains the installation and customization of the SystemWalker/StorageMGR.
Handbook for the Process Discovery
 Interstage Business Process Manager Analytics V12.1 Handbook for the Process Discovery Solaris J2S0-0435-01ENZ0(00) April 2013 About this Manual This section explains summary, chapter overview, abbreviations,
FUJITSU Storage ETERNUS SF Express V16.5 / Storage Cruiser V16.5 / AdvancedCopy Manager V16.5. Installation and Setup Guide
 FUJITSU Storage ETERNUS SF Express V16.5 / Storage Cruiser V16.5 / AdvancedCopy Manager V16.5 Installation and Setup Guide B1FW-5999-06ENZ0(00) May 2017 Preface Purpose This manual provides information
Solaris OE. Softek AdvancedCopy Manager User's Guide 10.2
 Solaris OE Softek AdvancedCopy Manager User's Guide 10.2 Preface ++ Purpose This manual explains how to operate Web-GUI with Softek AdvancedCopy Manager. ++ Reader This manual is intended for system managers
IaaS Integration Guide
 FUJITSU Software Enterprise Service Catalog Manager V16.1.0 IaaS Integration Guide Windows(64) B1WS-1259-02ENZ0(00) September 2016 Preface Purpose of This Document This document explains the introduction
EXPRESSCLUSTER X Integrated WebManager
 EXPRESSCLUSTER X Integrated WebManager Administrator s Guide 10/02/2017 12th Edition Revision History Edition Revised Date Description 1st 06/15/2009 New manual 2nd 09/30/2009 This manual has been updated
Systemwalker Software Configuration Manager. Operation Guide. Windows/Linux
 Systemwalker Software Configuration Manager Operation Guide Windows/Linux B1X1-0128-04ENZ0(00) January 2013 Preface Purpose of this Document This document explains how to use the different features and
RC2000. User's Guide
 RC2000 User's Guide Edition February 2003 Preface Purpose This manual describes the functions and operation of RC2000. RC2000 is a software product that provides functions for operating an OS console
User's Guide (Dashboard Edition)
") Systemwalker Service Quality Coordinator User's Guide (Dashboard Edition) Windows/Solaris/Linux J2X1-7480-01ENZ0(00) November 2010 Preface Purpose of this manual This manual explains the use of the Systemwalker
Systemwalker Service Quality Coordinator User's Guide (Dashboard Edition) Windows/Solaris/Linux J2X1-7480-01ENZ0(00) November 2010 Preface Purpose of this manual This manual explains the use of the Systemwalker
Interstage Business Process Manager Analytics V12.1. Migration Guide. Windows/Linux
 Interstage Business Process Manager Analytics V12.1 Migration Guide Windows/Linux B1X1-0160-02ENZ0(00) January 2013 Preface This chapter provides a general introduction to this user guide, describing its
Interstage Business Process Manager Analytics V11.1. Overview. Windows/Solaris/Linux
 Interstage Business Process Manager Analytics V11.1 Overview Windows/Solaris/Linux J2U3-0051-02(00) July 2010 About this Manual This document provides an overview of Interstage Business Process Manager
Interstage Business Process Manager Analytics V11.1. Installation Guide. Windows/Solaris/Linux
 Interstage Business Process Manager Analytics V11.1 Installation Guide Windows/Solaris/Linux J2U3-0052-02(00) July 2010 About this Manual This document describes how to install Interstage Business Process
Systemwalker Software Configuration Manager. Technical Guide. Windows/Linux
 Systemwalker Software Configuration Manager Technical Guide Windows/Linux B1X1-0126-04ENZ0(00) January 2013 Preface Purpose of this Document This document explains the functions of Systemwalker Software
FUJITSU Software Systemwalker Service Catalog Manager V Installation Guide. Windows/Linux
 FUJITSU Software Systemwalker Service Catalog Manager V15.3.2 Installation Guide Windows/Linux B1WS-1054-06ENZ0(00) January 2015 Preface Purpose of This Document This document explains the installation
Transfer Accelerator Setup Guide
 FUJITSU Software Interstage Information Integrator V11.0.0 Transfer Accelerator Setup Guide Windows/Solaris/Linux B1X1-0297-02ENZ0(00) October 2013 Preface This document deals with the following products:
ExpressCluster X SingleServerSafe 3.2 for Windows. Installation Guide. 2/19/2014 1st Edition
 ExpressCluster X SingleServerSafe 3.2 for Windows Installation Guide 2/19/2014 1st Edition Revision History Edition Revised Date Description First 2/19/2014 New manual Copyright NEC Corporation 2014. All
ETERNUS SF Express V15.0/ Storage Cruiser V15.0/ AdvancedCopy Manager V15.0. Migration Guide
 ETERNUS SF Express V15.0/ Storage Cruiser V15.0/ AdvancedCopy Manager V15.0 Migration Guide B1FW-5958-02ENZ0(01) May 2012 Preface Purpose This manual describes how to upgrade to this version from the previous
IaaS Integration Guide
 FUJITSU Software Enterprise Service Catalog Manager V16.0.0 IaaS Integration Guide Windows(64) B1WS-1259-01ENZ0(00) February 2016 Preface Purpose of This Document This document explains the introduction
ExpressCluster X 2.0 for Linux
 ExpressCluster X 2.0 for Linux Installation and Configuration Guide 03/31/2009 3rd Edition Revision History Edition Revised Date Description First 2008/04/25 New manual Second 2008/10/15 This manual has
PRIMECLUSTER. Web-Based Admin View Operation Guide
 PRIMECLUSTER Web-Based Admin View Operation Guide Edition June 2004 Preface This manual outlines the functions and operation of the Web-Based Admin View. Web-Based Admin View is a common base to utilize
FUJITSU Software Interstage Information Integrator V Command Reference. Windows
 FUJITSU Software Interstage Information Integrator V11.0.0 Command Reference Windows B1X1-0296-01ENZ0(00) August 2013 Preface This document deals with the following products: - Interstage Information Integrator
Systemwalker Software Configuration Manager. Reference Guide. Windows/Linux
 Systemwalker Software Configuration Manager Reference Guide Windows/Linux B1X1-0130-04ENZ0(00) January 2013 Preface Purpose of this Document This document explains the commands and files provided by Systemwalker
HA Monitor Kit for Oracle
 For Linux (R) (x86) Systems HA Monitor Kit for Oracle Description and User's Guide 3000-9-135-10(E) Relevant program products P-F9S2C-E1121 HA Monitor Kit for Oracle 01-01 (for Red Hat Enterprise Linux
Systemwalker Desktop Patrol V14g. Installation Guide. Windows
 Systemwalker Desktop Patrol V14g Installation Guide Windows B1WD-2704-04ENZ0(00) March 2012 Preface Purpose of this Guide This guide describes necessary setting and operating procedures to install the
VPN Connection to HFM Server at Poltrona FrauSite Below it is described how to connect You to Poltronafrau.it domain through a VPN connection.
 IT Technical Documents Author HFM - User Guide Creation Date 24/11/2008 Revised by Revision 17/01/2008 ID Doc. VPN Connection to HFM Server at Poltrona FrauSite Below it is described how to connect You
ETERNUS SF AdvancedCopy Manager V13.2 Operator's Guide (HP-UX)
") J2SZ-0180-03ENZ0(A) ETERNUS SF AdvancedCopy Manager V13.2 Operator's Guide (HP-UX) ii Preface ++ Purpose This manual explains how to operate the Web-GUI with ETERNUS SF AdvancedCopy Manager. ++ Reader
J2SZ-0180-03ENZ0(A) ETERNUS SF AdvancedCopy Manager V13.2 Operator's Guide (HP-UX) ii Preface ++ Purpose This manual explains how to operate the Web-GUI with ETERNUS SF AdvancedCopy Manager. ++ Reader
Tuning Manager Software
 Hitachi Command Suite Tuning Manager Software Getting Started Guide FASTFIND LINKS Document Organization Product Version Getting Help Contents MK-96HC120-08 Copyright 2010 Hitachi Ltd., Hitachi Data Systems
Interstage Business Process Manager Analytics V12.0 Studio Guide
 Interstage Business Process Manager Analytics V12.0 Studio Guide Windows/Linux January 2012 Studio Guide Trademarks Trademarks of other companies are used in this documentation only to identify particular
Troubleshooting Guide
 Systemwalker Runbook Automation Troubleshooting Guide Windows/Linux B1X1-0122-05ENZ0(00) February 2013 Preface Purpose of This Document This document describes how to deal with problems that occur with
FUJITSU Storage ETERNUS SF Storage Cruiser V16.2 / AdvancedCopy Manager V16.2. Operation Guide for VMware vsphere Virtual Volumes
 FUJITSU Storage ETERNUS SF Storage Cruiser V16.2 / AdvancedCopy Manager V16.2 Operation Guide for VMware vsphere Virtual Volumes B1FW-6020-01ENZ0(02) July 2015 Preface Purpose This manual explains the
EXPRESSCLUSTER X SingleServerSafe 4.0 for Windows. Installation Guide. April 17, st Edition
 EXPRESSCLUSTER X SingleServerSafe 4.0 for Windows Installation Guide April 17, 2018 1st Edition Revision History Edition Revised Date Description 1st Apr 17, 2018 New manual Copyright NEC Corporation 2018.
SystemWalker/StorageMGR User's Guide Solaris-
 SystemWalker/StorageMGR User's Guide 10.0 -Solaris- Preface ++ Purpose This manual explains how to operate Web-GUI with SystemWalker/StorageMGR. SystemWalker is a generic name for products for operation
ServerView Resource Coordinator VE. Installation Guide. Windows/Linux
 ServerView Resource Coordinator VE Installation Guide Windows/Linux J2X1-7458-03ENZ0(00) February 2010 Preface Purpose This manual explains how to install ServerView Resource Coordinator VE (hereinafter
FUJITSU Software ServerView Resource Orchestrator Cloud Edition V Quick Start Guide. Windows/Linux
 FUJITSU Software ServerView Resource Orchestrator Cloud Edition V3.1.2 Quick Start Guide Windows/Linux J2X1-7622-06ENZ0(01) June 2014 Preface Purpose of This Document This manual explains the flow of installation
PRIMECLUSTER. Web-Based Admin View Operation Guide
 PRIMECLUSTER Web-Based Admin View Operation Guide Edition August 2005 Preface This manual outlines the functions and operation of the Web-Based Admin View. Web-Based Admin View is a common base to utilize
Copyright FUJITSU LIMITED
 ******************************************************************************** ** ** ** Systemwalker Templates Installation (readme) ** ** - Event Monitor Templates ** ** - Process Monitor Templates
FUJITSU Storage ETERNUS SF Express V16.1 / Storage Cruiser V16.1 / AdvancedCopy Manager V16.1. Installation and Setup Guide
 FUJITSU Storage ETERNUS SF Express V16.1 / Storage Cruiser V16.1 / AdvancedCopy Manager V16.1 Installation and Setup Guide B1FW-5999-02ENZ0(00) June 2014 Preface Purpose This manual provides information
Performance Monitoring User s Manual
 NEC Storage Software Performance Monitoring User s Manual IS025-32E NEC Corporation 2003-2017 No part of the contents of this book may be reproduced or transmitted in any form without permission of NEC
Management Console Guide
 FUJITSU Software Interstage Business Process Manager Analytics V12.2 Management Console Guide Windows/Linux B1X1-0109-03ENZ0(00) February 2014 About this Manual This section explains summary, chapter overview,
FUJITSU Storage ETERNUS SF AdvancedCopy Manager V16.0. Overview
 FUJITSU Storage ETERNUS SF AdvancedCopy Manager V16.0 Overview B1FW-6009-01ENZ0(01) May 2014 Preface Purpose This manual provides an overview for understanding the FUJITSU Storage ETERNUS SF AdvancedCopy
FUJITSU Storage ETERNUS SF AdvancedCopy Manager V16.1. Overview
 FUJITSU Storage ETERNUS SF AdvancedCopy Manager V16.1 Overview B1FW-6009-02ENZ0(00) June 2014 Preface Purpose This manual provides an overview for understanding the FUJITSU Storage ETERNUS SF AdvancedCopy
FUJITSU Software Systemwalker Desktop Patrol. Reference Manual. Windows
 FUJITSU Software Systemwalker Desktop Patrol Reference Manual Windows B1WD-3290-08ENZ0(00) March 2018 Preface Purpose of this guide This guide explains commands, CSV input/output file formats, and output
User's Guide (Dashboard Edition)
") Systemwalker Service Quality Coordinator User's Guide (Dashboard Edition) Windows/Solaris/Linux J2X1-7480-02ENZ0(00) May 2011 Preface Purpose of this manual This manual explains the use of the Systemwalker
Systemwalker Service Quality Coordinator User's Guide (Dashboard Edition) Windows/Solaris/Linux J2X1-7480-02ENZ0(00) May 2011 Preface Purpose of this manual This manual explains the use of the Systemwalker
FUJITSU Software Interstage AR Processing Server V1.0. Overview
 FUJITSU Software Interstage AR Processing Server V1.0 Overview B1WS-1115-01ENZ0(00) January 2014 Preface Purpose of this document This document provides an overview of Interstage AR Processing Server.
Microsoft Windows NT Microsoft Windows SystemWalker/StorageMGR. User's Guide V10.0L10
 Microsoft Windows NT Microsoft Windows 2000 SystemWalker/StorageMGR User's Guide V10.0L10 Preface ++ Purpose This manual explains how to operate Web-GUI with SystemWalker/StorageMGR. SystemWalker is a