Lesson 3 Diagnostic Data Collection and Analysis tools
|
|
|
- Oswald Copeland
- 6 years ago
- Views:
Transcription
1

2 Lesson 3 Diagnostic Data Collection and Analysis tools Poonam Parhar JVM Sustaining Engineer Oracle
3 Agenda Diagnostic Data, Data Collection and Analysis tools 1. Java Heap Memory Issues 2. OutOfMemoryError due to Finalization 3. PermGen/Metaspace Memory Issues 4. CodeCache Issues 5. Native Memory Issues 3
4 Java Heap: Memory Leak 4
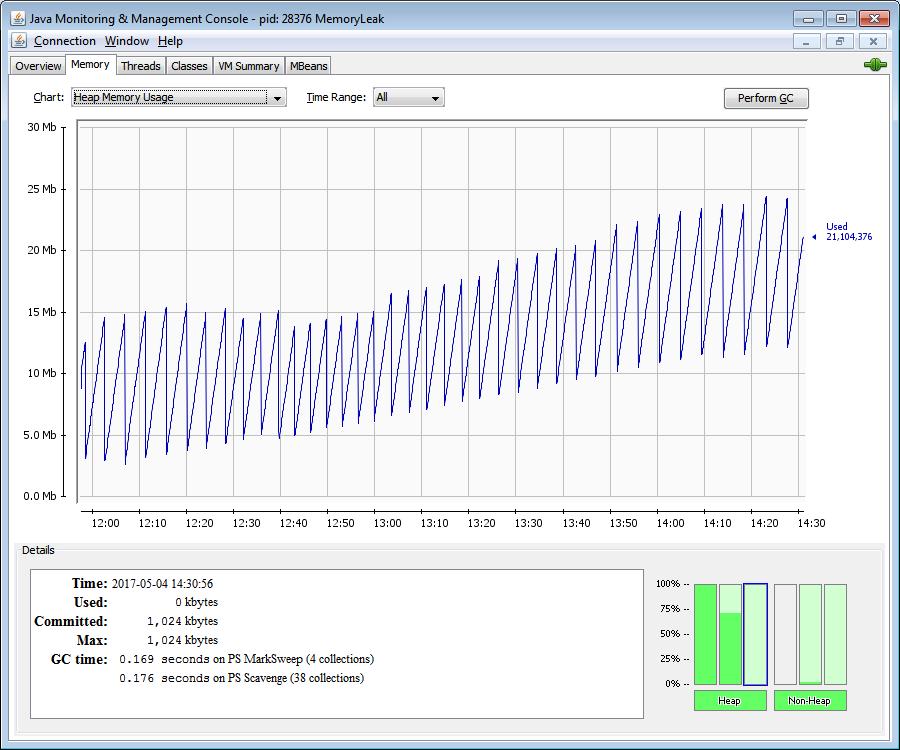
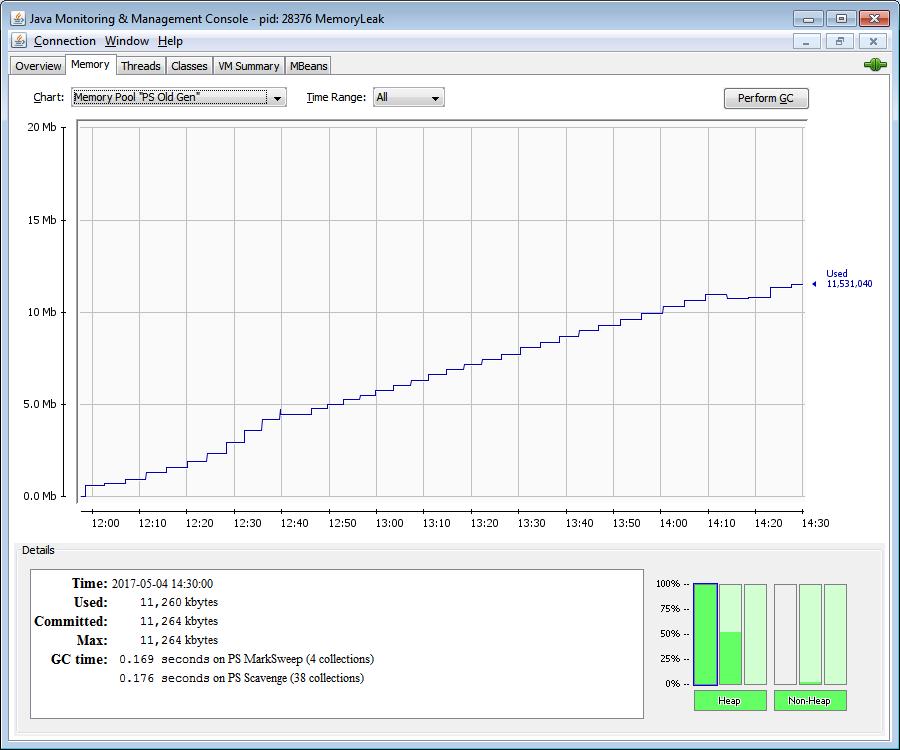
5 Confirm Memory Leak Monitor Java Heap usage over time If the Full GCs are not able to claim any space in the Old Gen of the heap then it could be a configuration issue Heap might be sized too small Increase the heap size and test the application again If there is continuous memory growth and the failure persists at the increased heap size too, there could be a memory leak 5
6 Monitor using GC Logs [GC (Allocation Failure) [PSYoungGen: K->153251K(433152K)] K-> K( K), secs] [Times: user=1.78 sys=0.13, real=0.56 secs] [Full GC (Ergonomics) [PSYoungGen: K->0K(433152K)] [ParOldGen: K-> K( K)] K-> K( K), [Metaspace: 2722K->2722K( K)], secs] [Times: user=10.09 sys=0.00, real=4.52 secs] [GC (Allocation Failure) [PSYoungGen: K->209511K(448512K)] K-> K( K), secs] [Times: user=0.48 sys=0.06, real=0.15 secs] [GC (Allocation Failure) [PSYoungGen: K->223744K(448512K)] K-> K( K), secs] [Times: user=1.62 sys=0.26, real=0.49 secs] [Full GC (Ergonomics) [PSYoungGen: K->36309K(448512K)] [ParOldGen: K-> K( K)] K-> K( K), [Metaspace: 2722K->2722K( K)], secs] [Times: user=12.65 sys=0.02, real=5.08 secs] [Full GC (Ergonomics) [PSYoungGen: K->197043K(448512K)] [ParOldGen: K-> K( K)] K-> K( K), [Metaspace: 2722K->2722K( K)], secs] [Times:user=11.82 sys=0.00, real=3.03 secs] [Full GC (Allocation Failure) [PSYoungGen: K->197043K(448512K)] [ParOldGen: K-> K( K)] K- > K( K), [Metaspace: 2722K->2722K( K)], secs][times: user=20.80 sys=0.01, real=6.95 secs] java.lang.outofmemoryerror: Java heap space 6
7 7
8 8
9 Appropriate Heap Size -Xmx 9
10 Java Heap: Diagnostic Data 10
11 Java heap: Diagnostic Data GC Logs Heap usage details GC pauses Help in appropriate configuration of memory pools Heap Dumps Unexpected memory growth and memory leaks Heap Histograms Quick view of the heap to understand what is growing Java Flight Recordings Unexpected memory growth and memory leaks GC Events 11
12 GC Logs Very helpful in determining the heap requirements Excessive GCs Long GC pauses 12
13 GC Logging Options Java 9: G1: -Xlog:gc*,gc+phases=debug:file=gc.log Non-G1: -Xlog:gc*:file=gc.log Prior Java Versions -XX:+PrintGCDetails -XX:+PrintGCTimeStamps -XX:+PrintGCDateStamps -Xloggc:<gc log file> 13
14 GC Logs: Heap Usage T13:21: : : [Full GC [PSYoungGen: K->182660K(364544K)] [ParOldGen: K- > K( K)] K-> K( K) [PSPermGen: K->493573K(494080K)], secs] [Times: user=6.01 sys=0.00, real=1.29 secs] 14
15 GC Logs: Excessive GCs 4.381: [Full GC (Ergonomics) [PSYoungGen: 6656K->6656K(7680K)] [ParOldGen: 16823K->16823K(17920K)] 23479K- >23479K(25600K), [Metaspace: 2724K->2724K( K)], secs] [Times: user=0.23 sys=0.00, real=0.07 secs] 4.458: [Full GC (Ergonomics) [PSYoungGen: 6656K->6656K(7680K)] [ParOldGen: 16824K->16824K(17920K)] 23480K- >23480K(25600K), [Metaspace: 2724K->2724K( K)], secs] [Times: user=0.16 sys=0.00, real=0.05 secs] 4.515: [Full GC (Ergonomics) [PSYoungGen: 6656K->6656K(7680K)] [ParOldGen: 16826K->16826K(17920K)] 23482K- >23482K(25600K), [Metaspace: 2724K->2724K( K)], secs] [Times: user=0.19 sys=0.00, real=0.05 secs] 4.573: [Full GC (Ergonomics) [PSYoungGen: 6656K->6656K(7680K)] [ParOldGen: 16827K->16827K(17920K)] 23483K- >23483K(25600K), [Metaspace: 2725K->2725K( K)], secs] [Times: user=0.19 sys=0.00, real=0.05 secs] 4.631: [Full GC (Ergonomics) [PSYoungGen: 6656K->6656K(7680K)] [ParOldGen: 16828K->16828K(17920K)] 23484K- >23484K(25600K), [Metaspace: 2729K->2729K( K)], secs] [Times: user=0.17 sys=0.00, real=0.05 secs] 4.688: [Full GC (Ergonomics) [PSYoungGen: 6656K->6656K(7680K)] [ParOldGen: 16830K->16830K(17920K)] 23486K- >23486K(25600K), [Metaspace: 2729K->2729K( K)], secs] [Times: user=0.19 sys=0.00, real=0.05 secs] 4.746: [Full GC (Ergonomics) [PSYoungGen: 6656K->6656K(7680K)] [ParOldGen: 16831K->16831K(17920K)] 23487K- >23487K(25600K), [Metaspace: 2729K->2729K( K)], secs] [Times: user=0.19 sys=0.00, real=0.05 secs] 15
16 GC Logs: Long GC Pauses T14:49: : : [Full GC (Allocation Failure) 31G->24G(31G), secs] [Eden: 0.0B(1632.0M)->0.0B(2048.0M) Survivors: 0.0B->0.0B Heap: 31.8G(31.9G)->24.5G(31.9G)], [Metaspace: 29930K->29564K( K)] [Times: user=83.83 sys=0.00, real=50.84 secs] 16
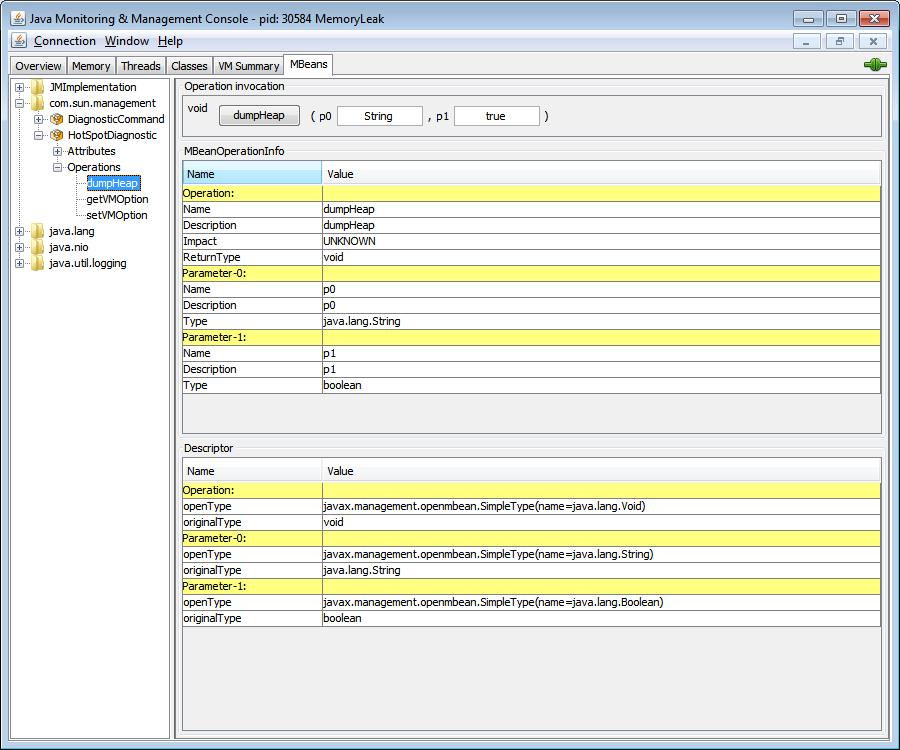
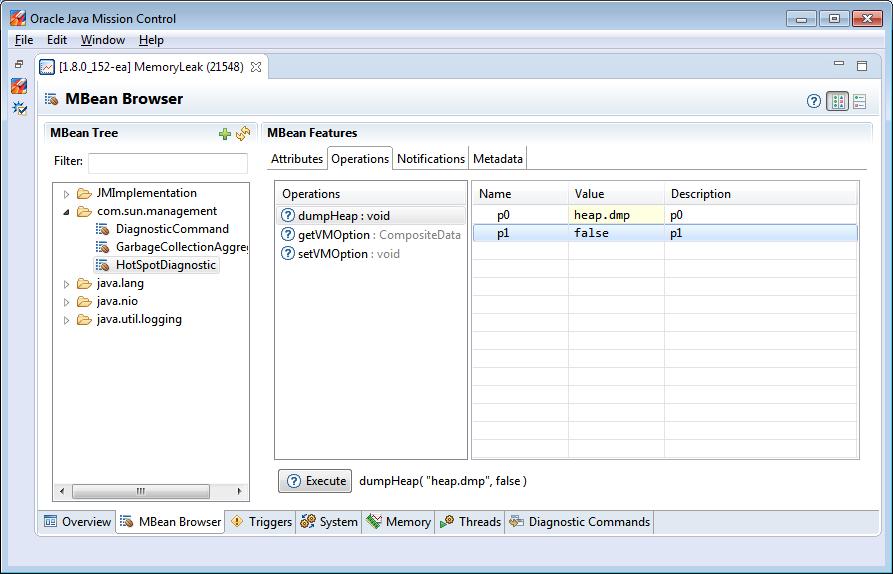
17 Heap Dumps Most important diagnostic data for troubleshooting memory issues Can be collected using: jcmd <pid/main class> GC.heap_dump heapdump.dmp jmap -dump:format=b,file=snapshot.jmap <pid> JConsole utility, using Mbean HotSpotDiagnostic Java Mission Control, using Mbean HotSpotDiagnostic -XX:+HeapDumpOnOutOfMemoryError 17
18 18
19 19
20 -XX:+HeapDumpOnOutOfMemoryError <several Full GCs> [Full GC (Ergonomics) [PSYoungGen: 12799K->12799K(14848K)] [ParOldGen: 33957K->33957K(34304K)] 46757K- >46757K(49152K), [Metaspace: 2723K->2723K( K)], secs] [Times: user=0.25 sys=0.00, real=0.09 secs] [Full GC (Ergonomics) [PSYoungGen: 12799K->12799K(14848K)] [ParOldGen: 33958K->33946K(34304K)] 46758K- >46746K(49152K), [Metaspace: 2723K->2723K( K)], secs] [Times: user=0.38 sys=0.00, real=0.11 secs] [Full GC (Ergonomics) [PSYoungGen: 12799K->12799K(14848K)] [ParOldGen: 33947K->33947K(34304K)] 46747K- >46747K(49152K), [Metaspace: 2723K->2723K( K)], secs] [Times: user=0.36 sys=0.00, real=0.11 secs] [Full GC (Ergonomics) [PSYoungGen: 12799K->12799K(14848K)] [ParOldGen: 33949K->33949K(34304K)] 46749K- >46749K(49152K), [Metaspace: 2723K->2723K( K)], secs] [Times: user=0.39 sys=0.00, real=0.09 secs] [Full GC (Ergonomics) [PSYoungGen: 12799K->12799K(14848K)] [ParOldGen: 33950K->33950K(34304K)] 46750K- >46750K(49152K), [Metaspace: 2723K->2723K( K)], secs] [Times: user=0.36 sys=0.00, real=0.10 secs] [Full GC (Ergonomics) [PSYoungGen: 12799K->12799K(14848K)] [ParOldGen: 33951K->33951K(34304K)] 46751K- >46751K(49152K), [Metaspace: 2723K->2723K( K)], secs] [Times: user=0.33 sys=0.00, real=0.10 secs] [Full GC (Ergonomics) [PSYoungGen: 12799K->12799K(14848K)] [ParOldGen: 33953K->33953K(34304K)] 46753K- >46753K(49152K), [Metaspace: 2723K->2723K( K)], secs] [Times: user=0.39 sys=0.00, real=0.09 secs][full GC (Ergonomics) [PSYoungGen: 12799K->12799K(14848K)] [ParOldGen: 33954K- >33954K(34304K)] 46754K->46754K(49152K), [Metaspace: 2723K->2723K( K)], secs] [Times: user=0.39 sys=0.00, real=0.08 secs] [Full GC (Ergonomics) [PSYoungGen: 12799K->12799K(14848K)] [ParOldGen: 33955K->33955K(34304K)] 46755K- >46755K(49152K), [Metaspace: 2723K->2723K( K)], secs] [Times: user=0.31 sys=0.00, real=0.10 secs] [Full GC (Ergonomics) [PSYoungGen: 12799K->12799K(14848K)] [ParOldGen: 33957K->33957K(34304K)] 46757K- >46757K(49152K), [Metaspace: 2723K->2723K( K)], secs] [Times: user=0.36 sys=0.00, real=0.10 secs] java.lang.outofmemoryerror: GC overhead limit exceeded Dumping heap to java_pid18904.hprof... GC can continuously attempt to free up room on the heap by invoking frequent back-to-back Full GCs Even when the gains of the efforts are very little This impacts the performance of the application and delays the restart of the process Delays the collection of heap dump 20
21 -XX:GCTimeLimit and -XX:GCHeapFreeLimit GCTimeLimit sets an upper limit on the amount of time that GCs can spend in percent of the total time Its default value is 98% Decreasing this value reduces the amount of time allowed that can be spent in the garbage collections GCHeapFreeLimit sets a lower limit on the amount of space that should be free after the garbage collections, represented as percent of the maximum heap Its default value is 2% Increasing this value means that more heap space should get reclaimed by the GCs. An OutOfMemoryError is thrown after a Full GC if the previous 5 consecutive GCs (could be minor or full) were not able to keep the GC cost below GCTimeLimit and were not able to free up GCHeapFreeLimit space. 21
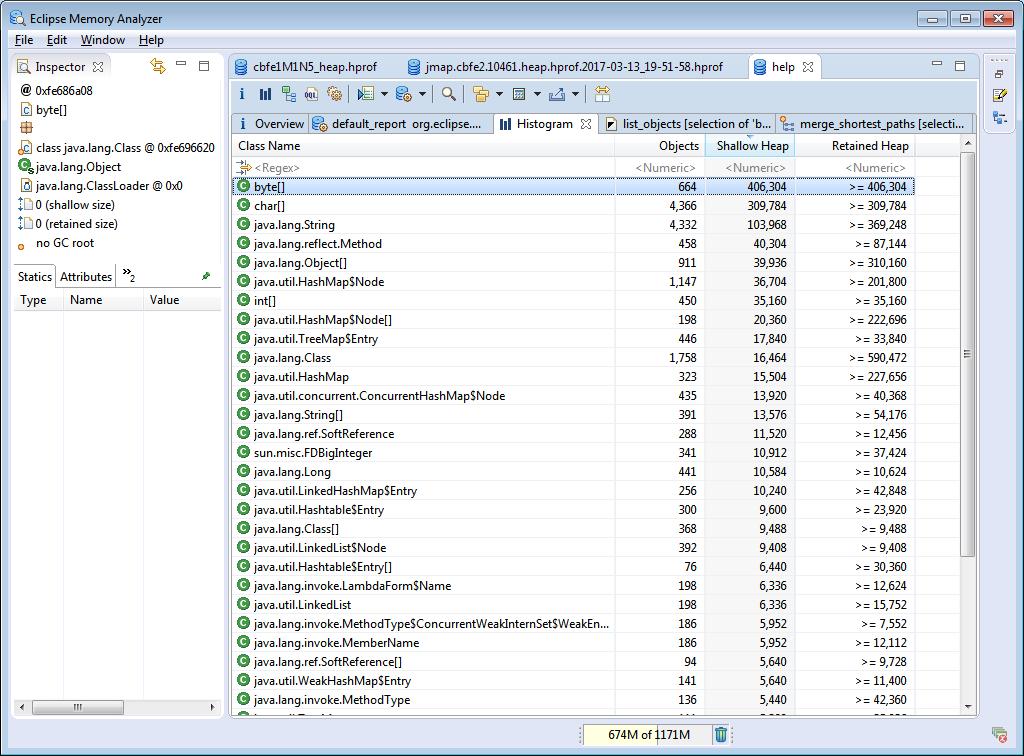
22 Heap Histograms Quick glimpse of objects in Java heap Can be collected using: -XX:+PrintClassHistogram, and SIGQUIT on Posix platforms and SIGBREAK on Windows jcmd <process id/main class> GC.class_histogram filename=myheaphistogram jmap -histo pid jmap -histo <java> core_file jhsdb jmap (in JDK 9) Java Mission Control (Diagnostic Commands) 22

23 Histogram 23
24 Java Flight Recordings Flight Recordings with Heap Statistics enabled can be really helpful in troubleshooting memory leaks Enable Heap Statistics by going to Window->Flight Recording Template Manager in JMC Edit manually in the.jfc file: <event path="vm/gc/detailed/object_count"> </event> <setting name="enabled" control="heap-statistics-enabled">true</setting> <setting name="period">everychunk</setting> 24
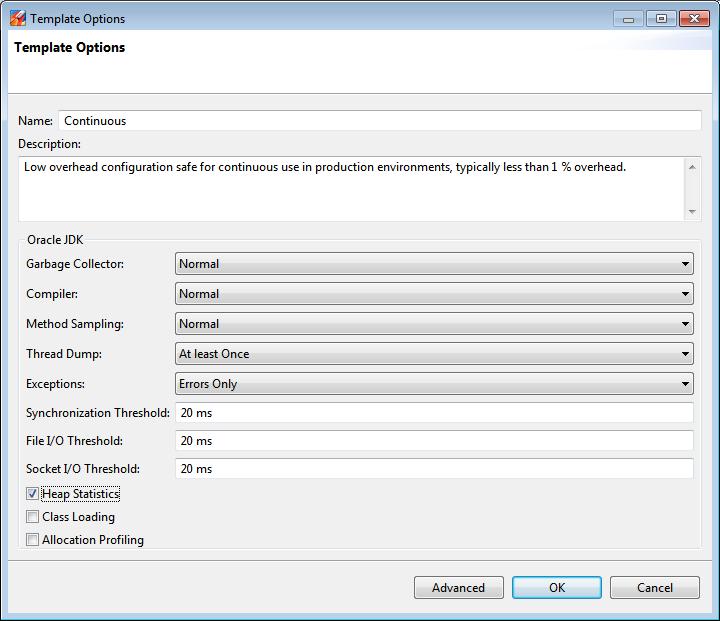
25 25
26 Create Java Flight Recordings JVM Flight Recorder options, e.g. -XX:+UnlockCommercialFeatures -XX:+FlightRecorder - XX:StartFlightRecording=delay=20s,duration=60s,name=MyRecording,filename=C:\TEMP\myrecording. jfr,settings=profile Java Diagnostic Command: jcmd jcmd 7060 JFR.start name=myrecording settings=profile delay=20s duration=2m filename=c:\temp\myrecording.jfr Java Mission Control Connect to the process and follow the wizard The Flight Recordings can take us as far as determining the type of objects that are leaking but to find out what is causing those objects to leak, we require heap dumps 26
27 Java Heap: Analysis of Diagnostic Data 27
28 GC Logs Analysis 28
29 GC Logs Analysis What do we want to look for: Are there too many Full GCs? Are there GCs with long pauses? Are there GCs happening too frequently? Manual inspection Automatic Analysis tools Examples: GCHisto, GCViewer, gceasy.io etc. 29
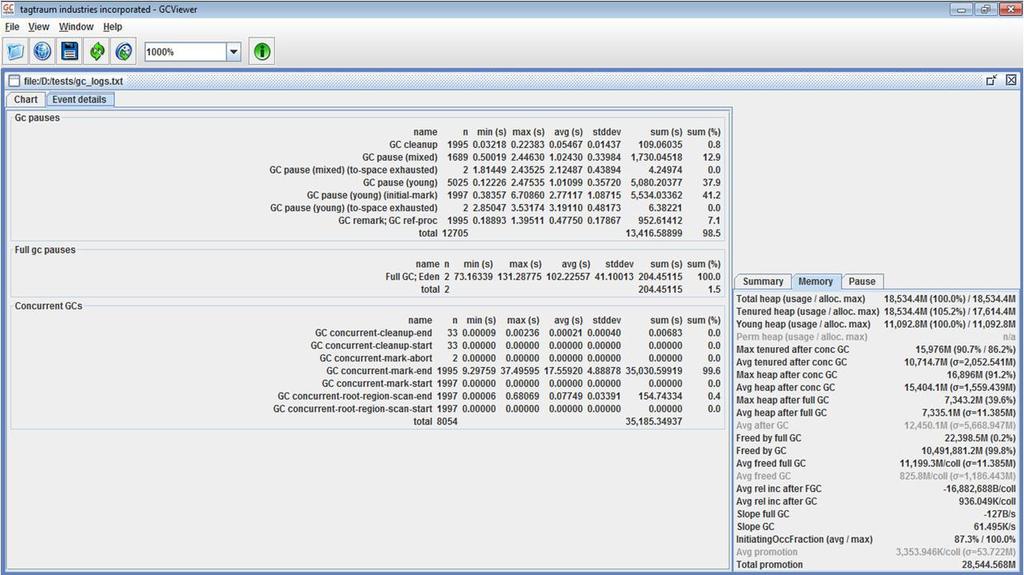
30 30
31 (to-space exhausted), secs] [Parallel Time: ms, GC Workers: 16] [GC Worker Start (ms): Min: , Avg: , Max: , Diff: 0.5] [Ext Root Scanning (ms): Min: 869.1, Avg: 896.0, Max: 952.5, Diff: 83.4, Sum: ] [Update RS (ms): Min: 18.4, Avg: 27.0, Max: 34.6, Diff: 16.2, Sum: 431.5] [Processed Buffers: Min: 18, Avg: 33.0, Max: 48, Diff: 30, Sum: 528] [Scan RS (ms): Min: 0.0, Avg: 0.0, Max: 0.1, Diff: 0.1, Sum: 0.3] [Code Root Scanning (ms): Min: 0.0, Avg: 0.0, Max: 0.0, Diff: 0.0, Sum: 0.0] [Object Copy (ms): Min: , Avg: , Max: , Diff: 72.5, Sum: ] [Termination (ms): Min: 0.0, Avg: 0.2, Max: 0.3, Diff: 0.3, Sum: 3.0] [GC Worker Other (ms): Min: 0.0, Avg: 0.2, Max: 0.4, Diff: 0.3, Sum: 2.8] [GC Worker Total (ms): Min: , Avg: , Max: , Diff: 0.6, Sum: ] [GC Worker End (ms): Min: , Avg: , Max: , Diff: 0.3] [Code Root Fixup: 8.4 ms] [Code Root Migration: 0.0 ms] [Clear CT: 0.5 ms] [Other: 63.0 ms] [Choose CSet: 0.0 ms] [Ref Proc: 1.1 ms] [Ref Enq: 0.0 ms] [Free CSet: 0.4 ms] [Eden: 64.0M(792.0M)->0.0B(920.0M) Survivors: 128.0M->0.0B Heap: 18.1G(18.1G)->12.1G(18.1G)] [Times: user=25.31 sys=1.01, real=2.85 secs] 31
32 Explicit Full GCs : [Full GC (System) [PSYoungGen: 22789K->0K(992448K)] [PSOldGen: K-> K( K)] K-> K( K) [PSPermGen: K->164914K(166720K)], secs] [Times: user=5.69 sys=0.06, real=5.75 secs] -Dsun.rmi.dgc.server.gcInterval=n -Dsun.rmi.dgc.client.gcInterval=n Solution: -XX:+DisableExplicitGC kill -3 with -XX:+PrintClassHistogram 32
33 Heap Dump Analysis 33
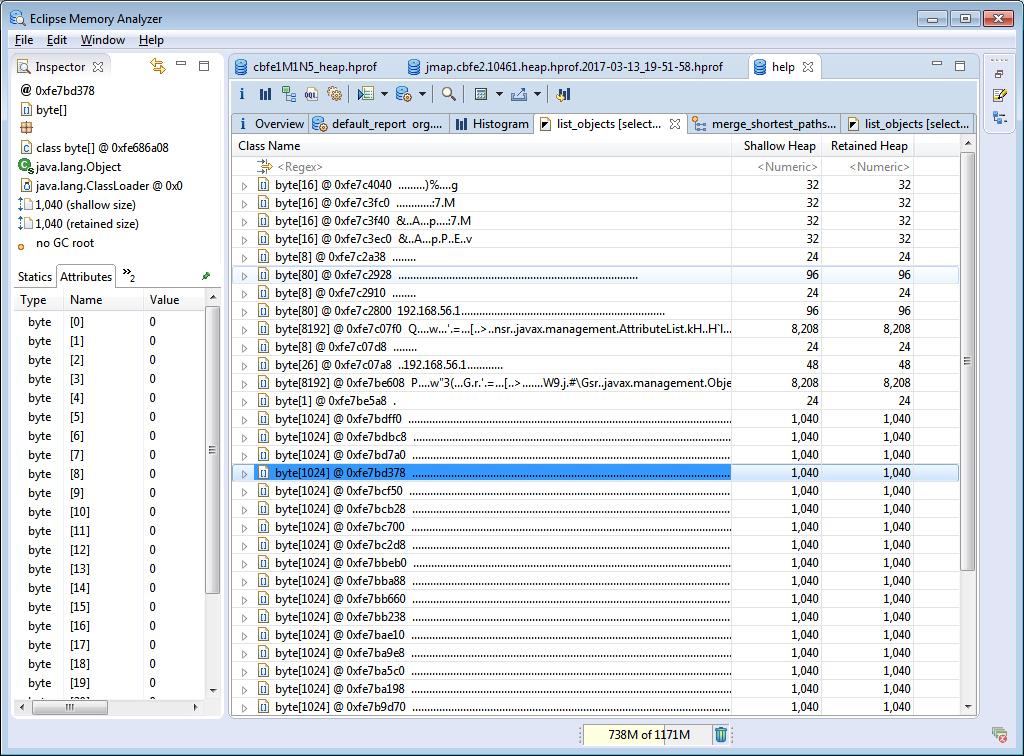
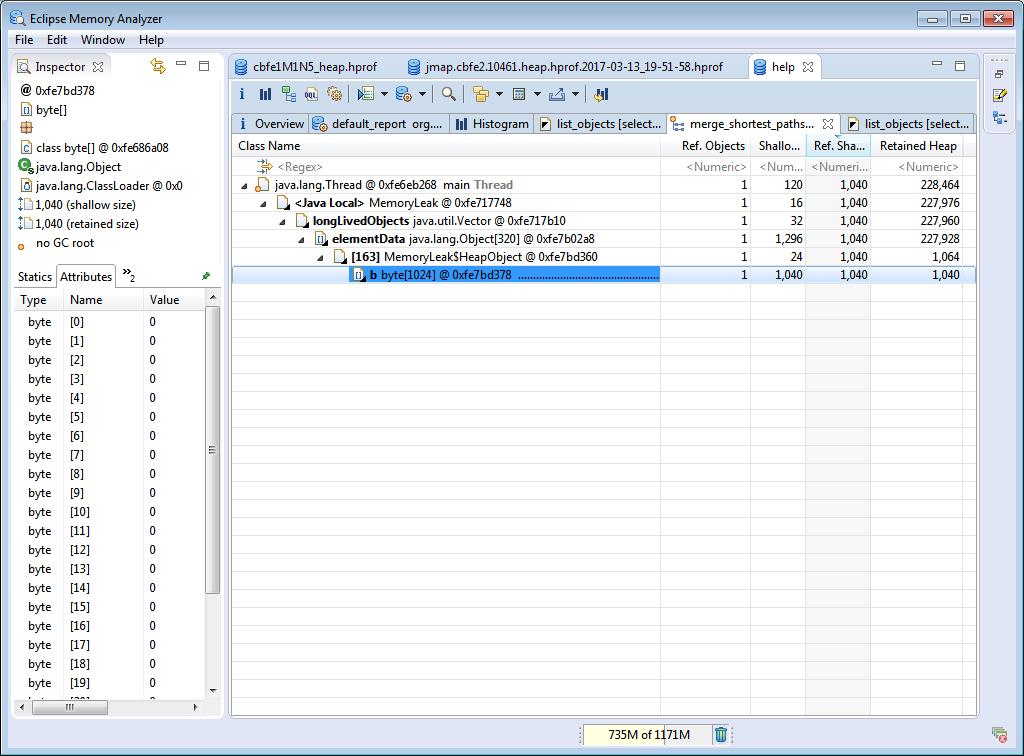
34 Eclipse MAT - Memory Analyzer Tool Community developed tool for analyzing heap dumps Some of the amazing features that it offers are: Leak Suspects Histograms Unreachable objects Duplicate Classes Path to GC roots OQL 34
35 JOverflow for Java Mission Control JOverflow is an experimental plugin Enables Java Mission Control to perform simple heap dump analysis and reports where the memory might have been wasted 35
36 Java VisualVM All-in-one tool for monitoring, profiling and troubleshooting Java applications Available as a JDK tool as well as can be downloaded from GitHub Capable of doing heap dump analysis 36
37 jhat Self-contained web application that is started at the command line (in our <jdk>/bin folder.) Enables heap dump analysis by browsing objects in the heap dump using any web browser By default the web server is started at port jhat supports a wide range of pre-designed queries and Object Query Language(OQL) to explore the objects in the heap dumps Removed in JDK 9 37
38 YourKit Commercial Java profiler with a heap dump analyzer YourKit offers Reachability Scope Memory Inspections It offers a comprehensive set of built-in queries that can inspect the memory looking for anti-patterns and provides causes and solutions for common memory problems 38
39 39
40 40
41 41
42 Java Flight Recording Analysis 42
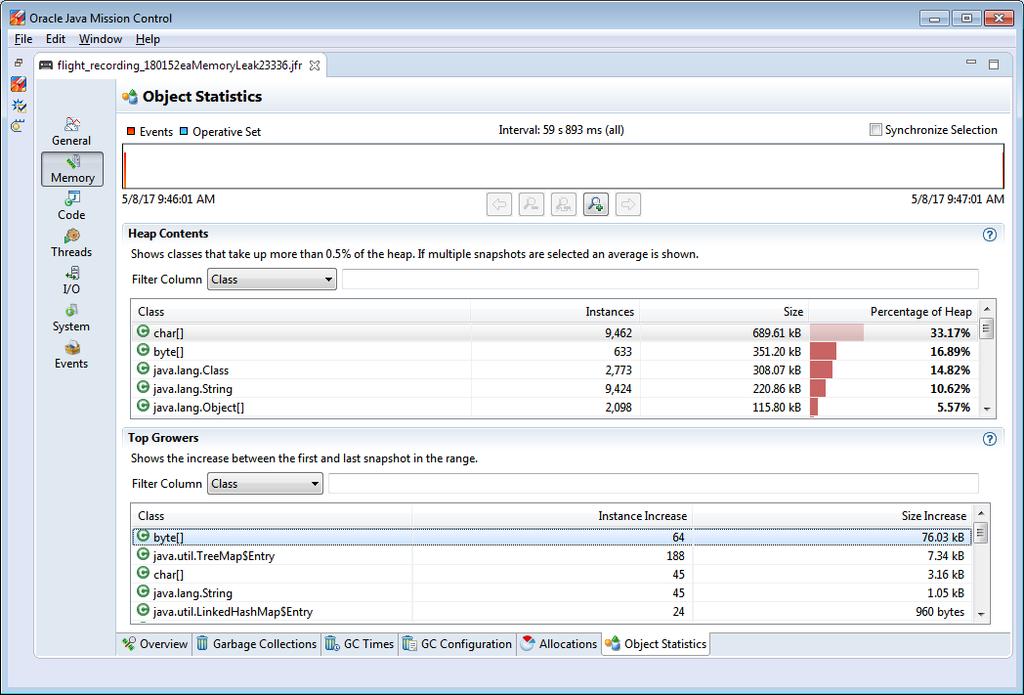
43 Java Mission Control Java Mission Control is available in the <jdk>/bin folder of the JDK. Flight Recordings collected with Heap Statistics enabled can greatly help in troubleshooting memory leaks Object Statistics under Memory->Object Statistics. Shows the object histogram including the percentage of the heap that each object type occupies Shows Top Growers in the heap. These usually have a direct correlation with the leaking objects 43
44 44
45 OutOfMemoryError due to Finalization 45
46 Finalization OutOfMemoryError can also be caused due to excessive use of finalizers Objects with a finalizer (i.e. a finalize() method) may delay the reclamation of the space occupied by them Finalizer thread needs to invoke the finalize() method of the instances before those instances can be reclaimed If the Finalizer thread does not keep up with the rate at which the objects become eligible for finalization, JVM might fail with an OutOfMemoryError Deprecated in Java 9 46
47 Finalization: Diagnostic Data and Tools 47
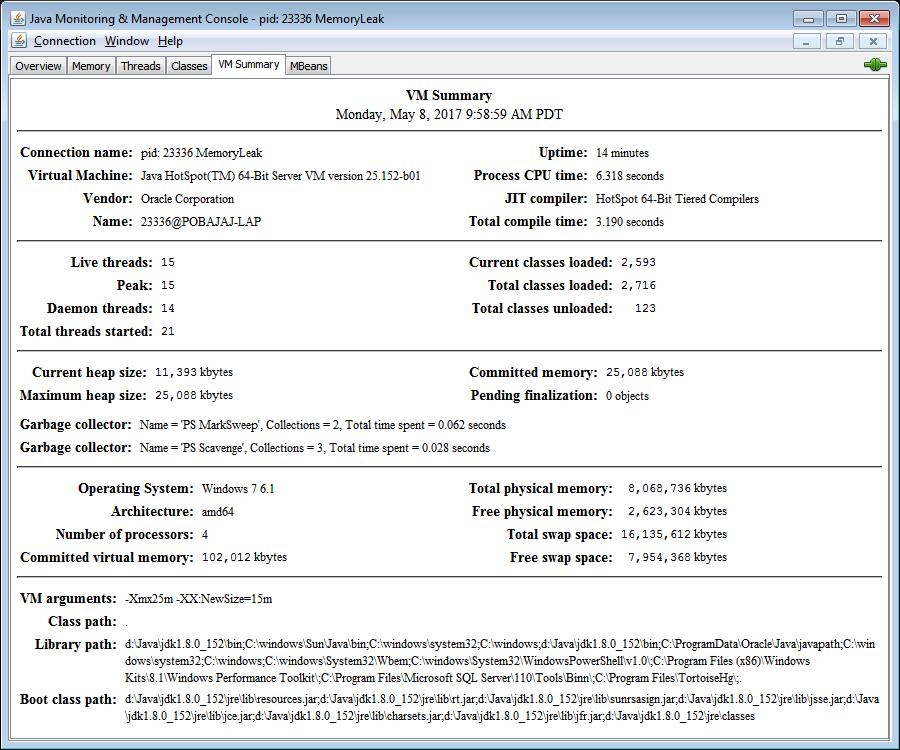
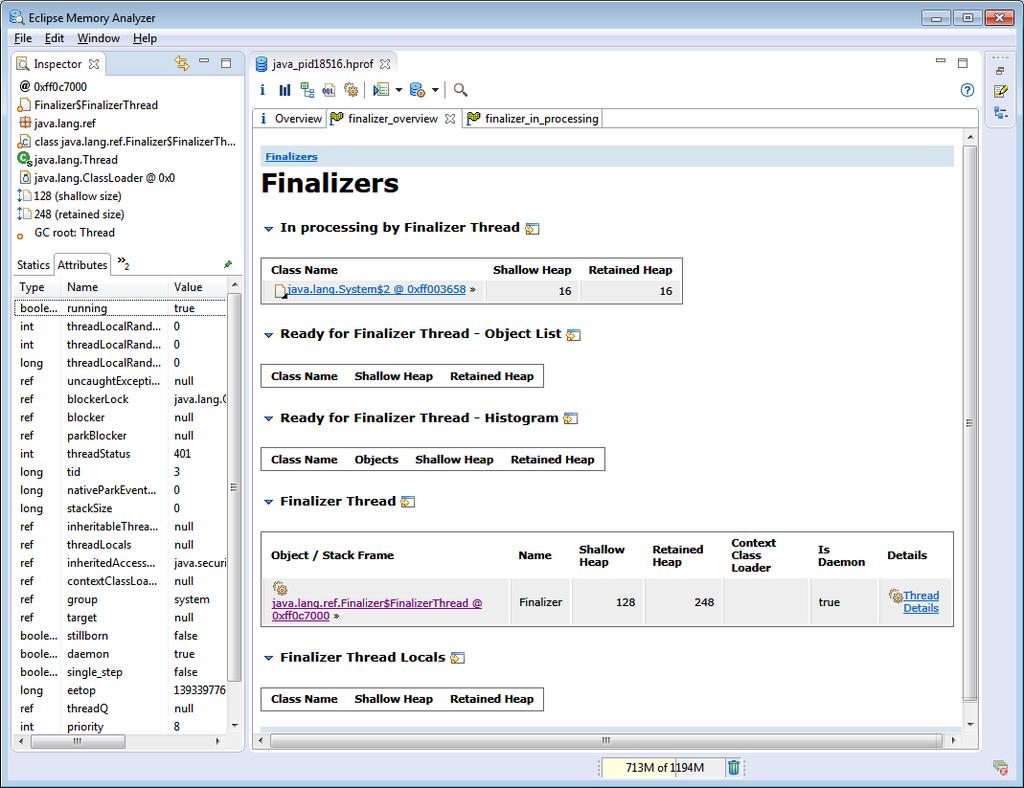
48 Finalization: Diagnostic Data and Tools JConsole jmap -finalizerinfo Heap Dumps 48
49 49
50 50

51 Finalization Info from Heap Dump with VisualVM 51
52 PermGen/MetaSpace: Memory leak 52
53 Confirm Memory Leak Monitor PermGen/Metaspace usage over time If the Full GCs are not able to claim any space in the PermGen/Metaspace then it could be a configuration issue PermGen/Metaspace might be sized too small Increase the PermGen/Metaspace size and test the application again If there is continuous memory growth and the failure persists at the increased PermGen/Metaspace size too, there could be a memory leak 53
54 Monitor GC Logs : [Full GC [PSYoungGen: K->0K(922048K)] [PSOldGen: K- > K( K)] K-> K( K) [PSPermGen: K- >164249K(166016K)], secs] [Times: user=6.80 sys=0.02, real=6.81 secs] : [Full GC [PSYoungGen: K->0K(922048K)] [PSOldGen: K- > K( K)] K-> K( K) [PSPermGen: K- >164849K(166016K)], secs] [Times: user=4.80 sys=0.02, real=4.81 secs] 54
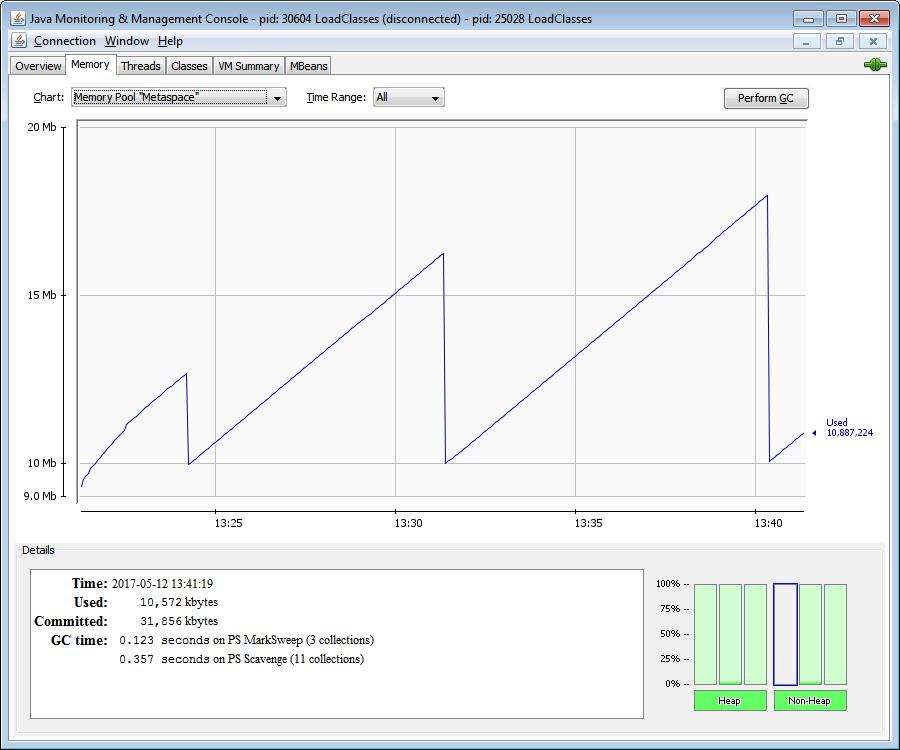
55 55
56 Configure PermGen Size XX:PermSize=m XX:MaxPermSize=n 56
57 Configure Metaspace Size -XX:MetaspaceSize=m -XX:MaxMetaspaceSize=n 57
58 OutOfMemoryError: Compressed class space If UseCompressedClassPointers is enabled, then two separate areas of native memory are used for class metadata By default UseCompressedClassPointers is ON if UseCompressedOops is ON 64-bit class pointers are represented by 32-bit offsets 32-bit offsets can be used to reference class-metadata stored in the compressed class space By default, 1GB of address space is reserved for the compressed class space. This can be configured using CompressedClassSpaceSize. MaxMetaspaceSize sets an upper limit on the total committed size of both of these regions committed size of compressed class space + committed size of Metaspace <= MaxMetaspaceSize 58
59 GC log with +UseCompressedClassPointers Metaspace used 2921K, capacity 4486K, committed 4864K, reserved K class space used 288K, capacity 386K, committed 512K, reserved K 59
60 PermGen/MetaSpace: Diagnostic Data collection and Analysis 60
61 PermGen/MetaSpace: Diagnostic Data collection and Analysis GC logs including options: verbose:class or -XX:+TraceClassLoading XX:+TraceClassUnloading Data collected with: jmap permstat (up to JDK 7) jmap clstats (JDK 8 onwards) Heap Dumps JDK 8: class statistics information with jcmd <pid> GC.class_stats Java Flight Recordings 61
62 Make sure that classes get unloaded Ensure Xnoclassgc is not in use Ensure that XX:+CMSClassUnloadingEnabled is used when using CMS on Java 6 or 7 62
63 -verbose:class [Loading weblogic.i18n.logging.messagedispatcher from file:/opt/weblogic1213/wlserver/modules/features/weblogic.server.merged.jar] [Loaded weblogic.i18n.logging.messagedispatcher from file:/opt/weblogic1213/wlserver/modules/features/weblogic.server.merged.jar] [Loaded weblogic.i18n.logging.coreengineprimordialloggerwrapper from file:/opt/weblogic1213/wlserver/modules/features/weblogic.server.merged.jar] [Loading weblogic.logging.wlmessagelogger from file:/opt/weblogic1213/wlserver/modules/features/weblogic.server.merged.jar] [Loading sun.reflect.generatedmethodaccessor486 from JVM_DefineClass ] [Loaded sun.reflect.generatedmethodaccessor486 from JVM_DefineClass ] [Loading sun.reflect.generatedmethodaccessor487 from JVM_DefineClass ] [Loaded sun.reflect.generatedmethodaccessor487 from JVM_DefineClass ] [Loading sun.reflect.generatedmethodaccessor488 from JVM_DefineClass ] [Loaded sun.reflect.generatedmethodaccessor488 from JVM_DefineClass ] [Loading sun.reflect.generatedmethodaccessor489 from JVM_DefineClass ] [Loaded sun.reflect.generatedmethodaccessor489 from JVM_DefineClass ] [Unloading class sun.reflect.generatedmethodaccessor489 0x fc30] [Unloading class sun.reflect.generatedmethodaccessor488 0x f830] [Unloading class sun.reflect.generatedmethodaccessor487 0x f430] [Unloading class sun.reflect.generatedmethodaccessor486 0x f030] [Unloading class sun.reflect.generatedmethodaccessor482 0x e030] [Unloading class sun.reflect.generatedmethodaccessor481 0x dc30] [Unloading class sun.reflect.generatedserializationconstructoraccessor297 0x c30] [Unloading class sun.reflect.generatedserializationconstructoraccessor296 0x ] 63
64 GC Logs : [Full GC (Last ditch collection) : [CMS: K- > K( K), secs] K-> K( K), [Metaspace: K-> K( K)], secs] [Times: user=6.04 sys=0.01, real=6.04 secs] : [GC (CMS Initial Mark) [1 CMS-initial-mark: K( K)] K( K), secs] [Times: user=1.23 sys=0.00, real=0.98 secs] : [CMS-concurrent-mark-start] : [Full GC (Metadata GC Threshold) : [CMS : [CMS-concurrentmark: 1.642/1.647 secs] [Times: user=3.33 sys=0.00, real=1.65 secs] (concurrent mode failure): K-> K( K), secs] K-> K( K), [Metaspace: K-> K( K)], secs] [Times: user=9.19 sys=0.00, real=7.58 secs] java.lang.outofmemoryerror: Compressed class space 64
65 jmap -permstat $ jmap -permstat Attaching to process ID 29620, please wait... Debugger attached successfully. Client compiler detected. JVM version is b intern Strings occupying bytes. finding class loader instances.. done. computing per loader stat..done. please wait.. computing liveness...done. class_loader classes bytes parent_loader alive? type <bootstrap> null live <internal> 0xd0bf null live sun/misc/launcher$extclassloader@0xd8c98c78 0xd0d2f null dead sun/reflect/delegatingclassloader@0xd8c22f50 0xd0c null dead sun/reflect/delegatingclassloader@0xd8c22f50 0xd0b71d xd0b5b9c0 live java/util/resourcebundle$rbclassloader@0xd8d042e8 0xd0d2f4c null dead sun/reflect/delegatingclassloader@0xd8c22f50 0xd0b5bf xd0b5bf38 dead sun/reflect/delegatingclassloader@0xd8c22f50 0xd0c null dead sun/reflect/delegatingclassloader@0xd8c22f50 0xd0d2f null dead sun/reflect/delegatingclassloader@0xd8c22f50 0xd0b5bf xd0b5b9c0 dead sun/reflect/misc/methodutil@0xd8e8e560 0xd0d2f null dead sun/reflect/delegatingclassloader@0xd8c22f50 0xd0d2f null dead sun/reflect/delegatingclassloader@0xd8c22f50 0xd0d2f3a null dead sun/reflect/delegatingclassloader@0xd8c22f50 0xd0b5b9c xd0bf3828 live sun/misc/launcher$appclassloader@0xd8cb83d8 0xd0d2f null dead sun/reflect/delegatingclassloader@0xd8c22f50 0xd0d2f3e null dead sun/reflect/delegatingclassloader@0xd8c22f50 0xd0ec null dead sun/reflect/delegatingclassloader@0xd8c22f50 0xd0e0a null dead sun/reflect/delegatingclassloader@0xd8c22f50 0xd0c null dead sun/reflect/delegatingclassloader@0xd8c22f50 0xd0d2f null dead sun/reflect/delegatingclassloader@0xd8c22f50 0xd0d2f4f null dead sun/reflect/delegatingclassloader@0xd8c22f50 0xd0e0a null dead sun/reflect/delegatingclassloader@0xd8c22f50 total = N/A alive=4, dead=18 N/A 65
66 jmap -clstats jmap -clstats Attaching to process ID 26240, please wait... Debugger attached successfully. Server compiler detected. JVM version is b00 finding class loader instances..done. computing per loader stat..done. please wait.. computing liveness.liveness analysis may be inaccurate... class_loader classes bytes parent_loader alive? type <bootstrap> null live <internal> 0x e066d x e06740 live sun/misc/launcher$appclassloader@0x bef6a0 0x e null live sun/misc/launcher$extclassloader@0x befa48 0x ea18f x e066d0 dead java/util/resourcebundle$rbclassloader@0x c
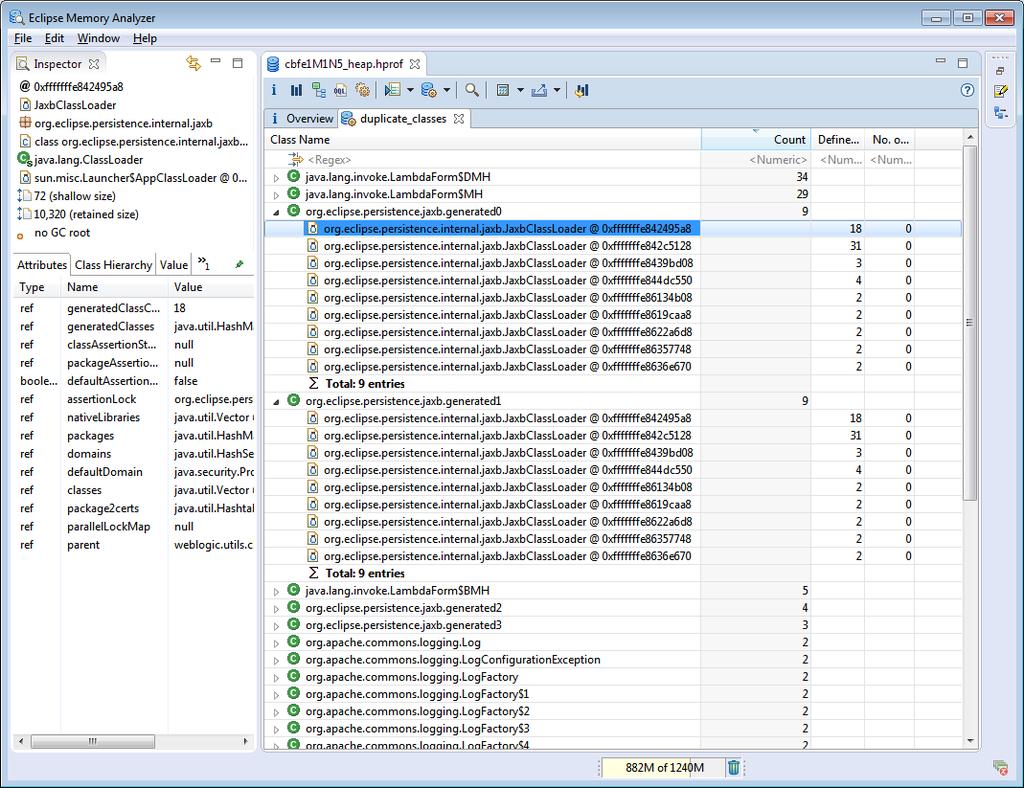
67 Heap Dumps Heap Dumps help here too Look for classes that should have been unloaded Eclipse MAT offers a very nice feature called Duplicate Classes Displays classes that were loaded multiple times by different classloader instances If duplicate classes keep growing over time/redeployments, it s a red flag 67
68 68
69 CodeCache is full. Compiler has been disabled 69
70 CodeCache is full. Compiler has been disabled CodeCache is the memory pool to store the compiled code generated by the JIT compilers There is no specific OutOfMemoryError thrown when CodeCache is full Managed by Sweeper An emergency CodeCache cleanup is done when it becomes full This may discard the compiled code that might be needed shortly after Compiler needs to work again to generate the compiled code for those methods Ensure CodeCache size is sufficient Increase CodeCache maximum size with ReservedCodeCacheSize 70
71 OutOfMemoryError: Native Memory 71
72 Native OutOfMemoryError # A fatal error has been detected by the Java Runtime Environment: # # java.lang.outofmemoryerror : unable to create new native Thread # A fatal error has been detected by the Java Runtime Environment: # # java.lang.outofmemoryerror: requested bytes for ChunkPool::allocate. Out of swap space? # # Internal Error (allocation.cpp:166), pid=2290, tid=27 # Error: ChunkPool::allocate 72
73 Native OutOfMemoryError JVM is not able to allocate from native memory Not managed by the JVM This process or other processes on the system are eating up the native memory Can make more room for native allocations by: Reducing the Java Heap, PermGen/Metaspace, number of threads and/or their stack sizes etc. Reducing the number of processes running on the system If the above don t help, we might be facing a native memory leak Example: JNI code allocating native buffers 73
74 Native OutOfMemoryError: Common Issues 74
75 Native Heap OutOfMemoryError with 64-bit JVM Running with 32-bit JVM puts a maximum limit of 4GB on the process size So you're more likely to run out of native memory with a 32-bit Java process Running with a 64-bit JVM gets us access to unlimited address space, so we would expect never to run out of native memory However, we might see OutOfMemoryErrors occurring in a 64-bit JVM too CompressedOops feature implementation determines where the Java heap should be placed in the address space The position of the Java heap can put a cap on the maximum size of the native heap. 75
76 Memory Map K r-x-- /sw/.es-base/sparc/pkg/jdk-1.7.0_60/bin/sparcv9/java K rwx-- /sw/.es-base/sparc/pkg/jdk-1.7.0_60/bin/sparcv9/java K rwx-- [ heap ] K rwx-- [ heap ] <--- native Heap FB K rw--- [ anon ] <--- Java Heap starts here K rw--- [ anon ] K rw--- [ anon ] 76
77 Solution for OutOfMemoryError with 64-bit JVM Can be resolved by using option -XX:HeapBaseMinAddress=n to specify the address the Java heap should be based at Setting it to a higher address would leave more room for the native heap 77
78 JAXB Issues JAXB internally uses Inflater/Deflater to compress/uncompress files Inflater/Deflater use native memory to hold their data Depend on Finalization to deallocate the java objects and the associated native memory data Delay in running Finalizer can exhaust native memory JAXBContext.newInstance() called for every new request Classes from the context get reloaded again Increases native memory usage Environment upgrade fails to upgrade all the JAXB jar files Classes linking errors leading to re-loading of classes 78
79 OutOfMemoryError: Direct buffer memory ByteBuffer.allocateDirect(SIZE_OF_BUFFER) DirectByteBuffers are garbage collected by using a phantom reference and a reference queue Maximum direct memory is unbounded by default, but can be limited by using JVM option -XX:MaxDirectMemorySize=n 79
80 NIO ByteBuffers Java NIO APIs use ByteBuffers as the source and destination of I/O calls Java Heap ByteBuffers and Native Heap ByteBuffers Java Heap ByteBuffer for I/O use a temporary direct ByteBuffer per thread If large heap ByteBuffers from multiple threads are used for I/O calls Native Heap Exhaustion -Djdk.nio.maxCachedBufferSize=m (JDK9) 80
81 Native Memory: Diagnostic Data 81
82 Native Memory: Diagnostic Data Native memory leaks in the JVM Native Memory Tracker output Native Memory Leaks outside JVM Process map output with tools like pmap Results from native memory leak tools such as libumem, valgrind etc. Core file 82
83 Native Memory Tracker The Native Memory Tracker (NMT) can be used to track native memory that is used internally by the JVM It cannot track memory allocated outside the JVM or by native libraries 83
84 NMT Start the process with NMT enabled using NativeMemoryTracking The output level can be set to a summary or detail level: -XX:NativeMemoryTracking=summary -XX:NativeMemoryTracking=detail Use jcmd to get the native memory usage details: jcmd <pid> VM.native_memory 84
85 jcmd VM.native_memory 90172: Native Memory Tracking: Total: reserved= kb, committed= kb - Java Heap (reserved= kb, committed= kb) (mmap: reserved= kb, committed= kb) - Class (reserved= kb, committed=10184kb) (classes #411) (malloc=5320kb #190) (mmap: reserved= kb, committed=4864kb) - Thread (reserved=15423kb, committed=15423kb) (thread #16) (stack: reserved=15360kb, committed=15360kb) (malloc=45kb #81) (arena=18kb #30) - Code (reserved=249658kb, committed=2594kb) (malloc=58kb #348) (mmap: reserved=249600kb, committed=2536kb) - GC (reserved=79628kb, committed=79544kb) (malloc=5772kb #118) (mmap: reserved=73856kb, committed=73772kb) - Compiler (reserved=138kb, committed=138kb) (malloc=8kb #41) (arena=131kb #3) - Internal (reserved=5380kb, committed=5380kb) (malloc=5316kb #1357) (mmap: reserved=64kb, committed=64kb) - Symbol (reserved=1367kb, committed=1367kb) (malloc=911kb #112) (arena=456kb #1) - Native Memory Tracking (reserved=118kb, committed=118kb) (malloc=66kb #1040) (tracking overhead=52kb) - Arena Chunk (reserved=217kb, committed=217kb) (malloc=217kb) 85
86 Native Memory Leaks Outside JVM For the native memory leaks stemming from outside the JVM, we need to rely on the native memory leak tools for their detection and troubleshooting Native Memory Leak Detection Tools dbx libumem valgrind purify and so on 86
87 Summary Several kinds of OutOfMemoryError messages It is important to understand theses error messages clearly Tools HeapDumpOnOutOfMemoryError and PrintClassHistogram JVM Options Eclipse MAT VisualVM JConsole jhat YourKit jmap jcmd Java Flight Recorder and Java Mission Control GC Logs NMT Native Memory Leak Detection Tools such as dbx, libumem, valgrind, purify etc. 87
88 References Troubleshooting Guide:

89
Troubleshooting Memory Problems in Java Applications
 Troubleshooting Memory Problems in Java Applications Poonam Parhar Consulting Member of Technical Staff JVM Sustaining Engineer, Oracle Safe Harbor Statement The following is intended to outline our general
Lesson 2 Dissecting Memory Problems
 Lesson 2 Dissecting Memory Problems Poonam Parhar JVM Sustaining Engineer Oracle Agenda 1. Symptoms of Memory Problems 2. Causes of Memory Problems 3. OutOfMemoryError messages 3 Lesson 2-1 Symptoms of
Java Memory Management. Märt Bakhoff Java Fundamentals
 Java Memory Management Märt Bakhoff Java Fundamentals 0..206 Agenda JVM memory Reference objects Monitoring Garbage collectors ParallelGC GGC 2/44 JVM memory Heap (user objects) Non-heap Stack (per thread:
JVM Troubleshooting MOOC: Troubleshooting Memory Issues in Java Applications
 JVM Troubleshooting MOOC: Troubleshooting Memory Issues in Java Applications Poonam Parhar JVM Sustaining Engineer Oracle Lesson 1 HotSpot JVM Memory Management Poonam Parhar JVM Sustaining Engineer Oracle
It s Good to Have (JVM) Options
 Options") It s Good to Have (JVM) Options Chris Hansen / Sr Engineering Manager / @cxhansen http://bit.ly/2g74cnh Tori Wieldt / Technical Evangelist / @ToriWieldt JavaOne 2017 Safe Harbor This presentation and the
It s Good to Have (JVM) Options Chris Hansen / Sr Engineering Manager / @cxhansen http://bit.ly/2g74cnh Tori Wieldt / Technical Evangelist / @ToriWieldt JavaOne 2017 Safe Harbor This presentation and the
G1 Garbage Collector Details and Tuning. Simone Bordet
 G1 Garbage Collector Details and Tuning Who Am I - @simonebordet Lead Architect at Intalio/Webtide Jetty's HTTP/2, SPDY and HTTP client maintainer Open Source Contributor Jetty, CometD, MX4J, Foxtrot,
Debugging Your Production JVM TM Machine
 Debugging Your Production JVM TM Machine Ken Sipe Perficient (PRFT) kensipe@gmail.com @kensipe Abstract > Learn the tools and techniques used to monitor, trace and debugging running Java applications.
10/26/2017 Universal Java GC analysis tool - Java Garbage collection log analysis made easy
 Analysis Report GC log le: atlassian-jira-gc-2017-10-26_0012.log.0.current Duration: 14 hrs 59 min 51 sec System Time greater than User Time In 25 GC event(s), 'sys' time is greater than 'usr' time. It's
Unified JVM Logging in JDK 9
 Unified JVM Logging in JDK 9 Marcus Larsson Senior Member of Technical Staf Oracle, HotSpot Runtime Team September, 2016 Safe Harbor Statement The following is intended to outline our general product direction.
Java Performance Tuning
 443 North Clark St, Suite 350 Chicago, IL 60654 Phone: (312) 229-1727 Java Performance Tuning This white paper presents the basics of Java Performance Tuning and its preferred values for large deployments
Java Garbage Collection. Carol McDonald Java Architect Sun Microsystems, Inc.
 Java Garbage Collection Carol McDonald Java Architect Sun Microsystems, Inc. Speaker Carol cdonald: > Java Architect at Sun Microsystems > Before Sun, worked on software development of: >Application to
Welcome to the session...
 Welcome to the session... Copyright 2013, Oracle and/or its affiliates. All rights reserved. 02/22/2013 1 The following is intended to outline our general product direction. It is intended for information
The Fundamentals of JVM Tuning
 The Fundamentals of JVM Tuning Charlie Hunt Architect, Performance Engineering Salesforce.com sfdc_ppt_corp_template_01_01_2012.ppt In a Nutshell What you need to know about a modern JVM to be effective
JVM Memory Model and GC
 JVM Memory Model and GC Developer Community Support Fairoz Matte Principle Member Of Technical Staff Java Platform Sustaining Engineering, Copyright 2015, Oracle and/or its affiliates. All rights reserved.
Practical Lessons in Memory Analysis
 Practical Lessons in Memory Analysis Krum Tsvetkov SAP AG Andrew Johnson IBM United Kingdom Limited GOAL > Learn practical tips and tricks for the analysis of common memory-related problems 2 Agenda >
Exploiting the Behavior of Generational Garbage Collector
 Exploiting the Behavior of Generational Garbage Collector I. Introduction Zhe Xu, Jia Zhao Garbage collection is a form of automatic memory management. The garbage collector, attempts to reclaim garbage,
Mission Possible - Near zero overhead profiling. Klara Ward Principal Software Developer Java Mission Control team, Oracle February 6, 2018
 Mission Possible - Near zero overhead profiling Klara Ward Principal Software Developer Java Mission Control team, Oracle February 6, 2018 Hummingbird image by Yutaka Seki is licensed under CC BY 2.0 Copyright
Java & Coherence Simon Cook - Sales Consultant, FMW for Financial Services
 Java & Coherence Simon Cook - Sales Consultant, FMW for Financial Services with help from Adrian Nakon - CMC Markets & Andrew Wilson - RBS 1 Coherence Special Interest Group Meeting 1 st March 2012 Presentation
2011 Oracle Corporation and Affiliates. Do not re-distribute!
 How to Write Low Latency Java Applications Charlie Hunt Java HotSpot VM Performance Lead Engineer Who is this guy? Charlie Hunt Lead JVM Performance Engineer at Oracle 12+ years of
Find native memory leaks in Java
 Find native memory leaks in Java Erik Wramner Do you want to work with Java and cool things? Join us at CodeMint! And check our performance course 19-20/10! Agenda Today we will see how to track down and
Do Your GC Logs Speak To You
 Do Your GC Logs Speak To You Visualizing CMS, the (mostly) Concurrent Collector Copyright 2012 Kodewerk Ltd. All rights reserved About Me Consultant (www.kodewerk.com) performance tuning and training seminar
Java Performance: The Definitive Guide
 Java Performance: The Definitive Guide Scott Oaks Beijing Cambridge Farnham Kbln Sebastopol Tokyo O'REILLY Table of Contents Preface ix 1. Introduction 1 A Brief Outline 2 Platforms and Conventions 2 JVM
Typical Issues with Middleware
 Typical Issues with Middleware HrOUG 2016 Timur Akhmadeev October 2016 About Me Database Consultant at Pythian 10+ years with Database and Java Systems Performance and Architecture OakTable member 3 rd
Java Performance Tuning From A Garbage Collection Perspective. Nagendra Nagarajayya MDE
 Java Performance Tuning From A Garbage Collection Perspective Nagendra Nagarajayya MDE Agenda Introduction To Garbage Collection Performance Problems Due To Garbage Collection Performance Tuning Manual
Java Flight Recorder Runtime Guide Release 5.5
 [1]Java Platform, Standard Edition Java Flight Recorder Runtime Guide Release 5.5 E28976-04 March 2015 Describes the Java Flight Recorder runtime implementation and instructions for using the tool. Java
Garbage collection. The Old Way. Manual labor. JVM and other platforms. By: Timo Jantunen
 Garbage collection By: Timo Jantunen JVM and other platforms In computer science, garbage collection (gc) can mean few different things depending on context and definition. In this post, it means "freeing
Java Platform, Standard Edition Java Flight Recorder Command Reference. Release 10
 Java Platform, Standard Edition Java Flight Recorder Command Reference Release 10 E92740-01 March 2018 Java Platform, Standard Edition Java Flight Recorder Command Reference, Release 10 E92740-01 Copyright
Java Performance Tuning and Optimization Student Guide
 Java Performance Tuning and Optimization Student Guide D69518GC10 Edition 1.0 June 2011 D73450 Disclaimer This document contains proprietary information and is protected by copyright and other intellectual
Sustainable Memory Use Allocation & (Implicit) Deallocation (mostly in Java)
 Deallocation (mostly in Java)") COMP 412 FALL 2017 Sustainable Memory Use Allocation & (Implicit) Deallocation (mostly in Java) Copyright 2017, Keith D. Cooper & Zoran Budimlić, all rights reserved. Students enrolled in Comp 412 at Rice
COMP 412 FALL 2017 Sustainable Memory Use Allocation & (Implicit) Deallocation (mostly in Java) Copyright 2017, Keith D. Cooper & Zoran Budimlić, all rights reserved. Students enrolled in Comp 412 at Rice
Effective Java Heap Memory Analysis on Enterprise-Scale SAP Memory Analyzer. Vedran Lerenc, SAP NetWeaver Java Server Technology October 11th 2007
 Effective Java Heap Memory Analysis on Enterprise-Scale SAP Memory Analyzer Vedran Lerenc, SAP NetWeaver Java Server Technology October 11th 2007 Memory 101 Heap MB Full Garbage Collection 2 a.m. Out Of
Basic Steps and Features Walk-through
 Welcome to the SAP Memory Analyzer SAP Memory Analyzer: Basic Steps and Features Walk-through SAP AG 2007, Memory Analysis with SAP Memory Analyzer / 1 Basic Steps with SAP Memory Analyzer (1) Get Heap
1 Performance Optimization in Java/J2EE
 1 Performance Optimization in Java/J2EE 1.1 Java Server Technology (J2EE) Fundamentals 1.1.1 Overview To reduce costs and fast-track enterprise application design and development, the Java 2 Platform,
JDK 9/10/11 and Garbage Collection
 JDK 9/10/11 and Garbage Collection Thomas Schatzl Senior Member of Technical Staf Oracle JVM Team May, 2018 thomas.schatzl@oracle.com Copyright 2017, Oracle and/or its afliates. All rights reserved. 1
Scalable Post-Mortem Debugging Abel Mathew. CEO -
 Scalable Post-Mortem Debugging Abel Mathew CEO - Backtrace amathew@backtrace.io @nullisnt0 Debugging or Sleeping? Debugging Debugging: examining (program state, design, code, output) to identify and remove
JRockit to HotSpot Migration Guide Release 8
 [1]Java Platform, Standard Edition JRockit to HotSpot Migration Guide Release 8 E63235-01 June 2015 Java Platform, Standard Edition JRockit to HotSpot Migration Guide, Release 8 E63235-01 Copyright 1995,
MODULE 1 JAVA PLATFORMS. Identifying Java Technology Product Groups
 MODULE 1 JAVA PLATFORMS Identifying Java Technology Product Groups Java SE Platform Versions Year Developer Version (JDK) Platform 1996 1.0 1 1997 1.1 1 1998 1.2 2 2000 1.3 2 2002 1.4 2 2004 1.5 5 2006
WHO AM I.
 WHO AM I Christoph Engelbert (@noctarius2k) 8+ years of professional Java development Specialized to performance, GC, traffic topics Apache DirectMemory PMC Previous companies incl. Ubisoft and HRS Official
Agenda. CSE P 501 Compilers. Java Implementation Overview. JVM Architecture. JVM Runtime Data Areas (1) JVM Data Types. CSE P 501 Su04 T-1
 JVM Data Types. CSE P 501 Su04 T-1") Agenda CSE P 501 Compilers Java Implementation JVMs, JITs &c Hal Perkins Summer 2004 Java virtual machine architecture.class files Class loading Execution engines Interpreters & JITs various strategies
Agenda CSE P 501 Compilers Java Implementation JVMs, JITs &c Hal Perkins Summer 2004 Java virtual machine architecture.class files Class loading Execution engines Interpreters & JITs various strategies
MEMORY MANAGEMENT HEAP, STACK AND GARBAGE COLLECTION
 MEMORY MANAGEMENT HEAP, STACK AND GARBAGE COLLECTION 2 1. What is the Heap Size: 2 2. What is Garbage Collection: 3 3. How are Java objects stored in memory? 3 4. What is the difference between stack and
Using Automated Network Management at Fiserv. June 2012
 Using Automated Network Management at Fiserv June 2012 Brought to you by Join Group Vivit Network Automation Special Interest Group (SIG) Leaders: Chris Powers & Wendy Wheeler Your input is welcomed on
How to keep capacity predictions on target and cut CPU usage by 5x
 How to keep capacity predictions on target and cut CPU usage by 5x Lessons from capacity planning a Java enterprise application Kansas City, Sep 27 2016 Stefano Doni stefano.doni@moviri.com @stef3a linkedin.com/in/stefanodoni
Java Platform, Standard Edition JRockit to HotSpot Migration Guide. Release 9
 Java Platform, Standard Edition JRockit to HotSpot Migration Guide Release 9 E76287-05 October 2017 Java Platform, Standard Edition JRockit to HotSpot Migration Guide, Release 9 E76287-05 Copyright 1995,
Lecture 13: Garbage Collection
 Lecture 13: Garbage Collection COS 320 Compiling Techniques Princeton University Spring 2016 Lennart Beringer/Mikkel Kringelbach 1 Garbage Collection Every modern programming language allows programmers
Java Application Performance Tuning for AMD EPYC Processors
 Java Application Performance Tuning for AMD EPYC Processors Publication # 56245 Revision: 0.70 Issue Date: January 2018 Advanced Micro Devices 2018 Advanced Micro Devices, Inc. All rights reserved. The
The G1 GC in JDK 9. Erik Duveblad Senior Member of Technical Staf Oracle JVM GC Team October, 2017
 The G1 GC in JDK 9 Erik Duveblad Senior Member of Technical Staf racle JVM GC Team ctober, 2017 Copyright 2017, racle and/or its affiliates. All rights reserved. 3 Safe Harbor Statement The following is
Don t Dump Thread Dumps. Ram Lakshmanan
 Don t Dump Thread Dumps Ram Lakshmanan Don t Dump Thread Dumps Ram Lakshmanan Founder GCeasy.io & fastthread.io Agenda How to take Thread Dumps? Anatomy of Thread Dump Troubleshooting Real world problems
Acknowledgements These slides are based on Kathryn McKinley s slides on garbage collection as well as E Christopher Lewis s slides
 Garbage Collection Last time Compiling Object-Oriented Languages Today Motivation behind garbage collection Garbage collection basics Garbage collection performance Specific example of using GC in C++
Apple. Massive Scale Deployment / Connectivity. This is not a contribution
 Netty @ Apple Massive Scale Deployment / Connectivity Norman Maurer Senior Software Engineer @ Apple Core Developer of Netty Formerly worked @ Red Hat as Netty Project Lead (internal Red Hat) Author of
The Z Garbage Collector Scalable Low-Latency GC in JDK 11
 The Z Garbage Collector Scalable Low-Latency GC in JDK 11 Per Lidén (@perliden) Consulting Member of Technical Staff Java Platform Group, Oracle October 24, 2018 Safe Harbor Statement The following is
Garbage Collection. Hwansoo Han
 Garbage Collection Hwansoo Han Heap Memory Garbage collection Automatically reclaim the space that the running program can never access again Performed by the runtime system Two parts of a garbage collector
From Java Code to Java Heap Understanding the Memory Usage of Your Application
 Chris Bailey IBM Java Service Architect 3 rd October 2012 From Java Code to Java Heap Understanding the Memory Usage of Your Application 2012 IBM Corporation Important Disclaimers THE INFORMATION CONTAINED
A new Mono GC. Paolo Molaro October 25, 2006
 A new Mono GC Paolo Molaro lupus@novell.com October 25, 2006 Current GC: why Boehm Ported to the major architectures and systems Featurefull Very easy to integrate Handles managed pointers in unmanaged
Managed runtimes & garbage collection. CSE 6341 Some slides by Kathryn McKinley
 Managed runtimes & garbage collection CSE 6341 Some slides by Kathryn McKinley 1 Managed runtimes Advantages? Disadvantages? 2 Managed runtimes Advantages? Reliability Security Portability Performance?
PARAMETERS Options may be in any order. For a discussion of parameters which apply to a specific option, see OPTIONS below.
 NAME java Java interpreter SYNOPSIS java [ options ] class [ argument... ] java [ options ] jar file.jar [ argument... ] PARAMETERS Options may be in any order. For a discussion of parameters which apply
Java Platform, Standard Edition JRockit to HotSpot Migration Guide. Release 10
 Java Platform, Standard Edition JRockit to HotSpot Migration Guide Release 10 E91473-01 March 2018 Java Platform, Standard Edition JRockit to HotSpot Migration Guide, Release 10 E91473-01 Copyright 1995,
CSE P 501 Compilers. Java Implementation JVMs, JITs &c Hal Perkins Winter /11/ Hal Perkins & UW CSE V-1
 CSE P 501 Compilers Java Implementation JVMs, JITs &c Hal Perkins Winter 2008 3/11/2008 2002-08 Hal Perkins & UW CSE V-1 Agenda Java virtual machine architecture.class files Class loading Execution engines
Managed runtimes & garbage collection
 Managed runtimes Advantages? Managed runtimes & garbage collection CSE 631 Some slides by Kathryn McKinley Disadvantages? 1 2 Managed runtimes Portability (& performance) Advantages? Reliability Security
Garbage Collection. Akim D le, Etienne Renault, Roland Levillain. May 15, CCMP2 Garbage Collection May 15, / 35
 Garbage Collection Akim Demaille, Etienne Renault, Roland Levillain May 15, 2017 CCMP2 Garbage Collection May 15, 2017 1 / 35 Table of contents 1 Motivations and Definitions 2 Reference Counting Garbage
Java 8 New or Noteworthy! Copyright 2015 Kodewerk Ltd. All rights reserved
 Java 8 New or Noteworthy! About Me Founder and CTO of jclarity next gen performance diagnostic engine Performance tuning and training Helped establish www.javaperformancetuning.com Member of Java Champion
Lecture 15 Garbage Collection
 Lecture 15 Garbage Collection I. Introduction to GC -- Reference Counting -- Basic Trace-Based GC II. Copying Collectors III. Break Up GC in Time (Incremental) IV. Break Up GC in Space (Partial) Readings:
Runtime. The optimized program is ready to run What sorts of facilities are available at runtime
 Runtime The optimized program is ready to run What sorts of facilities are available at runtime Compiler Passes Analysis of input program (front-end) character stream Lexical Analysis token stream Syntactic
Habanero Extreme Scale Software Research Project
 Habanero Extreme Scale Software Research Project Comp215: Garbage Collection Zoran Budimlić (Rice University) Adapted from Keith Cooper s 2014 lecture in COMP 215. Garbage Collection In Beverly Hills...
6.828: OS/Language Co-design. Adam Belay
 6.828: OS/Language Co-design Adam Belay Singularity An experimental research OS at Microsoft in the early 2000s Many people and papers, high profile project Influenced by experiences at
Concurrent Garbage Collection
 Concurrent Garbage Collection Deepak Sreedhar JVM engineer, Azul Systems Java User Group Bangalore 1 @azulsystems azulsystems.com About me: Deepak Sreedhar JVM student at Azul Systems Currently working
Run-Time Environments/Garbage Collection
 Run-Time Environments/Garbage Collection Department of Computer Science, Faculty of ICT January 5, 2014 Introduction Compilers need to be aware of the run-time environment in which their compiled programs
THE TROUBLE WITH MEMORY
 THE TROUBLE WITH MEMORY OUR MARKETING SLIDE Kirk Pepperdine Authors of jpdm, a performance diagnostic model Co-founded Building the smart generation of performance diagnostic tooling Bring predictability
Automatic Garbage Collection
 Automatic Garbage Collection Announcements: PS6 due Monday 12/6 at 11:59PM Final exam on Thursday 12/16 o PS6 tournament and review session that week Garbage In OCaml programs (and in most other programming
Red Hat JBoss Enterprise Application Platform 7.1
 Red Hat JBoss Enterprise Application Platform 7.1 Performance Tuning Guide For Use with Red Hat JBoss Enterprise Application Platform 7.1 Last Updated: 2018-07-11 Red Hat JBoss Enterprise Application
The Z Garbage Collector Low Latency GC for OpenJDK
 The Z Garbage Collector Low Latency GC for OpenJDK Per Lidén & Stefan Karlsson HotSpot Garbage Collection Team Jfokus VM Tech Summit 2018 Safe Harbor Statement The following is intended to outline our
New Java performance developments: compilation and garbage collection
 New Java performance developments: compilation and garbage collection Jeroen Borgers @jborgers #jfall17 Part 1: New in Java compilation Part 2: New in Java garbage collection 2 Part 1 New in Java compilation
A NEW PLATFORM FOR A NEW ERA. Copyright 2014 Pivotal. All rights reserved.
 A NEW PLATFORM FOR A NEW ERA 1 2 Java Memory Leaks in Modular Environments Mark Thomas November 2016 Introductions Mark Thomas markt@apache.org Tomcat committer and PMC member Joined Tomcat community in
Effec%ve So*ware. Lecture 9: JVM - Memory Analysis, Data Structures, Object Alloca=on. David Šišlák
 Effec%ve So*ware Lecture 9: JVM - Memory Analysis, Data Structures, Object Alloca=on David Šišlák david.sislak@fel.cvut.cz JVM Performance Factors and Memory Analysis» applica=on performance factors total
Fundamentals of GC Tuning. Charlie Hunt JVM & Performance Junkie
 Fundamentals of GC Tuning Charlie Hunt JVM & Performance Junkie Who is this guy? Charlie Hunt Currently leading a variety of HotSpot JVM projects at Oracle Held various performance architect roles at Oracle,
generate-jvm-report shows the threads, classes, memory, and loggers for a given target instance. Name Synopsis
 Name Synopsis Description Options generate-jvm-report shows the threads, classes, memory, and loggers for a given target instance. generate-jvm-report [--help] [ --type =summary memory class thread log]
NG2C: Pretenuring Garbage Collection with Dynamic Generations for HotSpot Big Data Applications
 NG2C: Pretenuring Garbage Collection with Dynamic Generations for HotSpot Big Data Applications Rodrigo Bruno Luis Picciochi Oliveira Paulo Ferreira 03-160447 Tomokazu HIGUCHI Paper Information Published
High-Level Language VMs
 High-Level Language VMs Outline Motivation What is the need for HLL VMs? How are these different from System or Process VMs? Approach to HLL VMs Evolutionary history Pascal P-code Object oriented HLL VMs
The Z Garbage Collector An Introduction
 The Z Garbage Collector An Introduction Per Lidén & Stefan Karlsson HotSpot Garbage Collection Team FOSDEM 2018 Safe Harbor Statement The following is intended to outline our general product direction.
Automatic Memory Management
 Automatic Memory Management Why Automatic Memory Management? Storage management is still a hard problem in modern programming Why Automatic Memory Management? Storage management is still a hard problem
3. Monitoring Scenarios
 3. Monitoring Scenarios This section describes the following: Navigation Alerts Interval Rules Navigation Ambari SCOM Use the Ambari SCOM main navigation tree to browse cluster, HDFS and MapReduce performance
Why GC is eating all my CPU? Aprof - Java Memory Allocation Profiler Roman Elizarov, Devexperts Joker Conference, St.
 Why GC is eating all my CPU? Aprof - Java Memory Allocation Profiler Roman Elizarov, Devexperts Joker Conference, St. Petersburg, 2014 Java Memory Allocation Profiler Why it is needed? When to use it?
JBoss Enterprise Application Platform: Troubleshooting Guide
 JBoss Enterprise Application Platform: Troubleshooting Guide JBoss Enterprise Application Platform includes one of the leading Java EE certified application server which is used by many fortune companies
OS-caused Long JVM Pauses - Deep Dive and Solutions
 OS-caused Long JVM Pauses - Deep Dive and Solutions Zhenyun Zhuang LinkedIn Corp., Mountain View, California, USA https://www.linkedin.com/in/zhenyun Zhenyun@gmail.com 2016-4-21 Outline q Introduction
IBM Tivoli Composite Application Manager for Microsoft Applications: Microsoft.NET Framework Agent Fix Pack 13.
 IBM Tivoli Composite Application Manager for Microsoft Applications: Microsoft.NET Framework Agent 6.3.1 Fix Pack 13 Reference IBM IBM Tivoli Composite Application Manager for Microsoft Applications:
Designing experiments Performing experiments in Java Intel s Manycore Testing Lab
 Designing experiments Performing experiments in Java Intel s Manycore Testing Lab High quality results that capture, e.g., How an algorithm scales Which of several algorithms performs best Pretty graphs
Heckaton. SQL Server's Memory Optimized OLTP Engine
 Heckaton SQL Server's Memory Optimized OLTP Engine Agenda Introduction to Hekaton Design Consideration High Level Architecture Storage and Indexing Query Processing Transaction Management Transaction Durability
Don t Dump Thread Dumps. Ram Lakshmanan Founder GCeasy.io & fastthread.io
 Don t Dump Thread Dumps Ram Lakshmanan Founder GCeasy.io & fastthread.io Agenda How to take Thread Dumps? Anatomy of Thread Dump Troubleshooting Real world problems through Patterns Sudden CPU spikes OutOfMemoryError
CS 241 Honors Memory
 CS 241 Honors Memory Ben Kurtovic Atul Sandur Bhuvan Venkatesh Brian Zhou Kevin Hong University of Illinois Urbana Champaign February 20, 2018 CS 241 Course Staff (UIUC) Memory February 20, 2018 1 / 35
Low latency & Mechanical Sympathy: Issues and solutions
 Low latency & Mechanical Sympathy: Issues and solutions Jean-Philippe BEMPEL Performance Architect @jpbempel http://jpbempel.blogspot.com ULLINK 2016 Low latency order router pure Java SE application FIX
C. E. McDowell August 25, Baskin Center for. University of California, Santa Cruz. Santa Cruz, CA USA. abstract
 Unloading Java Classes That Contain Static Fields C. E. McDowell E. A. Baldwin 97-18 August 25, 1997 Baskin Center for Computer Engineering & Information Sciences University of California, Santa Cruz Santa
Inside the Garbage Collector
 Inside the Garbage Collector Agenda Applications and Resources The Managed Heap Mark and Compact Generations Non-Memory Resources Finalization Hindering the GC Helping the GC 2 Applications and Resources
Garbage Collection. Steven R. Bagley
 Garbage Collection Steven R. Bagley Reference Counting Counts number of pointers to an Object deleted when the count hits zero Eager deleted as soon as it is finished with Problem: Circular references
Garbage Collection (2) Advanced Operating Systems Lecture 9
 Advanced Operating Systems Lecture 9") Garbage Collection (2) Advanced Operating Systems Lecture 9 Lecture Outline Garbage collection Generational algorithms Incremental algorithms Real-time garbage collection Practical factors 2 Object Lifetimes
Garbage Collection (2) Advanced Operating Systems Lecture 9 Lecture Outline Garbage collection Generational algorithms Incremental algorithms Real-time garbage collection Practical factors 2 Object Lifetimes
Benchmarking/Profiling (In)sanity
sanity") Benchmarking/Profiling (In)sanity It all started when I stumbled upon AppendableWriter in guava which is nothing more than an adapter class that adapts an Appendable to a Writer. When looking over the
Benchmarking/Profiling (In)sanity It all started when I stumbled upon AppendableWriter in guava which is nothing more than an adapter class that adapts an Appendable to a Writer. When looking over the
CS Computer Systems. Lecture 8: Free Memory Management
 CS 5600 Computer Systems Lecture 8: Free Memory Management Recap of Last Week Last week focused on virtual memory Gives each process the illusion of vast, empty memory Offers protection and isolation 31
Memory Allocation. Static Allocation. Dynamic Allocation. Dynamic Storage Allocation. CS 414: Operating Systems Spring 2008
 Dynamic Storage Allocation CS 44: Operating Systems Spring 2 Memory Allocation Static Allocation (fixed in size) Sometimes we create data structures that are fixed and don t need to grow or shrink. Dynamic
JBoss Performance Tuning. Bill Meyer JBoss Sr. Solutions Architect
 JBoss Performance Tuning Bill Meyer JBoss Sr. Solutions Architect bill@redhat.com JVM Memory Tuning JVM Heap Total JVM Heap Major Collection Young Generation Minor Collection Old Generation Eden Survivor
The Garbage-First Garbage Collector
 The Garbage-First Garbage Collector Tony Printezis, Sun Microsystems Paul Ciciora, Chicago Board Options Exchange #TS-9 Trademarks And Abbreviations (to get them out of the way...) Java Platform, Standard
Java Platform, Standard Edition HotSpot Virtual Machine Garbage Collection Tuning Guide. Release 10
 Java Platform, Standard Edition HotSpot Virtual Machine Garbage Collection Tuning Guide Release 10 E92394-01 March 2018 Java Platform, Standard Edition HotSpot Virtual Machine Garbage Collection Tuning
IBM SDK, Java Technology Edition Version 1. IBM VM messages IBM
 IBM SDK, Java Technology Edition Version 1 IBM VM messages IBM IBM SDK, Java Technology Edition Version 1 IBM VM messages IBM Note Before you use this information and the product it supports, read the
Shenandoah: An ultra-low pause time garbage collector for OpenJDK. Christine Flood Roman Kennke Principal Software Engineers Red Hat
 Shenandoah: An ultra-low pause time garbage collector for OpenJDK Christine Flood Roman Kennke Principal Software Engineers Red Hat 1 Shenandoah Why do we need it? What does it do? How does it work? What's