SecurityCenter 5.5.x User Guide. Last Revised: June 19, 2018
|
|
|
- Allan Nash
- 5 years ago
- Views:
Transcription


1 SecurityCenter 5.5.x User Guide Last Revised: June 19, 2018
2 Table of Contents Welcome to SecurityCenter 10 Getting Started Workflow 11 Hardware Requirements 15 System Requirements 18 Web Browser Requirements 22 Tenable Integrated Product Compatibility 23 Installation and Upgrade 24 Before You Install 25 Install SecurityCenter 29 Launch the Web Interface 30 Quick Setup 34 Before You Upgrade 47 Upgrade SecurityCenter 49 Uninstall SecurityCenter 52 Start or Stop SecurityCenter 53 Configure SecurityCenter Features 54 System Settings 55 Configuration Settings 56 Edit Plugin and Feed Schedules 70 Configure Plugin Text Translation 72 Diagnostics Settings 73 Job Queue Settings
3 System Logs Settings 76 Publishing Sites Settings 78 Keys Settings 81 Add a Key 82 Delete a Key 83 Download the SecurityCenter SSH Key 84 User Access 85 User Roles 86 Create a User Role 90 Edit a User Role 91 Delete a User Role 92 Organizations and Groups 93 Organizations 94 Add an Organization 97 Delete an Organization 98 Groups 99 Add a Group 100 Delete a Group 101 User Accounts 102 Add a User 107 Custom Group Permissions 111 Delete a User 112 Manage Your Account 113 Repositories
4 Local Repositories 117 External Repositories 120 Scans 123 Active Scans 126 Add an Active Scan 132 Start or Pause a Scan 134 Run a Diagnostic Scan 135 Agent Scans 136 Add an Agent Scan 139 Start or Pause a Scan 141 Scan Results 142 Manage Scan Results 143 Upload Scan Results 145 Scan Policies 146 Add a Scan Policy 147 Custom Scan Policy Options 149 Audit Files 173 Credentials 176 Add Credentials 177 Database Credentials 178 SNMP Credentials 179 SSH Credentials 180 Privilege Escalation 186 Windows Credentials
5 Blackout Windows 193 Add a Blackout Window 194 Edit a Blackout Window 195 Delete a Blackout Window 196 Assets 197 Add an Asset from a Template 205 Add a Custom Asset 207 Patch Management 208 Resources 217 Nessus Scanners 218 Add a Nessus Scanner 221 Add a Tenable.io Scanner 222 View Details for a Nessus Scanner 225 Delete a Nessus Scanner 227 Scan Zones 228 Add a Scan Zone 231 Edit a Scan Zone 232 Delete a Scan Zone 233 Nessus Network Monitor (PVS) 234 LDAP Servers 237 Add an LDAP Server 241 Delete an LDAP Server 242 LDAP Servers with Multiple OUs 243 Log Correlation Engines
6 Log Correlation Engine Clients 253 Log Correlation Engine Client Policies 255 Analyze SecurityCenter Data 257 Dashboards 258 View a Shared Dashboard 278 Assurance Report Cards 279 Vulnerability Analysis 285 Vulnerability Analysis Tools 288 Cumulative vs. Mitigated Vulnerabilities 297 Vulnerability Analysis Filter Components 299 Add an Accept Risk Rule 304 Add a Recast Risk Rule 305 Export Vulnerability Data 306 Launch a Remediation Scan 307 Event Analysis 309 Event Analysis Tools 319 Event Analysis Filter Components 325 Mobile Analysis 328 Queries 332 Add a Query 336 Filters 338 Apply a Filter 339 Workflow Actions 344 Alerts
7 Tickets 351 Open a Ticket 353 Accept Risk Rules 355 Recast Risk Rules 356 Reports 357 Manage Reports 358 Create a Custom Report 359 Create a Template Report 360 Data Required for Template-Based Reports 363 Edit a Report Definition 364 Report Options 365 Edit a Report Outline 373 Add a Custom Chapter to a Report 375 Add a Template Chapter to a Report 376 Add or Edit a Report Element 378 Configure a Grouping Element in a Report 379 Configure a Text Element in a Report 383 Configure a Matrix Element in a Report 386 Configure a Table Element in a Report 389 Configure a Charts Element in a Report 392 Reorder Report Chapters and Elements 396 Manage Filters for a Chapter Report 397 Manage Filters for a Single Element 398 Manage Filters for Multiple Elements
8 Manage Filters for a Non-Chapter Report 402 View a Report Definition 404 Copy a Report Definition 405 Export a Report Definition 406 Import a Report Definition 407 Delete a Report Definition 408 Launch a Report on Demand 409 Add a Report to a Scan 410 Manage Report Results 411 Stop a Report Run 412 Download a Report Result 413 View a Report Result 414 Publish a Report Result 415 a Report Result 416 Copy a Report Result 417 View Errors for a Failed Report 418 Delete a Report Result 419 Report Attributes 420 Report Images 421 Additional Resources 423 Troubleshooting 424 SecurityCenter Troubleshooting 425 LCE Troubleshooting 427 Nessus Troubleshooting
9 NNM Troubleshooting 431 License Declarations 433 Encryption Strength 434 Manual LCE Key Exchange 435 WebSEAL 437 Nessus SSL Configuration 438 Overview of SSL Certificates and Keys 439 Nessus Configuration for Unix 440 Nessus Configuration for Windows 449 Upload a Custom SSL Certificate 454 SSL Client Certificate Authentication 456 Configure SecurityCenter to Trust a Custom CA 460 Regenerate the SecurityCenter SSL Certificate 461 Upload a Custom CA Certificate 462 Offline SecurityCenter Plugin Updates 465 Offline Nessus Plugin Update 466 Offline NNM Plugin Update 468 Offline SecurityCenter Feed Update 470 SecurityCenter Continuous View Behavior on Expiration of Maintenance Period or License
10 Welcome to SecurityCenter This user guide describes how to install, configure, and manage Tenable SecurityCenter. Please any comments and suggestions to SecurityCenter is a comprehensive vulnerability analysis solution that provides complete visibility into the security posture of your distributed and complex IT infrastructure. SecurityCenter consolidates and evaluates vulnerability data from across your entire IT infrastructure, illustrates vulnerability trends over time, and assesses risk with actionable context for effective remediation prioritization. See the following topics to get started with SecurityCenter. Getting Started Workflow Hardware Requirements System Requirements Installation and Upgrade Quick Setup Configure SecurityCenter Features Analyze SecurityCenter Data Additional Resources
11 Getting Started Workflow Use the following getting started sequence to configure and mature your SecurityCenter deployment. 1. Prepare 2. Install 3. Configure Scans 4. Refine 5. Expand Prepare Before you begin, learn about SecurityCenter and establish a deployment plan and analysis workflow to guide your configurations. Access Tenable Support and training resources for SecurityCenter, including: the Tenable Deployment Strategy Planning video. the Tenable University training courses. Design a deployment plan by identifying your organization's objectives and analyzing your network topology. Consider Tenable-recommended best practices for your environment. For more information, see the General Requirements Guide. Design an analysis workflow. Identify key stakeholders in your management and operational groups, considering the data you intend to share with each stakeholder. Install Install SecurityCenter and perform initial configuration. 1. Prepare for the installation, as described in Before You Install. 2. Install SecurityCenter, as described in Install SecurityCenter. 3. Perform quick setup, as described in Quick Setup
12 Quick setup includes uploading licenses, configuring one Nessus scanner, configuring one NNM scanner (requires a NNM activation license), configuring one LCE server (requires an LCE activation license), creating one repository, creating one organization, configuring one LDAP server, creating one administrator user account and one security manager account, and configuring usage statistic collection. Tenable recommends following the quick setup wizard, but you can configure these features later. For example, do not configure LDAP until you have easy access to all necessary LDAP parameters. 4. Configure SMTP settings, as described in Mail Settings. 5. Configure scan zones, as described in Add a Scan Zone. 6. Configure additional repositories, if necessary, as described in Repositories. 7. Configure additional scanners, if necessary, as described in Nessus Scanners, Nessus Network Monitor (PVS), and Log Correlation Engines. 8. Configure security settings (e.g., password complexity requirements and custom banners), as described in Security Settings. Configure Scans Configure and run basic scans to begin evaluating the effectiveness of your deployment plan and analysis workflow. 1. Configure credentials, as described in Credentials. 2. Create static assets, as described in Add a Custom Asset. For more information about asset types, see Assets. 3. Configure a Host Discovery policy and a Basic Network Scan policy from Tenable-provided scan policy templates, as described in Add a Scan Policy. 4. Configure and run scans for those policies, as described in Add an Active Scan and Add an Agent Scan. Confirm that the scans can access all areas of your network with no credential issues. 5. Configure NNM scanners, as described in Nessus Network Monitor (PVS). 6. When the scans complete, create template-based dashboards and reports, as described in Dashboards and Reports
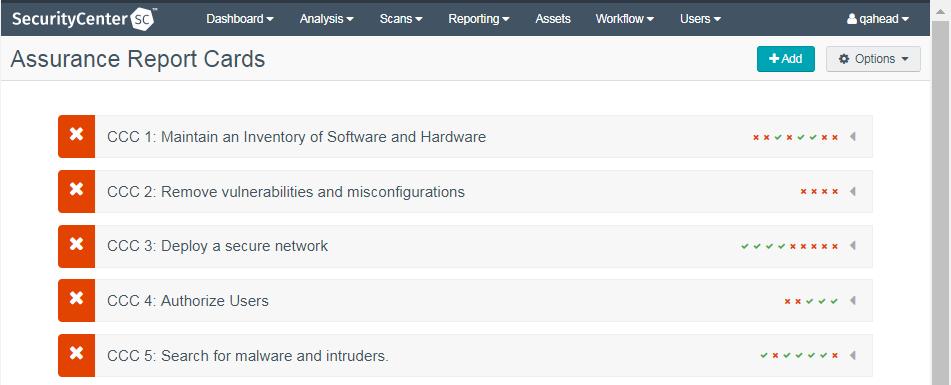
13 Tenable recommends frequently reviewing your scan results and scan coverage. You may need to modify your scan configurations to suit your organization's objectives and reach all areas of your network. Refine Configure other features, if necessary, and refine your existing configurations. Configure audit files, as described in Audit Files. Create additional scan policies, as described in Add a Scan Policy. Configure scan blackout windows, as described in Add a Blackout Window. Configure groups, as described in Add a Group. Create a custom user role, as described in Create a User Role. Create additional user accounts and share objects with users, as described in Add a User. Create dynamic assets and combination assets, as described in Add a Custom Asset. For more information about asset types, see Assets. Review the plugin update schedule, as described in Edit Plugin and Feed Schedules. Consider editing the schedules to suit your needs. For example, you may want to schedule plugin and feed updates to run a few hours before your scheduled scans. Add queries and use filters, as described in Add a Query and Apply a Filter. Create custom dashboards and reports, as described in Reports. Create Assurance Report Cards (ARCs), as described in Assurance Report Cards. Configure alerts, ticketing, accept risk rules, and recast risk rules, as described in Workflow Actions. View vulnerability data and use the built-in analysis tools, as described in Vulnerability Analysis. Expand Review and mature your deployment plan and analysis workflow
14 Conduct weekly meetings to review your organization's responses to identified vulnerabilities. Conduct weekly management meetings to oversee your teams executing the analysis workflow. Review scan automation settings and consider revising. Review your scan results and scan coverage. You may need to modify your scan configurations to suit your organization's objectives and reach all areas of your network. Optimize and operationalize your custom dashboards to meet the needs of individual user account holders. Optimize and operationalize your custom reports to prepare them for distribution. Consider configuring API integrations, as described in the SecurityCenter API Guide and the SecurityCenter API Best Practices Guide
15 Hardware Requirements Follow these hardware requirements and guidelines to maximize your SecurityCenter performance. Always consider the specific needs of your organization. Recommended Minimum Hardware Requirements The following chart outlines the minimum hardware requirements for operating the SecurityCenter. Scenario SecurityCenter managing 500 to 2,500 active IP addresses Hardware Recommendations CPU: 2 dual-core 2 GHz or greater Memory: 8 GB RAM Hard Drive: 120 GB at 7,200 rpm (320 GB at 10,000 rpm recommended) SecurityCenter managing 2,500 to 10,000 active IP addresses CPU: 4 dual-core 3 GHz CPU Memory: 16 GB RAM Hard Drive: 160 GB at 7,200 rpm (500 GB at 10,000 rpm recommended) SecurityCenter managing 10,000 to 25,000 active IP addresses CPU: 8 dual-core 3 GHz CPU Memory: 32 GB RAM Hard Drive: 500 GB at 10,000 rpm (1 TB at 15,000 rpm with striped RAID recommended) SecurityCenter managing more than 25,000 active IP addresses CPU: 8+ quad-core 3 GHz CPU Memory: 32+ GB RAM Hard Drive: 1 TB at 15,000 rpm (3 TB at 15,000 rpm with striped RAID recommended) In addition to the above guidelines, consider the following: If the Nessus scanner is deployed on the same system as SecurityCenter, there will be less CPU and memory available during scans, causing slower performance. Use multi-core and/or
16 multiple CPU servers to alleviate this. It is strongly recommended that the scanner is placed on a secondary machine. For deployments of SecurityCenter with more than 25 active users, add additional memory or CPUs to improve performance. As a general rule, use the aggregate of the individual software product resource requirements for determining total hardware system requirements. Hosting multiple Tenable products on the same server is not recommended due to potential memory and CPU constraints. Network Interface Requirements Gigabit or faster network cards are recommended for use on the SecurityCenter server. This is to increase the overall performance of web sessions, s, LCE queries, and other network activities. If Nessus is deployed on the same server as SecurityCenter, consider configuring the server with multiple network cards and IP addresses. Nessus uses default routes when scanning target networks and will correctly scan a system from the appropriate interface. Disk Space Requirements Adequate disk space is critical to a successful SecurityCenter deployment. An important consideration is that SecurityCenter can be configured to save a snapshot of vulnerability archives each day. In addition, the size of the vulnerability data stored by SecurityCenter depends on the number and types of vulnerabilities, not just the number of hosts. For example, 100 hosts with 100 vulnerabilities each could consume as much data as 1,000 hosts with 10 vulnerabilities each. In addition, the output for vulnerability check plugins that do directory listings, etc. is much larger than Open Port plugins from discovery scans. For networks of 35,000 to 50,000 hosts, Tenable has encountered data sizes of up to 25 GB. That number is based on storage of 50,000 hosts and approximately 500 KB per host. Additionally, during active scanning sessions, large scans and multiple smaller scans have been reported to consume as much as 150 GB of disk space as results are acquired. Once a scan has completed and its results are imported, that disk space is freed up. Disk Partition Requirements SecurityCenter is installed into /opt/sc by default. Tenable highly recommends that the /opt directory be created on a separate disk partition. For higher performance, using two disks, one for the operating system and one for the system deployed to /opt, can be more efficient
17 Note: If required disk space exists outside of the /opt file system, mount the desired target directory using the command mount -bind <olddir> <newdir>. Make sure that the file system is automatically mounted on reboot by editing the /etc/fstab file appropriately. Deploying SecurityCenter on a server configured with RAID disks can also dramatically boost performance. Note: SecurityCenter does not require RAID disks for even our largest customers. However, in one instance, response times for queries with a faster RAID disk for a customer with more than 1 million managed vulnerabilities moved from a few seconds to less than a second
18 System Requirements Operating System Requirements Virtual Environment Requirements Secure Environment Requirements Dependencies SecurityCenter Communications and Repositories Operating System Requirements This version of SecurityCenter is available for: Red Hat Enterprise Server 5 (64-bit) Red Hat Enterprise Server 6 (64-bit) Red Hat Enterprise Server 7 (64-bit) CentOS 6 (64-bit) CentOS 7 (64-bit) SELinux policy configuration is supported by Tenable in a Permissive mode. Note: Other SELinux modes are known to work, but the required configuration varies based on policies and custom configurations that may be in place on-site. It is strongly recommended that SELinux implementation configurations are tested prior to deployment on a live network. Virtual Environment Requirements SecurityCenter is well suited to virtual platforms and comes prepackaged along with Nessus and Nessus Network Monitor on the Tenable Appliance Virtual Machine image. Multiple VM images may be deployed on the network to support multiple products. Because of the unique performance considerations with virtualized platforms, please consult your VM software vendor for recommendations, as VMs typically see some loss in efficiency compared with dedicated servers. Secure Environment Requirements
19 It is assumed that organizations have the appropriate skill-set required to maintain the operating system environment in a secure manner and that they are configured and maintained with the following conditions: The operating system must be configured in a secure manner to ensure that security controls cannot be bypassed. The network must be configured to ensure that the SecurityCenter system resides in a secure network segment that is not accessible from the Internet. Network time synchronization must be enabled to ensure that accurate time stamps are recorded in reports and log files. Note: The time zone is set automatically during the installation process with no user interaction. If steps are required for manual time zone configuration, please refer to the following KB article: Important: The time zone configured in php.ini must be synchronized with the system time zone in /etc/sysconfig/clock. Access control mechanisms must be in place to ensure that only authorized users have access to the OS platform. Of particular importance is the requirement to monitor system resources to ensure that adequate disk space and memory are available. If system resources are exhausted, there is a risk that audit data could be prevented from being logged due to the system becoming dysfunctional. See SecurityCenter Troubleshooting for information on how system administrators can recover the system should SecurityCenter become inoperative due to resource exhaustion. During recovery processes, actions by the system administrator may not be logged by SecurityCenter until sufficient resources have been made available. The following resource provides details for secure administration of a Red Hat installation: docs.redhat.com/docs/en-us/red_hat_enterprise_linux/6/html/security_guide/index.html. Note: Even though the security concepts from this guide are written for RHEL 6, most of the concepts and methodologies apply to earlier versions of RHEL that are supported with SecurityCenter. Note: As with any application, the security and reliability of the installation is dependent on the environment that supports it. It is strongly recommended that organizations deploying SecurityCenter have an established and applied IT management policy that covers system administration integrity, resource monitoring, physical security, and disaster recovery. Dependencies
20 Note: Either OpenJDK or the Oracle Java JRE along with their accompanying dependencies must be installed on the system along with any additional Java installations removed for reporting to function properly. Note: Although it is possible to force the installation without all required dependencies, if your version of Red Hat or CentOS is missing certain dependencies, this will cause problems that are not readily apparent with a wide variety of functions. Tenable Support has observed different types of failure modes for SecurityCenter when dependencies to the installation RPM are missing. If you require assistance or guidance in obtaining these dependencies, please contact our Support team at support@tenable.com The following programs must be installed on the system prior to installing the SecurityCenter package. While they are not all required by the installation RPM file, some functionality of SecurityCenter may not work properly if the packages are not installed. The packages listed below are among those that are most often not installed by default: java openjdk (or later) (or the latest Oracle Java JRE) openssh expat gdbm libtool libtool-ltdl libxml2 ncurses readline compat-libstdc++ libxslt Note: Using the latest stable production version of each package is recommended. For a list of required packages, run the following command against the SecurityCenter RPM file: # rpm qp SecurityCenter-5.x.x-es6.x86_64.rpm --requires To determine which version of a dependency is installed on your system, run the following command for each of the packages (replace libtool with the appropriate package): # rpm qa grep libtool
21 If one of the prerequisite packages is missing, it can be installed using the yum or rpm package managers. For example, install Java with yum using the command below: # yum -y install java openjdk.x86_64 SecurityCenter Communications and Repositories The following table summarizes the components primary repositories and communication methods. SecurityCenter Installation Directory User Data Repositories Admin Logs Organization Logs Communication Interfaces /opt/sc /opt/sc/orgs/<organization Serial Number> /opt/sc/repositories/<repository Number> /opt/sc/admin/logs/ /opt/sc/orgs/<organization Number>/logs/ User Access: HTTPS Feed Updates: Acquired over SSL from Tenable servers directly to SecurityCenter or for offline installation. Plugin packages are secured via 4096-bit RSA digital signatures
22 Web Browser Requirements You can access the SecurityCenter user interface using the following browsers: Microsoft Internet Explorer 10 or later Mozilla Firefox 32 or later Google Chrome 37 or later Mac OS Safari 7.1 or later
23 Tenable Integrated Product Compatibility The following table lists the minimum software versions of Tenable products that work with SecurityCenter 5.5.x. In some cases, specific feature support raises the minimum version. Product Minimum Version Nessus (for active scans) (for diagnostic scans) (for CyberArk credentials) Nessus Manager Log Correlation Engine Nessus Network Monitor D Tool
24 Installation and Upgrade To perform a fresh installation of SecurityCenter, see Before You Install and Install SecurityCenter. To perform an upgrade of SecurityCenter, see Before You Upgrade and Upgrade SecurityCenter. To uninstall SecurityCenter, see Uninstall SecurityCenter
25 Before You Install Note: A basic understanding of Linux is assumed throughout the installation, upgrade, and removal processes. Research SecurityCenter Licenses Confirm your licenses are valid for your SecurityCenter deployment. SecurityCenter does not support an unlicensed demo mode a license key is required. SecurityCenter licenses are valid for a specific hostname and for a maximum number of discovered, active IP addresses. For example, if you purchase a 500 IP SecurityCenter license for a SecurityCenter with the hostname security, the license key allows you to scan several networks but you cannot discover more than 500 IP addresses. Tip: To obtain the hostname of the machine where SecurityCenter will be installed, type the hostname command at the shell prompt. SecurityCenter generates a warning in the web interface when you approach or exceed the license limit. Contact Tenable Sales for an expanded license key. Offline repositories are not counted towards the IP license count. Additionally, the following plugins (listed by ID) are not counted towards the license IP count when scanned using the Ping Host port scanner:
26 through Note: Using other port scanners will cause the detected IPs to be counted against the license. During initial configuration, upload the license key to SecurityCenter and activate the license. Disable Default Web Servers SecurityCenter provides its own Apache web server listening on port 443. If the installation target already has another web server or other service listening on port 443, you must disable that service on that port or configure SecurityCenter to use a different port after installation. Identify which services, if any, are listening on port 443 by running the following command: # ss -pan grep ':443 ' Modify Security Settings The default Red Hat firewall settings cause issues with SecurityCenter s web services. To alleviate this, set SELinux to Disabled in Enforcing mode or to Enabled in Permissive mode. To disable SELinux in Enforcing mode: 1. Navigate to: /etc/selinux. 2. Edit the file named config
27 3. Change the SELINUX line from SELINUX=enforcing to SELINUX=disabled or SELINUX- X=permissive. 4. Save the file. 5. Reboot the system. 6. Confirm the following incoming services are permitted by the firewall rules: SSH (port 22 by default) HTTPS (port 443 by default) RHEL 7/CentOS 7 - the local firewall may be disabled upon install and the user should reenable it with the appropriate access information 7. Confirm the following ports are open for SecurityCenter to communicate with other Tenable products: NNM (port 8835 by default) Nessus (port 8834 by default) Log Correlation Engine (port 1243 by default) Note: Please consult local security and best practices within your environment for the proper usage and configuration of SELinux. SecurityCenter is known to work with SELinux in Enforcing mode with some customization of the SELinux rules. However, permitted rules vary from organization to organization. Perform Log File Rotation The installation does not include a log rotate utility; however, the native Linux logrotate tool is supported post-installation. In most Red Hat environments, logrotate is installed by default. The following logs will be rotated if the logrotate utility is installed: All files in /opt/sc/support/logs matching *log /opt/sc/admin/logs/sc-error.log During an install/upgrade, the installer will drop a file named SecurityCenter into /etc/- logrotate.d/ that contains log rotate rules for the files mentioned above. Log files are rotated on a monthly basis. This file will be owned by root/root. Obtain the Installation Package
28 The installer comes in a number of versions based on OS level and architecture: SecurityCenter-x.x.x-os.arch.rpm Confirm the integrity of the installation package by comparing the download checksum with the checksum listed in the product release notes. Depending on the OS of the host, you may also need to move the installer to it using your preferred file transfer tool
29 Install SecurityCenter Note: A basic understanding of Linux is assumed throughout the installation, upgrade, and removal processes. Caution: When performing sudo installs, use sudo i to ensure the proper use of environmental variables. Caution: During the installation process, SecurityCenter produces a log file in a temporary location: /tmp/sc.install.log. Once the installation process finishes, the file is stored here: /opt/sc/admin/logs/install.log. Do not remove or modify these files; they are important for debugging in case of a failed installation. To install SecurityCenter: 1. As the root user, install the RPM by running the following command: # rpm -ivh SecurityCenter-5.x.x-es6.x86_64.rpm Output similar to the following is generated: # rpm -ivh SecurityCenter-5.x.x-es6.x86_64.rpm Preparing... ########################################### [100%] 1:SecurityCenter ########################################### [100%] Installing Nessus plugins... complete Applying database updates... complete. By default, SecurityCenter will listen for HTTPS requests on ALL available interfaces. To complete your installation, please point your web browser to one of the following URL(s): Starting SecurityCenter services [ OK ] SecurityCenter services: [ OK ] # The system installs the package into /opt/sc and attempt to start all required daemons and the web server services. Tip: In rare cases, a system restart is required after installation in order to start all services
30 Launch the Web Interface To launch the configuration interface, open a supported web browser on a system that has access to the system s network address space and type the URL for your SecurityCenter: ADDRESS OR NAME>/. Where <SERVER ADDRESS OR NAME> is the IPv4 or IPv6 address or hostname for your SecurityCenter. Note: You must access the SecurityCenter web interface using a secure web connection (https). You must enable TLS 1.0 in your browser in order to complete the secure connection to SecurityCenter. SecurityCenter 5.5.x does not listen on port 80. Use the top navigation bar to navigate within the SecurityCenter user interface. Tenable does not recommend using your browser s back and forward buttons. Note: Tenable recommends clearing your browser cache before loading the web interface. Inital Login When you log in to SecurityCenter for the first time, SecurityCenter displays the Quick Setup Guide welcome page to begin a multi-step setup process for initial configuration. For more information about quick setup, see Quick Setup. If you prefer to configure the system manually, click Exit Quick Setup Guide to be taken to the Configuration page of SecurityCenter. For more information about getting started with SecurityCenter, see Getting Started Workflow. Subsequent Login Launch the web interface and log in using the credentials provided by the user who created your account

31 After initial login, SecurityCenter displays the dashboard with different elements depending on your user role. When you log in as an administrator user, it displays scanner, repository, LCE, and plugin data through predefined components. There are two options from the switch dashboard drop-down box: Overview and LCE Overview. The Overview page contains a Scanner Status table, a Repository Statistics table, and a table containing the latest plugin feed updates. The System Status section of the dashboard is interactive. The Job Daemon s status is displayed and may be started or stopped by clicking the appropriate link. The LCE Overview page lists the LCE servers and the status of clients attached to the LCE server (up to 1,000 clients displayed)
32 When you log in as an organizational user, the dashboard displays various components displaying information as configured by the user. Available from the Dashboard tab, selecting Dashboard will return you to the default dashboard and selecting Assurance Report Card (ARC) will display the ARC page
33 - 33 -
34 Quick Setup The SecurityCenter Quick Setup Guide walks through the following configurations: License Nessus Scanner PVS LCE Repository Organization LDAP User After configuring, Review and confirm. License
35 Click Choose File to upload the license file you received from Tenable. The file should follow the format: <CompanyName>_SC<IP Count>-<#>-<#>.key After uploading and clicking the Activate button, the page confirms successful upload and activation of a valid license. Nessus, NNM, and LCE Licenses Consider adding additional license activation codes: SecurityCenter Activation Code required before registering any Nessus scanners that will be used by the SecurityCenter. The SecurityCenter Activation Code allows SecurityCenter to download plugins and update Nessus scanner plugins. In the Nessus section, type the SecurityCenter Activation Code and click Register. PVS Activation Code required before using and managing attached NNM scanners. In the PVS section, type the PVS Activation Code and click Register. LCE Activation Code required before downloading LCE Event vulnerability plugins to SecurityCenter. The LCE Activation Code allows SecurityCenter to download event plugins, but it does
36 not manage plugin updates for LCE servers. In the LCE section, type the LCE Activation Code and click Register. Click Next to continue. A plus (+) sign with a grey background indicates that no license is applied for the product. A red box with an X indicates an invalid activation code. Click on the plus (+) or X to add or reset a license activation code. A green box with a checkmark indicates a valid license is applied and that SC initiated a plugin download in the background. The download may take several minutes and must complete before initiating any Nessus scans. After the download completes, the Last Updated date and time are updated on the Plugins page. Nessus Scanner
37 Once the license and Activation Code(s) have been entered, the next stage of installation is to configure the first Nessus scanner. Tenable.io and Nessus Manager scanners that are used for Nessus Agent scan imports may enable or add the feature after the initial configuration is complete. This section requests information to connect to the Nessus scanner and the options are detailed in the following table: Option Name Host Port Enabled Verify Hostname Use Proxy Authentication Type Username Password Certificate Descriptive name for the Nessus scanner. Scanner description, location, or purpose. Hostname or IP address of the scanner. TCP port that the Nessus scanner listens on for communications from SecurityCenter. The default port is A scanner may be Enabled or Disabled within SecurityCenter to allow or prevent access to the scanner. Adds a check to verify that the hostname or IP address entered in the Host option matches the CommonName (CN) presented in the SSL certificate from the Nessus server. Instructs SecurityCenter to use its configured proxy for communication with the scanner. Select Password or SSL Certificate for the authentication type to connect to the Nessus scanner. Username generated during the Nessus install for daemon to client communications. This must be an administrator user in order to send plugin updates to the Nessus scanner. If the scanner will be updated by a different method, such as through another SecurityCenter, a standard Nessus user account may be used to perform scans. This option is only available if the Authentication Type is set to Password. The login password must be entered in this option. This option is only available if the Authentication Type is set to Password. This option is available if the Authentication Type is SSL Certificate. Click the Browse button, choose a SSL Certificate file to upload, and upload to the SecurityCenter
38 PVS When a NNM license is installed, the option to configure the initial NNM scanner is enabled. This page asks for the information to connect to the NNM scanner and the options are detailed in the following table: Option Name Host Port Enabled Descriptive name for the NNM scanner. Scanner description, location, or purpose. Hostname or IP address of the scanner. TCP port that the NNM scanner listens on for communications from SecurityCenter. The default is port A scanner may be marked as Enabled or Disabled within SecurityCenter to allow or prevent access to the scanner
39 Option Verify Hostname Use Proxy Authentication Type Username Password Certificate Adds a check to verify that the hostname or IP address entered in the Host option matches the CommonName (CN) presented in the SSL certificate from the NNM server. Instructs SecurityCenter to use its configured proxy for communication with the scanner. Select Password or SSL Certificate for the authentication type to connect to the NNM scanner. Username generated during the NNM install for daemon to client communications. This must be an administrator user in orderto send plugin updates to the NNM scanner. This option is only available if the Authentication Type is set to Password. The login password must be entered in this option. This option is only available if the Authentication Type is set to Password. This option is available if the Authentication Type is SSL Certificate. Click the Browse button, choose a SSL Certificate file to upload, and upload to SecurityCenter. LCE
40 When a Log Correlation Engine license is installed, the option to configure the initial LCE server is enabled. This page asks for the information to connect to the NNM scanner and the options are detailed in the following table. Option Name Host Check Authentication Import Vulnerabilities Port Username Name used to describe the Log Correlation Engine. Descriptive text for the Log Correlation Engine. IP address of the Log Correlation Engine. This button checks the status of the authentication between SecurityCenter and the LCE server. When enabled, allows Event vulnerability data to be retrieved from the configured LCE server. Type the port that the LCE reporter is listening on the LCE host. Type the reporter username used to authenticate to the LCE to retrieve vul
41 Option nerability information. Password Type the reporter password used to authenticate to the LCE to retrieve vulnerability information. Repository Caution: When creating repositories, note that IPv4 and IPv6 addresses must be stored separately. Additional repositories may be created once the initial configuration is complete. A repository is essentially a database of vulnerability data defined by one or more ranges of IP addresses. When the repository is created, a selection for IPv4 or IPv6 addresses must be made. Only IP addresses of the designated type may be imported to the designated repository. The organization created in steps that follow can take advantage of one or more repositories. During installation, a single local repository is created with the ability to modify its configuration and add others postinstall
42 Caution: When creating SecurityCenter repositories, LCE event source IP ranges must be included along with the vulnerability IP ranges or the event data will not be accessible from the SecurityCenter UI. Local repositories are based on the IP addresses specified in the IP Ranges option on this page during the initial setup. Remote repositories use addressing information pulled over the network from a remote SecurityCenter. Remote repositories are useful in multi-securitycenter configurations where security installations are separate but reports are shared. Offline repositories also contain addressing information from another SecurityCenter. However, the information is imported to the new installation via a configuration file and not via a direct network connection. This facilitates situations where the remote SecurityCenter is isolated from other networks via an air gap. The following table describes the options available during the repository setup: Repository Options Option General Name The repository name. Descriptive text for the repository. Data Type IP Ranges Determines if the repository being created is for IPv4 or IPv6 addresses. Allowed ranges for importing vulnerability data. Addresses may be a single IP address, IP range, CIDR block, or any comma-delimited combination. Advanced Settings Generate Trend Data Note: If trending is not selected, any query that uses comparisons between repository snapshots (e.g., trending line charts) will not be available. This option allows for a periodic snapshot of the.nessus data for vulnerability trending purposes. This option is useful in cases where tracking data changes is important. In situations where repository datasets do not change frequently negating the need for trending disable this option to minimize disk space usage. Days Trending Enable Full Sets the number of days for the trending data to track. Determines if the trending data presented is indexed for a full text search
43 Option Text Search Organization An organization is a set of distinct users and groups and the resources they have available to them. There are two areas to configure initially for the organization, the General and Scanning options. General provide the organization name, description, and contact/location information. Scanning provide the ranges that the organization will have access to. Type IP addresses as a range or using CIDR notation. You can configure one organization during initial setup. If you want to use multiple organizations, continue configuring after initial setup. For detailed information about organizations, see Organizations and Groups. LDAP
44 Configuring LDAP allows you to use external LDAP servers for the SecurityCenter user account authentication or as LDAP query assets. Type all required LDAP server settings and click Next. Click Skip if you do not want to configure LDAP during initial configuration. You can configure one LDAP server connection during initial setup. If you want to use multiple LDAP servers, or if you want to configure additional options, continue configuring after initial setup. For more information about LDAP configuration options and to configure multiple LDAP severs, see LDAP Servers. User
45 You must create one administrator and one security manager during initial setup. For more information, see User Roles. Security manager a user to manage the organization you just created. After you finish initial setup, the security manager can create other user accounts within the organization. Administrator a user to manage SecurityCenter. After you finish initial setup, the administrator can create other organizations and user accounts. If you already configured an LDAP server, you have the option to create an LDAP user account. For more information about TNS or LDAP user account options, see User Accounts. After creating the security manager user and setting the administrator password, click Next to finish initial setup. The Admin Dashboard page appears, where you can review login configuration data. Review
46 The review page displays your currently selected configurations. If you want to make further changes, click on the links in the left navigation bar. When you are finished, click Confirm
47 Before You Upgrade Note: A basic understanding of Linux is assumed throughout the installation, upgrade, and removal processes. SecurityCenter Version Requirements For more information, see the SecurityCenter Release Notes. Java Version Requirements If the Oracle Java JRE or OpenJDK is not installed, SecurityCenter displays the following warning: [WARNING] SecurityCenter has determined that Oracle Java JRE and OpenJDK is not installed. One of two must be installed for SecurityCenter reporting to function properly. You must install the latest version of Oracle Java JRE or OpenJDK to take full advantage of SecurityCenter reporting. Halt or Complete Running Jobs Tenable recommends stopping all running SecurityCenter processes before beginning an upgrade. If processes are running (e.g., Nessus scans), SecurityCenter displays the following message along with the related process names and their PIDs: SecurityCenter has determined that the following jobs are still running. Please wait a few minutes before performing the upgrade again. This will allow the running jobs to complete their tasks. Stop the processes manually or retry the upgrade after the processes complete. Backup SecurityCenter Data Tenable recommends backing up the /opt/sc4 or /opt/sc directory (as appropriate) before beginning the upgrade. 1. Stop all SecurityCenter processes. 2. Perform the backup by running the following command from a directory outside of /opt/sc4-47 -
48 or /opt/sc (such as / or /home): # tar -pzcf sc_backup.tar.gz /opt/sc4 # tar -pzcf sc_backup.tar.gz /opt/sc 3. If the backup leaves too little space to perform the upgrade, move the sc_backup.tar.gz file to a different location. Rename Mount Point If the existing /opt/sc4 or /opt/sc directory is or contains a mount point to another location it must be updated. During the rpm upgrade process, a message will be displayed with information about the discovered mount point and instruct you to contact Tenable Support for a mount point tool to help identify and migrate your mount points for the upgrade to continue. Reconfigure SecurityCenter 5.4 CoSign Authentication CoSign is not a supported authentication method in SecurityCenter 5.5.x. If your SecurityCenter 5.4.x installation uses CoSign servers for authentication, you must reconfigure your SecurityCenter 5.4.x to use an authentication method supported in SecurityCenter 5.5.x
49 Upgrade SecurityCenter Note: This topic assumes a basic understanding of Linux. Caution: During the upgrade process, SecurityCenter produces a log file in a temporary location: /tmp/sc.install.log. Once the installation process finishes, the file is stored here: /opt/sc/admin/logs/install.log. Do not remove or modify these files; they are important for debugging in case of a failed upgrade. For information about new features, resolved issues, third-party product updates, and supported upgrade paths, see the release notes for SecurityCenter 5.5.x. To upgrade to SecurityCenter 5.5.x: 1. Download the new RPM from the Tenable Support Portal to your SecurityCenter server. 2. Confirm that no scans are in progress. If necessary, manually pause scans (you can resume them after the update). 3. Prepare the upgrade command you intend to run: Use rpm with the -Uvh switches from the command-line of the SecurityCenter server. Use sudo -i when performing sudo upgrades of SecurityCenter to ensure the proper use of environmental variables. For example: # rpm -Uvh SecurityCenter-x.x.x-es6.x86_64.rpm The upgrade begins. SecurityCenter is not available until the upgrade finishes. # rpm -Uvh SecurityCenter-x.x.x-es6.x86_64.rpm Preparing... ########################################### [100%] Shutting down SecurityCenter services: [ OK ] Backing up previous application files... complete. 1:SecurityCenter ########################################### [100%] Applying database updates... complete. Beginning data migration. Starting plugins database migration...complete. (1 of 4) Converting Repository 1... complete
50 (2 of 4) Converting Repository 2... complete. (3 of 4) Converting Repository 3... complete. (4 of 4) Converting Repository 4... complete. Migration complete. Starting SecurityCenter services: [ OK ] ~]# If custom Apache SSL certificates are in use prior to the upgrade, the SecurityCenter backs the certificates up as part of the upgrade process. SecurityCenter copies the existing custom SSL certificates to the Apache configuration backup directory that the upgrade process creates in the /tmp/[version].apache.conf-######## directory. The exact name of the directory varies, but the system displays the name during the upgrade process, as well as reports it in the /opt/sc/admin/log/install.log file. To restore custom SSL certificates after upgrade: 1. Enter the following command: # cp /tmp/[version].apache.conf-########/securitycenter.cert /opt/sc/support/conf/securitycenter.crt 2. Select yes to overwrite the existing file. 3. Enter the following command: # cp /tmp/[version].apache.conf-########/securitycenter.pem /opt/sc/support/conf/securitycenter.key 4. Select yes to overwrite the existing file). Caution: Ensure that the newly copied files have permissions of 0640 and ownership of tns:tns. 5. Modify the servername parameter in /opt/sc/support/conf/servername to match the Common Name (CN) of the SSL certificate. Tip: To obtain the CN, run the following command and note the CN= portion of the result. # /opt/sc/support/bin/openssl verify /opt/sc/support/conf/securitycenter.crt 6. Restart the Apache server with one of the following commands: # /opt/sc/support/bin/apachectl restart
51 -or- # service SecurityCenter restart
52 Uninstall SecurityCenter To uninstall SecurityCenter: 1. Stop SecurityCenter with the following command: service SecurityCenter stop 2. Determine the name of the RPM package with the following command: rpm -qa grep SecurityCenter The name of the RPM package appears. 3. Remove the SecurityCenter package with the following command: rpm -e RPM package name 4. Remove user-created and user-modified files with the following command: rm -rf /opt/sc SecurityCenter is removed
53 Start or Stop SecurityCenter When SecurityCenter is installed, the required services are started by default. To change the status of SecurityCenter: 1. As root user, run the following command on the SecurityCenter server: # service SecurityCenter status The system indicates whether SecurityCenter is running or stopped. 2. To start SecurityCenter, run: # service SecurityCenter start 3. To stop SecurityCenter, run the following command: # service SecurityCenter stop 4. To restart SecurityCenter, run the following command: # service SecurityCenter restart
54 Configure SecurityCenter Features See the following sections to configure SecurityCenter to gather data. System Settings User Access Repositories Scans Resources Workflow Actions
55 System Settings The System menu in the top navigation bar contains several options to configure SecurityCenter system settings. Administrator users can configure more options than organizational users. Configuration Settings Diagnostics Settings Job Queue Settings System Logs Settings Publishing Sites Settings Keys Settings
56 Configuration Settings Path: System > Configuration The configuration menu includes the following settings: Data Expiration Settings External Schedules Settings Mail Settings Miscellaneous Settings License Settings Plugins/Feed Settings Security Settings Data Expiration Settings Data expiration determines how long SecurityCenter retains acquired data
57 Use the table below to determine default and minimum values for these settings: Option Active Passive Event Compliance Mitigated Closed Tickets SecurityCenter will automatically remove any vulnerability data that was discovered via active scanning after the designated number of days. The default value of this option is 365. By default, SecurityCenter will automatically remove any passive vulnerability data that is older than seven days. SecurityCenter will automatically remove any event vulnerability data that was discovered via LCE log scanning after the designated number of days. The default value of this option is 365. SecurityCenter will automatically remove any compliance data after the designated number of days. The default value of this option is 365. Automatically remove any mitigated vulnerability data after the designated number of days. The default value of this option is 365. Automatically remove any closed tickets after the designated number of days. The default value of this option is
58 Option Scan Results Report Results Automatically remove any scan results after the designated number of days. The default value of this option is 365. Automatically remove any report results after the designated number of days. The default value of this option is 365. External Schedules Settings The SecurityCenter external schedule settings are used to determine the update schedule for the common tasks of pulling NNM data, IDS signature updates, and IDS correlation updates. The following settings are available: Option Pull Interval IDS Signatures This option configures the interval that SecurityCenter will use to pull results from the attached NNM servers. The default setting is 1 hour. The timing is based from the start of the SecurityCenter service on the host system. Frequency to update SecurityCenter IDS signatures via third-party sources. The schedule is shown along with the time zone being used
59 Option IDS Correlation Databases Frequency to push vulnerability information to the LCE for correlation. The schedule is shown along with the time zone being used. Each of the update schedule times may also be configured to occur by time in a particular time zone, which can be selected via the Time Zone link next to each hour selection. Mail Settings The Mail option designates SMTP settings for all related functions of SecurityCenter. Available options include SMTP host, port, authentication method, encryption, and return address. In addition, a Test SMTP Settings link is displayed in the top left of the page to confirm the validity of the settings. Note: The Return Address defaults to noreply@localhost. Use a valid return address for this option. If this option is empty or the server requires s from valid accounts, the will not be sent by the server. Miscellaneous Settings The Miscellaneous Configuration area offers options to configure settings for web proxy, syslog, notifications, and enable or disable a variety of reporting types that are encountered and needed only in specific situations
60 Web Proxy From this configuration page, a web proxy can be configured by entering the host URL (proxy hostname or IP address), port, authentication type, username, and password. The host name used must resolve properly from the SecurityCenter host. Syslog The Syslog section allows for the configuration and sending of SecurityCenter log events to the local syslog service. When Enable Forwarding is enabled, the forwarding options are made available for selection. The Facility option provides the ability to enter the desired facility that will receive the log messages. The Severity option determines which level(s) of syslog messages will be sent: Informational, Warning, and/or Critical
61 Notifications The Notifications section defines the SecurityCenter web address used when notifications are generated for alerts and tickets. Report Generation Among the reporting standards for the Defense Information Systems Agency (DISA) are the Asset Report Format (ASR) and the Assessment Results Format (ARF) styles. Additionally, there is CyberScope reporting utilizing Lightweight Asset Summary Results Schema (LASR) style reports used by some segments of governments and industry. These formats are typically used only by select groups and organizations for specific needs that do not apply to many organizations. Enable the slider to display the style as a Report Type during report configuration. License Settings The License section allows the administrator user to configure the licensing and activation code settings for SecurityCenter and the attached Tenable products
62 This page will rarely need to be modified by the administrator user. It contains two sections, the SecurityCenter License section and the Additional Licenses section. This page will only be changed manually when a new or upgraded activation code for Nessus, NNM, or LCE has been purchased by the organization. Tip: Offline repositories are not counted against the IP license count. Also, the following plugins are not counted against the license IP count when scanned using the Ping Host port scanner. Using other port scanners will cause the detected IPs to be counted against the license: Nessus IDs: 10180, 10287, 19506, 12053, 11933, NNM IDs: 00003, LCE IDs: 800, , 099 For information about the SecurityCenter IP license count, see Before You Install. To add a new license, use the Choose File button next to the License File option to locate the license key file and then click Submit. Once a valid license is applied, a green option is displayed indicating a valid license and several informational options will be shown. The options indicate the name of the licensee, the type of license, the hostname of the SecurityCenter server, the license expiration date, IP count in use, and the maximum number of IPs allowed by the license
63 For SecurityCenter installations, a valid Nessus Activation Code must also be entered to register any Nessus scanners used by SecurityCenter. A valid LCE Activation Code must be entered to download the LCE Event vulnerability plugins to SecurityCenter. A valid PVS Activation Code is required to use and manage attached NNM scanners. The Activation Codes are hyphen delimited alpha-numeric strings that enable SecurityCenter to download plugins and update Nessus scanner plugins. The LCE Activation Code allows SecurityCenter to download event plugins, but does not manage plugin updates for LCE servers. After uploading a valid license key and entering a valid Activation Code(s), click Next to continue. A + sign with a grey background indicates that there has not been a license applied for the product. A green box with a checkmark in it indicates a valid code is entered. A red box with an X indicates an invalid code. Clicking on the symbol will reveal an area to either add or reset the Activation Code. Once a new code has been entered into the box and registered, it will indicate as valid or invalid. A plugin download is initiated in the background. This plugin download can take several minutes and must complete before any Nessus scans are initiated. Once the plugin update has occurred, the Last Updated date and time are updated on the Plugins page. Plugins/Feed Settings
64 The Plugins/Feed Configuration page displays the following information: the Plugin Detail Locale for SecurityCenter. the feed and plugin update schedules. Plugins are scripts used by the Nessus, NNM, and LCE servers to interpret vulnerability data. For ease of operation, Nessus and NNM plugins are managed centrally by SecurityCenter and pushed out to their respective scanners. LCE servers download their own event plugins and SecurityCenter downloads event plugins for its local reference. SecurityCenter does not currently push event plugins to LCE servers. For more information, see Edit Plugin and Feed Schedules. Custom Plugins You can upload a custom plugin as a custom CA certificate file. All custom plugins must have unique Plugin ID numbers and have family associations based on existing SecurityCenter families. Note: Custom plugin uploads must now be a complete feed. In order to upload custom plugins the provided tar.gz file must include the relevant NASLs and a custom_feed_info.inc file comprised of the following two lines: PLUGIN_SET = " ";
65 PLUGIN_FEED = "Custom"; The administrator user must manage this file and update the PLUGIN_SET option for each upload. The PLUGIN_SET format is YYYYMMDDHHMM. For example, running the following command against the custom_feed_info.inc file and custom plugins in a directory will create a new tar and gziped uploadable archive file called custom_nasl_ archive.tar.gz that contains both custom plugins: # tar -cvzf custom_nasl_archive.tar.gz custom_feed_info.inc *.nasl It is recommended that the custom_nasl_archive.tar.gz file be updated for each addition and update of custom NASLs. For more information, see Upload a Custom CA Certificate. Feed Schedules SecurityCenter automatically updates SecurityCenter feeds, active plugins, passive plugins, and event plugins. If you upload a custom feed or plugin file, the system merges the custom file data with the data contained in the associated automatically updating feed or plugin. You can upload tar.gz files or.xml files with a maximum size of 1500 MB. SecurityCenter supports.xml files only when the file contains translated content for use with the local language plugin feature. For more information, see Edit Plugin and Feed Schedules. Custom File Details All custom plugins must have unique Plugin ID numbers and have family associations based on existing SecurityCenter families. Custom plugin uploads must be a complete feed. In order to upload custom plugins the provided tar.gz file must include the relevant NASLs and a custom_feed_info.inc file comprised of the following two lines: PLUGIN_SET = " "; PLUGIN_FEED = "Custom"; The administrator user must manage this file and update the PLUGIN_SET option for each upload. The PLUGIN_SET format is YYYYMMDDHHMM
66 For example, running the following command against the custom_feed_info.inc file and custom plugins in a directory will create a new tar and gzip uploadable archive file called custom_nasl_ archive.tar.gz that contains both custom plugins: # tar -cvzf custom_nasl_archive.tar.gz custom_feed_info.inc *.nasl It is recommended that the custom_nasl_archive.tar.gz file be updated for each addition and update of custom NASLs. Plugin Detail Locale The local language plugin feature allows you to display portions of plugin data in local languages. When available, translated text displays on all pages where plugin details are displayed. Select Default to display plugin data in English. SecurityCenter cannot translate text within custom files. You must upload a translated Active Plugins.xml file in order to display the file content in a local language. For more information, see Configure Plugin Text Translation. Security Settings Use the Security section to define the SecurityCenter web interface login parameters and options for account logins. You can also configure banners, headers, and classification headers and footers
67 Use the table below to determine correct values for your environment: Option Session Timeout Maximum Login Attempts Minimum Password Length Password The web session timeout in minutes (default: 60). The maximum number of user login attempts allowed by SecurityCenter before the account is locked out (default: 20). Setting this value to 0 disables this feature. This setting defines the minimum number of characters for passwords of accounts created using the local TNS authentication access (default: 3). Provides the option to enforce a minimum password length (4 characters) and

68 Option Complexity Startup Banner Text Header Text the use of an upper case letter, lower case letter, numerical character, and special character. Type the text banner that is displayed prior to the login interface. Adds custom text to the top of the SecurityCenter user interface pages. The text may be used to identify the company, group, or other organizational information. The option is limited to 128 characters. Classification Type Adds a header and footer banner to SecurityCenter to indicate the classification of the data accessible via the software. Current options are None, Unclassified, Confidential, Secret, Top Secret, and Top Secret No Foreign. Sample header: Sample footer: Note: When set to an option other than None, the available report style for users will only show the plain report style types. The Tenable report styles do not support the classification banners. Allow Session Management This setting is disabled by default. When enabled, the Session Limit option will appear. This feature displays the option that will allow the administrator user to
69 Option set a session limit for all users. Disable Inactive Users Session Limit This setting disables accounts after a set period of inactivity. Type the number of days to keep the account active before disabling in the Days Users Remain Enabled option that appears when this option is switched on. Any number entered here will be saved as the maximum number of sessions a user can have open at one time. If you log in and the session limit has already been reached, you will be prompted with a warning that the oldest session with that username will be logged out automatically. You can cancel the login, or proceed with the login and end the oldest session. Note: This behavior is different for CAC logins. The previously described behavior is bypassed as was the old login behavior. Login Notifications FIPS Configuration Sends notifications for each time a user logs in. Allows the user to enable or disable FIPS mode for communication. Transitioning from one mode to the other will require a restart
70 Edit Plugin and Feed Schedules To view and edit plugin and feed schedules as an administrator user: 1. Log in to SecurityCenter as an organizational user with appropriate permissions. For more information, see User Roles. 2. In the top navigation bar, click System > Configuration. The Configuration page appears. 3. Click the Plugins/Feed button. The Plugins/Feed Configuration page appears. 4. View the Plugin Detail Locale section to see the local language configured for the SecurityCenter. 5. Expand the Schedules section to show the settings for the SecurityCenter Feed, Active Plugins, Passive Plugins, or Event Plugins schedule. 6. If you want to update a plugin or feed on demand, click Update. You cannot update feeds with invalid activation codes. 7. If you want to upload a custom feed or plugin file, click Choose File. 8. Click Submit. To view and edit plugin and feed schedules as an organizational user: 1. Log in to SecurityCenter as an organizational user with appropriate permissions. For more information, see User Roles. 2. In the top navigation bar, click Username > Feeds. The Plugins/Feed Configuration page appears. 3. View the Plugin Detail Locale section to see the local language configured for the SecurityCenter. 4. Expand the Schedules section to show the settings for the SecurityCenter Feed, Active Plugins, Passive Plugins, or Event Plugins schedule. 5. If you want to update a plugin or feed on demand, click Update. You cannot update feeds with invalid activation codes
71 6. If you want to upload a custom feed or plugin file, click Choose File. 7. Click Submit
72 Configure Plugin Text Translation To configure plugin text translation: 1. Log in to SecurityCenter as an organizational user with appropriate permissions. For more information, see User Roles. 2. In the top navigation bar, click System > Configuration. 3. Click the Plugins/Feed button. 4. If you want plugin text to display in a local language, select a language from the Locale List box. 5. Click Apply. 6. Perform an on-demand Active Plugins update to obtain available translations
73 Diagnostics Settings Path: System > Diagnostics This page displays and creates information that assists in troubleshooting issues that may arise while using SecurityCenter. In the System Status section, the following items show a green check mark to indicate they are working properly. A red X icon appears when the item is in a critical state. Option Correct Java Version Sufficient Disk Space Correct RPM Package Installed The icon is red when a minimal version of Java is not installed as required by certain SecurityCenter features. Once the disk that stores the SecurityCenter data is within 5% of being filled, the icon indicator turns red. This indicator is green when the correct RPM is installed for the OS architecture on which it is running. The Diagnostics File section is used primarily when working with the Tenable Support team. In order to troubleshoot issues that may be encountered, the Support team may request that a diagnostics file
74 be generated with one or more of the Diagnostics File Chapters selected. Click the Generate Diagnostics File button to set the options to be included in the diagnostic file. If selected, the Strip IPs from Chapters option removes IP addresses from the log files before generating the diagnostics file
75 Job Queue Settings Path: System > Job Queue Job Queue is a SecurityCenter feature that displays specified events in a list for review. You can view and sort Job Queue notifications in several ways by clicking on the desired sort column. Using the gear icon drop-down menu next to an item, that item may be viewed for more detail or, if the job is running, the process may be killed. Killing a process should be done only as a last resort, as killing a process may have undesirable effects on other SecurityCenter processes
76 System Logs Settings Administrator user path: System > System Logs Organizational user path: Username > System Logs Note: The System Logs menu is only available to users with the View Organizational Logs permission set
77 SecurityCenter logs contain detailed information about functionality to troubleshoot unusual system or user activity. The logs include filters, accessible by clicking the double arrow, that allow the user to search logs based on parameters such as date, Initiator (user), module, severity, and keywords. The number in the grey box to the left indicates the number of filters currently in use. This search flexibility improves debugging and maintains an audit trail of users who access SecurityCenter or perform basic functions such as changing passwords, recasting risks, or running Nessus scans
 Continuous Monitoring and Risk Scoring (CMRS) site. To configure the publishing site, click the Add a Publishing Site link.")
78 Publishing Sites Settings Path: System > Publishing Sites Organizations may configure publishing sites as targets to send report results to a properly configured web server or a Defense Information Systems Agency (DISA) Continuous Monitoring and Risk Scoring (CMRS) site. To configure the publishing site, click the Add a Publishing Site link. The Add Publishing Site page appears
79 Option Name Type Max Chunk Size (MB) URI Authentication Type a name for the publishing site. Type a description of the publishing site. The method SecurityCenter uses to publish to the site. Available options are HTTP Post or CMRS. Use the selection appropriate for the configuration of the publishing site. If the target is a CMRS site, Tenable sends the report in chunks sized according to this value. The target address to send the report to when completed. There are two methods of authentication available: SSL Certificate and Pass
80 Option word. Username / Password Certificate Organizations Verify Host If you select Password as the Authentication method, the credentials to authenticate to the target publishing server. If you selected SSL Certificate as the Authentication method, the certificate you want to use for authentication. Select the organization(s) that are allowed to publish to the configured site. When enabled, SecurityCenter verifies that the target address specified in the URI option matches the CommonName (CN) in the SSL certificate from the target publishing server

81 Keys Settings Path: System > Keys Keys allow administrator users to use key-based authentication with a remote SecurityCenter (remote repository) or between a SecurityCenter and an LCE server. This also removes the need for SecurityCenter administrators to know the administrator login or password of the remote system. Note: The public key from the local SecurityCenter must be added to the Keys section of the SecurityCenter from which you wish to retrieve a repository. If the keys are not added properly, the remote repository add process prompts for the root username and password of the remote host to perform a key exchange before the repository add/sync occurs. For more information, see Add a Key, Delete a Key, and Download the SecurityCenter SSH Key. Remote LCE Key Exchange A manual key exchange between the SecurityCenter and the LCE is normally not required; however, in some cases where remote root login is prohibited or key exchange debugging is required, you must manually exchange the keys. For the remote LCE to recognize the SecurityCenter, you need to copy the SSH public key of the SecurityCenter and append it to the /opt/lce/.ssh/authorized_keys file. The /opt/lce/daemons/lce-install-key.sh script performs this function. For more information, see Manual LCE Key Exchange
82 Add a Key To add a new key: 1. Log in to SecurityCenter as an administrator user. 2. Click System > Keys. The System Keys page appears. 3. Click Add. 4. In the Type drop-down box, select DSA or RSA. 5. (Optional) If you want to add a description or note about the key, type a Comment. 6. Type the text of the Public Key from your remote SecurityCenter. 7. Click Submit
83 Delete a Key To delete a key: 1. Log in to SecurityCenter as an administrator user. 2. Click System > Keys. 3. In the gear icon drop-down menu, click Delete. The Delete Key confirmation window appears. 4. Click Delete
84 Download the SecurityCenter SSH Key To download the SecurityCenter SSH key: 1. Log in to SecurityCenter as an administrator user. 2. Click System > Keys. 3. In the Options drop-down menu, click Download SC Key. The SecurityCenter SSH key downloads
85 User Access The Users page provides the ability to add, edit, delete, or view the details of SecurityCenter user accounts. When you view the Users page, you see a list of users and actions, limited by your account privileges. Your user role, organization membership, and/or group membership determine your account privileges. For more information, see User Roles and Organizations and Groups. There are two categories of user accounts: administrator users and organizational users: Administrator users have the system-provided administrator role and do not belong to organizations. Organizational users have the system-provided security manager, auditor, credential manager, executive, security analyst, security manager, or vulnerability analyst role, or a custom role, and belong to an organization. For more information, see User Accounts
86 User Roles Path: Users > Roles Roles determine what a user can or cannot access from their account. SecurityCenter comes with eight system-provided roles, but you can also create custom roles to satisfy complex security policy needs. You can customize the permissions on some, but not all, system-provided user roles. For more information, see Create a User Role, Edit a User Role, and Delete a User Role. User Role Customizable Permissions? Administrator No An account that manages SecurityCenter as a whole. The primary task of the Administrator is to install and configure each organization. In addition, the Administrator adds components to SecurityCenter such as NNM, LCE, and Nessus to extend its capabilities. The Administrator is automatically assigned the Manage Application role. Administrators do not have access to the data collected by SecurityCenter. Security Manager No An account that manages an individual organization. This is the role assigned to the initial user that is assigned when a new organization is created. They have the ability to launch scans, configure users (except for administrator user roles), vulnerability policies, and other objects belonging to their organization. A Security Manager is the account within an organization that has a broad range of security roles within the defined organization. This is the initial user that is created when a new organization is created and has the ability to launch scans, configure users (except for the Administrator user), vulnerability policies, and other objects that belong to their organization. This initial Security Manager account cannot be deleted without deleting the entire organization. Security Managers have complete access to all data collected by their organization
87 Auditor Yes An account that can access summary information to perform third party audits. An Auditor can view dashboards, reports, and logs, but cannot perform scans or analyze vulnerability or event data. Credential Manager Yes An account that can be used specifically for handling credentials. A Credential Manager can create and share credentials without revealing the contents of the credential. This can be used by someone outside the security team to keep scanning credentials up to date. Executive Yes An account intended for users who are interested in a highlevel overview of their security posture and risk profile. Executives would most likely browse dashboards and review reports, but would not be concerned with monitoring running scans or managing users. Executives would also be able to assign tasks to other users using the ticketing interface. Security Analyst Vulnerability Analyst Yes Yes An account that has permissions to perform all actions at the Organizational level except managing groups and users. A Security Analyst is most likely an advanced user who can be trusted with some system related tasks such as setting blackout windows or updating plugins. An account that can perform basic tasks within the application. A Vulnerability Analyst is allowed to view security data, perform scans, share objects, view logs, and work with tickets. No Role No An account with virtually no permissions. No Role is assigned to a user if their designated role is deleted. Custom Role Yes A custom role that you create by enabling or disabling individual permissions. Permissions Option General Name Custom role name Custom role description
88 Permissions Option Scan Permissions Create Scans Create Audit Files Create Policies Upload Nessus Scan Results Manage Blackout Windows Allows user to create policy-based scans. Disabling Create Policies while enabling this permission allows you to lock user into specific set of policies for scanning. Allows user to upload audit files, which can be used for configuration audit scans. Allows user to set scan parameters and select plugins for scanning Allows user to import results from an external Nessus scanner. Result upload will be limited to user s repositories and restricted by user s IP ranges. Allows user to add, edit, and delete organization-wide blackout windows. Blackout windows prevent scans from launching and stop any scans in progress. Asset Permissions Create LDAP Query Assets Allows user to create LDAP Query Assets, which update a list of hosts based on a user-defined LDAP query. Analysis Permissions Accept Risks Recast Risks Allows user to accept risks for vulnerabilities, which removes them from the default view for analysis, dashboards, and reports. Allows user to change the severity for vulnerabilities. Organizational Permissions Share Objects Between Groups View Organization Logs Allows user to share assets, audit files, credentials, queries, and policies with any group. Users in groups to which these objects have been shared will be able to use them for filtering and scan creation. Allows user to view logs for entire organization
89 Permissions Option User Permissions Manage Roles Manage Groups Manage Group Relationships Allows user to create new roles and edit and delete organizational roles. Any roles added must have permissions equal to or lesser than the user s role. Allows user to add, edit, and delete groups. Users with this permission are allowed to create groups with access to any vulnerability and event data available to the organization. Allows user to set other user s relationship with any other groups. Group relationships allow for a user to view and manage objects and users in other groups. Report Permissions Manage Images Manage Attribute Sets Allows user to upload images, which can be used in reports by anyone in the organization. Allows user to add, edit, and delete attribute sets. System Permissions Update Feeds Allows user to request a plugin update or a SecurityCenter feed update. Workflow Permissions Create Alerts Create Tickets Allows user to create alerts which are used to trigger actions (e.g., launch scans, run reports, send s) when specified vulnerability or event conditions occur. Allows user to create tickets, which are typically used to delegate work to other users
90 Create a User Role For more information about user role options, see User Roles. To create a custom user role: 1. Log in to SecurityCenter. 2. Click Users > Roles. 3. Click Add. 4. Type a Name. 5. Optionally, type a. 6. Set the Scanning Permissions, Asset Permissions, Analysis Permissions, Organization Permissions, User Permissions, Reporting Permissions, System Permissions, and Workflow Permissions. 7. Click Submit
91 Edit a User Role For more information about user role options, see User Roles. To edit the permissions of a custom or system-provided role: 1. Log in to SecurityCenter as an administrator user. 2. Click Users > Roles. 3. Click the gear icon next to the role you want to edit. 4. Click Edit. 5. Optionally, modify the Name and. 6. Modify the Scanning Permissions, Asset Permissions, Analysis Permissions, Organization Permissions, User Permissions, Reporting Permissions, System Permissions, and Workflow Permissions, as described in User Roles. 7. Click Submit
92 Delete a User Role To delete a custom or system-provided user role: Note: Deleting a role will cause all users with that role to lose all assigned permissions. 1. Log in to SecurityCenter as an administrator user. 2. Click Users > Roles. 3. Click the gear icon next to the role you want to delete. 4. Click Delete. The Delete Role confirmation window appears. 5. Click Delete
93 Organizations and Groups An organization is a set of distinct users and groups and the resources they have available to them. These users are assigned repositories and zones within one or more specified IP networks. Users refers to any non-administrator user account on SecurityCenter. Groups refers to collections of users with the same permissions within an organization. For more information, see Organizations and Groups
94 Organizations Multiple organizations can share the same repositories, and the vulnerability data associated with the overlapping ranges is shared between each organization. Conversely, organizations can be configured with their own discrete repositories to facilitate situations where data must be kept confidential between different organizational units. The organization is managed primarily by the administrator users and security manager users. The administrator user creates the organization and creates, assigns, and maintains the security manager user account. The security manager user (or any organizational user with appropriate permissions) creates other users within the organization. Groups allow you to manage users and share permissions to resources and objects among the group. It is important to consider these concepts when working with the built-in roles and creating custom ones as they relate to your organizational structure. Creation of an organization is a multi-step process. After you create an organization, SecurityCenter prompts you to create the initial security manager user. The following table describes the items that you can specify and configure when creating an organization. Option General Name Contact Information (Required) The organization name. A description for the organization. The relevant contact information for the organization including address, city, state, country, and phone number. Scanning Distribution Method There are three options to select for choosing a scan zone: Automatic Distribution Only automatically selects the best scan zone or zones available for performing a scan. Locked Zone only uses the selected scan zone as part of the organization s available scan zones for performing scans
95 Option Selectable Zones allows users to select from the chosen scan zones to perform a scan from. Additionally, automatic distribution may be allowed from the chosen zones so the user does not have to make assumptions as to which zone is free or optimal for their scan. Available Zones Restricted Scan Ranges If you select Locked Zone or Selectable Zone for the distribution method, the list of available zones appears. You can search for the zones by name or scroll through the list. IP ranges that the organization cannot scan. Analysis Accessible LCEs Accessible Repositories Accessible Agent Capable Scanners Accessible LDAP Servers The LCEs that you want this organization to have access to. You can search for the LCEs by name or scroll through the list. The repositories that you want this organization to have access to. You can search for the repositories by name or scroll through the list. The Nessus scanners (with Nessus Agents enabled) that you want this organization to have access to. Select one or more of the available scanners to allow the organization to import Nessus Agent results from the selected scanner. The LDAP servers that you want this organization to have access to. An organization must have access to an LDAP server in order to perform LDAP authentication on user accounts within that organization, and to configure LDAP query assets. Note: If you revoke access to an LDAP server, users in the organization cannot authenticate and LDAP query assets cannot run. Custom Analysis Links A list of custom analysis links provided to users within the host vulnerability details when analyzing data outside of SecurityCenter is desired. Click Add Custom Link to create a new option to type the link name and URL to look up additional data external to SecurityCenter. For example:
96 Option The %ip% reference is a variable that inserts the IP address of the current host into the specified URI. Vulnerability Weights Low Medium High Critical The vulnerability weighting to apply to Low criticality vulnerabilities for scoring purposes. (Default: 1) The vulnerability weighting to apply to Medium criticality vulnerabilities for scoring purposes. (Default: 3) The vulnerability weighting to apply to High criticality vulnerabilities for scoring purposes. (Default: 10) The vulnerability weighting to apply to Critical criticality vulnerabilities for scoring purposes.(default: 40) For more information, see Add an Organization and Delete an Organization
97 Add an Organization For more information about organization options, see Organizations. To add an organization: 1. Log in to SecurityCenter as an administrator user. 2. Click Organizations. 3. Click Add. 4. Configure the General, Scanning, Analysis, Custom Analysis Links, and Vulnerability Weights options. 5. Click Submit
98 Delete an Organization To delete an organization: Note: Deleting an organization deletes all of the users in that organization. 1. Log in to SecurityCenter as an administrator user. 2. Click Organizations. 3. Click the gear button next to the organization you want to delete. 4. Click Delete. The Delete Organization confirmation window appears. 5. Click Delete

99 Groups User groups are a way to group rights to objects within an organization, and then quickly assign these rights to one or more users. A user's group membership determines their access to security data. When a user creates various objects such as reports, scan policies, dashboards, and other similar items, these objects are automatically shared among the group members if the group permissions allow view and control. The following table describes the options to configure a group. Option General Name Viewable IPs Repositories LCEs The name for the group. A description of what the group is used for. E.g., security team at the central office, the executives on the east coast, and other desired information. The IP addresses that are viewable by the group. The selection is made by all defined assets or the selection of one or more asset lists. The repositories that are available to the group The LCEs that are assigned to the group Share to Group Available Objects The list of available objects to be shared with the group on creation or edit in a bulk operation. For more information, see Add a Group and Delete a Group
100 Add a Group For more information about group options, see Groups. To add a group: 1. Log in to SecurityCenter as an organizational user with appropriate permissions. For more information, see User Roles. 2. Click Users > Groups. 3. Click Add. 4. Configure the General options and Share to Group options. 5. Click Submit
101 Delete a Group To delete a group: 1. Log in to SecurityCenter as an organizational user with appropriate permissions. For more information, see User Roles. 2. Click Users > Groups. 3. Click the gear button next to the group you want to delete. 4. Click Delete. The Delete Group confirmation window appears. 5. Click Delete

102 User Accounts Path: Users > Users The Users page displays the user accounts on SecurityCenter, limited by your account privileges. You can sort the columns or apply filters to locate specific user accounts. You can also Add a User or Delete a User. You can create one or more administrator accounts on SecurityCenter. You can create one or more organizational users (security managers and/or custom roles) per organization. Tenable recommends you make at least one TNS-authenticated administrator and security manager user per organization. If the LDAP service becomes unavailable, you can still log in. User Account Options
103 When adding a new user, your role determines the options you see on the Add User page
104 Option Role The role assigned to the user. For more information, see User Roles. Administrator users can create Administrator or Security Manager user accounts. Organizational users can create Auditor, Credential Manager, Executive, No Role, Security Analyst, Security Manager, or Vulnerability Analyst accounts at their own privilege level or lower. For example: If a user is an Auditor, they can create new Auditors or lesser roles. If a custom user has the Create Policies privilege but not the Update Feeds privilege, that user can create users with the Create Policies privilege, but not the Update Feeds privilege. Group Organization First Name / Last Name Username / Password (TNS only) The group where you want to assign the user account. A user's group determines their access to SecurityCenter resources. The organization where you want to assign the user account. (Optional) The given first name and last name for the user. The username and password for the user account. When selecting a username, it is sometimes easier to focus on the person s real name as a convention (e.g., Bob Smith would become bsmith). However, it may also be useful to assign names based on role, such as auditny. Note: The username value is case-sensitive
105 Option Tip:Tenable recommends using passwords that meet stringent length and complexity requirements. Type The type of authentication you want to perform on the user: Tenable Network Security (TNS) Lightweight Directory Access Protocol (LDAP) If you have not configured an LDAP server within your organization, the Type option is hidden and TNS authentication is performed. User Must Change Password (TNS only) LDAP Server (LDAP only) Search String (LDAP only) When enabled, the user must change their password upon initial login. The server you want to use to authenticate the user. The LDAP search string you want to use to filter your user search. Use the format: attribute=<filter text>. You can use wildcards, and the option accepts up to 1024 characters. Examples samaccountname=* mail=a* displayname=c* LDAP Users Found (LDAPonly) Username (LDAP-only) A filtered list of LDAP user accounts retrieved by the Search String. Your selection in this option populates the Username option. The username, populated by your LDAP Users Found selection. This username must match a user on the LDAP
106 Option server in order to authenticate successfully. Time Zone Enable Cached Fetching Group The time zone for the user. (Optional) When enabled, SecurityCenter caches plugin policy information and performs plugin policy downloads once per page load. This sets the default permissions the user has assigned when you add the user to a new group. If both Manage Objects and Manage Users are enabled, the user has those permissions for all subsequent groups to which the user is assigned. If one or both are disabled, each subsequent new group has those permissions by default, and you may modify the permissions on a group by group basis. Asset Contact Information (Optional) Assigns a user to an asset list for which the user is responsible. Assigning a user to an asset list makes it easier to determine who in a group or organization should be assigned tickets, notifications, and other tasks to resolve particular issues. Selecting an asset updates the User Responsibility Summary in the Vulnerability Analysis section. (Optional) The contact information for the user
107 Add a User Path: Users > Users The Add User page requires different information depending on your role and your selection for the Type option. For more information about individual user account configuration options, see User Accounts. To add a TNS-authenticated user account as an administrator user: 1. Log in to SecurityCenter as an administrator user. 2. Click Users > Users. 3. Click Add. 4. Select a Role. 5. If you selected Security Manager as the Role, select an Organization. 6. (Optional) Type a First Name and Last Name. 7. Type a Username and Password for the user. 8. If the Type option is visible, select TNS. 9. (Optional) Enable User Must Change Password. 10. Select a Time Zone. 11. (Optional) Enable Enable Cached Fetching. 12. (Optional) Type Contact Information for the user. 13. Click Submit. To add an LDAP-authenticated user account as an administrator user: 1. Log in to SecurityCenter as an administrator user. 2. Configure an LDAP server, as described in LDAP Servers. If you want the new user to be a member of an organization, associate the LDAP server with an organization. 3. Click Users > Users. 4. Click Add
108 5. Select a Role for the user account. 6. If you selected Security Manager as the Role, select an Organization for the user account. You must select an organization with an associated LDAP server. 7. (Optional) Type a First Name and Last Name for the user. 8. Select a Type: LDAP. 9. Select the LDAP Server where you want to authenticate the user. 10. Type a Search String to find existing users on the LDAP server. 11. Click Search. The page displays the LDAP Users Found by the LDAP search string. 12. Select an LDAP user from the LDAP Users Found drop-down box. The page populates the Username option with your selection. 13. View the Username. Tenable does not recommend modifying the Username since it must match the username on the LDAP server. 14. Select a Time Zone. 15. (Optional) Enable Enable Cached Fetching. 16. (Optional) Type Contact Information for the user. 17. Click Submit. To add a TNS-authenticated user account as an organizational user 1. Log in to SecurityCenter as an organizational user with appropriate permissions. For more information, see User Roles. 2. Click Users > Users. 3. Click Add. 4. (Optional) Type a First Name and Last Name for the user. 5. If the Type option is visible, select TNS. 6. Type a Username and Password for the user. 7. (Optional) Enable User Must Change Password
109 8. Select a Time Zone. 9. (Optional) Enable Enable Cached Fetching. 10. Select a Role. For more information, see User Roles. 11. Select a Group. For more information, see Organizations and Groups. 12. (Optional) If you want to customize the group-related permissions for the user, modify the Group Permissions as described in Custom Group Permissions. 13. (Optional) If you want to share an asset list with the user, select an Asset. For more information, see Assets. 14. (Optional) Type Contact Information for the user. 15. Click Submit. To add an LDAP-authenticated user account as an organizational user: 1. Log in to SecurityCenter as an organizational user with appropriate permissions. For more information, see User Roles. 2. Confirm that an administrator user configured an LDAP server, and that the LDAP server was associated with the organization where you want to create a user account. 3. Click Users > Users. 4. Click Add. 5. (Optional) Type a First Name and Last Name for the user. 6. If the Type option is visible, select LDAP. 7. Select the LDAP Server where you want to authenticate the user. 8. Select an LDAP user from the LDAP Users Found drop-down box. The page populates the Username option with your selection. 9. View the Username. Tenable does not recommend modifying the Username since it must match the username on the LDAP server. 10. Select a Time Zone. 11. (Optional) Enable Enable Cached Fetching. 12. Select a Role. For more information, see User Roles
110 13. Select a Group. For more information, see Organizations and Groups. 14. (Optional) If you want to customize the group-related permissions for the user, modify the Group Permissions as described in Custom Group Permissions. 15. (Optional) If you want to share an asset list with the user, select an Asset. For more information, see Assets. 16. (Optional) Type Contact Information for the user. 17. Click Submit
111 Custom Group Permissions Path: Users > Users If you want to customize a user's Role or Group permissions, you can modify the advanced settings in the Group Permissions section. By default, the Group Permissions section shows all settings enabled. The Manage All Users and Manage All Objects sliders bulk enable or disable the settings in the User Permission and Object Permission columns, respectively. You can use the check boxes in each group row to disable the settings at your preferred granularity and restrict the user's ability to view and manage the users and objects within specific groups. Optionally, use the Search Groups box to filter the group rows that display on the page. For more information about organizations and groups, see Organizations and Groups
112 Delete a User Path: Users > Users If you want to migrate a user's objects, you must use a Security Manager account in the user's organization to delete the user. To delete a user: 1. Log in to SecurityCenter. 2. Click Users > Users. 3. Click the gear icon next to the user you want to delete. 4. Click Delete. The Delete User confirmation window appears. 5. Optionally, if you are a Security Manager in the user's organization and you want to migrate the user's objects, click the slider to migrate the user's objects (e.g., scans and reports) to another user. If you do not migrate the user's objects, SecurityCenter deletes the user's objects. 6. Click Delete
113 Manage Your Account The Username menu in the top navigation bar contains pages to manage your user account. Note: Depending on the screen resolution, the username may be omitted and only a user icon appears. About Path: Username > About The About menu item displays the SecurityCenter version, Server Build ID, and copyright information. System Logs (Organizational Users Only) Path: Username > System Logs For a complete discussion about system logs, see System Logs Settings. Profile (Organizational Users Only) Path: Username > Profile The Profile option launches the Edit User Profile page, where you can modify some of your user account information and permissions. For more information about user account options, see User Accounts. Feeds (Organizational Users Only) Path: Username > Feeds The Feeds option displays information about the SecurityCenter feeds and plugin sets and, if permitted, a link to update the plugins either through SecurityCenter or by manually uploading plugins. The displayed feeds are for SecurityCenter Feed, Active Plugins, Passive Plugins, and Event Plugins. Only feeds with valid Activation Codes are updatable. Plugins are scripts used by the Nessus, NNM, and LCE servers to interpret vulnerability data. For ease of operation, Nessus and NNM plugins are managed centrally by SecurityCenter and pushed out to their respective scanners. LCE servers download their own event plugins and SecurityCenter downloads event plugins for its local reference. SecurityCenter does not currently push event plugins to LCE servers
114 For more information about plugin/feed settings, see Configuration Settings and Edit Plugin and Feed Schedules. Notifications Path: Username > Notifications Notifications are a feature of SecurityCenter that allow specified events to display a pop-up in the lower right-hand corner of the SecurityCenter user interface. Current notifications can be viewed by clicking on the notifications menu item. Plugins Path: Username > Plugins Plugins are scripts used by the Nessus, NNM, and LCE servers to interpret vulnerability data. For ease of operation, Nessus and NNM plugins are managed centrally by SecurityCenter and pushed out to their respective scanners. LCE servers download their own event plugins and SecurityCenter downloads event plugins for its local reference. SecurityCenter does not currently push event plugins to LCE servers. Within the Plugins interface, click the information icon next to the Plugin ID and search for specific plugins utilizing the filtering tools to view plugin details/source. For more information about plugin/feed settings, see Configuration Settings. For more information about uploading custom plugins, see Upload a Custom CA Certificate. Help Path: Username > Help The Help option displays limited documentation for SecurityCenter. For complete information, see Logout Path: Username > Logout Click Username > Logout to end your session in SecurityCenter. Tenable recommends closing your browser window after logging out
115 Repositories Path: Repositories Repositories are databases within SecurityCenter that contain vulnerability data. You can share repositories with users and organizations based on admin-defined assets. Repositories provide scalable and configurable data storage. Optionally, you can share repository data between multiple SecurityCenters. Note: The maximum repository size is 32 GB. When adding local repositories, you define the vulnerability data for each repository as one or more ranges of IP addresses or mobile data types. Scanners attached to a SecurityCenter populate the local repository with vulnerability data. When adding external repositories, you select previously added local repositories from other SecurityCenters. The remote SecurityCenter synchronizes with your SecurityCenter to populate the external repository with vulnerability data. You can also use external repositories to manually import repository data from an off-network SecurityCenter. External repository data is static and used solely for reporting purposes. Caution: When creating SecurityCenter IPv4 or IPv6 repositories, LCE event source IP ranges must be included along with the vulnerability IP ranges or the event data and event vulnerabilities are not accessible from the SecurityCenter UI
116 Click the Add button to add a new repository. For more information, see Local Repositories and External Repositories
117 Local Repositories SecurityCenter supports two types of local repositories: IPv4/IPv6 Repositories and Mobile Repositories. For general information about repositories, see Repositories. IPv4/IPv6 Repositories These are the most common types of repositories used with SecurityCenter. They store IPv4 and IPv6 data from active and passive scans. Data stored in local repositories can be shared between organizations and includes the full range of event and vulnerability metadata. Option General Name A name for the repository. (Optional) A description for the repository. Data IP Ranges Allowed ranges for importing vulnerability data. Addresses may be a single IP address, IP range, CIDR block, or any comma-delimited combination. Access Organizations Specifies which organizations have access to the vulnerability data stored in the repository. If groups are configured for the organization, SecurityCenter prompts you to grant or deny access to all of the groups in the organization. For more granular control, grant access within the settings for that group. Advanced Settings Generate Trend Data When enabled, SecurityCenter takes periodic snapshots of.nessus data for vulnerability trending purposes. Trend data appears in queries that compare repository snapshots (e.g., trending line charts). Note: Disable this option to reduce your disk space usage
118 Option Days Trending Enable Full Text Search LCE Correlation Sets the number of days for the trending data to track. Determines if the trending data presented is indexed for a full text search. Log Correlation Engine servers that receive the vulnerability correlation information from this repository. Mobile Repositories The Mobile repository is a local type that stores data from various MDM servers. The MDM servers currently supported include ActiveSync, AirWatch MDM, Apple Profile Manager, Good MDM, and MobileIron. Option General Name A name for the repository. Descriptive text for the repository. MDM Type This setting determines if the repository stores ActiveSync, AirWatch MDM, Apple Profile Manager, Good, or MobileIron types of mobile data. The authentication settings available vary depending on the type selected. Scanner Schedule This setting determines which Nessus scanner is used when scanning the MDM server. Only one Nessus scanner may be used to add data to the mobile repository. Sets the schedule for the MDM server to be scanned to update the Mobile repository. On each scan, the current data in the repository is removed and replaced with the information from the latest scan. Access Organizations Specifies which organizations have access to the vulnerability data stored in the repository
119 Option If groups are configured for the organization, SecurityCenter prompts you to grant or deny access to all of the groups in the organization. For more granular control, grant access within the settings for that group
120 External Repositories SecurityCenter supports two types of external repositories: Remote Repositories and Offline Repositories. You can configure external repositories to access repositories on other SecurityCenters running version or later. Repository data from an external repository is static and used solely for reporting purposes. For general information about repositories, see Repositories. Remote Repositories Remote repositories allow multiple SecurityCenters to share repository data via a SSH session. Option General Name The repository name. Descriptive text for the repository. Remote SecurityCenter Host Repository Schedule Host to synchronize with to obtain the repository data. After entering the IP address of the remote SecurityCenter, click the Request Repositories link to type an administrator's username and password for the SecurityCenter to exchange the SSH keys. Once completed, a list of available repositories is populated. Remote repository to collect IP address(es) and vulnerability data from. This is a list of the available repository names available on the remote SecurityCenter. Sets the schedule for the remote server to be queried for updated information. Access Organizations Specifies which organizations have access to the vulnerability data stored in the repository. If groups are configured for the organization, SecurityCenter prompts you to grant or deny access to all of the groups in the organization. For more granular control, grant access within the settings for that group
121 Offline Repositories Remote repositories allow multiple SecurityCenters to share repository data via manual data synchronization using a.tar.gz archive file. Option General Name The repository name Descriptive text for the repository Access Organizations Specifies which organizations have access to the vulnerability data stored in the repository. If groups are configured for the organization, SecurityCenter prompts you to grant or deny access to all of the groups in the organization. For more granular control, grant access within the settings for that group. Advanced Settings Generate Trend Data When enabled, SecurityCenter takes periodic snapshots of.nessus data for vulnerability trending purposes. Trend data appears in queries that compare repository snapshots (e.g., trending line charts). Note: Disable this option to reduce your disk space usage. Days Trending Enable Full Text Search Sets the number of days for the trending data to track. Determines if the trending data presented is indexed for a full text search. To initiate offline repository synchronization, first click on the Export link from the gear icon dropdown menu to download the repository archive from an existing repository. Depending on browser choice, the browser presents the option to open or save the Nessus or Compressed Tar file. It is recommended that the file be saved at this time. Tip: Depending on the size of the repository database, this file can be quite large. It is important to save the file to a location with sufficient free disk space
122 Tip: When importing the repository archive, the default maximum file import size is 360MB. This is specified by the post_max_size directive in /opt/sc/support/etc/php.ini. If larger file uploads are required, increase the default value. To load the repository archive to the offline repository, copy it to a location where the offline repository is accessible via the SecurityCenter GUI, open the Repositories page, highlight the offline repository, and click Upload from the gear icon drop-down menu. On the Upload page, add a name and description for the repository. Next to Repository Data, click Choose File and select the file to add to the previously exported repository
123 Scans There are four basic methods of scanning: active vulnerability scanning, active credentialed vulnerability scanning, agent scanning, and continuous passive discovery scanning via NNM. Using all four types provides a comprehensive view of the organization s security posture and reduces false positives. Scan Type active scanning In active vulnerability scanning, the Nessus scanner sends packets to a remote target to provide a snapshot of network services and applications. These are compared to a plugin database to determine if any vulnerabilities are present. SecurityCenter can also use a Nessus scanner located outside the local network to simulate what an external entity might see. For more information, see Active Scans. active credentialed scanning Nessus credentialed scans can be leveraged to perform highly accurate and rapid patch, configuration, and vulnerability audits on Unix, Windows, Cisco, and database systems by actually logging in to the target system with provided credentials. Credentialed scans can also enable the ability to enumerate all UDP and TCP ports in just a few seconds. SecurityCenter can securely manage these credentials across thousands of different systems and also share the results of these audits only with users who have a need to know. Note: For more information on Nessus credentialed scanning, please refer to the Nessus Documentation. For more information, see Active Scans. agent scanning Agent scan results are imported from Tenable.io or Nessus Manager scanners. Utilizing Nessus agents for scanning reduces network usage and allows for devices such as laptops to maintain scan schedules even when disconnected from the network. SecurityCenter can import these results for review in conjunction with other acquired information about the host and network. For more information, see Agent Scans. continuous passive discovery scan- SecurityCenter can manage one or more Tenable Nessus Network Monitor (NNM) scanners. NNM provides continuous discovery of new hosts, new applications, and new vulnerabilities. It runs 24x7 and discovers highly accurate client and server vul
124 ning nerability information. SecurityCenter fuses this information with the active or credentialed scan results from Nessus. for more information, see Nessus Network Monitor (PVS). Scan Objects Complete SecurityCenter scan configurations rely on the following scan objects. Scan Object assets SecurityCenter assets are lists of devices (e.g., laptops, servers, tablets, phones, etc.) within a SecurityCenter organization. Assets can be shared with one or more users based on local security policy requirements. You can add an asset to group devices that share common attributes. Then, you can use the asset during scan configuration to target the devices in the asset. For more information, see Assets. audit files During a configuration audit, auditors verify that servers and devices are configured according to an established standard and maintained with an appropriate procedure. SecurityCenter can perform configuration audits on key assets through the use of Nessus local checks that can log directly onto a Unix or Windows server without an agent. SecurityCenter supports a variety of audit standards. Some of these come from best practice centers like the PCI Security Standards Council and the Center for Internet Security (CIS). Some of these are based on Tenable s interpretation of audit requirements to comply with specific industry standards such as PCI DSS or legislation such as Sarbanes-Oxley. In addition to base audits, it is easy to create customized audits for the particular requirements of any organization. These customized audits can be loaded into the SecurityCenter and made available to anyone performing configuration audits within an organization. NIST SCAP files can be uploaded and used in the same manner as an audit file. Navigate to NIST s SCAP website ( and under the SCAP Content section, download the desired SCAP security checklist zip file. The file may then be uploaded to SecurityCenter and selected for use in Nessus scan jobs
125 Once the audit policies are configured in SecurityCenter, they can be repeatedly used. SecurityCenter can also perform audits intended for specific assets. Through the use of audit policies and asset lists, a SecurityCenter user can quickly determine the compliance posture for any specified asset. For more information, see Audit Files. credentials Credentials are reusable objects that facilitate a login to a scan target. Various types of credentials with different authentication methods can be configured for use within scan policies. Credentials may be shared between users for scanning purposes. Available credential types include: Windows SSH SNMP community string Database SecurityCenter supports an unlimited number of SSH, Windows, and database credentials, and four SNMP credential sets per scan configuration. For more information, see Credentials. scan policies Scan policies consist of configuration options related to performing an active vulnerability scan. These options include, but are not limited to: Parameters that control technical aspects of the scan such as timeouts, number of hosts, type of port scanner, and more. Granular plugin family or individual plugin based scan specifications. Compliance policy checks (Windows, Linux, Database, etc.), report verbosity, service detection scan settings, audit files, patch management systems, and more. For more information, see Scan Policies
126 Active Scans Path: Scans > Active Scans The Active Scans page displays a list of all available Nessus active scans. Click the gear icon drop-down menu to perform basic scan management tasks: View view details about the active scan. Edit edit settings for the active scan. Copy copy settings for the active scan and create a second, identical scan. Run Diagnostic Scan run a separate diagnostic scan for troubleshooting. For more information, see Diagnostic Scans. Delete delete the active scan. Authorized users can create an active scan, as described in Add an Active Scan. To run a scan outside of the scheduled window or to pause a running scan, see Start or Pause a Scan. Newly created active scans are shared to everyone within the same user group when users have the appropriate permissions
127 Tip: If you want to launch an active scan to remediate a vulnerability from the Vulnerability Analysis page, see Launch a Remediation Scan. General Options Parameter General Name Policy The scan name that is associated with the scan s results and may be any name or phrase (e.g., SystemA, DMZ Scan, Daily Scan of the Web Farm, etc.). Descriptive information related to the scan. The policy on which you want to base the scan. You can scroll through the list, or search by entering text in the search box at the top of the list of available policies. Schedule Schedule The frequency you want to run the scan: Now, Once, Daily, Weekly, Monthly, On Demand, or Dependent. The On Demand selection allows you to create a scan template that you can launch manually at any time. The Dependent selection enables you to schedule the scan after the completion of a scan you select from the drop-down box. The other time frames allow you to launch scans at specified times and intervals, depending upon configuration. Settings Options Parameter Basic Scan Zone If you set Scan Zone to Selectable for the user, a drop-down box appears that allows you to select the scan zone to be used for the scan. If you select Automatic Distribution, the Scan Zone that most closely matches the host or range of hosts to be scanned is selected from the zones available. Otherwise, you can select a specific scan zone from the drop-down box and search using the text search box. When you hover over a scan zone, the information icon appears. When you select this icon, the name, description, and last modified date appear. When you set Scan Zone to forced for the user, the Scan Zone box cannot be
128 Parameter modified. Import Repository Scan Timeout Action Specifies the repository where the scan results are imported. Select a repository to receive IPv4 or IPv6 results appropriate to the scan. The action you want SecurityCenter to perform in the event a scan is incomplete: Import Completed Results With Rollover (Default option) The system imports the results from the scan into the database and creates a rollover scan that you can launch at a later time to complete the scan. Import Completed Results The system imports the results of the current scan and discards the information for the unscanned hosts. Discard Results The system does not import any of the results obtained by the scan to the database. Rollover Schedule If you set the Scan Timeout Action to Import results with Rollover, this option specifies how to handle the rollover scan. You can create the rollover scan as a template to launch manually, or to launch the next day at the same start time as the just-completed scan. Advanced Scan Virtual Hosts Specifies whether the system treats a new DNS entry for an IP address as a virtual host as opposed to a DNS name update. When a new DNS name is found for an IP address: If you select this option, vulnerability data for the two DNS names appears as two entries with the same IP address in the IP Summary analysis tool. If you do not select this option, vulnerability data for the two DNS names merge into a single IP address entry in the IP Summary analysis tool. Track hosts which have been issued new IP address Specifies whether the system uses the DNS name, NetBIOS name, and MAC address (if known), in that order, of the computer to track it when the IP address of the computer may have changed. Once a match is made, SecurityCenter does not search further for matches. For example, if a DNS name is not matched, but a NetBIOS name is, the system does not check the MAC address. Networks using DHCP require that you set this option to properly track hosts
129 Parameter Immediately remove vulnerabilities from scanned hosts that do not reply Number of days to wait before removing dead hosts Max scan duration (hours) If a previously responsive host does not reply to a scan, the system automatically removes vulnerabilities related to that host from the cumulative database. If you enable this option, the system removes the vulnerabilities immediately. If you disable this option, the system removes the vulnerabilities according to the interval set in the Number of days to wait before removing dead hosts option. Specifies how many days the system waits to remove vulnerabilities from the cumulative database when previously responsive hosts do not reply to a scan. This option only shows if you disable the Immediately remove vulnerabilities from scanned hosts that do not reply option. Specifies the number of hours after which the scan stops running. Targets Options The Targets section identifies the devices to be scanned. The drop-down box for Target Type contains the following options: Assets A list of available assets appears, and one or more asset might be selected. You can search the assets using the search box above the list. IP / DNS Name A box appears, listing DNS names and/or IP addresses in individual, CIDR, or range notation. Mixed You can use a combination of asset lists and IP/DNS names. Valid Formats: A single IP address (e.g., ), (The proper ways to specify IPs in SC are <fullip>-<fullip> (range), <fullip>/<bits> (CIDR), or <fullip>) An IP range (e.g., ) A subnet with CIDR notation (e.g., /24) A resolvable host (e.g., A resolvable host with subnet (
130 A resolvable host with CIDR notation ( A single IPv6 address (e.g., 2001:DB8:1234:1234/32) Note: You cannot scan both IPv4 and IPv6 addresses in the same scan, because you can only select one Import Repository. Credentials Options The Credentials section allows users to select pre-configured credential sets for authenticated scanning. SecurityCenter supports the use of an unlimited number of Windows credential sets, four SNMP credential sets, an unlimited number of SSH credential set, and Database credential set. Click the type of scan credential to add to the scan from the drop-down box. Then click the specific credential to add from the list by clicking the name. You can search the credentials using the text search option. Only credentials that match the type selected appear. When you hover over a credential, the information icon appears, which displays information about the credential such as the name, description, type, and owner. After you select the credential, click the check mark to add it to the scan template. Clicking the X removes the credential from the list of added credentials. As you add credentials, the You may add <number> more credential message updates to display how many more of that type you can use in the current scan. Once you have added the maximum of a type, that credential type no longer appears in the type menu until you remove at least one of the previously used credentials of that type. For more information, see Credentials. Post Scan Options These options determine what actions occur immediately before and after the active scan completes. Option Notifications
131 Option me on Launch me on Completion This option specifies whether the system s you a notification when the scan launches. This option only appears if you set an address for your user account. This option specifies whether the system s you a notification when the scan completes. This option only appears if you set an address for your user account. Reports to Run on Scan Completion Add Report This option provides a list of reports available to the user to run when the scan completes. The initial choices to select a report are to click the group and owner of the report to present a list of valid report options. Then click the report from the list that can be searched using the text search box. When hovering over a report name, you can select the information icon to display the name and description of the report. The report generated is based on the current scan s results or the results in the Cumulative database. Selecting the check mark causes that report to launch once the scan completes. Selecting the X removes the changes. Once added, you can modify or delete the report information. Diagnostic Scans If you experience issues with an active scan, Tenable Support may ask you to run a diagnostic scan to assist with troubleshooting. After SecurityCenter runs the diagnostic scan, download the diagnostic file and send it to Tenable Support. For more information, see Run a Diagnostic Scan
132 Add an Active Scan For more information about active scan options, see Active Scans. Before You Begin Confirm you meet the version requirements specified in Tenable Integrated Product Compatibility. To add an active scan: 1. Log in to SecurityCenter as an organizational user with appropriate permissions. For more information, see User Roles. 2. Click Scans > Active Scans. The Active Scans page appears. 3. Click Add. The Add Active Scan page appears. 4. In the General section: 1. Type a Name for the scan. 2. (Optional) Type a for the scan
133 3. Select a Policy for the scan. 4. (Optional) Select a Schedule for the scan. 5. In the Settings section: 1. If prompted, select a Scan Zone for the scan. 2. Select an Import Repository for the scan. 3. Select a Scan Timeout Action for the scan. 4. Select a Rollover Schedule for the scan. 5. Enable or disable the Advanced options. 6. In the Targets section: 1. Select a Target Type for the scan. The page updates to show the required options for that target type. 2. Select one or more Assets and/or IPs / DNS Names for the scan. 7. (Optional) In the Credentials section, if you want to configure credentialed scanning, click Add Credential. 8. In the Post Scan section: 1. (Optional) If you previously added an address to your account profile and you want to configure notifications, enable or disable Me on Launch or Me on Completion. 2. (Optional) If you want to configure automatic report generation, click Add Report. For more information, see Add a Report to a Scan. 9. Click Submit
134 Start or Pause a Scan To start or pause an active or agent scan: 1. Log in to SecurityCenter. 2. Click Scans > Active Scans (to manage active scans) or Scans > Agent Scans (to manage agent scans) or Scans > Scan Results (to manage a scan from the results page). 3. If you want to pause the scan, click the pause button on the right side of the scan row. 4. If you want to start the scan, click the start button on the right side of the scan row
135 Run a Diagnostic Scan If you experience issues with an active scan, Tenable Support may ask you to run a diagnostic scan to assist with troubleshooting. After SecurityCenter runs the diagnostic scan, download the diagnostic file and send it to Tenable Support. Before You Begin Confirm you meet the version requirements specified in Tenable Integrated Product Compatibility. To run a diagnostic scan: 1. Click Scans > Active Scans. 2. Locate the scan and click the gear icon drop-down menu. 3. Click Run Diagnostic Scan. Note: You must resolve repository errors before running diagnostic scan. 4. Type a Diagnostic Target, the IP address for a target in the scan's policy. 5. Type a Diagnostic Password to secure the diagnostic file. 6. Click Submit. The diagnostic scan runs and finishes. 7. Click Scans > Scan Results. 8. Locate the diagnostic scan and confirm that the scan finished without errors. 9. Click the gear icon drop-down menu. 10. Click Download Diagnostic Info. The diagnostic scan file downloads
136 Agent Scans Path: Scans > Agent Scans The Agent Scans page displays a list of all available agent scans. Click the gear icon drop-down menu to perform basic scan management tasks: View view details about the agent scan. Edit edit settings for the agent scan. Copy copy settings for the agent scan and create a second, identical scan. Delete delete the agent scan. Authorized users can create an import schedule for agent-based scans, as described in Add an Agent Scan. Newly created agent scan import schedules are shared to everyone within the same user group when users have the appropriate permissions. To run a scan outside of the scheduled window or to pause a running scan, see Start or Pause a Scan. When more than one Agent scan result is ready on Tenable.io or Nessus Manager, all of the scan results import. General Options The table below describes options available on the General tab. Parameter General Name Agent Scanner Agent Scan Name Filter The scan name associated with the scan s results. This may be any name or phrase (e.g., SystemA, DMZ Scan, Daily Scan of the Web Farm, etc.). Descriptive information related to the scan. The Agent-enabled scanner from which to retrieve agent results. A filter for agent scan results to retrieve from the Nessus Agent enabled scanner. Filters can use the specific name of the result(s) to retrieve or an asterisk (*) or question mark (?) for all or part of the scan result name(s) to retrieve. You can find the
137 Parameter available Agent Scans retrieved from the selected scanner on the Scan page of the user logged in to the Nessus server. If the agent scan retrieves results that match the filter, they appear when you click the Preview Filter button. If the agent scan does not retrieve results, the filter matches once the results are available. Schedule Schedule The frequency you want to run the scan: selecting Now, Once, Daily, Weekly, Monthly, On Demand, or Dependent allows you to create an agent scan retrieval template that you can launch manually at any time. The other time frames allow you to retrieve scans at specified times and intervals. You should retrieve agent scan results as close to the completion time of the scan as possible to most accurately display within SecurityCenter when the scan discovered the vulnerability results. Basic Scan Options Parameter Basic Import Repository Specifies the repository where you want the agent scan results to import. Select a repository to receive IPv4 or IPv6 results appropriate to the imported scan. Advanced Track hosts which have been issued new IP address This option uses the DNS name, NetBIOS name, and MAC address (if known), in that order, to track a host when its IP address changes. Once a match has been made, SecurityCenter does not search further for matches. For example, if SecurityCenter does not match a DNS name, but it does match a NetBIOS name, the system does not check the MAC address. Networks using DHCP require that you set this option to properly track hosts. Running a Scan The scan distribution of a running scan consists of the following:
138 The number of targets (IPs/DNS names) in the scan. The number of completed scans across all scanners (at the current instance). The number of scans completed by each scanner used in the scan (at the current instance). The counts update on a heartbeat while being viewed. The scan transitions to completed once all scans stop. Post Scan These options determine what actions occurs immediately before and after the agent scan completes. The table below describes the post scan options available to users: Option Reports to Run on Scan Completion Add Report This option provides a list of reports available to the user to run when the agent scan data import completes. The initial choices are to click the group and owner of the report to present a list of valid report options. Next, click the report from the list that can be searched using the text search box. When hovering over a report name, you can select the information icon to display the name and description of the report. You can base the generated report on the current scan s results or the results in the Cumulative database. Selecting the check mark causes the report to launch once the scan completes. Selecting the X removes the changes. Once added, you can modify or delete the report information
139 Add an Agent Scan For more information about active scan options, see Agent Scans. To add an agent scan: 1. Log in to SecurityCenter as an organizational user with appropriate permissions. For more information, see User Roles. 2. Click Scans > Agent Scans. The Agent Scans page appears. 3. Click Add. The Add Agent Scan page appears. 4. In the General section: 1. Type a Name for the scan. 2. (Optional) Type a for the scan. 3. Select an Agent Scanner
140 4. Type an Agent Scan Name Filter. 5. (Optional) Select a Schedule for the scan. 5. In the Settings section: 1. Select an Import Repository for the scan. 2. Enable or disable Track hosts which have been issued new IP address. 6. (Optional) In the Post Scan section: If you want to configure automatic report generation, click Add Report. For more information, see Add a Report to a Scan. If you previously added an address to your account profile and you want to configure notifications, enable or disable Me on Launch or Me on Completion. 7. Click Submit
141 Start or Pause a Scan To start or pause an active or agent scan: 1. Log in to SecurityCenter. 2. Click Scans > Active Scans (to manage active scans) or Scans > Agent Scans (to manage agent scans) or Scans > Scan Results (to manage a scan from the results page). 3. If you want to pause the scan, click the pause button on the right side of the scan row. 4. If you want to start the scan, click the start button on the right side of the scan row
142 Scan Results Path: Scans > Scan Results The Scan Results page allows you to manage individual sets of scan results from active and agent scans (running, completed, or failed) run by SecurityCenter. Results appear in a list view, and you can drill down into individual scan details. For more information, see Manage Scan Results and Upload Scan Results
143 Manage Scan Results Depending on the state of a scan result, you can perform different management actions (e.g., you cannot download results for a scan with errors). For more information, see Scan Results. To manage scan results: 1. Log in to SecurityCenter as an organizational user with appropriate permissions. For more information, see User Roles. 2. Click Scans > Scan Results. The Scan Results page appears. 3. Manage the results: To filter the scan results, click the filter icon. Filters allow you to view only desired scan results. Filter parameters include the Name, Group, Owner, Scan Policy, Status, Completion Time, Access, and Type. To remove all filters, click Clear Filters under the filter options. The number in grey next to the filter displays how many filters are currently in use. To view a set of scan results, click the gear icon menu in the row for the scan and select Browse. The Vulnerability Summary analysis tool appears, populated with data from the scan. To view scan result details for a set of scan results, click the gear icon menu in the row for the scan and select View. The details page appears. To download the results of a scan, click the gear icon menu in the row for the scan and select Download. On a standard scan, you can download a Nessus results file. If the scan contains SCAP results, you can use an additional option to download the SCAP results. To manually import scans listed on the scan results page, click the gear icon in the row for the scan and select Import
144 This option is useful for cases where a scan may have not fully imported after completion. For example, if a scan was blocked because importing it would have exceeded the licensed IP count, you can increase the IP count, then import the scan results previously not imported. To share scan results with other users, click the gear icon in the row for the scan and select Copy. Selecting a Group from the drop-down box displays a list of users from that group. You can select one or more users from the list. To send a copy of the scan results to users without access to SecurityCenter, click the gear icon in the row for the scan and select . To generate a report for the scan results based off a preconfigured report, click the gear icon in the row for the scan and select Send to Report. To upload Nessus scan results performed by other systems, see Upload Scan Results. To pause or resume a running scan, click the pause or play button in the row for the scan, as described in Start or Pause a Scan. To delete a set of scan results from SecurityCenter, click the gear icon in the row for the scan and select Delete
145 Upload Scan Results In addition, you can upload Nessus scan results from scans performed by other systems. SecurityCenter supports either raw (.nessus) or compressed (.zip) files, with one.nessus file per archive before uploading. This allows you to import scan results from scans run in remote locations without network connectivity to SecurityCenter. To upload files greater than 300 MB, you must modify upload_max_filesize in /opt/sc/support/etc/php.ini to accommodate the larger uploads. To upload scan results: 1. Log in to SecurityCenter as an organizational user with appropriate permissions. For more information, see User Roles. 2. Click Scans > Scan Results. 3. Click Upload Scan Results. 4. In the Scan File option, click Choose File. The file uploads to SecurityCenter. 5. In the Import Repository drop-down box, select a repository. 6. Enable or disable the Advanced options. 7. Click Submit

146 Scan Policies Path: Scans > Scan Policies The scan policy contains plugin settings and advanced directives for the Nessus scan to follow. When an administrator user creates a scan policy, that policy is available to all organizations configured on the SecurityCenter. Click Scanning and then Policies to view a listing of all currently available policies. You can upload policies created using Nessus by clicking the Upload Policy link under the Options drop-down menu. This will open a window enabling the selection of the policy file and addition of a name, description, and group. Audit files and credentials from the original policy are not exported and copied with the policy file. You can add a new policy using the Add button. The gear icon next to existing policies provide the ability to copy, edit, share, view (view details of), export, and delete existing policies. For more information, see Add a Scan Policy
147 Add a Scan Policy You can use a template or create a custom policy. Templates allow you to create scan policies based on industry standards. Each template includes options to specify the network you want to scan. Custom policies allow you to create advanced scan policies. To add a scan policy from a template: 1. Log in to SecurityCenter. 2. Click Scanning > Policies (administrator users) or Scans > Policies (organizational users). 3. Click Add. 4. In the Template section, click a policy template. The policy template page appears. 5. Configure the options populated by the template. 6. Click Submit. To add a custom scan policy:
148 1. Log in to SecurityCenter. 2. Click Scanning > Policies (administrator users) or Scans > Policies (organizational users). 3. Click Add. 4. In the Custom section, click the Advanced Scan button. 5. Configure the options described in Custom Scan Policy Options. 6. Click Submit
149 Custom Scan Policy Options Path: Scans > Policies Setup Options Advanced Options Host Discovery Options Port Scanning Options Service Discovery Options Assessment Options Brute Force Options Malware Options SCADA Options Web Applications Options Windows Options Report Options Authentication Options Compliance Options Plugins Options Setup Options Option Name Tag A unique name for the policy. (Optional) A description for the policy. A logical grouping for policy objects. Tags can be reused as desired and previously created tags will display in the tag field when subsequent assets are added. Advanced Options
150 Option General Settings Enable Safe Checks Stop scanning hosts that become unresponsive during the scan Nessus attempts to identify remote vulnerabilities by interpreting banner information and attempting to exercise a vulnerability. When Enable Safe Checks is enabled, the second step is skipped. This is not as reliable as a full probe, but is less likely to negatively impact a targeted system. During a scan hosts may become unresponsive after a period of time. Enabling this setting stops scan attempts against hosts that stop sending results. Performance Options Slow down the scan when network congestion is detected Use Linux kernel congestion detection Network Timeout (in seconds) Max Simultaneous Checks Per Host Max Simultaneous Hosts Per When Nessus detects congestion during a scan, it will slow the speed of the scan in an attempt to ease the burden on the affected segment(s). Use Linux kernel congestion detection during the scan to help alleviate system lockups on the Nessus scanner server. Determines the amount of time, in seconds, to determine if there is an issue communicating over the network. This setting limits the maximum number of checks a Nessus scanner will perform against a single host at one time. This setting limits the maximum number of hosts that a single Nessus scanner will scan at the same time. If the scan is using a zone with multiple scanners, each scanner will accept up to the amount specified in the Max Hosts Per Scan option
151 Option Scan Max number of concurrent TCP sessions per host Max number of concurrent TCP sessions per scan For example, if the Max Simultaneous Hosts Per Scan is set to 5 and there are five scanners per zone, each scanner will accept 5 hosts to scan, allowing a total of 25 hosts to be scanned between the 5 scanners. This setting limits the maximum number of TCP sessions established by any of the active scanners while scanning a single host. This setting limits the maximum number of TCP sessions established by any of the active scanners during a scan. Host Discovery Options Option Ping the remote host When enabled, Nessus attempts to ping the hosts in the scan to determine if the host is alive or not. General Settings (available when Ping the remote host is enabled) Test the local Nessus host Use Fast Network Discovery This option allows you to include or exclude the local Nessus host from the scan. This is used when the Nessus host falls within the target network range for the scan. When Nessus pings a remote IP and receives a reply, it performs extra checks to make sure that it is not a transparent proxy or a load balancer that would return noise but no result (some devices answer to every port even when there is no service behind the device). Such checks can take some time, especially if the remote host is firewalled. If Use Fast Network Discovery is enabled, Nessus will not perform these checks. Ping Methods (available when Ping the remote host is enabled) ARP TCP Ping a host using its hardware address via Address Resolution Protocol (ARP). This only works on a local network. Ping a host using TCP
152 Option Destination ports ICMP Assume ICMP unreachable means the host is down Maximum Number of Retries (ICMP enable) UDP Destination ports can be configured to use specific ports for TCP ping. This specifies the list of ports that will be checked via TCP ping. If you are not sure of the ports, leave this setting on built-in. Ping a host using the Internet Control Message Protocol (ICMP). When a ping is sent to a host that is down, its gateway may return an ICMP unreachable message. When enabled, this option will consider this to mean the host is dead. This is to help speed up discovery on some networks. Note that some firewalls and packet filters use this same behavior for hosts that are up but are connecting to a port or protocol that is filtered. With this option enabled, this will lead to the scan considering the host is down when it is indeed up. Allows you to specify the number of attempts to try to ping the remote host. The default is two attempts. Ping a host using the User Datagram Protocol (UDP). Tip: UDP is a stateless protocol, meaning that communication is not performed with handshake dialogues. UDP-based communication is not always reliable, and because of the nature of UDP services and screening devices, they are not always remotely detectable. Fragile Devices Scan Network Printers Scan Novell Netware Hosts Instructs the Nessus scanner not to scan network printers if unselected. Since many printers are prone to denial of service conditions, Nessus can skip scanning them once identified. This is particularly recommended if scanning is performed on production networks. Instructs the Nessus scanner not to scan Novel Netware hosts if unselected. Since many Novell Netware hosts are prone to denial of service conditions, Nessus can skip scanning them once identified. This is particularly recommended if scanning is performed on production networks
153 Option Wake-on-LAN List of MAC addresses Boot time wait (in minutes) Wake on Lan (WOL) packets will be sent to the hosts listed, one on each line, in an attempt to wake the specified host(s) during a scan. The number of minutes Nessus will wait to attempt a scan of hosts sent a WOL packet. Network Type Network Type Allows you to specify if you are using publicly routable IPs, private non-internet routable IPs or a mix of these. Select Mixed if you are using RFC 1918 addresses and have multiple routers within your network. Port Scanning Options Option Ports Consider Unscanned Ports as Closed Port scan range If a port is not scanned with a selected port scanner (e.g., out of the range specified), The scanner will consider it closed. Directs the scanner to target a specific range of ports. Accepts default (a list of approximately 4,790 common ports found in the Nessus-services file) or a custom list of ports specified by the user. The custom list may contain individual ports and ranges; for example, 21,23,25,80,110 and ,8080, are valid. Specifying will scan all ports. Local Port Enumerators SSH (netstat) WMI (netstat) This option uses netstat to check for open ports on the target host. It relies on the netstat command being available via a SSH connection to the target. This scan is intended for Unix-based systems and requires authentication credentials. This option uses netstat to check for open ports from the local machine. It relies on the netstat command being available via a WMI connection to the target. This scan is intended for Windows-based systems and requires authentication cre
154 Option dentials SNMP Override automatic firewall detection Verify open TCP ports found by local port enumerators Direct Nessus to scan targets for a SNMP service. Nessus will guess relevant SNMP settings during a scan. If the settings are provided by the user under Preferences, this will allow Nessus to better test the remote host and produce more detailed audit results. For example, there are many Cisco router checks that determine the vulnerabilities present by examining the version of the returned SNMP string. This information is necessary for these audits. Rely on local port enumeration first before relying on network port scans. If a local port enumerator (e.g., WMI or netstat) finds a port, Nessus will also verify it is open remotely. This helps determine if some form of access control is being used (e.g., TCP wrappers, firewall). Network Port Scanners TCP Use Nessus built-in TCP scanner to identify open TCP ports on the targets. This scanner is optimized and has some self-tuning features. Note: On some platforms (e.g., Windows and Mac OS X), if the operating system is causing serious performance issues using the TCP scanner, Nessus will launch the SYN scanner instead. SYN Only run network port scanners if local port enumeration Use Nessus built-in SYN scanner to identify open TCP ports on the targets. SYN scans are a popular method for conducting port scans and generally considered to be a bit less intrusive than TCP scans. The scanner sends a SYN packet to the port, waits for SYN-ACK reply, and then determines port state based on the response or lack of response. Rely on local port enumeration first before relying on network port scans
155 Option failed UDP This option engages Nessus built-in UDP scanner to identify open UDP ports on the targets. Tip: UDP is a stateless protocol, meaning that communication is not done with handshake dialogues. UDP based communication is not reliable, and because of the nature of UDP services and screening devices, they are not always remotely detectable. Utilizing the UDP scanner will noticeably increase scanning time. Service Discovery Options The Service Discovery tab specifies how the scanner looks for services running on the target s ports. Option Probe all ports to find services Search for SSL based services Search for SSL on Identify certificates expiring within x days Enumerate all SSL ciphers Enable CRL checking (connects to the Internet) Attempts to map each open port with the service that is running on that port. Note that in some rare cases, this might disrupt some services and cause unforeseen side effects. Controls how Nessus will test SSL based services: known SSL ports (e.g., 443), all ports, or none. Testing for SSL capability on all ports may be disruptive for the tested host. If selected, choose between Known SSL ports (e.g., 443) and All ports. Testing for SSL capability on all ports may be disruptive for the tested host. Identifies SSL certificates that will expire within the specified timeframe. Type a value to set a timeframe (in days). When SecurityCenter performs an SSL scan, it tries to determine the SSL ciphers used by the remote server by attempting to establish a connection with each different documented SSL cipher, regardless of what the server says is available. Direct Nessus to check SSL certificates against known Certificate Revocation Lists (CRL). Enabling this option will make a connection and query one or more servers on the internet
156 Assessment Options The Assessment tab specifies how the scanner tests for information during the scan. Value Accuracy Override normal accuracy Perform thorough tests (may disrupt your network or impact scan speed) In some cases, Nessus cannot remotely determine whether a flaw is present or not. If report paranoia is set to Paranoid then a flaw will be reported every time, even when there is a doubt about the remote host being affected. Conversely, a paranoia setting of Avoid false alarms will cause Nessus to not report any flaw whenever there is a hint of uncertainty about the remote host. Normal is a middle ground between these two settings. Causes various plugins to use more aggressive settings. For example, when looking through SMB file shares, a plugin can analyze 3 directory levels deep instead of its default of 1. This could cause much more network traffic and analysis in some cases. Note that by being more thorough, the scan will be more intrusive and is more likely to disrupt the network, while potentially providing better audit results. Antivirus Antivirus definition grace period (in days) This option determines the delay in the number of days of reporting the software as being outdated. The valid values are between 0 (no delay, default) and 7. SMTP Third Party Domain From address Nessus will attempt to send spam through each SMTP device to the address listed in this option. This third party domain address must be outside the range of the site being scanned or the site performing the scan. Otherwise, the test may be aborted by the SMTP server. The test messages sent to the SMTP server(s) will appear as if they originated from the address specified in this option
157 Value To Address Nessus will attempt to send messages addressed to the mail recipient listed in this option. The postmaster address is the default value since it is a valid address on most mail servers. Brute Force Options The Brute Force tab specifies how the scanner tests for information against SCADA systems. Additionally, if Hydra is installed on the same host as a Nessus server linked to SecurityCenter, the Hydra section will be enabled. Hydra extends brute force logon testing for the following services: Asterisk, AFP, Cisco AAA, Cisco auth, Cisco enable, CVS, Firebird, FTP, HTTP-FORM-GET, HTTP-FORM-POST, HTTP-GET, HTTP-HEAD, HTTP-PROXY, HTTPS-FORM-GET, HTTPS-FORM-POST, HTTPS-GET, HTTPS-HEAD, HTTP-Proxy, ICQ, IMAP, IRC, LDAP, MS-SQL, MYSQL, NCP, NNTP, Oracle Listener, Oracle SID, Oracle, PC- Anywhere, PCNFS, POP3, POSTGRES, RDP, Rexec, Rlogin, Rsh, S7-300, SAP/R3, SIP, SMB, SMTP, SMTP Enum, SNMP, SOCKS5, SSH (v1 and v2), Subversion, Teamspeak (TS2), Telnet, VMware-Auth, VNC and XMPP. Option General Settings Only use credentials provided by the user In some cases, Nessus can test default accounts and known default passwords. This can cause the account to be locked out if too many consecutive invalid attempts trigger security protocols on the operating system or application. By default, this setting is enabled to prevent Nessus from performing these tests. Oracle Database Test default Oracle accounts (slow) Test for known default accounts in Oracle software. Hydra Always enable Hydra (slow) Enables Hydra whenever the scan is performed
158 Option Logins file Passwords file Number of parallel tasks Timeout (in seconds) Try empty passwords Try login as password Stop brute forcing after the first success Add accounts found by other plugins to the login file PostgreSQL database name SAP R3 Client ID (0-99) Windows accounts to A file that contains user names that Hydra will use during the scan. A file that contains passwords for user accounts that Hydra will use during the scan. The number of simultaneous Hydra tests that you want to execute. By default, this value is 16. The number of seconds per logon attempt. If enabled, Hydra will additionally try user names without using a password. If enabled, Hydra will additionally try a user name as the corresponding password. If enabled, Hydra will stop brute forcing user accounts after the first time an account is successfully accessed. If disabled, only the user names specified in the logins file will be used for the scan. Otherwise, additional user names discovered by other plugins will be added to the logins file and used for the scan. The database that you want Hydra to test. The ID of the SAP R3 client that you want Hydra to test. Can be set to Local accounts, Domain Accounts, or Either
159 Option test Interpret passwords as NTLM hashes Cisco login password Web page to brute force HTTP proxy test website LDAP DN If enabled, Hydra will interpret passwords as NTLM hashes. This password is used to login to a Cisco system before brute forcing enable passwords. If no password is provided here, Hydra will attempt to login using credentials that were successfully brute forced earlier in the scan. Type a web page that is protected by HTTP basic or digest authentication. If a web page is not provided here, Hydra will attempt to brute force a page discovered by the Nessus web crawler that requires HTTP authentication. If Hydra successfully brute forces an HTTP proxy, it will attempt to access the website provided here via the brute forced proxy. The LDAP Distinguish Name scope that Hydra will authenticate against. Malware Options The Malware tab specifies options for DNS Resolution, hash, and whitelist files and file system scanning. Option Malware Scan Settings Malware scan When enabled, displays the General Settings, Hash and Whitelist Files, File System Scanning, and Directories options. General Settings Disable DNS Resolution Checking this option will prevent Nessus from using the cloud to compare scan findings against known malware. Hash and Whitelist Files Provide your own list of known bad MD5 Additional known bad MD5 hashes can be uploaded via a text file that contains one MD5 hash per line. It is possible to (optionally) add a description for each hash in the uploaded
160 hashes Provide your own list of known good MD5 hashes Hosts file whitelist file. This is done by adding a comma after the hash, followed by the description. If any matches are found when scanning a target and a description was provided for the hash the description will show up in the scan results. Additional known good MD5 hashes can be uploaded via a text file that contains one MD5 hash per line. It is possible to (optionally) add a description for each hash in the uploaded file. This is done by adding a comma after the hash, followed by the description. If any matches are found when scanning a target, and a description was provided for the hash, the description will show up in the scan results. Nessus checks system hosts files for signs of a compromise (e.g., Plugin ID titled Compromised Windows System (hosts File Check). This option allows you to upload a file containing a list of IPs and hostnames that will be ignored by Nessus during a scan. Include one IP and hostname (formatted identically to your hosts file on the target) per line in a regular text file. File System Scanning Scan File System Turning on this option allows you to scan system directories and files on host computers. Caution: Enabling this setting in scans targeting 10 or more hosts could result in performance degradation. Directories Scan %Systemroot% Scan %ProgramFiles% Scan %ProgramFiles(x86)% Scan %ProgramData% Scan User Profiles Enable file system scanning to scan %Systemroot% Enable file system scanning to scan %ProgramFiles% Enable file system scanning to scan %ProgramFiles(x86)% Enable file system scanning to scan %ProgramData% Enable file system scanning to scan user profiles
161 Custom Filescan Directories A custom file that list directories for malware file scanning. List each directory on one line. Caution: Root directories such as C:\ or D:\ are not accepted. SCADA Options The SCADA tab specifies how the scanner tests for information against SCADA systems. Option Modbus/TCP Coil Access Start at register End at register These options are available for commercial users. This drop-down box item is dynamically generated by the SCADA plugins available with the commercial version of Nessus. Modbus uses a function code of 1 to read coils in a Modbus slave. Coils represent binary output settings and are typically mapped to actuators. The ability to read coils may help an attacker profile a system and identify ranges of registers to alter via a write coil message. The defaults for this are 0 for the Start at register value and 16 for the End at register value. ICCP/COTP TSAP Addressing Weakness Start COTP TSAP The ICCP/COTP TSAP Addressing menu determines a Connection Oriented Transport Protocol (COTP) Transport Service Access Points (TSAP) value on an ICCP server by trying possible values. The start and stop values are set to 8 by default. Stop COTP TSAP Web Applications Options The Web Applications tab specifies how the scanner tests for information against web server applications. Value Web Application Settings Scan web applications Enables the General Settings, Web Crawler, and Application Test Settings sections
162 Value General Settings Use a custom User- Agent Specifies which type of web browser Nessus will impersonate while scanning. Web Crawler Start crawling from Excluded pages (regex) Maximum pages to crawl Maximum depth to crawl Follow dynamically generated pages The URL of the first page that will be tested. If multiple pages are required, use a colon delimiter to separate them (e.g., /:/php4:/base). Enable exclusion of portions of the web site from being crawled. For example, to exclude the /manual directory and all Perl CGI, set this option to: (^/manual) (\.pl (\?.*)?$). Nessus supports POSIX regular expressions for string matching and handling, as well as Perl-compatible regular expressions (PCRE). The maximum number of pages to crawl. Limit the number of links Nessus will follow for each start page. If selected, Nessus will follow dynamic links and may exceed the parameters set above. Application Test Settings Enable generic web application tests Abort web application tests if HTTP login fails Enables the options listed below. If Nessus cannot login to the target via HTTP, then do not run any web application tests
163 Value Try all HTTP Methods Attempt HTTP Parameter Pollution Test embedded web servers Test more than one parameter at a time per form This option will instruct Nessus to also use POST requests for enhanced web form testing. By default, the web application tests will only use GET requests, unless this option is enabled. Generally, more complex applications use the POST method when a user submits data to the application. This setting provides more thorough testing, but may considerably increase the time required. When selected, Nessus will test each script/variable with both GET and POST requests. This setting provides more thorough testing, but may considerably increase the time required. When performing web application tests, attempt to bypass filtering mechanisms by injecting content into a variable while supplying the same variable with valid content as well. For example, a normal SQL injection test may look like /target.cgi?a='&b=2. With HTTP Parameter Pollution (HPP) enabled, the request may look like /target.cgi?a='&a=1&b=2. Embedded web servers are often static and contain no customizable CGI scripts. In addition, embedded web servers may be prone to crash or become non-responsive when scanned. Tenable recommends scanning embedded web servers separately from other web servers using this option. This option manages the combination of argument values used in the HTTP requests. The default, without checking this option, is testing one parameter at a time with an attack string, without trying non-attack variations for additional parameters. For example, Nessus attempts /test.php?arg1=xss&b=1&c=1 where b and c allows other values, without testing each combination. This is the quickest method of testing with the smallest result set generated. This drop-down box has five selections: One value - This tests one parameter at a time with an attack string, without trying non-attack variations for additional parameters. For example, Nessus attempts /test.php?arg1=xss&b=1&c=1 where b and c allows other values, without testing each combination. This is the quickest method of testing with the smallest result set generated. Some pairs This form of testing will randomly check a combination of random pairs of parameters. This is the fastest way to test multiple parameters. All pairs (slower but efficient) This form of testing is slightly slower but
164 Value more efficient than the one value test. While testing multiple parameters, it will test an attack string, variations for a single variable and then use the first value for all other variables. For example, Nessus attempts /test.php?arg1=xss&b=1&c=1 and then cycles through the variables so that one is given the attack string, one is cycled through all possible values (as discovered during the mirror process) and any other variables are given the first value. In this case, Nessus will never test for /test.php?a=xss&b=3&c=3&d=3 when the first value of each variable is 1. Some combinations This form of testing will randomly check a combination of three or more parameters. This is more thorough than testing only pairs of parameters. Note that increasing the amount of combinations by three or more increases the web application test time. All combinations (extremely slow) This method of testing will do a fully exhaustive test of all possible combinations of attack strings with valid input to variables. Where All-pairs testing seeks to create a smaller data set as a tradeoff for speed, all combinations makes no compromise on time and uses a complete data set of tests. This testing method may take a long time to complete. Do not stop after the first flaw is found per web page This option determines when a new flaw is targeted. This applies at the script level; finding an XSS flaw will not disable searching for SQL injection or header injection, but you will have at most one report for each type on a given port, unless thorough tests is set. Note that several flaws of the same type (e.g., XSS, SQLi, etc.) may be reported sometimes, if they were caught by the same attack. The drop-down has four options: Per CGI As soon as a flaw is found on a CGI by a script, Nessus switches to the next known CGI on the same server, or if there is no other CGI, to the next port/server. This is the default option. Per port (faster) As soon as a flaw is found on a web server by a script, Nessus stops and switches to another web server on a different port. Per parameter (slow) As soon as one type of flaw is found in a parameter of a CGI (e.g., XSS), Nessus switches to the next parameter of the same CGI, or the next known CGI, or to the next port/server
165 Value Look for all flaws (slower) Perform extensive tests regardless of flaws found. This option can produce a very verbose report and is not recommend in most cases. URL for Remote File Inclusion Maximum run time (minutes) During Remote File Inclusion (RFI) testing, this option specifies a file on a remote host to use for tests. By default, Nessus will use a safe file hosted by Tenable for RFI testing. If the scanner cannot reach the Internet, using an internally hosted file is recommended for more accurate RFI testing. This option manages the amount of time in minutes spent performing web application tests. This option defaults to 60 minutes and applies to all ports and CGIs for a given web site. Scanning the local network for web sites with small applications will typically complete in under an hour, however web sites with large applications may require a higher value. Windows Options The Windows tab specifies basic Windows SMB domain options. Option General Setting Request information about the SMB Domain If the option Request information about the domain is set, then domain users will be queried instead of local users. Enumerate Domain User Start UID 1000 End UID 1200 Enumerate Local User Start UID 1000 End UID 1200 Report Options The Report tab specifies information to include in the scan s report
166 Option Processing Override normal verbosity Show missing patches that have been superseded Hide results from plugins initiated as a dependency Determines the verbosity of the detail in the output of the scan results as Normal, Quiet, or Verbose. Show patches in the report that have not been applied but have been superseded by a newer patch if enabled. If a plugin is only run due to it being a dependency of a selected plugin, hide the results if enabled. Output Designate hosts by their DNS name Display hosts that respond to ping Display unreachable hosts Generate SCAP XML Results When possible, designate hosts by their DNS name rather than IP address in the reports. When enabled, show a list of hosts that respond to pings sent as part of the scan. Display a list of hosts within the scan range that were not able to be reached during the scan, if enabled. Generate a SCAP XML results file as a part of the report output for the scan. Authentication Options The Authentication tab specifies authentication options during a scan. Option Add Authentication Settings When added, authentication methods may be used to login to the scan target machines to gather more complete results of the host s status. The authentication types include host, database, miscellaneous, plaintext authentication, and patch management. For each type, various relevant options are presented such as SNMPv3, MongoDB, VMWare APIs, and similar. SNMP UDP Port Additional UDP port #1 This is the UDP port that will be used when performing certain SNMP scans. Up to four different ports may be configured, with the default port being
167 Option Additional UDP port #2 Additional UDP port #3 SSH known_hosts file Preferred port Client Version Attempt least privilege (experimental) If an SSH known_hosts file is provided for the scan policy, Nessus will only attempt to log in to hosts defined in this file. This helps to ensure that the same username and password you are using to audit your known SSH servers is not used to attempt a login to a system that may not be under your control. This option is set to direct the scan to connect to a specific port if SSH is known to be listening on a port other than the default of 22. Specifies which type of SSH client to impersonate while performing scans. Enables or disables dynamic privilege escalation. When enabled, if the scan target credentials include privilege escalation, Nessus first attempts to run commands without privilege escalation. If running commands without privilege escalation fails, Nessus retries the commands with privilege escalation. You must be running Nessus 6.11 or later to perform dynamic privilege escalation. Plugins and report whether plugins ran with or without privilege escalation. Note: Enabling this option may increase the time required to perform scans by up to 30%. Windows Never send credentials in the clear Do not use NTLMv1 authentication By default, Windows credentials are not sent to the target host in the clear. When disabled, it is theoretically possible to trick Nessus into attempting to log in to a Windows server with domain credentials via the NTLM version 1 protocol. This provides the remote attacker with the ability to use a hash obtained from Nessus. This hash can be potentially cracked to reveal a username or password. It may also be used to directly log in to other servers
168 Option Because NTLMv1 is an insecure protocol, this option is enabled by default. Start the Remote Registry service during the scan Enable administrative shares during the scan This option tells Nessus to start the Remote Registry service on computers being scanned if it is not running. This service must be running in order for Nessus to execute some Windows local check plugins. This option will allow Nessus to access certain registry entries that can be read with administrator privileges. Plaintext Authentication When enabled, patch audits will be permitted over a telnet connection. However this protocol is cleartext and usernames and passwords are unencrypted and are able to be intercepted. This option is therefore disabled by default. When enabled, patch audits will be permitted over a rsh connection. However this protocol is cleartext and usernames and passwords are unencrypted and are able to be intercepted. This option is therefore disabled by default. When enabled, patch audits will be permitted over a rexec connection. However this protocol is cleartext and usernames and passwords are unencrypted and are able to be intercepted. This option is therefore disabled by default. HTTP Perform patch audits over telnet Perform patch audits over rsh Perform patch audits over rexec Login method Re-authenticate delay (seconds) Follow 30x redirections (# of levels) Invert authenticated regex Specify if the login action is performed via a GET or POST request. The time delay between authentication attempts. This is useful to avoid triggering brute force lockout mechanisms. If a 30x redirect code is received from a web server, this directs Nessus to follow the link provided or not. A regex pattern to look for on the login page, that if found, tells Nessus authentication was not successful (e.g., Authentication failed!)
169 Option Use authenticated regex on HTTP headers Case insensitive authenticated regex Rather than search the body of a response, Nessus can search the HTTP response headers for a given regex pattern to better determine authentication state. The regex searches are case sensitive by default. This instructs Nessus to ignore case. Compliance Options The Compliance section allows users to add compliance audit files to the scan. Once the type of Unix or Windows File Content is selected from the drop-down box, a list of available audit files of that type will be available in the second drop-down box. The list of audit files may be searched by entering text into the option or scrolling the list of available names. Hovering over a name will enable an information icon which, when hovered over, will display the name, description, and type of the audit file. Selecting the check mark to the right will add the chosen audit file to the policy. Clicking the X will remove it. When an audit file exists in a policy, it may be edited to select a new compliance file or deleted by selecting the appropriate icon when hovered over. Plugins Options The Plugins tab specifies which plugins are used during the policy s Nessus scan. You can enable or disable plugins in the plugin family view or in the plugin view for more granular control. On each page of plugins there is a Show Enabled link that will show only the enabled plugins or families with one or more plugins enabled. The Show All link shows all of the plugins or families no matter if they are enabled or not. The Enable All link will enable all of the available plugins in the family while the Disable All link will disable all of the plugins. The Select Filter drop-down box provides a list of items to filter plugins off of. Filterable items include Name, CVE ID, MS Bulletin ID, Plugin ID, and others. These filters are available on the plugin families page and the family plugin list page. Selecting a filterable option will then display either a drop-down box to select options or a text entry box to type text to search on within that option. Click the Apply button to apply the search criteria to the list. Click Clear to clear the search parameters for the list of plugins
170 Clicking the status next to a plugin family allows you to enable or disable the entire family. The rectangles next to the name of the Families will show green and read Enabled when all of the plugins for that family are enabled, will show blue and read Mixed when some of the plugins for that family are enabled, and will show red and read Disabled when none of the plugins are enabled for the family. Additionally, the number in the status column indicates the total number of enabled plugins for the family. Clicking the name of a plugin family will display a list of that family s plugins
171 The displayed list of plugins will show the status of the individual plugin, the plugin name, and plugin ID. To the right of the plugin ID is an information icon. When the information icon is clicked, the Plugin Details will be displayed and provide more information about the vulnerability being examined. Scrolling down in the Plugin Details pane will also show solution information, additional references if available, the CVSSv2 score that provides a basic risk rating (as applicable), and other information provided by the plugin. When a plugin family is selected, its name appears in a drop-down box. Selecting this drop-down box will display a list of all the available plugin families. Selecting one of these will change the list of vulnerabilities to display that family s plugins. Clicking the Back link next to the drop-down box will return to the list of plugin families. When a policy is created and saved, it records all of the plugins that are initially selected. When new plugins are received via a plugin feed update, they will automatically be enabled if the family they are associated with is enabled. If the family has been disabled or partially enabled, new plugins in that family will automatically be disabled as well. Caution: The Denial of Service family contains some plugins that could cause outages on network hosts if the Safe Checks option is not enabled, but does contain some useful checks that will not cause any
172 harm. The Denial of Service family can be used in conjunction with Safe Checks to ensure that any potentially dangerous plugins are not run. However, it is recommended that the Denial of Service family not be used on a production network
173 Audit Files Path: Scans > Audit Files The Nessus vulnerability scanner allows you to perform compliance audits of numerous platforms including (but not limited to) databases, Cisco, Unix, and Windows configurations as well as sensitive data discovery based on regex contained in.audit files. Audit files are XML-based text files that contain the specific configuration, file permission, and access control tests to be performed. Tenable provides a wide range of audit files, and you can write new ones for specific environments. Common audit files are maintained on the Tenable Support Portal and through the SecurityCenter feed. The Audit Files page lists information about the audit file, including the name, owner, group, type, version, and the last time the audit file was modified. For example: On the Audit Files page, you can: Click the gear icon next to an audit file to edit, export, share, or delete the file. Click the filter icon in the top right corner of the page to filter the list of files. Filters include name, type, or type of access to the audit file. To add an audit file, click Add. SecurityCenter displays a list of audit template categories and an option for a custom audit file. For example:
174 To select templates: Click the template category, then selecting a template from the list. -or- Search by keyword across all available audit file templates using the top right search box. Once you select a template, the system displays options for a custom name and description and, if applicable, options that allow you to customize the audit file for the local environment. Click Advanced in the custom section to display the Add Audit File page. Click Edit to display the Edit Audit File page
175 Option Name Audit File A descriptive name assigned to the audit file (not necessarily the actual file name). Descriptive text about the audit file. An interface that allows you to browse your local system or file shares for an audit file to upload. When editing, click the X next to an existing audit file to delete it and, optionally, upload a new audit file. Once you upload an audit file, you can reference it from within scan policies for enhanced security policy auditing. For more information about SecurityCenter compliance auditing and audit files, refer to the Nessus Compliance Checks document located at
176 Credentials Path: Scanning > Credentials (administrator users) or Scans > Credentials (organizational users) Credentials are reusable objects that facilitate scan target login. Credentials created by an administrator user are available to all organizations, while those created by organizational users are only available to their organization. Users can share credentials with other users, allowing them to scan remote hosts without knowing the credentials of the host. SecurityCenter supports four types of credentials: Database Credentials SNMP Credentials SSH Credentials Windows Credentials To add credentials, see Add Credentials
177 Add Credentials For more information about credentials, see Credentials. To add credentials: 1. Log in to SecurityCenter. 2. Click Scanning > Credentials (administrator users) or Scans > Credentials (organizational users). The Credentials page appears. 3. Click Add. The Add Credential page appears. 4. Type a Name and for the credentials. 5. (Optional) Select a Tag. 6. Select a Type and Authentication Method. The page refreshes and displays additional options to configure. 7. Configure the options, as described in: Database Credentials SNMP Credentials SSH Credentials Windows Credentials 8. Click Submit
178 Database Credentials Note: Aspects of credential options are based on Nessus plugin options. Therefore, specific credential options may differ from the descriptions documented here. Configure the following options for database credentials. Options Name Tag Type Database Type Port Authentication A name for the credential. A description for the credential. A tag for the credential. The type of authentication you want to perform. For database credentials, select Database. The type of database: DB2, SQL Server, MySQL, Oracle, or PostgreSQL. The port the database is listening on. (Required for SQL Server and Oracle databases) The type of account you want SecurityCenter to use to access the database instance
179 SNMP Credentials Configure the following options for SNMP credentials. SecurityCenter supports SNMPv1 for authentication via a community string. Options Name Tag Type Community (Required) A name for the credential. A description for the credential. A tag for the credential. The type of authentication you want to perform. For SNMP credentials, select SNMP. The SNMP community string used for authentication
180 SSH Credentials SSH credentials are used to obtain local information from remote Linux, Unix, and Cisco IOS systems for patch auditing or compliance checks. SecurityCenter encrypts stored credentials using the AES- 256-CBC algorithm. Configure the following options for SSH credentials. General Options Name Tag Type Authentication Method (Required) A name for the credential. A description for the credential. A tag for the credential. The type of authentication you want to perform. For SSH credentials, select SSH. The method you want to use for authentication. Your Authentication Method selection determines the other options you must configure: Certificate Options, CyberArk Vault Options, Kerberos Options, Password Options, Public Key Options, and Thycotic Secret Server Options. Certificate Options The following table describes the options to configure when using Certificate as the Authentication Method for SSH credentials. Option Username User Certificate Private Key Passphrase Privilege Escalation (Required) The username for a user on the host system. (Required) The RSA or DSA OpenSSH certificate file for the user. (Required) The RSA or DSA OpenSSH private key file for the user. The passphrase for the private key, if required. The privilege escalation method you want to use to increase users' privileges after initial authentication. Your Privilege Escalation selection determines the specific
181 Option options you must configure. For more information, see Privilege Escalation. CyberArk Vault Options The following table describes the options to configure when using CyberArk Vault as the Authentication Method for SSH credentials. Note: You must meet the version requirements specified in Tenable Integrated Product Compatibility. Option Username CyberArk elevate privileges with Central Credential Provider URL Host Central Credential Provider URL Port Vault Username Vault Password Safe AppID (Required) The username for the target system. The privilege escalation method you want to use to increase users' privileges after initial authentication. Your CyberArk elevate privileges with selection determines the specific options you must configure. For more information, see Privilege Escalation. (Required) The CyberArk Central Credential Provider IP/DNS address. (Required) The port the CyberArk Central Credential Provider is listening on. The username for the vault, if the CyberArk Central Credential Provider is configured for basic authentication. The password for the vault, if the CyberArk Central Credential Provider is configured for basic authentication. The safe on the CyberArk Central Credential Provider server that contains the credentials you want to retrieve. (Required) The AppID with CyberArk Central Credential Provider permissions to retrieve the target password
182 Option Folder PolicyID Vault Use SSL Vault Verify SSL The folder on the CyberArk Central Credential Provider server that contains the credentials you want to retrieve. The PolicyID assigned to the credentials you want to retrieve. When enabled, SecurityCenter uses SSL through IIS for secure communications. You must configure SSL through IIS in CyberArk Central Credential Provider before enabling this option. When enabled, SecurityCenter validates the SSL certificate. You must configure SSL through IIS in CyberArk Central Credential Provider before enabling this option. For more information about using self-signed certificates, see the Nessus custom_ CA.inc documentation. CyberArk Account Details Name The name parameter for the CyberArk account. Kerberos Options The following table describes the options to configure when using Kerberos as the Authentication Method for SSH credentials. Option Username Password KDC Host (Required) The username for a user on the target system. (Required) The password associated with the username you provided. (Required) The host supplying the session tickets
183 Option KDC Port KDC Transport (Required) The port you want to use for the KDC connection. By default, SecurityCenter uses port 88. (Required) The method you want to use to connect to the KDC server. Note: If you select UDP, you may need to edit the KDC Port. The KDC UDP protocol uses either port 88 or port 750. Realm Privilege Escalation (Required) The authentication domain, typically the domain name of the target (e.g., example.com). The privilege escalation method you want to use to increase users' privileges after initial authentication. Your Privilege Escalation selection determines the specific options you must configure. For more information, see Privilege Escalation. Password Options The most effective credentialed scans are those with root privileges (enable privileges, for Cisco IOS). Since many sites do not permit a remote login as root for security reasons, a Nessus user account can invoke a variety of privilege escalation options including: su, sudo, su+sudo, DirectAuthorize (dzdo), PowerBroker (pbrun), k5login, and Cisco Enable. The following table describes the options to configure when using Password as the Authentication Method for SSH credentials. Option Username Password Privilege Escalation (Required) The username for a user on the target system. (Required) The password associated with the username you provided. The privilege escalation method you want to use to increase users' privileges after initial authentication. Your Privilege Escalation selection determines the specific options you must configure. For more information, see Privilege Escalation. Public Key Options
184 The following table describes the options to configure when using Public Key as the Authentication Method for SSH credentials. Option Username Private Key Passphrase Privilege Escalation (Required) The username for a user on the host system. (Required) The RSA or DSA OpenSSH key file for the user. The passphrase for the private key, if required. The privilege escalation method you want to use to increase users' privileges after initial authentication. Your Privilege Escalation selection determines the specific options you must configure. For more information, see Privilege Escalation. Thycotic Secret Server Options The following table describes the options to configure when using Thycotic Secret Server as the Authentication Method for SSH credentials. Option Username Domain Thycotic Secret Name Thycotic Secret Server URL (Required) The username for a user on the target system. The domain of the username, if set on the Thycotic server. (Required) The Secret Name value on the Thycotic server. (Required) The value you want SecurityCenter to use when setting the transfer method, target, and target directory for the scanner. Find the value on the Thycotic server, in Admin > Configuration > Application Settings > Secret Server URL. For example, if you type SecurityCenter determines it is an SSL connection, that pw.mydomain.com is the target address, and that /SecretServer is the root directory. Thycotic Login Name Thycotic Password (Required) The username for a user on the Thycotic server. (Required) The password associated with the Thycotic Login Name you
185 Option provided. Thycotic Organization Thycotic Domain Verify SSL Certificate Use Private Key (Optional) In cloud instances of Thycotic, the value that identifies the organization you want SecurityCenter to target. (Optional) The domain, if set for the Thycotic server. If enabled, SecurityCenter verifies the SSL Certificate on the Thycotic server. For more information about using self-signed certificates, see the Nessus custom_ CA.inc documentation. If enabled, SecurityCenter uses key-based authentication for SSH connections instead of password authentication
186 Privilege Escalation Some SSH credential types support privilege escalation. Note: BeyondTrust's PowerBroker (pbrun) and Centrify's DirectAuthorize (dzdo) are proprietary root task delegation methods for Unix and Linux systems. Tip: Scans run using su+sudo allow the user to scan with a non-privileged account and then switch to a user with sudo privileges on the remote host. This is important for locations where remote privileged login is prohibited. Note: Scans run using sudo vs. the root user do not always return the same results because of the different environmental variables applied to the sudo user and other subtle differences. For more information, see: The following table describes the additional options to configure for privilege escalation. Option SSH Types Escalation Username Escalation Password Escalation Path Escalation Su User Kerberos Password Public Key Kerberos Password Public Key Kerberos Password Public Key CyberArk Kerberos Password Public Key The username for the account with elevated privileges. The password for the account with elevated privileges. The directory path for the privilege escalation commands. The username for the account with su privileges. CyberArk CyberArk The name parameter for the CyberArk account with elevated priv
187 Option SSH Types Account Details Name Escalation Account Escalation sudo user Location of dzdo (directory) Location of pbrun (directory) Location of su (directory) Location of su and sudo (directory) Location of sudo (directory) CyberArk CyberArk CyberArk CyberArk CyberArk CyberArk CyberArk ileges. The username for the account with elevated privileges. The username for the account with sudo privileges. The directory path for the dzdo command. The directory path for the pbrun command. The directory path for the su command. The directory path for the su and sudo commands. The directory path for the sudo command. su login CyberArk The username for the account with su privileges. sudo login CyberArk The username for the account with sudo privileges
188 Windows Credentials Nessus has vulnerability checks that can use a Microsoft Windows domain account to find local information from a remote Windows host. For example, using credentials enables Nessus to determine if important security patches have been applied. Tip: Using a non-administrator account will greatly affect the quality of the scan results. Often it makes sense to create a special Nessus user with administrative privileges that is used solely for scheduled scanning. Configure the following options for Windows credentials. General Options Name Tag Type Authentication Method (Required) A name for the credential. A description for the credential. A tag for the credential. The type of authentication you want to perform. For Windows credentials, select Windows. The method you want to use for authentication. Your Authentication Method selection determines the other options you must configure: CyberArk Vault Options, Kerberos Options, LM Hash Options, NTLM Hash Options, Password Options, and Thycotic Secret Server Options. CyberArk Vault Options The following table describes the options to configure when using CyberArk Vault as the Authentication Method for Windows credentials. Note: You must meet the version requirements specified in Tenable Integrated Product Compatibility. Option Username The username for the target system
189 Option Domain Central Credential Provider URL Host Central Credential Provider URL Port Vault Username (optional) Vault Password (optional) Safe AppID Folder PolicyID Vault Use SSL Vault Verify SSL The domain, if the username is part of a domain. The CyberArk Central Credential Provider IP/DNS address. The port the CyberArk Central Credential Provider is listening on. The username for the vault, if the CyberArk Central Credential Provider is configured for basic authentication. The password for the vault, if the CyberArk Central Credential Provider is configured for basic authentication. The safe on the CyberArk Central Credential Provider server that contains the credentials you want to retrieve. The AppID with CyberArk Central Credential Provider permissions to retrieve the target password. The folder on the CyberArk Central Credential Provider server that contains the credentials you want to retrieve. The PolicyID assigned to the credentials you want to retrieve. When enabled, SecurityCenter uses SSL through IIS for secure communications. You must configure SSL through IIS in CyberArk Central Credential Provider before enabling this option. When enabled, SecurityCenter validates the SSL certificate. You must configure SSL through IIS in CyberArk Central Credential Provider before enabling this option. For more information about using self-signed certificates, see the Nessus custom_ CA.inc documentation. CyberArk The name parameter for the CyberArk account

190 Option Account Details Name Kerberos Options The following table describes the options to configure when using Kerberos as the Authentication Method for Windows credentials. Option Username Password Domain KDC Host KDC Port KDC Transport The username for a user on the target system. The password associated with the username you provided. The authentication domain, typically the domain name of the target (e.g., example.com). The host supplying the session tickets. The port you want to use for the KDC connection. By default, SecurityCenter uses port 88. The method you want to use to connect to the KDC server. Note: If you select UDP, you may need to edit the KDC Port. The KDC UDP protocol uses either port 88 or port 750. LM Hash Options
191 The following table describes the options to configure when using LM Hash as the Authentication Method for Windows credentials. Option Username Hash Domain The username for a user on the target system. The LM hash you want to use. The domain of the username, if required. NTLM Hash Options The following table describes the options to configure when using NTLM Hash as the Authentication Method for Windows credentials. Option Username Hash Domain The username for a user on the target system. The NTLM hash you want to use. The domain of the username, if required. Password Options The following table describes the options to configure when using Password as the Authentication Method for Windows credentials. Option Username Password Domain The username for a user on the target system. The password associated with the username you provided. The domain of the username, if required. Thycotic Secret Server Options The following table describes the options to configure when using Thycotic Secret Server as the Authentication Method for Windows credentials
192 Option Username Domain Thycotic Secret Name Thycotic Secret Server URL (Required) The username for a user on the target system. The domain of the username, if set on the Thycotic server. (Required) The Secret Name value on the Thycotic server. (Required) The value you want SecurityCenter to use when setting the transfer method, target, and target directory for the scanner. Find the value on the Thycotic server, in Admin > Configuration > Application Settings > Secret Server URL. For example, if you type SecurityCenter determines it is an SSL connection, that pw.mydomain.com is the target address, and that /SecretServer is the root directory. Thycotic Login Name Thycotic Password Thycotic Organization Thycotic Domain Use Private Key Verify SSL Certificate (Required) The username for a user on the Thycotic server. (Required) The password associated with the Thycotic Login Name you provided. (Optional) In cloud instances of Thycotic, the value that identifies which organization the SecurityCenter query should target. (Optional) The domain, if set for the Thycotic server. If enabled, SecurityCenter uses key-based authentication for SSH connections instead of password authentication. If enabled, SecurityCenter verifies the SSL Certificate on the Thycotic server. For more information about using self-signed certificates, see the Nessus custom_ CA.inc documentation
193 Blackout Windows Path: Scans > Blackout Windows Note: At the beginning of the blackout window period, the system stops any currently running scans. The blackout window in SecurityCenter specifies a timeframe where new scans cannot launch. This prevents remediation or ad-hoc scans from running during undesired timeframes, such as during production hours. Blackout windows are organizational and affect all scans in the creating user s organization. Only users with the Manage Blackout Windows permission can perform blackout window additions. For more information, see Add a Blackout Window, Edit a Blackout Window, and Delete a Blackout Window
194 Add a Blackout Window To add a blackout window: 1. Log in to SecurityCenter as an organizational user with appropriate permissions. For more information, see User Roles. 2. Click Scans > Blackout Windows. The Blackout Windows page appears. 3. Click Add. The Add Blackout Window page appears. 4. Type a Name and for the blackout window. 5. Confirm the Enabled slider is enabled. 6. In the Targets drop-down box, select a target: All Systems, Assets, IPs, or Mixed. 7. Modify the Starts On, Frequency, Repeat Every, and Repeat On options to set the schedule for the blackout window. 8. Click Submit
195 Edit a Blackout Window To edit a blackout window: 1. Log in to SecurityCenter as an organizational user with appropriate permissions. For more information, see User Roles. 2. Click Scans > Blackout Windows. The Blackout Windows page appears. 3. In the row for the blackout window you want to edit, click the gear icon menu. 4. Click Edit. The Edit Blackout Window page appears. 5. To disable the blackout window, click the Enabled slider. 6. To edit the blackout window settings, modify the Name,, Targets, Starts On, Frequency, Repeat Every, or Repeat On options. 7. Click Submit. Clicking on a blackout configuration from the list displays the details of the blackout window configuration. Select Delete from the gear icon drop-down menu to remove any blackout windows that are no longer required for the organization
196 Delete a Blackout Window To delete a blackout window: 1. Log in to SecurityCenter as an organizational user with appropriate permissions. For more information, see User Roles. 2. Click Scans > Blackout Windows. The Blackout Windows page appears. 3. In the row for the blackout window you want to delete, click the gear icon menu. 4. Click Delete. The Delete Blackout Window confirmation page appears. 5. Click Delete
197 Assets Path: Assets SecurityCenter assets are lists of devices (e.g., laptops, servers, tablets, phones, etc.) within a SecurityCenter organization. Assets can be shared with one or more users based on local security policy requirements. You can add an asset to group devices that share common attributes. Then, you can use the asset during scan configuration to target the devices in the asset. Examples of common attributes include: IP address ranges hardware types vulnerabilities outdated software versions operating systems SecurityCenter supports template-based and custom assets. For more information, see Add an Asset from a Template and Add a Custom Asset. Template-based Assets Tenable provides asset templates that you can customize for your environment. Tenable-provided asset templates are updated via the SecurityCenter feed and visible depending on other configurations. Custom Assets SecurityCenter supports the following custom assets types: Static Assets, DNS Name List Assets, LDAP Query Assets, Combination Assets, Dynamic Assets, Watchlist Assets, and Import Assets Static Assets Static assets are lists of IP addresses. You can type IP addresses directly or upload a.txt file. You can use static assets immediately after configuration. For example, if your organization assigns laptops within a defined IP address range, you can create a custom static asset for laptops using that IP address range
198 Option Name Tag IP Addresses A name for the asset. A description for the asset. A logical grouping for created asset objects. This reduces lengthy lists of assets with no logical grouping. Tags can be reused as desired and previously created tags will display in the tag option when subsequent assets are added. Objects shared with new users will retain the tag specified by the creator. IP addresses to include within the asset (20 K character limit). One IP address, CIDR address, or range can be entered per line. Click Choose File to import a list of IP addresses from a saved file. DNS Name List Assets Option Name DNS Names A name for the asset. A description for the asset. The DNS hostnames for the asset to be based upon. LDAP Query Assets The LDAP Query asset type appears if an LDAP server is configured within your organization. Option Name LDAP Server A name for the asset. A description for the asset. The LDAP server where you want to perform the query. Note: If the LDAP server is configured to use a different DNS server than SecurityCenter, SecurityCenter cannot resolve hostnames retrieved from the LDAP server. Note:SecurityCenter cannot retrieve more than one page of
199 Option LDAP results. If SecurityCenter asset or user authentication queries are not retrieving all expected results, consider modifying your LDAP pagination control settings to increase the results per page. Search Base Search String Generate Preview The LDAP search base used as the starting point to search for specific LDAP data. This string may be modified to create a search based on a location or filter other than the default search base or attribute. The preview query is displayed in the Results Preview section after clicking Generate Preview. The preview lists the LDAP data that matches the defined search string. Combination Assets Combination assets allow you to create an asset based on existing assets and the AND, OR, and NOT operators. Option Name Combination A name for the asset. A description for the asset. This option accepts multiple existing assets utilizing the operators AND, OR, and NOT. Using these operators and multiple existing assets, new unique assets may be created. If the source assets change, the Combination asset updates to match the new conditions. When this option is initially selected, the options of NOT and a list of existing assets are displayed. Selecting one of those options followed by a space will display the next valid option for building the asset and continue until the selections are complete. If the border for the combination option is red it is an indication that there is a problem in the logic of the query. Dynamic Assets
200 Dynamic assets are flexible groups of condition statements that SecurityCenter uses to retrieve a list of devices meeting the conditions. SecurityCenter refreshes dynamic asset lists using the results from SecurityCenter scans. You cannot use dynamic assets until after SecurityCenter performs an initial discovery scan and retrieves a list of devices. For example, in the asset above, SecurityCenter retrieves a list of Linux systems listening on TCP Port 80. For more information about constructing dynamic asset conditions, see Dynamic Assets. Option Name Asset Definition A name for the asset. A description for the asset. Defines the rules for creating a dynamic asset list. Hovering over an existing rule will give the ability to add, edit, or delete a group or a rule to the definition. Dynamic Asset Rule Logic
201 Valid Operators Effect Plugin ID is equal to not equal to is less than is greater than Value must be equal to value specified. Value must be not equal to value specified. Value must be less than the value specified. Value must be greater than the value specified. Plugin Text is equal to not equal to contains the pattern Posix regex Perl compatible regex Value must be equal to value specified. Value must be not equal to value specified. Value must contain the text specified (e.g., ABCDEF contains ABC). Any valid Posix regex pattern contained within / and / (example: /.*ABC.*/). Any valid Perl compatible regex pattern. Operating System is equal to not equal to contains the pattern Posix regex Perl compatible regex Value must be equal to value specified. Value must be not equal to value specified. Value must contain the text specified (e.g., ABCDEF contains ABC). Any valid Posix regex pattern contained within / and / (e.g., /.*ABC.*/). Any valid Perl compatible regex pattern. IP Address is equal to not equal to Value must be equal to value specified. Value must be not equal to value specified. DNS, NetBIOS Host, NetBIOS Workgroup, MAC, SSH v1 Fingerprint, SSH v2 Fingerprint
202 Valid Operators is equal to not equal to contains the pattern Posix regex Perl compatible regex Effect Value must be equal to value specified. Value must be not equal to value specified. Value must contain the text specified (e.g., contains 124). Any valid Posix regex pattern contained within / and / (e.g., /.*ABC.*/). Any valid Perl compatible regex pattern. Port, TCP Port, UDP Port is equal to not equal to is less than is greater than Value must be equal to value specified. Value must be not equal to value specified. Value is less than value specified. Value is greater than the value specified. Days Since Discovery, Days Since Observation is equal to not equal to is less than is greater than where Plugin ID is Value must be equal to value specified. Scroll arrows are provided to allow for entry selection or the value can be manually entered. Max 365. Value must be not equal to value specified. Scroll arrows are provided to allow for entry selection or the value can be manually entered. Max 365. Value is less than value specified. Scroll arrows are provided to allow for entry selection or the value can be manually entered. Max 365. Value is greater than the value specified. Scroll arrows are provided to allow for entry selection or the value can be manually entered. Max 365. Any valid Plugin ID number. Multiple Plugin IDs may be entered using a range and/or comma separated Plugin IDs (e.g., 3, 10189, 34598, , ). Severity is equal to not equal to Value must be equal to value specified (info, low, medium, high, or critical). Value must be not equal to value specified (info, low, medium, high, or crit
203 Valid Operators Effect ical). is less than is greater than where Plugin ID is Value must be less than the value specified (info, low, medium, high, or critical). Value must be greater than the value specified (info, low, medium, high, or critical). Any valid Plugin ID number. Multiple Plugin IDs may be entered using a range and/or comma separated Plugin IDs (e.g., 3, 10189, 34598, , ). Exploit Available Is Click True or False in the drop-down box. Exploit Frameworks is equal to Is not equal to contains the pattern Value must be equal to value specified. Value must not be equal to value specified. Value must contain the pattern entered. XRef Value must be in the XRef option. Watchlist Assets A watchlist is an asset that is used to maintain lists of IPs not in the user s managed range of IP addresses. IPs from a watchlist can be filtered on regardless of your IP range configuration. This proves to be beneficial when analyzing event activity originating outside of the user s managed range. For example, if a block of IP addresses is a known source of malicious activity, it could be added to a Malicious IPs watchlist and added to a custom query. Note: Watchlists only uses event data to create the asset list. Option Name A name for the asset
204 Option IP Addresses A description for the asset. IP addresses to include within the asset list (20 K character limit). One address, CIDR address, or range can be entered per line. Click Choose File to import a list of IP addresses from a saved file. Import Assets Option Name Asset The asset name. Click Choose File to choose the asset that was previously exported for import into SecurityCenter
205 Add an Asset from a Template To add an asset from a Tenable-provided template: 1. Log in to SecurityCenter as an organizational user with appropriate permissions. For more information, see User Roles. 2. In the top navigation bar, click Assets. The Assets page appears. 3. Click Add. The Add Assets page appears. 4. (Optional) If you want to search for a specific asset template, type a search phrase in the Search Templates box. 5. In the Templates section, click a template type. The Add Asset Template page for the template type appears. 6. View the available templates. In each row:
206 the four square icon ( ) on the left side indicates a collection of several assets. the data icons ( ) on the right side indicate the data required to build the asset. PVS, LCE, and NS icons indicate you must have PVS, LCE, and Nessus data. The key icon ( ) indicates you must have credentials for the device. The notepad icon ( ) indicates you must have compliance data. 7. (Optional) If you want to search for a specific asset template, type a search phrase in the Search Templates box or select a category from the All drop-down box. 8. Click the row for the template you want to use. The detail page for the template type appears. 9. Click Add. The Assets page appears. 10. Click the row for the asset you just added. The Edit page appears. 11. View the details for the asset. 12. (Optional) If necessary, edit the asset to customize it for your environment. For more information about asset options, see Assets. 13. Click Submit
207 Add a Custom Asset To add a custom asset: 1. Log in to SecurityCenter as an organizational user with appropriate permissions. For more information, see User Roles. 2. In the top navigation bar, click Assets. The Assets page appears. 3. Click Add. The Add Assets page appears. 4. In the Custom section, click an asset type. The Add Assets page for the asset type appears. 5. Configure the required options for the asset type, as described in Assets. 6. Click Submit
208 Patch Management SecurityCenter can leverage credentials for the Red Hat Network Satellite, IBM BigFix, Dell KACE 1000, WSUS, and SCCM patch management systems to perform patch auditing on systems for which credentials may not be available to the Nessus scanner. Options for these patch management systems can be found under Scan Policy Definitions in their respective drop-down boxes: Symantec Altiris, IBM BigFix, Red Hat Satellite Server, Microsoft SCCM, Dell KACE K1000, and Microsoft WSUS. IT administrators are expected to manage the patch monitoring software and install any agents required by the patch management system on their systems. Scanning With Multiple Patch Managers If you provide multiple sets of credentials to SecurityCenter for patch management tools, SecurityCenter uses all of them. Available credentials are: Credentials supplied to directly authenticate to the target Dell KACE 1000 IBM BigFix Microsoft System Center Configuration Manager (SCCM) Microsoft Windows Server Update Services (WSUS) Red Hat Network Satellite Server Symantec Altiris If you provide credentials for a host, as well as one or more patch management systems, SecurityCenter compares the findings between all methods and report on conflicts or provide a satisfied finding. Use the Patch Management Windows Auditing Conflicts plugins to highlight patch data differences between the host and a patch management system. Dell KACE K1000 KACE K1000 is available from Dell to manage the distribution of updates and hotfixes for Linux, Windows, and Mac OS X systems. SecurityCenter can query KACE K1000 to verify whether or not patches are installed on systems managed by KACE K1000 and display the patch information through the SecurityCenter user interface
209 If the credential check sees a system but it is unable to authenticate against the system, it uses the data obtained from the patch management system to perform the check. If SecurityCenter is able to connect to the target system, it performs checks on that system and ignores KACE K1000 output. The data returned to SecurityCenter by KACE K1000 is only as current as the most recent data that the KACE K1000 has obtained from its managed hosts. KACE K1000 scanning uses four SecurityCenter plugins: kace_k1000_get_computer_info.nbin (Plugin ID 76867) kace_k1000_get_missing_updates.nbin (Plugin ID 76868) kace_k1000_init_info.nbin (Plugin ID 76866) kace_k1000_report.nbin (Plugin ID 76869) You must provide credentials for the Dell KACE K1000 system for K1000 scanning to work properly. Under the Credentials tab, select Patch Management, then select Dell KACE K1000. Option Default Server none (Required) The KACE K1000 IP address or system name. Database Port 3306 The port the K1000 database is running on (typically TCP 3306). Organization Database Name Database Username K1000 Database Password ORG1 none none The name of the organization component for the KACE K1000 database. This component begins with the letters ORG and ends with a number that corresponds with the K1000 database username. (Required) The username required to log into the K1000 database. R1 is the default if no user is defined. The username begins with the letter R. This username ends in the same number that represents the number of the organization to scan. (Required) The password required to authenticate the K1000 Database Username. IBM BigFix IBM BigFix is available from IBM to manage the distribution of updates and hotfixes for desktop systems. SecurityCenter can query IBM BigFix to verify whether or not patches are installed on systems
210 managed by IBM BigFix and display the patch information. If the credential check sees a system but it is unable to authenticate against the system, it uses the data obtained from the patch management system to perform the check. If SecurityCenter is able to connect to the target system, it performs checks on that system and ignores IBM BigFix output. The data returned to SecurityCenter by IBM BigFix is only as current as the most recent data that the IBM BigFix server has obtained from its managed hosts. IBM BigFix scanning uses five SecurityCenter plugins: Patch Management: Tivoli Endpoint Manager Compute Info Initialization (Plugin ID 62559) Patch Management: Missing updates from Tivoli Endpoint Manager (Plugin ID 62560) Patch Management: IBM Tivoli Endpoint Manager Server Settings (Plugin ID 62558) Patch Management: Tivoli Endpoint Manager Report (Plugin ID 62561) Patch Management: Tivoli Endpoint Manager Get Installed Packages (Plugin ID 65703) You must provide credentials for the IBM BigFix server for IBM BigFix scanning to work properly. Under the Credentials tab, select Patch Management, then select IBM Tivoli Endpoint Manager (BigFix) Option Default Web Reports Server None The name of IBM BigFix Web Reports Server. Web Reports Port none The port that the IBM BigFix Web Reports Server listens on. Web Reports Username none The Web Reports administrative username. Web Reports Password none The Web Reports administrative password. HTTPS Enabled Shows if the Web Reports service is using SSL. Verify SSL certificate Enabled Verify that the SSL certificate is valid. Package reporting is supported by RPM-based and Debian-based distributions that IBM BigFix officially supports. This includes Red Hat derivatives such as RHEL, CentOS, Scientific Linux, and Oracle Linux, as well as Debian and Ubuntu. Other distributions may also work, but unless IBM BigFix officially supports them, there is no support available. For local check plugins to trigger, only RHEL, CentOS, Scientific Linux, Oracle Linux, Debian, and Ubuntu are supported. The plugin Patch Management: Tivoli Endpoint Manager Get Installed Packages must be enabled
211 In order to use these auditing features, you must make changes to the IBM BigFix server. You must import a custom analysis into IBM BigFix so that detailed package information is retrieved and made available to SecurityCenter. Before beginning, save the following text to a file on the IBM BigFix system, and name it with a.bes extension. <?xml version="1.0" encoding="utf-8"?> <BES xmlns:xsi=" xsi:nonamespaceschemalocation="bes.xsd"> <Analysis> <Title>Tenable</Title> <>This analysis provides SecurityCenter with the data it needs for vulnerability reporting. </> <Relevance>true</Relevance> <Source>Internal</Source> <SourceReleaseDate> </SourceReleaseDate> <MIMEField> <Name>x-fixlet-modification-time</Name> <Value>Fri, 01 Feb :54: </Value> </MIMEField> <Domain>BESC</Domain> <Property Name="Packages - With Versions (Tenable)" ID="1"><![CDATA[if (exists true whose (if true then (exists debianpackage) else false)) then unique values of (name of it & " " & version of it as string & " " & "deb" & " " & architecture of it & " " & architecture of operating system) of packages whose (exists version of it) of debianpackages else if (exists true whose (if true then (exists rpm) else false)) then unique values of (name of it & " " & version of it as string & " " & "rpm" & " " & architecture of it & " " & architecture of operating system) of packages of rpm else "<unsupported>" </Analysis> </BES> ]]></Property> Microsoft System Center Configuration Manager (SCCM) Microsoft System Center Configuration Manager (SCCM) is available to manage large groups of Windows-based systems. SecurityCenter can query the SCCM service to verify whether or not patches are installed on systems managed by SCCM and display the patch information through the SecurityCenter user interface. If the credentialed check sees a system but it is unable to authenticate against the system, it uses the data obtained from the patch management system to perform the check. If SecurityCenter is able to connect to the target system, it performs checks on that system and ignores
212 SCCM output. The data returned by SCCM is only as current as the most recent data that the SCCM server has obtained from its managed hosts. SecurityCenter connects to the server that is running the SCCM site (e.g., credentials must be valid for the SCCM service, meaning an admin account in SCCM with the privileges to query all the data in the SCCM MMC). This server may also run the SQL database, or the database as well as the SCCM repository can be on separate servers. When leveraging this audit, SecurityCenter must connect to the SCCM Server, not the SQL or SCCM server if they are on a separate box. SecurityCenter SCCM patch management plugins support SCCM 2007 and SCCM SCCM scanning uses four SecurityCenter plugins: Patch Management: SCCM Server Settings (Plugin ID 57029) Patch Management: Missing updates from SCCM(Plugin ID 57030) Patch Management: SCCM Computer Info Initialization(Plugin ID 73636) Patch Management: SCCM Report(Plugin ID 58186) You must provide credentials for the SCCM system for SCCM scanning to work properly. Under the Credentials tab, select Patch Management, then select Microsoft SCCM. Credential Server Domain Username Password The SCCM IP address or system name. The domain the SCCM server is a part of. The SCCM admin username. The SCCM admin password. Windows Server Update Services (WSUS) Windows Server Update Services (WSUS) is available from Microsoft to manage the distribution of updates and hotfixes for Microsoft products. SecurityCenter can query WSUS to verify whether or not patches are installed on systems managed by WSUS and display the patch information through the SecurityCenter user interface. If the credential check sees a system but it is unable to authenticate against the system, it uses the data obtained from the patch management system to perform the check. If SecurityCenter is able to connect to the target system, it performs checks on that system and ignores WSUS
213 output. The data returned to SecurityCenter by WSUS is only as current as the most recent data that the WSUS server has obtained from its managed hosts. WSUS scanning uses three SecurityCenter plugins: Patch Management: WSUS Server Settings (Plugin ID 57031) Patch Management: Missing updates from WSUS (Plugin ID 57032) Patch Management: WSUS Report (Plugin ID 58133) You must provide credentials for the WSUS system for WSUS scanning to work properly. Under the Credentials tab, select Patch Management, then select Microsoft WSUS. Credential Default Server None The WSUS IP address or system name. Port 8530 The port WSUS is running on (typically TCP 80 or 443). Username none The WSUS admin username. Password none The WSUS admin password. HTTPS Enabled Shows if the WSUS service is using SSL. Verify SSL certificate Enabled Verifies that the SSL certificate is valid. Red Hat Satellite Server Red Hat Satellite is a systems management platform for Linux-based systems. SecurityCenter can query Satellite to verify whether or not patches are installed on systems managed by Satellite and display the patch information. Although not supported by Tenable, the RHN Satellite plugin also works with Spacewalk Server, the Open Source Upstream Version of Red Hat Satellite. Spacewalk can manage distributions based on Red Hat (RHEL, CentOS, Fedora) and SUSE. Tenable supports the Satellite server for Red Hat Enterprise Linux. If the credential check sees a system, but it is unable to authenticate against the system, it uses the data obtained from the patch management system to perform the check. If Security Center is able to connect to the target system, it performs checks on that system and ignores RHN Satellite output
214 The data returned to SecurityCenter by RHN Satellite is only as current as the most recent data that the Satellite server has obtained from its managed hosts. Satellite scanning uses five SecurityCenter plugins: Patch Management: Patch Schedule From Red Hat Satellite Server (Plugin ID 84236) Patch Management: Red Hat Satellite Server Get Installed Packages (Plugin ID 84235) Patch Management: Red Hat Satellite Server Get Managed Servers (Plugin ID 84234) Patch Management: Red Hat Satellite Server Get System Information (Plugin ID 84237) Patch Management: Red Hat Satellite Server Settings (Plugin ID 84238) If the RHN Satellite server is version 6, it uses three additional SecurityCenter plugins: Patch Management: Red Hat Satellite Server Get Installed Packages (Plugin ID 84231) Patch Management: Red Hat Satellite 6 Settings (Plugin ID 84232) Patch Management: Red Hat Satellite 6 Report (Plugin ID 84233) Red Hat Satellite 6 Server Credential Default Satellite server none The RHN Satellite IP address or system name. Port 443 The port Satellite is running on (typically TCP 80 or 443). Username none The Red Hat Satellite username. Password none The Red Hat Satellite password. HTTPS Verify SSL Certificate Enabled Enabled Verifies that the SSL certificate is valid. Symantec Altris Altiris is available from Symantec to manage the distribution of updates and hotfixes for Linux, Windows, and Mac OS X systems. SecurityCenter has the ability to use the Altiris API to verify whether or not patches are installed on systems managed by Altiris and display the patch information through the SecurityCenter GUI
215 If the credential check sees a system but it is unable to authenticate against the system, it uses the data obtained from the patch management system to perform the check. If SecurityCenter is able to connect to the target system, it performs checks on that system and ignores Altiris output. The data returned to SecurityCenter by Altiris is only as current as the most recent data that the Altiris has obtained from its managed hosts. SecurityCenter connects to the Microsoft SQL server that is running on the Altiris host (e.g., credentials must be valid for the MSSQL database, meaning a database account with the privileges to query all the data in the Altiris MSSQL database). The database server may be run on a separate host from the Altiris deployment. When leveraging this audit, SecurityCenter must connect to the MSSQL database, not the Altiris server if they are on a separate box. Altiris scanning uses four SecurityCenter plugins: symantec_altiris_get_computer_info.nbin (Plugin ID 78013) symantec_altiris_get_missing_updates.nbin (Plugin ID 78012) symantec_altiris_init_info.nbin (Plugin ID 78011) symantec_altiris_report.nbin (Plugin ID 78014) You must provide credentials for the Altiris Microsoft SQL (MSSQL) database for Altiris scanning to work properly. Under the Credentials tab, select Patch Management, then select Symantec Altiris. Credential Default Server none (Required) Altiris IP address or system name. Database Port 5690 The port the Altiris database is running on (Typically TCP 5690). Database Name Database Username Database Password Use Windows Authentication Symantec_ CMDB None none Disabled The name of the MSSQL database that manages Altiris patch information. (Required) The username required to log into the Altiris MSSQL database. (Required) The password required to authenticate the Altiris MSSQL database. Denotes whether or not to use NTLMSSP for compatibility with older Windows Servers, otherwise it uses Kerberos
216 To ensure SecurityCenter can properly utilize Altiris to pull patch management information, you must configure it
217 Resources Administrator users can configure supporting resources. Nessus Scanners Scan Zones Passive Vulnerability Scanners (Nessus Network Monitor) LDAP Servers Log Correlation Engines Log Correlation Engine Clients Log Correlation Engine Client Policies

218 Nessus Scanners Path: Resources > Nessus Scanners In the SecurityCenter framework, the Nessus scanner behaves as a server, while SecurityCenter serves as a client that schedules and initiates scans, retrieves results, reports results, and performs a wide variety of other important functions. The Nessus Scanners page lists your configured scanners. To manually refresh the Status column, click the the Options drop-down box. Then, click Update Status. The Features column indicates whether a scanner is a Standard scanner or an Agent Capable scanner that provides Nessus Agent scan results to SecurityCenter. There are three classifications of Nessus scanners that may be added to SecurityCenter: A managed Nessus scanner is managed by SecurityCenter. Managed scanners are logged in to using Nessus credentials. SecurityCenter can send plugin updates to the scanner. SecurityCenter also maintains the Activation Code for managed scanners
219 An unmanaged Nessus scanner is accessed by SecurityCenter using a standard Nessus user s credentials. This scanner may be used to perform a scan but SecurityCenter cannot send plugin updates to an unmanaged scanner or manage its Activation Code. A Tenable.io scanner is accessed by SecurityCenter. Tenable.io is a vulnerability scanning service that may be used to audit Internet facing IP addresses for both network and web application vulnerabilities from the cloud. A Tenable.io scanner is considered to be an unmanaged scanner and therefore SecurityCenter does not push plugin updates to a Tenable.io scanner. For more information, see Add a Nessus Scanner and Add a Tenable.io Scanner. Option Name Host Port Enabled Verify Hostname A descriptive name for the scanner. A scanner description, location, or purpose. The hostname or IP address of the scanner. The TCP port that the Nessus scanner listens on for communications from SecurityCenter. The default is port A scanner may be Enabled or Disabled within SecurityCenter to allow or prevent access to the scanner. Adds a check to verify that the hostname or IP address entered in the Host option matches the CommonName (CN) presented in the SSL certificate from the Nessus server. Note: Confirm that the correct CA certificate is configured for use by SecurityCenter. If you are using a custom CA, configure SecurityCenter to trust your custom CA, as described in Configure SecurityCenter to Trust a Custom CA. You do not need to perform this step when using the default certificates for Nessus servers. Use Proxy Authentication Type Username Instructs SecurityCenter to use its configured proxy for communication with the scanner. Select Password or SSL Certificate for the authentication type to connect to the Nessus scanner. For detailed SSL Certificate configuration options, see the Nessus SSL Configuration section of this document. Username generated during the Nessus install for daemon to client com
220 Option munications. This must be an administrator user in order to send plugin updates to the Nessus scanner. If the scanner is updated by a different method, such as through another SecurityCenter, a standard Nessus user account may be used to perform scans. This option is only available if the Authentication Type is set to Password. Password Certificate Zones Agent Capable The login password must be entered in this option. This option is only available if the Authentication Type is set to Password. This option is available if the Authentication Type is set to SSL Certificate. Click the Browse button, choose a SSL Certificate file to upload, and upload to the SecurityCenter. For more information, see Nessus SSL Configuration. The zone(s) within SecurityCenter that have access to use this scanner. When the Agent Capable option is enabled, an organization option is presented. Select one or more organizations that have access to import Nessus Agent data into SecurityCenter. Agent capable Nessus scanners must be either Tenable.io or Nessus Manager version 6.5 or higher. When using Nessus Manager, an organizational user account must be used to connect from SecurityCenter
221 Add a Nessus Scanner To add a Nessus scanner to SecurityCenter: 1. Log in to SecurityCenter as an administrator user. 2. Click Resources > Nessus Scanners. 3. Click Add. 4. Configure Nessus scanner options, as described in Nessus Scanners. 5. Click Submit
222 Add a Tenable.io Scanner SecurityCenter supports the use of Tenable.io as a Nessus scanner within SecurityCenter. Tenable.io is an enterprise-class remote vulnerability scanning service that may be used to audit Internet facing IP addresses for both network and web application vulnerabilities from the cloud. While they are not managed by a SecurityCenter (e.g., plugins are not pushed from SecurityCenter to the scanner), Tenable.io scanners can be added to SecurityCenter in the same manner that internal, local, or remote Nessus scanners are added
223 Before You Begin:
224 Confirm that you have a valid, active Tenable.io subscription. To add Tenable.io to SecurityCenter as a Nessus scanner: 1. Log in to SecurityCenter as an administrator user. 2. Click Resources > Nessus Scanners. 3. Click Add. 4. Configure Nessus scanner options, as described in Nessus Scanners. You must configure all required options and use Tenable.io-specific values for some settings: Option Host Value for a Tenable.io Configuration cloud.tenable.com Port 443 Username Password Zones The username for an active Tenable.io user account. The password for an active Tenable.io user account. The zones within SecurityCenter that use Tenable.io as a scanner. 5. Click Submit. Note: Existing scan reports from Tenable.io are not automatically available in SecurityCenter. However, you can manually download and import them into SecurityCenter. Note: By default, Tenable.io selects the corresponding regional scanner. For example, if you run a scan in the United States, Tenable.io selects the United States scanner. If you run a scan in Germany, Tenable.io selects the Germany scanner
225 View Details for a Nessus Scanner Note: SecurityCenter refreshes the load information every 15 minutes. To view details for a Nessus scanner: 1. Log in to SecurityCenter as an administrator user. 2. Click Resources > Nessus Scanners. The Nessus Scanners page appears. 3. In the row for the scanner for which you want to view details, click the gear icon. 4. Click View
226 The View Nessus Scanner page appears
227 Delete a Nessus Scanner To delete a Nessus scanner: 1. Log in to SecurityCenter as an administrator user. 2. Click Resources > Nessus Scanners. The Nessus Scanners page appears. 3. In the row for the scanner you want to delete, click the gear icon. 4. Click Delete. The Delete Nessus Scanner confirmation window appears. 5. Click Delete
228 Scan Zones Path: Resources > Scan Zones Scan zones represent areas of your network that you want to target in a scan, associating an IP address or range of IP addresses with one or more scanners in your deployment. You must create scan zones in order to run scans in SecurityCenter. Scan zones define the IP ranges associated with the scanner along with organizational access. SecurityCenter allows the configuration of defined organizations with three different scan zone modes: Automatic Distribution Only, Locked Zone, and Selectable Zones. If an organization is in Automatic Distribution Only mode, SecurityCenter picks the scan zone and scanners based on the IP address of the target. If an organization is in Locked Zone mode, only the selected zones are available to users during the creation of scan policies. If an organization is in Selectable mode, all scan zones display and can be selected as needed. When in Selectable mode, at scan time, the zones associated with the organization and All Zones are available to the user. When a scan is configured to use a specific zone in either selectable or forced mode, the zone s ranges are ignored and any IPs in the managed ranges for that user are scanned by the Nessus scanners associated with the chosen zone. When a scan is configured to use the All Zones zone, the targets for the scan are given to scanners in the most appropriate zone available based on the zone s specified ranges (20K character limit). This facilitates optimal scanning and is very useful if an organization has devices placed behind a firewall or NAT device and has conflicting RFC 1918 non-internet-routable address space with another organization. In addition, some organizations may benefit from the ability to override their default scanner (s) with one(s) from a different zone. This allows an organization to more easily run internal and external vulnerability scans. Tip: Sometimes forcing a scan to use a non-ideal scanner helps to analyze the vulnerability stance from a new perspective. For example, set the default scanner to an external one to see the attack surface from an external attacker s perspective. For more information, see Add a Scan Zone, Edit a Scan Zone, and Delete a Scan Zone. Option Name A name for the scan zone. (Optional) A description for the scan zone
229 Ranges One or more IP addresses that you want the scan zone to target. Supported formats: a comma-separated list of IP addresses and/or CIDR addresses. a newline-separated list of IP addresses and/or CIDR addresses. a hyphenated range of IP addresses (e.g., ). Scanners One or more scanners that you want to use to scan the Ranges in this scan zone. Note: Do not choose scanners that cannot reach the areas of your network identified in the Ranges. Similarly, consider the quality of the network connection between the scanners you choose and the Ranges. Best Practices Tenable recommends pre-planning your scan zone strategy to efficiently target discrete areas of your network. If configured improperly, scan zones prevent scanners from reaching their targets. Consider the following best practices: It is simplest to configure and manage a small number of scan zones with large ranges. It is simplest to target ranges (versus large lists of individual IP addresses). If you use Nessus Manager for agent management, do not target Nessus Manager in any scan zone ranges. Overlapping Scan Zones In some cases, you may want to configure overlapping scan zones to ensure scanning coverage or redundancy. Note: Do not configure overlapping scan zones without pre-planning your scan zone strategy. Two or more scan zones are redundant if they target the same area of your network. If SecurityCenter executes a scan with redundant scan zones, it first attempts the scan using the narrowest, most specific scan zone. In this example, the red dots 1, 2, 3, 4, 5, 6, and 7 represent specific IP addresses on your network. The blue circles represent the network coverage of Scan Zones A, B, C, D, E, and F

230 See the following table to understand the primary and redundant scan zones for the IP addresses in this example. IP Address Primary Scan Zone Redundant Scan Zones 1 Scan Zone A. None. 2 Scan Zone B. Scan Zone A. 3 Scan Zone C. Scan Zone B, then Scan Zone A. 4 Scan Zone C. Scan Zone A. 5 Scan Zone D. Scan Zone A. 6 Scan Zone E. Scan Zone A. 7 Scan Zone F. Scan Zone E, then Scan Zone A
231 Add a Scan Zone For more information about scan zone options, see Scan Zones. To add a scan zone: 1. Log in to SecurityCenter as an administrator user. 2. Click Resources > Scan Zones. The Add Scan Zone page appears. 3. Click Add. 4. Type a Name and for the scan zone. 5. In the Ranges box, type one or more IP addresses, CIDR addresses, or ranges to target with the scan zone. 6. In the Scanners box, choose one or more scanners to associate with the scan zone. 7. Click Submit
232 Edit a Scan Zone For more information about scan zone options, see Scan Zones. To edit a scan zone: 1. Log in to SecurityCenter as an administrator user. 2. Click Resources > Scan Zones. The Add Scan Zone page appears. 3. Click the gear icon next to the role you want to edit. 4. Click Edit. The Edit Scan Zone page appears. 5. Edit the Name,, Ranges, and/or Scanners for the scan zone. 6. Click Submit
233 Delete a Scan Zone Before You Begin Confirm that no scans target the scan zone you want to delete. SecurityCenter scans may fail if you delete an actively targeted scan zone. To delete a scan zone: 1. Log in to SecurityCenter as an administrator user. 2. Click Resources > Scan Zones. The Add Scan Zone page appears. 3. Click the gear icon next to the role you want to edit. 4. Click Delete. The Delete Scan Zone confirmation window appears. 5. Click Delete

234 Nessus Network Monitor (PVS) Nessus Network Monitor (NNM) is a patented network discovery and vulnerability analysis software solution, that delivers real-time network profiling and monitoring for continuous assessment of an organization s security posture in a non-intrusive manner. NNM monitors network traffic at the packet layer to determine topology, services, and vulnerabilities. Where an active scanner takes a snapshot of the network in time, NNM behaves like a security motion detector on the network. SecurityCenter communicates with NNM 4.0 or higher utilizing the XMLRPC protocol on port 8835 by default. SecurityCenter will ask NNM for the latest (if any) vulnerability report once every hour by default. The pull interval may be changed under the System Configuration page under the Update tab. By default, SecurityCenter will check every 24 hours to see if any new passive vulnerability plugins have been downloaded from Tenable and will push them out to each NNM scanner. SecurityCenter must have a valid PVS Activation Code to retrieve plugin updates from Tenable and send plugin updates to the attached NNM scanners. The example below shows a listing of NNM scanners: To configure one or more NNM servers, click Resources > Passive Vulnerability Scanners. This will produce a list of all configured NNM devices by name, their host, version, status, uptime, and the last time of the last retrieved report. Selecting the Update Status button from the Options drop-down menu will initiate a connection from SecurityCenter to obtain and refresh the status of the NNM scanners. To add a scanner, click the Add button. Items with an asterisk (*) next to them indicate information that is required that does not have a default setting. An example of the Add Scanner dialog is shown below:
235 The table below provides details about the available options for adding a NNM scanner: Option Name Host Port Descriptive name for the NNM scanner. Scanner description, location, or purpose. Hostname or IP address of the scanner. TCP port that the NNM scanner listens on for communications from SecurityCenter. The default is port
236 Option State Authentication Type Username Password Certificate Verify Hostname Use Proxy Repositories A scanner may be marked as Enabled or Disabled within SecurityCenter to allow or prevent access to the scanner. Select Password or SSL Certificate for the authentication type to connect to the NNM scanner. Username generated during the NNM install for daemon to client communications. This must be an administrator user in order to send plugin updates to the NNM scanner. This option is only available if the Authentication Type is set to Password. The login password must be entered in this option. This option is only available if the Authentication Type is set to Password. This option is available if the Authentication Type is SSL Certificate. Click the Browse button, choose a SSL Certificate file to upload, and upload to the SecurityCenter. Adds a check to verify that the hostname or IP address entered in the Host option matches the CommonName (CN) presented in the SSL certificate from the NNM server. Instructs SecurityCenter to use its configured proxy for communication with the scanner. The repositories which this NNM scanner will save its data to. If NNM will be reporting IPv4 and IPv6 data, at least two repositories (one for IPv4 and one for IPv6 data) must be selected. To configure NNM schedules, see External Schedules Settings. SecurityCenter will add all data collected by a NNM to the repository(s) that are configured for it. Therefore it is important for the NNM to restrict the data it is collecting to only the desired IP range(s). For example, if the attached NNM collects information on 1100 hosts and the SecurityCenter is licensed for only 1000 hosts, SecurityCenter will import all of the collected data and indicate that the host count has exceeded the licensed amount of hosts
237 LDAP Servers Path: Resources > LDAP Servers Configuring LDAP allows you to use one or more external LDAP servers for SecurityCenter user account authentication. LDAP authentication enhances the security of SecurityCenter by inheriting password complexity requirements from environments mandated by security policy. You can also use configured LDAP servers as LDAP query assets. For more information, see Assets. Note: SecurityCenter cannot retrieve more than one page of LDAP results. If SecurityCenter asset list or user authentication queries are not retrieving all expected results, consider modifying your LDAP pagination control settings to increase the results per page
238 Configure the LDAP settings as directed by your LDAP server administrator. Click Test LDAP Settings to validate the connection
239 Option Server Settings Name Hostname Port A unique name for the LDAP server. (Optional) A description for the LDAP server. The IP address or DNS name of the LDAP server. The remote LDAP port. Confirm the selection with your LDAP server administrators. When Encryption is None, Port is typically 389. When Encryption is TLS or LDAPS, Port is typically 636. Encryption Username / Password (Optional) If the LDAP server encrypts communications, the encryption method: Transport Layer Security (STARTTLS) or LDAP over SSL (LDAPS). (Optional) If required by the server, the username and password for an account on the LDAP server with credentials to search for user data. For example, Active Directory servers require an authenticated search. Format the username as provided by the LDAP server. Tip: It is recommended to use passwords that meet stringent length and complexity requirements. LDAP Schema Settings Base DN User Object Filter The LDAP search base used as the starting point to search for the user data. (Optional) The string you want to use to create a search based on a location or filter other than the default search base or attribute. User Schema Settings (Optional, if you plan to use the LDAP server only as an LDAP query asset.) Username Attribute Attribute The attribute name on the LDAP server that contains the username for the account. This is often specified by the string samaccountname in Active Directory servers that may be used by LDAP. Contact your LDAP server administrator for the correct value. The attribute name on the LDAP server that contains the address for the account. This is often specified by the string mail in Active Directory servers that
240 Option may be used by LDAP. Contact your LDAP server administrator for the correct value. Phone Attribute Name Attribute The attribute name on the LDAP server that contains the telephone number for the account. This is often specified by the string telephonenumber in Active Directory servers that may be used by LDAP. Contact your LDAP server administrator for the correct value. The attribute name on the LDAP server that contains the name associated with the account. This is often specified by the string CN in Active Directory servers that may be used by LDAP. Contact your LDAP administrator for the correct value. Access Settings Organizations The SecurityCenter organizations you want to authenticate using this LDAP server. Advanced Settings Lowercase When enabled, SecurityCenter modifies the usernames sent by the LDAP server to use only lowercase characters. Tenable recommends keeping this option disabled. DNS Field The LDAP server parameter used in LDAP server requests to filter the returned asset data. Tenable recommends using the default value provided by SecurityCenter. Time Limit The number of seconds you want SecurityCenter to wait for search results from the LDAP server. Tenable recommends using the default value provided by SecurityCenter. Note: Access to Active Directory is performed via AD s LDAP mode. When using multiple AD domains, LDAP access may be configured to go through the Global Catalog. Port 3268 is the default non-ssl/tls setting, while port 3269 is used for SSL/TLS connections by default. More general information about LDAP searches via the Global Catalog may be found at: For more information, see Add an LDAP Server and Delete an LDAP Server
241 Add an LDAP Server For more information about LDAP server options, see LDAP Servers. To add an LDAP server connection: 1. Log in to SecurityCenter as an administrator user. 2. Click Resources > LDAP Servers. 3. Click Add. 4. Type Server Settings, LDAP Schema Settings, User Schema Settings, and Access Settings as described in the options table. 5. If necessary, modify the default Advanced Settings. 6. Click Test LDAP Settings to validate the LDAP server connection. 7. Click Submit
242 Delete an LDAP Server To delete an LDAP server connection: Note: If you delete a connection to an LDAP server, the users associated with that server cannot log in to SecurityCenter. Tenable recommends reconfiguring associated user accounts before deleting LDAP server connections. 1. Log in to SecurityCenter as an administrator user. 2. Click Resources > LDAP Servers. 3. Click the gear icon next to the server connection you want to delete. 4. Click Delete. The Delete LDAP Server confirmation window appears. 5. Click Delete
243 LDAP Servers with Multiple OUs Tenable s SecurityCenter LDAP configuration does not support the direct addition of multiple Organizational Units (OUs) in the LDAP configuration page. Two deployment options are possible for those with multiple OUs. Option 1 (Recommended) Add a container (e.g., group) only for SecurityCenter users. Allow existing Active Directory users to become members of the newly created group. Use the Distinguished Name (DN) of this group as the Search Base. For example: CN=S- SecurityCenter,DC=target,DC=example,DC=com. When you complete these changes, new users who are members of this group can log in immediately. No restart is required. Example 1. Log in to SecurityCenter as an administrator user. 2. Click System > Configuration > LDAP
244
245 3. Log out. 4. Log in as the organizational user who manages the user in question. 5. Create the new user and set the LDAP Search String as =*
246 Option 2 Use a high level Search Base in the LDAP configuration. For example: DC=taarget,DC=example,DC=com. The example above could be used along with a Search String for global usage. As another example, you might use this search string, when used in the configuration, applies to all LDAP searches: memberof=cn=nested1,ou=cftest1,dc=target,dc=example,dc=com Note: This option is limited to 128 characters. Example 1. Log in to SecurityCenter as an administrator user. 2. Click System > Configuration > LDAP
247 3. Click Test LDAP Settings to test configurations. 4. Log out. 5. Log in as the organizational user who manages the user in question. 6. Create the new user:
248 7. Select LDAP as the Type

249 Log Correlation Engines Tenable s Log Correlation Engine (LCE) is a software module that aggregates, normalizes, correlates, and analyzes event log data from the myriad of devices within the infrastructure. LCE also has the ability to analyze logs for vulnerabilities. SecurityCenter performs vulnerability, compliance, and event management, but without LCE integration it does not directly receive logs or IDS/IPS events. With LCE integration, LCE processes the events and passes the results to SecurityCenter. LCE's close integration with SecurityCenter allows you to centralize log analysis and vulnerability management for a complete view of your organization s security posture. Tip: You can configure more than one Log Correlation Engine to work with SecurityCenter. To configure LCE servers in SecurityCenter: 1. Click Resources > Log Correlation Engines. The LCE Servers page appears: 2. Click Add. The Add LCE Server window appears:
250 3. Configure the General options, as follows: Option Name Host Check Authentication Name for the integrated Log Correlation Engine. Descriptive text for the integrated Log Correlation Engine. IP address of the integrated Log Correlation Engine. Whether SecurityCenter checks the status of authentication between itself and the LCE server
251 Option Organizations Organizations that can access data from the integrated Log Correlation Engine. 4. (Optional) To allow SecurityCenter to log in to the LCE server and retrieve vulnerability information: a. Enable Import Vulnerabilities. Additional options appear. b. Configure the following options: Option Repositories Port Username Password The repositories where you want SecurityCenter to store the imported LCE data. The port where the LCE reporter is listening on the LCE server. The username SecurityCenter uses to authenticate to the LCE server to retrieve vulnerability information. The password SecurityCenter uses to authenticate to the LCE server to retrieve vulnerability information. Note: These credentials are typically different than the username and password you use to configure the SSH key exchange in Step Click Submit. 6. (Optional) If you enabled the Check Authentication option above, SecurityCenter checks its ability to authenticate with the LCE server. If authentication is successful, SecurityCenter displays a message to acknowledge that fact. If authentication fails, SecurityCenter prompts you for credentials to the LCE server: a. Type a username and password. This user account must be able to make changes on the remote system to enable the SSH key exchange between SecurityCenter and LCE. The appropriate permissions level is typically root, root equivalent, or other high-level user permissions on the
252 LCE system. SecurityCenter uses these credentials a single time to exchange SSH keys for secure communication between SecurityCenter and LCE. Note: If remote root or root equivalent user login is prohibited in your environment, refer to the LCE key exchange section for instructions on how to manually configure the LCE server using SSH key authentication. b. Click Push Key to initiate the transfer of the SSH Key. If the transfer is successful, SecurityCenter displays a message to acknowledge that fact

253 Log Correlation Engine Clients The LCE server manages configuration files for LCE 5.x clients remotely from the command line. SecurityCenter manages the configuration files for LCE 5.x clients via a graphical interface. The default view for the LCE Clients page displays all of the available clients for the selected LCE server in the Filters section, and may be changed by updating the LCE Server filter. Use the other filter options, to narrow down the displayed clients for the selected server by a mix of criteria based on combinations of the displayed columns. Current LCE Client versions display information in the table including their name, host address, authorization status, client type, host OS, assigned policy file, date last updated, and client version. LCE Client configurations can be managed from SecurityCenter. Tip: Configured clients prior to version 5.x appear in the list without OS and policy information. However, these clients cannot have their policy files centrally managed from SecurityCenter. Each client may have a name assigned to it to help easily identify the client. The currently assigned name appears in the Name column. To change the name, click on the client to edit from the list, and type the name. Client names may not contain spaces. Click the Submit button to save the change. LCE Clients are initially configured to send their data to a particular LCE server, but must be authorized by the LCE sever for the server to accept the data. The client s authorization status appears in the leftside column. If there is no icon, the client is authorized to send data to the LCE server. If there is a broken link icon, the client is not authorized to send data to the LCE server. Toggle this by selecting the gear icon for the client and clicking either the Authorize or Revoke Authorization from the list as appropriate. Each client must have a policy assigned to it that specifies the appropriate data to send. The currently assigned policy appears in the Policy column. To change the assigned policy, select the client to edit

254 and click the appropriate policy from the drop-down box. Search client policies by name by entering text into the Policy box. Click the Submit button to save the change. The policy updates on the client on its next connection
255 Log Correlation Engine Client Policies The LCE Client Policies page contains a list of all the client policies currently available for use by LCE clients. The list contains the name of the policy, the operating system it is configured for use on, and the type of client the policy can be applied to. Example policy files are available for use with the names default and beginning with TNS-. You can use these policy files as is or export them to be used as a basis for custom policy files. Tenable may update or change these example policy files without notice, so using them as is may return different results at a later time. Use the Add button to add customized LCE Client policy files to the LCE server and make them available for use. The Name option is appended to the beginning of the file name and offers a description of the function or use of the policy file. The OS Type is used in the file name to easily identify the OS for which the policy is designed. The Client Type indicates the LCE Client for which the policy is written. The Source option is used to select and upload the custom policy file or type the policy file into the box. Click the Submit button to save the policy file and send it to the LCE server. Note: The default and TNS prefixes should only be used by policies supplied by Tenable. If you use default or TNS as a prefix for custom policy files, they may be overwritten or manipulated. Select a policy, click the gear button drop-down menu, then click Export to save the policy to a local drive. The file is in XML format, which you can edit with standard text or XML editors
256 Select a policy, click the gear button drop-down menu, then click View to display the policy name and source of the policy in a window within SecurityCenter. You cannot edit the information from within this window. Note: For more information on creating LCE Client Policy files, see the LCE Client Guide available on the Tenable Support Portal
257 Analyze SecurityCenter Data See the following sections to analyze and respond to SecurityCenter data. Dashboards Assurance Report Cards Vulnerability Analysis Event Analysis Mobile Analysis Queries Filters Workflow Actions Reports
258 Dashboards The dashboards page displays vulnerability and event data using various predefined components. View the Dashboard page by simply logging in or selecting Dashboard from the Dashboard menu item. Tip: Because components draw from vulnerability, event, and other data sources, it is advisable to create and configure data sources before adding any components. The Dashboard page is configured with one or more dashboards that contain different views and layouts populated with components including tables and custom charts (e.g., bar, line, area, pie, and matrix). The dashboard tables and charts are fully customizable and allow data to be retrieved from various sources using a wide variety of configurations. Each of these component types allow you to view the vulnerability, event, ticket, user, and alert data in a way that provides instant analysis of the important data anomalies with the ability to drill into the underlying data set for further evaluation (vulnerability and event data only). Dashboard elements can also be shared between users or exported/imported to another SecurityCenter as required. SecurityCenter utilizes a matrix layout that provides for customizable displays based on the intersection of row and column data. These displays can integrate if-then-else logic to vary the display depending on the current state of the underlying data set. SecurityCenter provides many dashboard templates. The SecurityCenter feed provides new and updated dashboard templates created by Tenable s team based on industry standards and customer requests. For examples of SecurityCenter dashboards, please visit the SecurityCenter Dashboard blog at Working with Dashboards Dashboards allow SecurityCenter users to organize and consolidate components by named collections. For example, instead of having twenty discrete dashboard components on the initial login display, it is helpful to create multiple dashboards grouped by function, each with a subset of components. One dashboard could contain five components that are related to active scanning, a second one could contain seven more related to passive scanning, and so on. This collection of components allows for a more focused security analysis with the ability to drill into the desired data quickly and without confusion. The dashboard view can be changed by selecting the preferred dashboard from the Switch Dashboard drop-down box

259 Adding Dashboards To create a new dashboard, click Options > Add Dashboard on the right side of the Dashboard page. A new window displays the list of available dashboard template categories, along with options to create a custom dashboard or import a dashboard. Select categories by clicking on the box, which displays a list of available dashboards. Once chosen, a selection of template names and descriptions appear along with a choice of sub-categories to further narrow the list. When viewing the details of a template, many options, including the name, description, schedule, and systems to focus the dashboard on, may be customized before adding it to your
260 dashboard collection. Select the Add button at the bottom of a dashboard template to add that template to the dashboard. If Import Dashboard is selected, a dialog window appears. This window provides options to name the dashboard and browse to the dashboard file to be imported from the local computer. After the selections are completed, click the Submit button to create the new dashboard. If Advanced is selected, a window opens to provide the name, description, and layout of the new dashboard. Submit this information to create the dashboard. Select the new dashboard from the Switch Dashboard menu to display a blank dashboard and allow for editing of the dashboard to add components. The components may be selected from the templates already provided or by creating a custom component. See Working with Components for information about how to create, edit, and delete custom dashboard components. Add Component Click on Add Component to display the list of available dashboard component template categories. Click on the box to select a category and display a list of available components. Once chosen, a selection of template names and descriptions appear and a choice of sub-categories may be available to further narrow the list. Select an individual template to open the properties of the component to provide details. The Name,, [update] Schedule, and focus of the data may be modified. Click the Add button at the bottom to add the component to the currently selected dashboard. In the Actions section, you can create custom charts and graphs to add as a component of the dashboard
261 See Working with Components for information about how to create, edit, and delete custom dashboard components. Options Option Add Dashboard Manage Dashboards Export Dashboard (Available from the Manage This option allows you to add a new dashboard to SecurityCenter. New dashboards may be created from templates or created by adding individually created components to the page. This option displays a list of available dashboards. This list helps to easily view pertinent information about their permissions, availability status, and last modification time. The list may be narrowed using the filters option. Click the gear icon on the right of the dashboard information to enable a menu to access the view, edit, share, export, copy, and delete functions. The Options drop-down menu provides the ability to import dashboards is available or the ability to change back to the dashboard view. Dashboards can be exported as XML files for use on other SecurityCenter systems. This is particularly useful where complex component definitions have been created and must be used in other locations. This function provides three options for component objects:
262 Option Dashboards page) Remove All References all object references are removed, altering the definitions of the components. Importing users do not need to make any changes for components to be useable. Keep All References object references are kept intact. Importing users must be in the same organization and have access to all relevant objects for the components to be useable. Replace With Placeholders object references are removed and replaced with their respective names. Importing users see the name of the reference object, but need to replace it with an applicable object within their organization before the component is useable. Note: Due to changes in the dashboard XML file formats over SecurityCenter versions, exported dashboards are not always compatible for import between SecurityCenter versions. Add Component Edit Dashboard Share Dashboard This option allows you to add individual components to the selected dashboard. Components may be added using available templates or creating a custom component. This option allows the user to edit an existing dashboard based on the options available in the dashboard configuration. These include the name, description, and layout of the dashboard. Use this function to share a Dashboard with any group in your current organization. Revoking a previously shared Dashboard may also be performed using this option. Additional steps must be taken to view a shared Dashboard. Send to Report Set as Default This options allows you to create a report from the Dashboard. Click this option to display a new window with options to name the report, provide a description, and determine the frequency (on demand, now, once, daily, weekly, or monthly) for running the report. Click Submit to create the report. A green report confirmation window appears at the bottom of the window with a link to view the report. The newly created report can also be viewed by clicking the Report option in the main menu. This option sets the Dashboard currently being used as the default dashboard for future visits to the page
263 Option Delete Dashboard Delete the selected dashboard. Working with Custom Components You can create custom components for dashboards. The components are various types of charts; Table, Bar, Pie, Line, Area, and Matrix. After selecting the desired component, options for data source and display must be entered to complete the process. The tables below show available options for each component type: Table Option General Name Schedule A name for the chart. A description for the chart. Frequency with which the component polls the data source to obtain updates. Available frequency options include: minutely (15 minutes, 20 minutes, 30 minutes), hourly (1 hours, 2 hours, 4 hours, 6 hours, 12 hours), daily (default) with a time of day, weekly repeating every 1-20 weeks and selection of the day(s) of week, monthly repeating every 1-20 months (by day or date), and never. Caution: Excessively frequent updates may cause the application to become less responsive due to the added processing load imposed on the host OS. Data Query Type Source Predefined query used to further narrow down the data source options. If a query does not exist or is not desired, it may be left unselected. The query may be used as is or as a template on which to base the Filters option. Vulnerability, Mobile, Event, Ticket, Alert, or User. For vulnerability data type, sources include Cumulative or Mitigated depending on the desired data source. For event type, the source defaults to Active. Note: The Source option is not available because only active event data is per
264 Table Option mitted for event-based components. Tool Filters Determines the analysis tool to use for creating the chart. Additional filters to use on the data source. Display Results Displayed Viewport Size Sort Column Sort Direction Display Columns The number of displayed results (maximum: 999). If the Viewport Size setting is smaller than this setting, the results display is limited to the Viewport Size setting with a scrollbar to display the additional results. The number of records (maximum: 50) to display along with a scrollbar to handle additional records. For example, if Results Displayed is set to 100 and Viewport Size is 15, 15 records are displayed with a scrollbar to view the additional 85 records. (Except Event Data Type) Column that the results are sorted by. (Except Event Data Type) Descending (default) or Ascending. Desired columns to be shown in the component output. Bar Option General Name Schedule A name for the chart. A description for the chart. Frequency with which the component polls the data source to obtain updates. Available frequency options include: minutely (15 minutes, 20 minutes, 30 minutes), hourly (1 hours, 2 hours, 4 hours, 6 hours, 12 hours), daily (default) with a time of
265 Bar Option day, weekly repeating every 1-20 weeks and selection of the day(s) of week, monthly repeating every 1-20 months (by day or date), and never. Caution: Excessively frequent updates may cause the application to become less responsive due to the added processing load imposed on the host OS. Data Query Type Source Predefined query used to further narrow down the data source options. If a query does not exist or is not desired, it may be left unselected. The query may be used as is or as a template on which to base the Filters option. Vulnerability, Mobile, Event, Alert, or Ticket. For vulnerability data type sources, include Cumulative or Mitigated depending on the desired data source. For event type, the source defaults to Active. Note: The Source option is not available because only active event data is permitted for event-based components. Tool Filters Determines the analysis tool to use for creating the chart. Additional filters to use on the data source. Display Results Displayed Sort Column Sort Direction Display Column The number of displayed results (maximum: 100). (Vulnerability/Ticket Data Type only) Column that the results are sorted by. (Vulnerability/Ticket Data Type only) Descending (default) or Ascending. Desired column shown in the component output
266 Pie Option General Name Schedule A name for the chart. A description for the chart. Frequency with which the component polls the data source to obtain updates. Available frequency options include: minutely (15 minutes, 20 minutes, 30 minutes), hourly (1 hours, 2 hours, 4 hours, 6 hours, 12 hours), daily (default) with a time of day, weekly repeating every 1-20 weeks and selection of the day(s) of week, monthly repeating every 1-20 months (by day or date), and never. Caution: Excessively frequent updates may cause the application to become less responsive due to the added processing load imposed on the host OS. Data Query Type Source Predefined query used to further narrow down the data source options. If a query does not exist or is not desired, it may be left unselected. The query may be used as is or as a template on which to base the Filters option. Vulnerability, Mobile, Event, or Ticket For vulnerability data type sources If Data Type of Vulnerability is chosen, sources include: Cumulative or Mitigated depending on the desired data source. For event type, the source defaults to Active. Note: The Source option is not available because only active event data is permitted for event-based components. Tool Filters Determines the analysis tool to use for creating the chart. Vulnerability, Event, or Ticket filters used to narrow down the series source. Display Results Displayed Sort The number of displayed results (default: 10). Column that the results are sorted by
267 Pie Option Column Sort Direction Display Columns Descending (default) or Ascending. Desired columns shown in the component output. Line/Area Option General Name Schedule A name for the chart. A description for the chart. Frequency with which the component polls the data source to obtain updates. Available frequency options include: minutely (15 minutes, 20 minutes, 30 minutes), hourly (1 hours, 2 hours, 4 hours, 6 hours, 12 hours), daily (default) with a time of day, weekly repeating every 1-20 weeks and selection of the day(s) of week, monthly repeating every 1-20 months (by day or date), and never. Caution: Excessively frequent updates may cause the application to become less responsive due to the added processing load imposed on the host OS. Data Date Type Date Range The date type can be relative to the current time when the chart is loaded or an absolute time frame that is the same on each page visit. Available options include: Last Minutes 15, 20, 30 Last Hours 1, 2, 4, 6, 12, 24 (default), 48, 72 Last Days 5, 7, 25, 50 Last Months 3, 6,
268 Line/Area Option Add/Edit Series Name Series name Data Data Type Note: For line/area charts, vulnerability data analysis often requires that the underlying repository be a trending repository. If the selected repository is not a trending repository, no historical analysis is available. Vulnerability or Event. Query Filters Predefined query used to further narrow down the data source options. If a query does not exist or is not desired, it may be left unselected. The query may be used as is or as a template on which to base the Filters option. Filters used to narrow down the series source. Display Series Data Data to display in the chart (Total, Info, Low, Medium, High, Critical). Matrix Option General Name A name for the chart. A description for the chart. Cells Size Column Creating a Matrix chart starts with defining the size. The matrix default is 4 columns by 4 rows, but may be any size from 1 column by 1 row to 10 columns by 10 rows. Click the Generate Cells link to create the initial blank matrix which may be populated and further defined with settings described below. Columns are normally used to define a group of vulnerability, mobile, event, ticket,
269 Matrix Option (max 10) user, or alert data. For example, five columns could be used in a matrix component, one each for critical, high, medium, low, and informational vulnerabilities. Hover the cursor over the right-hand side of the top cell of a column to display a dropdown box. The header drop-down box contains three options: Edit Header, Delete Cells, and Copy. Click on the Edit Header option to set the column name and update frequency. The update frequency determines how often the underlying data set is refreshed. Refreshing the data more often is useful for seeing a more current view of the data; however, it can have a detrimental effect on system performance. Matrix columns are updated as clusters and not individually. For example, if column A and C have an update frequency of Daily and column B has an update frequency of Every 12 Hours, columns A and C update together and column B updates by itself. This means that if there is a missing query in column A, column C does not update. However, if there is a missing query in column B, columns A and C update. Click on Delete Cells to delete the column of cells. There is not a confirmation window. Click on Copy to copy the current column, which may then be edited as needed. Once 10 columns exist, the Copy option is no longer available. Row (max 10) Rows are another grouping element, used to define the operations being performed against each column element for that row. For example, if each column determines the vulnerability type (critical, high, medium, low, and informational), a row could be created labeled Ratio. Each cell in that row could be used to calculate the ratio of the particular vulnerability type count against the total vulnerability count. Hover the cursor over the right-hand side of the cell in a row entry to display a drop-down box. The box contains options to Edit Header, Delete Cells, and Copy. Click on Edit Header to change the header name for the row. Click on Delete Cells to delete the row of cells. There is not a confirmation win
270 Matrix Option dow. Click on Copy to copy the current row, which may then be edited as needed. Once 10 rows exist, the Copy option is no longer available. Editing Cells Cells contain the actual data operations. Cells are defined by query and condition options. Click on a cell to modify the cell definition. The options are described below: Query Options Option Data Type Data Type Filters Rules Type Rule Available types include: Query Value, Static Text, Icon, Bar, and Ratio Available data types include vulnerability, mobile, event, ticket, alert, and user. The query value rules displayed in the condition section are dynamically defined by the data type used. For example, if a data type of Event is chosen, query value rules include Event Count, IP Count, or Port Count. Filter the data based on specific parameters. Available types include: Query Value, Static Text, Icon, Bar, and Ratio. Note: Bar and Ratio charts use ratios rather than counts in the lists below. Vulnerability: IP Count, Port Count, Score Count, and Vulnerability Count Mobile: Vulnerability Count, Device Count, and Score Count Event: IP Count, Port Count, Score Count, and Event Count
 rule and rule(s) that are added.")
271 Matrix Option Option Ticket: Ticket Count Alert: Alert Count User: User Count Display Options The display options determine the background and foreground colors along with any custom text, if applicable. Rules There are two basic types of rules in a matrix cell definition: the default (or fallback) rule and rule(s) that are added. By default, a single editable rule is added to each cell definition. This rule cannot be deleted and describes what appears in the cell if no other conditions have been defined or triggered. A default condition looks similar to the following: This rule can be edited to display any of the available display options. Added rules may look similar to the following:


272 When hovered over, a rule displays an edit and a delete icon. To save edits to a rule, click the checkmark icon or click the x icon to cancel the changes. Rules are reviewed from top to bottom and trigger the display rule on the first rule match. Once a rule triggers, none of the subsequent rules are reviewed. If none of the added rules match, the default rule is automatically performed. Creating a Simple Matrix Component The matrix component has a great deal of power and functionality. The following matrix component is an example of a simple matrix component: This shows percentages of hosts with exploitable vulnerabilities over the last 7 days and the exploit frameworks that can be used to exploit them. Modify and use the steps below based on your dashboard needs. To create a simple matrix component:
273 1. Open the dashboard you want to modify. 2. Click the Options drop-down box. 3. Click Add Component. The Add Component page appears. 4. In the Custom section, click Matrix. The Add Matrix Component page appears. 5. Type a Name for the component. 6. Type a you want to appear when hovering the over the component. 7. In the Cells section, select the number of Columns and Rows for the matrix. For example, 5 columns and 3 rows. 8. Click Generate Cells
274 The matrix editor appears. 9. Hover over the column and row header cells and click the gear icon drop-down menu. 10. Click Edit Header. 11. Type a Label for the column or row header. 12. Click Submit. The matrix editor appears, with the new header label displayed. 13. Repeat the header label steps for the other header cells. 14. Hover over the body cells and click the edit icon. The Add Matrix Component page appears. 15. Customize the matrix component options. For example, this matrix component displays Vulnerability data by a ratio from the Cumulative database. The numerator filters are looking for vulnerabilities that have an exploit available with a Critical severity and were discovered within the last 7 days. The Denominator filters are for vulnerabilities that have a Critical severity and were discovered within the last 7 days. The rules are looking for percentages of the vulnerabilities that match and designate the ratio value with the corresponding color based on the percentages found
275 16. Repeat the body cell steps for the other body cells. In the example above, the other cells are similar with many of the same rules. The differences are adding a Numerator filter to include the Exploit Framework we are looking for and a Denominator filter for the Exploit Available option

276 17. Click Submit. The matrix element appears. For more information about configuring matrix components and to download samples, visit the Tenable SecurityCenter Dashboards blog: Copy Component Options In addition to adding and editing components, components can be copied to the current or different Dashboard. Click on the gear icon in the top right corner of the component and choose Copy to bring up a copy component window over the existing component. The Copy option gives the user the ability to change the name of the component and the option of choosing the destination Dashboard from the drop-down menu where the component is copied. Navigating the Dashboard Components SecurityCenter users have several options when interacting with dashboard components. Hover over a component to display a gear icon drop-down menu and, when applicable, an arrow, both in the top right of the component. The gear icon contains options to Edit, Refresh, Copy, and Delete the component. The arrow allows users to browse the component dataset behind the broader numbers presented in the dashboard component. Click the browser s back button to return to the Dashboard view. Note: Various dashboards do not provide the browse option because their underlying data snapshot source does not support browse capability. Reorder dashboard components by clicking and holding the title bar, then dragging it to the new desired position on the page
277 The Refresh option refreshes the component data based on the most recent underlying data. A circular icon in motion appears as the component updates. The Delete option deletes the component from the dashboard. When selected a window opens asking for confirmation of the deletion of the component. The action cannot be undone
278 View a Shared Dashboard After a Dashboard is shared with a group, users in that group can pin the dashboard to their individual Dashboard pages. To view a shared dashboard: 1. Log in to SecurityCenter as a member of a group with access to the dashboard. 2. Click Dashboard > Dashboards. The Dashboards page appears. 3. Click the Options drop-down box. 4. Click Manage Dashboards. The Manage Dashboards page appears. 5. In the row for the dashboard, click the pin button. The shared Dashboard is enabled. 6. Click Dashboard > Dashboards. 7. Click the Switch Dashboard drop-down box. 8. Click the shared Dashboard. The shared dashboard appears
279 Assurance Report Cards Assurance Report Cards (ARCs) are a way to get an overview on the overall security posture of the network. These configurable reports provide quick visible feedback on what is important to you. Once the criteria are entered to create a new card, they report on a pass/fail methodology. A green box with a checkmark indicates that all the criteria are being met. A red box with an X indicates that one or more of the criteria is under the acceptable threshold and needs to be addressed. When the ARC is collapsed, the right side of the line displays a green check mark or red x to indicate a pass or fail for each of the Policy Statements that makes up the ARC. Clicking on the title of the ARC expands the ARC to display the individual Policy Statement titles and their information of percentage, ratio, or if the compliance/non-compliant state is a green (pass) or red (failure) state. Clicking on the Policy Statements displays an analysis page of the underlying data for further analysis. The ARCs may be reordered on the page by clicking the left indicator and dragging it to the new desired position. SecurityCenter is configured with several default ARC templates installed and ready for use. These are examples of what customers have asked for in various locations and are designed with industry best practices in mind. Adding ARCs

280 New ARCs may be added using templates or the Advanced Add link under the Options drop-down menu. Templates Templates offer a quick and easy way to add ARCs based on industry standards and may be edited for the local network. Clicking the Add button at the top of the ARC page, the templates page is displayed with the various categories displayed. The templates may be searched en mass by utilizing the Search Templates box at the top right of the page. Once the search is entered, it may be further narrowed down by utilizing the drop-down box that appears to the left of the box and categories may be selected. If a category is selected directly, ARC templates will be listed by name and description with their last update dates. Clicking on a template will lead to a fully detailed page about the template and offer the ability to view the details of the policy statements that make up the ARC, add the required assets, set the targets to focus on, configure the schedule to evaluate the ARC, and other details. Note: When selecting targets, if the same IP is in two different selected repositories, the results will become negatively skewed. After the ARC has been configured for the local environment, click the Add button at the bottom of the template page to save and add the newly configured ARC to the list. Advanced Add
281 To create a completely customized ARC, click the Advanced Add link from the Options drop-down menu. This will open a page to begin the process of creating a new ARC from scratch. Option General Name Schedule ARC Name ARC description Frequency with which the ARC polls the data source(s) to obtain updates. Available frequency options include: daily (default) with a time of day, weekly repeating every 1-20 weeks and selection of the day(s) of week, and monthly repeating every 1-20 months (by day or date). Policy Statements Basic Statement Display This is the line describing what the Policy Statement is evaluating for its pass/fail criteria. A selection of Ratio, Percentage, and Compliant/Non-Compliant result to be displayed for the statement
282 Option Advanced Data Type Base Filters Compliant Filters Compliant Condition DrillDown Filters The type of data to be analyzed: Vulnerabilities or Events. The filters used by the ARC to use as the basis for the data analysis The filters used by the ARC to determine the compliance conditions for the data analysis. See the Vulnerability or Event Analysis sections for details on the use of the filter options. Please note the filters set in the base filter are not present in the compliant filter, with exception of the Assets and Plugin IDs. All filters set in the base filter are carried over into the compliant filter. Determines the conditions to match for determining compliance. Settings include All, No, Any, greater than, less than, greater than or equal to, and less than or equal to. The conditions to match against are Hosts, Vulnerabilities/Events, and Ports. See the Vulnerability or Event Analysis sections for details on the use of the filter options. These are the filters used when clicking on the ARC Policy Statement for more details. See the Vulnerability or Event Analysis sections for details on the use of the filter options. Focus Targets This drop-down box offers the option to set the target hosts for the ARC to analyze. The options are All Systems, Assets, IPs, and Repositories. Assets may be selected using AND/OR/NOT logic when selecting multiple lists. Repositories to match against may be selected using the box next to the repository name. IPs may be entered using single addresses, CIDR, and range notation with multiple selections on separate lines. Repositories to match against may be selected using the box next to the repository name. Repositories to match against may be selected using the box next to the repository name. Note: When selecting targets, if the same IP is in two different selected repositories, the results will become negatively skewed. Options Drop-down Menu

 or not (grey and at an angle) for the current user.")
283 The following options are available under the Options drop-down menu in the top right corner of the ARC page: Expand All/Collapse All These options will expand or collapse all of the ARCs displayed on the page. Manage ARCs This link displays a list of all the available ARCs for ease of management. From this list, the ARCs may, at a glance, show the name, schedule, group, owner, and last modified time of the ARC. The pin icon on the left column indicates if the ARC is active (teal and straight) or not (grey and at an angle) for the current user. By utilizing the filters, a large list may be reduced to key
284 attributes of the ARCs being looked for. The filters include name, activation state, owner, group, and access to the user. Clicking on an ARC in the list displays the details of the ARC. These include the Name,, Schedule, Policy Statement names, focus, and other information. Clicking on the gear icon drop-down menu offers options to view, export, or copy the selected ARC. When viewing the manage ARCs page, the Options drop-down menu adds a link to View ARCs to return to the main view of the ARCs page. Advanced Add For details of this option, see the above Advance Add section under Adding ARCs
285 Vulnerability Analysis Path: Analysis > Vulnerabilities The Vulnerabilities page is the focal point for the display and analysis of vulnerabilities from either the cumulative or mitigated vulnerability database. Vulnerability data is displayed at varying levels and views ranging from the highest level summary down to a detailed vulnerability list data. When viewing the analysis tool results, clicking on a result generally takes you to the next level of detail for the analysis. For instance, from the IP summary page clicking on a host displays the Vulnerability List. Clicking on a vulnerability in that list displays the Vulnerability Detail page featuring that vulnerability. Along each progression, a new drop-down menu appears, allowing for easy access to either pivot to another analysis tool based on the current view or to return to the previous view. To view data on the Vulnerability Analysis page: 1. Log in to SecurityCenter as an organizational user with appropriate permissions. For more information, see User Roles. 2. Click Analysis > Vulnerabilities. The Vulnerability Analysis page appears. 3. If you want to switch to a different vulnerability analysis tool, see Vulnerability Analysis Tools
286 4. If you want to switch between the mitigated view and cumulative view, see Cumulative vs. Mitigated Vulnerabilities. 5. If you want to apply a filter, see Filters and Vulnerability Analysis Filter Components. 6. If you want to load a query: 1. Navigate to any page that supports filtering. 2. On the left side of the page, click the double arrow ( ). The Filters side bar expands. 3. Click Load Query. 4. Select the query you want to load. 5. Click Apply. 7. If you want to save a query: 1. In the upper-right corner, click the Options drop-down box. 2. Click Save Query 3. In the Name box, type a name. 4. (Optional) In the box, type a description. 5. (Optional) In the Tag drop-down box, select a tag. 6. Click Submit. 8. If you want to edit the columns that appear on the page: 1. In the upper-right corner, click the Options drop-down box. 2. Click View Settings. 3. Select or clear the check boxes to indicate which columns you want to appear. 9. If you want to manage your vulnerabilities: To create an accept risk rule, see Add an Accept Risk Rule. To create a recast risk rule, see Add a Recast Risk Rule
287 To export data as a a.csv or a.pdf file, see Export Vulnerability Data. To launch a remediation scan, see Launch a Remediation Scan. 10. If you want to save an asset: 1. In the upper-right corner, click the Options drop-down box. 2. Click Save Asset. 3. In the Name box, type a name. 4. (Optional) In the box, type a description. 5. (Optional) In the Tag drop-down box, select a tag. 6. Click Submit. 11. If you want to open a ticket, see Open a Ticket

 value, vulnerability count, and a breakdown")
288 Vulnerability Analysis Tools On the Vulnerability Analysis page, you can use the analysis tool drop-down box to select the vulnerability analysis tool you want to view. Analysis Tool IP Summary Class A Summary Class B Summary Class C Summary SecurityCenter has four tools for summarizing information by vulnerable IP addresses. These include summary by IP, Class A, Class B, and Class C. The IP Summary tool lists the matching addresses, their vulnerability score, the repository the data is stored in, the OS Common Platform Enumeration (CPE) value, vulnerability count, and a breakdown of the individual severity counts. The IP Summary tool displays a list of IP addresses along with summary information. Clicking on any of the column items for an IP address displays the Vulnerability List for that host
289 Analysis Tool The information icon next to the IP address displays the Host Detail information about the IP address. The System Information box displays information about the NetBIOS Name (if known), DNS Name (if known), MAC address (if known), OS (if known), Score, Repository, Last Scan, Passive Data, Compliance Data, and Vulnerabilities. The Assets box displays which asset lists the IP address belongs to. The Useful Links box contains a list of resources that can be queried by IP address. Clicking on one of the Resource links causes the resource to be queried with the current IP address. For example, if the current IP address was a publicly registered address, clicking on the ARIN link causes the ARIN database to be queried for the registration information for that address. If custom resources have been added by the administrator user (via the Manage IP Address Information Links selection under the Customization tab), they are displayed here. Starting out with a Class A or Class B summary can identify more active network ranges for networks with a large number of active IP addresses. Clicking on a Class A or Class B summary displays a summary of the next class size down. Clicking on a Class C summary displays an IP summary. The vulnerability score for an address is computed by adding up the number of vulnerabilities at each severity level and multiplying it with the organization s severity score. The default severity scores at each level are: Info - 0 Low 1 Medium


290 Analysis Tool High 10 Critical 40 Severity scores for Low, Medium, High, and Critical are configured for each organization by the administrator user. The OS CPE value may be used to determine the operating system reported on the target host. All displayed columns can be sorted for more useful views. Asset Summary This tool summarizes the scores and counts of vulnerabilities for all dynamic or static asset lists. A breakdown of each asset s specific vulnerabilities and counts for each severity level is also included. Clicking on any of the counts displays a Vulnerability List page with the corresponding filter. CCE Summary This displays a summary of hosts which have Common Configuration Enumeration (CCE) vulnerabilities. Clicking on the count for any of CCE ID s hosts or vulnerability counts displays an appropriate summary page, which is used to further examine the data. CVE Summary This view groups vulnerabilities based on their CVE ID, Hosts Total, and vulnerability count. DNS Name Summary SecurityCenter includes the ability to summarize

291 Analysis Tool information by vulnerable DNS name. The DNS Name Summary lists the matching hostnames, the repository, vulnerability count, and a breakdown of the individual severity counts. Clicking on a DNS name displays the vulnerability list of that particular host. List Mail Clients SecurityCenter uses NNM to determine a unique list of clients. The list contains the client name, count of detections, and the detection method. Clicking on the count displays the IP Summary page of the matching addresses using that client. List OS SecurityCenter understands both actively and passively fingerprinted operating systems. This tool lists what has been discovered. The method (active, passive, or event) of discovery is also indicated. Clicking on the count displays the IP Summary page with the corresponding filter. List Services SecurityCenter processes information from scans and creates a summary of unique services discovered. The service discovered, count of hosts, and detection method are listed. Clicking on the service displays the IP Summary page with the corresponding filter. List SSH Servers This tool utilizes active and passive scan results to create a unique list of known SSH servers. The list contains the ssh server name, count of detections, and the detection method. Clicking on the count displays the IP Summary page of matching addresses using that SSH server
292 Analysis Tool Tip: Not all SSH servers run on port 22. Do not be surprised if you encounter SSH servers running on unexpected ports. List Software SecurityCenter processes information from scans and creates a summary of unique software packages discovered. The software name, count of hosts, and detection method are listed. Clicking on a software name displays the IP Summary page with the corresponding filter. List Web Clients SecurityCenter understands NNM plugin ID 1735, which passively detects the web client in use. This tool lists the unique web clients detected. The list contains the user-agents, count of detections, and the detection method. Clicking on the count displays the IP Summary page of matching addresses using that web client. List Web Servers This tool takes the passive output from passive and active scans to create a unique list of known web servers. The list contains the web server name, count of detections, and the detection method. Clicking on the count displays the IP Summary page of matching addresses using that web server. Tip: Not all web servers run on port 80 or 443. Do not be surprised if you encounter web servers running on unexpected ports. MS Bulletin Summary This tool filters vulnerabilities based on Microsoft Bulletin ID. Displayed are the IDs, Vulnerability Totals, Host Total, and Severity. This view is particularly useful in cases where Microsoft releases a
293 Analysis Tool new bulletin and a quick snapshot of vulnerable hosts is required. Plugin Family Summary This tool will chart each present the Nessus, NNM, or Event plugin family as well as their relative counts based on severity level for all matching vulnerabilities. Clicking on any of the counts displays a Vulnerability List page filtered by the selected plugin family. Port Summary Protocol Summary A summary of the ports in use is displayed for all matched vulnerabilities. Each port has its count of vulnerabilities as well as a breakdown for each severity level. Clicking on any port count displays the IP Summary page with the corresponding filter. This tool summarizes the detected IP protocols such as TCP, UDP, and ICMP. The tool also breaks out the counts for each protocol s severity levels. Clicking on any of the counts displays the IP Summary page with the corresponding filter. Remediation Summary The Remediation Summary tool provides a list of remediation actions that may be taken to prioritize tasks that have the greatest effect to reduce vulnerabilities in systems. This list provides a solution to resolve a particular CPE on a given OS platform. The data provided includes: Risk Reduction - The score of the vulnerabilities that would be remediated by performing the remediation action over the total score of all vul
294 Analysis Tool nerabilities returned by the query as a percentage. Hosts Affected - The number of unique hosts that would be affected by performing the remediation action. Vulnerabilities - The count of vulnerabilities(nessus plugins) that would be remediated by performing the remediation action. Score - This is calculated by adding up the score for each vulnerability that would be remediated by performing the remediation action. CVE - The number of distinct CVEs that would be remediated by performing the remediation action. MS Bulletin - The number of unique MS Bulletins that would be remediated by performing the remediation action. Vulnerability % - The count of vulnerabilities (Nessus plugins) that would be remediated by performing the remediation action over the total vulnerability count returned by the query as a percentage. Severity Summary This tool considers all of the matching vulnerabilities and then charts the total number of info, low, medium, high, and critical vulnerabilities. Clicking on any of the counts or severities in the chart displays the Vulnerability Summary chart filtered with the matched vulnerabilities. User Responsibility Summary This displays a list of the users who are assigned responsibility for the vulnerability based on the user s assigned asset list. Multiple users with the same responsibility are displayed on the same
295 Analysis Tool line. Users without any assigned responsibilities are not displayed in the list. This list is populated when assets are assigned to users in the Users section. Vulnerability Summary All matching vulnerabilities are sorted by plugin ID count and listed in a chart. Columns of plugin ID, Total, and Severity can be sorted by clicking on the column header. Clicking on the information icon next to the plugin ID displays a window containing a description of the vulnerability check. Vulnerability List This tool lists out the Plugin ID, Name, Family, Severity, NetBIOS Name, DNS Name, MAC Address, and Repository Name for each matching vulnerability. Clicking on any item displays a window that shows the Detailed Vulnerability List for that IP address. Clicking on the information icon next to the plugin ID displays a window containing the plugin details. Vulnerability Detail List This view shows the actual results of a vulnerability scan. Nessus, NNM, and LCE return very detailed results from their analysis of network systems. Important options include CVSS score, CVSS temporal score, availability of public exploit, CVE/BID/other references, synopsis, description, and solution. Scroll arrows are displayed to the right of the vulnerability name for ease of browsing between vulnerabilities. The host information is displayed in the window for that IP address similar to that described in
296 Analysis Tool detail for the IP Summary view above. If there are any Common Vulnerability Enumeration (CVE) or Bugtraq IDs (BIDs), they are listed for further research as desired. This display has links to accept this risk or recast it to a different severity level (cumulative database vulnerabilities only). A ticket may be opened against the vulnerability being viewed from the Options drop-down menu in the top right of the page
297 Cumulative vs. Mitigated Vulnerabilities SecurityCenter uses the scan definition, the results of the scan, the current state of the cumulative view, and authentication information to determine if a vulnerability is mitigated. To start, the vulnerability must be present in the cumulative view to be considered for mitigation. The import process then looks at each vulnerability in the import repository. The vulnerability is identified as mitigated if: The IP of the vulnerability was in the target list of the scan. The plugin ID of the vulnerability was in the list of scanned plugins. The port of the vulnerability was in the list of scanned ports. The vulnerability with that IP/port/pluginID combination was not in the scan result. The import process also verifies that authentication was successful before mitigating any local check vulnerabilities that meet the above criteria. Note: Mitigation logic works with scans using policies defined by templates, advanced policies, and remediation scans. These policies are set up to take advantage of this new mitigation logic. Choose the new severity risk level to assign to the current vulnerability and the selected filter options (Repository, Targets, Ports, and Protocol). If any of the selected options are modified, they filter what vulnerabilities will inherit the new risk rating. In addition, a comment can be added to describe why the risk is being recast. Note: There can be a short delay between clicking on Submit and vulnerabilities showing the new risk. It may be necessary to reload the filters to view the applied changes. To switch viewing mitigated or cumulative vulnerabilities: 1. Log in to SecurityCenter as an organizational user with appropriate permissions. For more information, see User Roles. 2. Click Analysis > Vulnerabilities. The Vulnerability Analysis page appears. 3. In the upper-right corner, click the Options drop-down menu. 4. Click Switch to Mitigated or Switch to Cumulative
298 The page updates to display data from the mitigated or cumulative vulnerability database: The cumulative database contains current vulnerabilities, including those that have been recast, accepted, or mitigated and found vulnerable on rescan. The mitigated database contains vulnerabilities that are no longer vulnerable based on current scan result information
299 Vulnerability Analysis Filter Components For general information about constructing filters, see Filters. Filter Component Accept Risk Availability Cumulative View Display vulnerabilities based on their Accepted Risk workflow status. Available choices include Accepted Risk or Non-Accepted Risk. Choosing both options displays all vulnerabilities regardless of acceptance status. Address All This filter specifies an IPv4 or IPv6 address, range, or CIDR block to limit the viewed vulnerabilities. For example, entering /24 and/or 2001:DB8::/32 limits any of the web tools to only show vulnerability data from the selected network(s). Addresses can be comma separated or separate lines. Application CPE All Allows a text string search to match against available CPEs. The filter may be set to search based on a contains, Exact Match, or Regex Filter filter. The Regex Filter is based on PCRE Asset All This filter displays systems from the chosen asset list. If more than one asset list contains the systems from the primary asset list (i.e., there is an intersect between the asset lists), those asset lists are displayed as well. The operators NOT, OR, and AND may be used to exclude unwanted asset lists from the view. Audit File All This filter displays vulnerabilities detected when a scan was performed using the chosen.audit file. CCE ID All Displays results based on the entered CCE ID. CVE ID All Displays vulnerabilities based on the chosen single CVE ID (e.g., CVE ) or multiple CVE IDs separated by commas (e.g., CVE ,CVE ,CVE ). CVSS Score All Displays vulnerabilities within the chosen CVSS score range. CVSS Vector All Filters results based on a search against the CVSS Vector information
300 Filter Component Cross Reference Availability All Filters results based on a search against the cross reference information in a vulnerability. DNS Name All This filter specifies a DNS name to limit the viewed vulnerabilities. For example, entering host.example.com limits any of the web tools to only show vulnerability data from that DNS name. Exploit Available Exploit Frameworks All All If set to yes, displays only vulnerabilities for which a known public exploit exists. When set, the text option can be equal to or contain the text entered in the option. IAVM ID All Displays vulnerabilities based on the chosen IAVM ID (e.g., 2011-A- 0007) or multiple IVAM IDs (e.g., 2011-A-0005,2011-A-0007,2012-A- 0004). MS Bulletin ID All Displays vulnerabilities based on the chosen Microsoft Bulletin ID (e.g., MS09-001) or multiple Microsoft Bulletin IDs separated by commas (e.g., MS10-012,MS10-054,MS11-020). Mitigated All Display vulnerabilities that were at one time mitigated, but have been discovered again in a subsequent scan. This option is not used in conjunction with other options unless all options within the selected combination are set (e.g., selecting the Was Mitigated box returns no results if both the Was Mitigated and the Accepted Risk flags are set). Output Assets Patch Published Plugin Family Asset Summary Analysis Tool All All This filter displays only the desired asset list systems. When available, Tenable plugins contain information about when a patch was published for a vulnerability. This filter allows the user to search based on when a patch became available; less than, more than, or within a specific count of days. This filter chooses a Nessus or NNM plugin family. Only vulnerabilities from that family display
301 Filter Component Availability Plugin ID All Type the plugin ID desired or range based on a plugin ID. Available operators are equal to (=), not equal to (!=), greater than or equal (>=) and less than or equal to (<=). Plugin Modified All Tenable plugins contain information about when a plugin was last modified. This filter allows users to search based on when a particular plugin was modified: less than, more than, or within a specific count of days. Plugin Name All Using the Contains option, type all or a portion of the actual plugin name. For example, entering MS in the plugin name filter displays vulnerabilities using the plugin named MS08-067: Microsoft Windows Server Service Crafted RPC Request Handling Remote Code Execution (958644) (uncredentialed check). Similarly, entering the string uncredentialed displays a list of vulnerabilities with that string in the plugin name. Using the Regex Match option regex options may be used to filter on the Plugin Name. Plugin Published All Tenable plugins contain information about when a plugin was first published. This filter allows users to search based on when a particular plugin was created: less than, more than, or within a specific count of days. Plugin Type All Select whether to view all plugin types or passive, active, event, or compliance vulnerabilities. Port All This filter is in two parts. First the equality operator is specified to allow matching vulnerabilities with the same ports, different ports, all ports less than or all ports greater than the port filter. The port filter allows a comma separated list of ports. For the larger than or less than filters, only one port may be used. Note: All host-based vulnerability checks are reported with a port of 0 (zero)
302 Filter Component Availability Protocol All This filter provides boxes to select TCP, UDP, or ICMP-based vulnerabilities. Recast Risk Cumulative View Display vulnerabilities based on their Recast Risk workflow status. Available choices include Recast Risk or Non-Recast Risk. Choosing both options displays all vulnerabilities regardless of recast risk status. Repositories All Display vulnerabilities from the chosen repositories. STIG Severity All This filter maps to the stigseverity column in the plugins database. Scan Policy All This filter chooses a scan policy. Only vulnerabilities from that scan policy display. Severity All Displays vulnerabilities with the selected severity (Info, Low, Medium, High, Critical) Users All Allows selection of one or more users who are responsible for the vulnerabilities. Vulnerability Discovered All SecurityCenter tracks when each vulnerability was first discovered. This filter allows the user to see when vulnerabilities were discovered less than, more than, or within a specific count of days. Note: The discovery date is based on when the vulnerability was first imported into SecurityCenter. For NNM, this date does not match the exact vulnerability discovery time as there is normally a lag between the time that NNM discovers a vulnerability and the import occurs. Note: Days are calculated based on 24-hour periods prior to the current time and not calendar days. For example, if the report run time was 1/8/2012 at 1 PM, using a 3-day count would include vulnerabilities starting 1/5/2012 at 1 PM and not from 12:00 AM. Vulnerability Last Observed Cumulative View This filter allows the user to see when the vulnerability was last observed by Nessus, LCE, or NNM
303 Filter Component Availability Note: The observation date is based on when the vulnerability was most recently imported into SecurityCenter. For NNM, this date does not match the exact vulnerability discovery as there is normally a lag between the time that NNM discovers a vulnerability and the import occurs. Vulnerability Mitigated Vulnerability Published Mitigated View All This filter allows the user to filter results based on when the vulnerability was mitigated. When available, Tenable plugins contain information about when a vulnerability was published. This filter allows users to search based on when a particular vulnerability was published: less than, more than, or within a specific count of days. Vulnerability Text All Displays vulnerabilities containing the entered text (e.g., php 5.3) or regex search term
304 Add an Accept Risk Rule If you create an accept risk rule, any vulnerabilities that match the rule are automatically accepted. Risk accepted vulnerabilities do not appear in a vulnerability search if your filter excludes Accepted Risk vulnerabilities. To view or delete accept risk rules, see Accept Risk Rules. To add an accept risk rule: 1. Log in to SecurityCenter as an organizational user with appropriate permissions. For more information, see User Roles. 2. Click Analysis > Vulnerabilities. The Vulnerability Analysis page appears. 3. Click the analysis tools drop-down box and select Vulnerability Detail List, Vulnerability List, or Vulnerability Summary. The page refreshes to show the analysis tool view you selected. 4. In the row for the vulnerability you want to recast, click the gear icon. 5. Click Accept Risk. 6. (Optional) In the Comment box, add a comment. 7. (Optional) In the Expires box, select the date you want the accept risk rule to expire. 8. Click Submit. Note: There can be a short delay between clicking on Submit and vulnerabilities showing the new risk acceptance. It may be necessary to reload the filters to view the applied changes
305 Add a Recast Risk Rule If you create a recast risk rule, any vulnerabilities that match the rule are automatically set to the severity you specified in the rule. To view or delete recast rules, see Recast Risk Rules. To add a recast risk rule: 1. Log in to SecurityCenter as an organizational user with appropriate permissions. For more information, see User Roles. 2. Click Analysis > Vulnerabilities. The Vulnerability Analysis page appears. 3. Click the analysis tools drop-down box and select Vulnerability Detail List, Vulnerability List, or Vulnerability Summary. The page refreshes to show the analysis tool view you selected. 4. In the row for the vulnerability you want to recast, click the gear icon. 5. Click Recast Risk. 6. In the New Severity drop-down box, select a new severity for the vulnerability. 7. (Optional) In the Comment box, add a comment. 8. In the Repository section, select one or more repositories where you want to apply the rule. 9. Click Submit. Note: There can be a short delay between clicking on Submit and vulnerabilities showing the new risk. It may be necessary to reload the filters to view the applied changes
306 Export Vulnerability Data You can export data from the Vulnerability Analysis page as a.csv or a.pdf file. To export data from the Vulnerability Analysis page: 1. Log in to SecurityCenter as an organizational user with appropriate permissions. For more information, see User Roles. 2. Click Analysis > Vulnerabilities. The Vulnerability Analysis page appears. 3. In the upper-right corner, click the Options drop-down box. 4. Click Export as CSV or Export as PDF. Note: If the record count (rows displayed) of any CSV export is greater than 1,000, SecurityCenter prompts you for the name of the CSV report you want to generate. After generation, you can download the report from the Report Results page. 5. Select or clear the check boxes to indicate which columns you want to appear in the exported file. 6. Click Submit
307 Launch a Remediation Scan A remediation scan is a type of active scan. It evaluates a specific plugin against a specific target or targets where the related vulnerability was present in an earlier scan. Remediation scans allow you to validate whether your vulnerability remediation actions on the targets have been successful. If a remediation scan cannot identify a vulnerability on targets where it was previously identified, the system changes the status of the vulnerability instances to mitigated. For more information, see Cumulative vs. Mitigated Vulnerabilities. Note: If the selected plugin requires dependent plugins, the system automatically includes those plugins in the remediation scan. Remediation scans are intended for use with active scan results. Remediation scans are also available for agent scan results, but keep in mind that a remediation scan launches an active scan against the target, not an agent scan. Remediation scans are not available for passive scan or event scan results. Remediation scans only evaluate plugins against the port you specify. Keep this in mind when launching a remediation scan for a plugin that typically targets multiple ports. Remediation scans work best for un-credentialed network scan results. Use caution when running a remediation scan for a plugin that requires scan credentials. If you neglect to add scan credentials when required for a specific plugin, or if you mis-enter the credentials, the system may identify the related vulnerabilities as mitigated, not because they are mitigated, but because the system could not complete the credentialed scan. To launch a remediation scan: 1. Log in to SecurityCenter as an organizational user with appropriate permissions. For more information, see User Roles. 2. Click Analysis > Vulnerabilities. The Vulnerability Analysis page appears. 3. Click the analysis tools drop-down box and select Vulnerability Detail List, Vulnerability List, or Vulnerability Summary. The page refreshes to show the analysis tool view you selected. 4. In the row for the vulnerability you want to recast, click the gear icon
308 5. Click Launch Remediation Scan. The Launch Remediation Scan page appears. A remediation scan inherits certain settings from the vulnerability instance you selected. The Launch Remediation Scan page: Automatically populates the relevant plugin information. Provides an editable scan name in the format "Remediation Scan of Plugin # number". Populates the target IP address based on the asset where the previous scan identified the vulnerability. 6. Configure the settings for the scan, as described in Active Scans. Note: You do not need to associate the remediation scan with a scan policy. Note: You cannot schedule a remediation scan. The scan launches as soon as you submit it. 7. Click Submit

309 Event Analysis The Events display page contains an aggregation of security events from Tenable s Log Correlation Engine. Events can be viewed in a list format with options similar to the Vulnerability interface. Clicking through Analysis and Events displays a high-level view similar to the following: Raw Syslog Events SecurityCenter s event filters includes a Syslog Test option to narrow down the scope of a set of events, and supports the use of keyword searches for active filters. In the example above, a mix of collapsed and expanded events are seen. Selecting the Collapse All or Expand All option from the top right Options drop-down menu will perform that action for all of the results en masse. By selecting a particular event and clicking on the + or - icon on the right side of the event will expand or collapse that one event. Active vs. Archived

310 In the Options drop-down menu the view can be switched between the Active and Archived data. This selection determines whether the displayed events are pulled from the active or an archived event database. The Active view is the default that displays all currently active events. The Archived view prompts for the selection of the LCE and an Archive Silo from which the event data will be displayed. In the example below, the LCE and Silo date range are displayed to help the user choose the correct archive data for analysis. Analysis Tools A wide variety of analysis tools are available for comprehensive event analysis. Clicking on the dropdown menu indicating the current view (Type Summary by default) displays a list of analysis tools to choose from:
311 When viewing the analysis tool results, clicking on result will generally take you to the next level of detail for the analysis. For instance, from the Type summary page clicking on a type will display the Normalized Event Summary. Clicking on an even in that list will display the List of Events page featuring that event. Along each progression a new drop-down menu will appear allowing for easy access to either pivot to another analysis tool based on the current view or to return to the previous view. Additionally most results will have a gear icon next to them. This icon will provide summaries, normally based on time restrictions or a view of the vulnerability summary for the affected host, around that item s result. The table below contains detailed descriptions of all available analysis tools: Event Analysis Tools For more information, see Event Analysis Tools. Load Query The Load Query option enables users to load a predefined query and display the current dataset against that query. Click on Load Query in the filters list to display a box with all available queries. The query names are displayed in alphabetical order. After clicking on an individual query, the vulnerability view is changed to match the query view for the current dataset. Event Analysis Filters

312 For more information, see Event Analysis Filter Components. Options Drop-Down Menu The following options are available under the Options drop-down menu in the top right corner of the event analysis page: Save Query This option saves the current event view as a query for reuse. If this link is clicked, a dialog similar to the one below is displayed:
313 The table below describes the available query options: Query Options Option Name Query name This option enables users to provide a description of the query. Save Asset Event results can be saved to an asset list for later use by clicking on the Save Asset link in the top right side of the page
314 The table below describes the available asset options: Asset Options Option Name Asset name Asset description Save Watchlist A watchlist is an asset list that is used to maintain lists of IPs not in the user s managed range of IP addresses. IPs from a watchlist can be filtered on regardless of your IP range configuration. This proves to be beneficial when analyzing event activity originating outside of the user s managed range
315 For example, if a block of IP addresses is a known source of malicious activity, it could be added to a watchlist called Malicious IPs and added to a custom query. Selecting this option will save a Watchlist based on the current filters in use by the Event Analysis tool. Option Name Exclude Managed Hosts Watchlist name Asset description When selected, managed hosts will not be saved to the asset list with the unmanaged hosts. Open Ticket Tickets are used within SecurityCenter to assist with the assessment and remediation of vulnerabilities and security events. For more information, see Open a Ticket. View Settings When available, this setting controls the columns that are displayed for the selected analysis tool

316 Switch to Archived / Switch to Active The final item on the Options drop-down menu shows as either Switch to Archived or Switch to Active and Switch Archive, depending on the current view of event data. The Switch to Archived item is displayed when viewing active event data and when selected will present a dialog to choose the archived event data to display by LCE and date range

317 The Switch Archive menu item is displayed when viewing archived event data. Selecting this option displays the same menu and selections as above to select a different archive silo for viewing. The Switch to Active menu item is displayed when viewing archived data and when selected, changes the view to active event data for analysis. Export as CSV Event results can be exported to a comma-separated file for detailed analysis outside of SecurityCenter by clicking on the Options drop-down menu and then the Export as CSV option. When selected, a window opens with an option to choose the columns to be included in the CSV file. If the record count (rows displayed) of any CSV export is greater than 1,000 records, a note is displayed that prompts for the name of the CSV report to be generated. When complete, the report can be downloaded from the Report Results page. For CSV exports of under 1,000 records, the browser s standard Save As dialog window is displayed. Once the appropriate selections are made, click the Submit button to create the CSV file or Cancel to abort the process
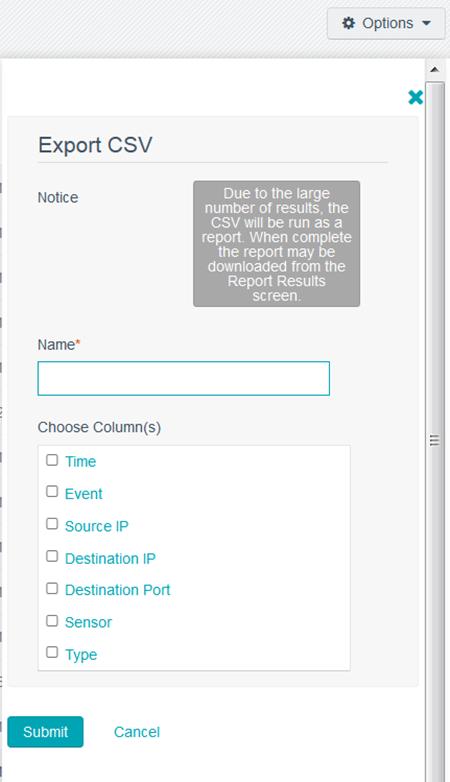
318
 displays a list of analysis tools to choose from: When viewing the analysis tool results, clicking on result will")
319 Event Analysis Tools A wide variety of analysis tools are available for comprehensive event analysis. Clicking on the dropdown menu indicating the current view (Type Summary by default) displays a list of analysis tools to choose from: When viewing the analysis tool results, clicking on result will generally take you to the next level of detail for the analysis. For instance, from the Type summary page clicking on a type will display the Normalized Event Summary. Clicking on an even in that list will display the List of Events page featuring that event. Along each progression a new drop-down menu will appear allowing for easy access to either pivot to another analysis tool based on the current view or to return to the previous view. Additionally most results will have a gear icon next to them. This icon will provide summaries, normally based on time restrictions or a view of the vulnerability summary for the affected host, around that item s result. Tool Asset Summary This tool can be used to see how certain types of activity, remote attackers, or non-compliant events have occurred across different asset groups. Clicking on the Total count for the listed asset displays a Type Summary analysis tool


320 Tool Connection Summary This tool lists connections made between two different hosts by source and destination IP address and the counts of connections between them. Clicking on a host will display the Type Summary analysis tool. Date Summary When analyzing large amounts of data, it is often useful to get a quick summary of how the data set manifests itself across several dates. For example, when analyzing a suspected attacker s IP address, creating a filter for that IP and looking at the type of events is simple enough. However, displaying that same data over the last few days or weeks can paint a much more interesting picture of a potential attacker s activity. Selecting a date will display the Type Summary analysis tool. Destination IP Summary This tool displays events listed by the destination IP recorded. The table lists the LCE it was discovered on, the IP address, and the count. Clicking on the information icon next to the IP displays the system information pertaining to the host IP address. Clicking on one of the hosts displays the Type Summary analysis tool. Detailed Event Summary This tool displays a summary of the various events based on their full event name and count. Clicking on an event displays the List of Events analysis tool. Event Trend This analysis tool displays an event trend area graph with total events over the last 24 hours

321 Tool Modify the filters for this graph to display the desired event trend view. IP Summary SecurityCenter provides the ability to quickly summarize matching IP addresses by single IP, Class A, Class B, and Class C addresses. The IP Summary tool displays the associated LCE server along with the IP address of the reporting system and about the event count for that system. Class A Summary Class B Summary Class C Summary Clicking on an IP address displays a Host Detail window for that IP address. Clicking the information icon next to the IP address displays information about the NetBIOS Name (if known), DNS Name (if known), MAC address (if known), OS (if known), Score, Repository, Last Scan, Passive Data, Compliance Data, and Vulnerability severity counts. The Assets box displays which asset lists the IP address belongs to. The Useful Links box contains a list of resources that can be queried by IP address. Clicking on one of the Resource links causes the resource to be queried with the current IP address. For example, if the current IP address was a publicly registered address, clicking on the ARIN link causes the ARIN database to be queried for the registration information for that address. If custom resources have been added by an administrative user (via the Manage IP Address Information Links selection under the Customization tab), they will be displayed here. The Sum by Class A, B, and C tools work by displaying matching addresses. Clicking on the num

322 Tool ber displayed in the Total column will display the Type Summary for that IP range. List of Events This tool displays a line of data for each matching event. The line includes many pieces of information such as time, event name, number of correlated vulnerabilities involved IP addresses, and sensor. Normalized Event Summary This tool summarizes a listing of all normalized events and their count for the chosen time period. Normalized events are lower-level events that have been assigned a Tenable name based on LCE scripts parsing of the log records (e.g., Snort- HTTP_Inspect). Clicking on the event name displays the List of Events analysis tool. Port Summary A port summary can be invoked. This tool produces a table of the top used ports and combines counts for source and destination ports into one overall count. Clicking on the port will display a Type Summary of events filtered for that port. Note: Port 0 events are host-based events that are not specific to any particular TCP/UDP port. Protocol Summary This tool summarizes counts of events based on IP protocols. Clicking on the event total displays a Type Summary view of events filtered by the selected protocol. Raw Syslog Events Users can choose to view the original log message

323 Tool or IDS event for full forensic analysis. It is recommended that users attempt some sort of filtering match first before attempting to find their desired event. Users will typically sort their results and drill into the list until they find what they are looking for before attempting to view the raw data. Sensor Summary This tool displays the unique event counts for any query from unique sensor types. When a sensor is clicked on, the Type Summary analysis tool is displayed for events from the selected sensor. Source IP Summary This tool displays events listed by the source IP recorded. The table lists the LCE it was discovered on, the IP address, and the count. Clicking on the information icon next to the IP displays the system information pertaining to the host IP address. Clicking on one of the hosts displays the Type Summary analysis tool. Type Summary This tool displays the matching unique event types and the number of corresponding events for each. The unique event types are based on normalized logs or events such as firewall, system, correlated, network and IDS. These types are high-level types used to describe event types (e.g., login or lce). Clicking on any of the event counts displays the Normalized Event Summary for the type. User Summary This tool displays the matching unique event types and the number of corresponding events for each user when user tracking is enabled in LCE. The unique event types are based on normalized logs such as firewall, system, correlated, network,

324 Tool and IDS. Clicking on any of the event counts under the Total column will display the Type Summary analysis tool
325 Event Analysis Filter Components Filters limit the results of the event data displayed and can be added, modified, or reset as desired. For more information, see Filters. The Event Analysis page also supports using a filter bar for filtering. To display the filter bar, click the gear icon Options button and select Show Filter Bar. To use the filter bar, type the name of a filter component. Then, select an operator from the dropdown that appears (e.g., = or!=). Then, type or select specific filter component criteria and click the checkmark button. Note: The Filter Bar does not display or adjust the time frame filter. Filter Component Address Asset Destination Address Destination Asset Destination Port Detailed Specifies an IP address, range, or CIDR block to limit the displayed events. For example, entering /24 limits any of the web tools to only show event data from that network. Addresses can be entered on separate lines or comma separated. Filter the event by asset list and select an asset list from those available or the NOT operator to exclude asset lists. After each list is added, the AND or OR operator are available to customize the combining of asset lists. Specifies an IP address or CIDR block to limit the displayed events based on destination. For example, entering /24 limits any of the analysis tools to only show event data with destination IPs in that block. Addresses can be comma separated. Filter the destination address of the event data by asset list and select an asset list from those available or the NOT operator to exclude asset lists. After each list is added, the AND or OR operator are available to customize the combining of asset lists. This filter is in two parts. First the type of filter can be specified to allow matching events with the same ports (=) or different ports ( ). The port filter may specify a single, comma separated list of ports or range of ports (e.g., ). This is the detailed event name given by the IDS vendor. For example, an event
326 Filter Component Event Direction LCEs Normalized Event Port received from a Snort sensor can have a detailed event name of DOUBLE DECODING ATTACK, which means that HTTP_INSPECT 119:2:1 fired and was sent to the LCE. Filter by event direction of All by default or select Inbound, Outbound, or Internal. Specify the LCE(s) to obtain events from by checking the box next to the choice(s). The name given to the event by the LCE after the LCE runs its PRM and TASL scripts against it. This filter is in two parts. First the type of filter can be specified to allow matching vulnerabilities with the specified ports (=), excluding ports ( ), ports greater than or equal to ( ), or ports less than or equal to ( ). The specified and excluding port filter may specify a single port, comma separated list of ports, or range of ports (e.g., ). Note: All host-based vulnerability checks are reported with a port of 0 (zero). Protocol Repositories Sensor Source Address Source Asset Source Port Specify the protocol of the event TCP, UDP, or ICMP. Specify the Repositories to obtain events from. The repositories may be searched using the search filter at the top. Multiple repositories may be selected from the list. Filter the events by sensor using the equal (=) or not equal (!=) operators. Specifies an IP address or CIDR block to limit the displayed events based on source. For example, entering /24 limits any of the analysis tools to only show event data with source IPs in that block. Addresses can be comma separated. Filter the source address of the event data by asset list and select an asset list from those available or the NOT operator to exclude asset lists. After each list is added, the AND or OR operator are available to customize the combining of asset lists. This filter is in two parts. First the type of filter can be specified to allow matching events with the same ports (=) or different ports ( ). The port filter may specify a
327 Filter Component single port, comma separated list of ports, or range of ports (e.g., ). Syslog Test Targeted IDS Events Timeframe (Raw Syslog Events Analysis Tool) String to search for within the filtered event. This filter box selects IDS events that have targeted systems and ports with vulnerabilities likely to be exploited by the detected attack. This is determined by comparing the host s vulnerabilities (CVE, etc.) against those tied to the actual IDS event. Tip: This filter is always used. By default, it is set for the last 24 hours, based on the time of the page load. An explicit timeframe using the last 24 hours is displayed by default. Specify either an explicit or relative timeframe for the event filter. Choosing explicit allows for selecting dates and times from a calendar and time sliders for the start and end time. Relative timeframes, available from the drop-down box, range using various time periods from the last 15 minutes to the last 12 months and All. Type User The event type (e.g., error, lce, login, intrusion, etc.) to be filtered on. Specify only events tied to a particular username. Clicking on Clear Filters causes the filters to return to the default settings
328 Mobile Analysis The Mobile analysis page displays lists of vulnerabilities discovered by scanning an ActiveSync, Apple Profile Manager, AirWatch, Good, and/or MobileIron MDM servers. Mobile Filter Options For more information about filtering, see Filters. Option Analysis Tool Filter Analysis Tool Active Filters This drop-down box is used to choose the analysis tool used by the filter. This is the same as selecting the desired analysis tool from the Analysis > Mobile dialog. Displays the existing filters and allows the user to selectively remove filters as needed. Filters Identifier MDM Type Model Operating System CPE Plugin ID Plugin Output Repositories Serial Number Severity A text based search filter that looks at the Identifier option in the repository. A drop-down box to select the MDM server type of ActiveSync, Apple Profile Manager, Good, AirWatch, and MobileIron MDM server. A text based search filter that looks at the Model option in the repository. A text based search filter that looks at the Operating System CPE option in the repository. Type the Plugin ID to filter results on. Filter results based on a text search of plugin output. Display vulnerabilities from the chosen repositories. This is a text based search filter that looks at the Serial Number option in the repository. Displays vulnerabilities with the selected severity (Info, Low, Medium,

329 Option High, Critical). Username Version Vulnerability Last Observed (Cumulative only) This is a text based search filter that looks at the User option in the repository. This is a text based search filter that looks at the OS Version option in the repository. This filter allows the user to see when the vulnerability was last observed. Options Drop-Down Menu The following options are available under the Options drop-down menu in the top right corner of the event analysis page: Save Query This option saves the current mobile view as a query for reuse. If this link is clicked, a dialog similar to the one below is displayed:
330 Query Options Option Name Query name This option enables users to provide a description of the query. Export as CSV Mobile results can be exported to a comma-separated file for detailed analysis outside of SecurityCenter by clicking the Options drop-down menu and then the Export as CSV option. When selected, a window opens with an option to choose the columns to be included in the CSV file. If the record count (rows displayed) of any CSV export is greater than 1,000 records, a note is displayed that prompts for the name of the CSV report to be generated. When complete, the report can be downloaded from the Report Results page. For CSV exports of under 1,000 records, the browser s standard Save As dialog window is displayed. Once the appropriate selections are made, click the Submit button to create the CSV file or Cancel to abort the process
331
332 Queries The Queries page displays a list of queries available for use. The information provided includes Name, Type, Group, Owner, and the Last Modified time. You can use a filter to narrow the list by any of the columns (except Last Modified). For more information, see Filters. To add a query, see Add a Query. Clicking on the Query Name will display an edit page, if sufficient permissions exist, and allow for modifying the selected query. Query Options Queries provide the ability to save custom views of vulnerability, event, ticket, user, and alert data for repeated access
333 The following options are shared across all query types. Option Name Tag Type The name used to describe the query. Descriptive text for the query. A logical grouping for created asset objects. This reduces lengthy lists of assets with no logical grouping. Tags can be reused as desired and previously created tags will display in the tag option when subsequent assets are added. Objects shared with new users will retain the tag specified by the creator. The type of data you want the query to use. For more information about the filter components for Vulnerability, Event, and Mobile data types, see Vulnerability Analysis, Event Analysis, and Mobile Analysis. For more information about the filter components for Ticket, User, and Alert data types, see Ticket Query Options, User Query Options, and Alert Query Options Tool Chooses the analysis tool used by the query. Ticket Query Options Ticket queries are a useful way of determining what tickets to alert against. For example, if you want to be alerted when a user named Joe is assigned a ticket, you could create a query with a ticket filter based on the Assignee value of Joe. You could then create an alert to you when Joe was assigned a ticket. The table below contains a list of the ticket query options. Option Name Status Classification Owner Assignee Created Timeframe Ticket name to filter against Ticket status to filter against. The ticket classification to filter against. The manager (owner) of the ticket assignee. The ticket assignee to filter against. Ticket creation date/time to filter against. Either specify an explicit timeframe, including the start and end time or choose one of the predefined periods (e.g.,
334 Option last 15 minutes, last hour, etc.) Assigned Timeframe Modified Timeframe Resolved Timeframe Closed Timeframe Ticket assigned date/time to filter against. Either specify an explicit timeframe, including the start and end time or choose one of the predefined periods (e.g., last 15 minutes, last hour, etc.) Ticket modified date/time to filter against. Either specify an explicit timeframe, including the start and end time or choose one of the predefined periods (e.g., last 15 minutes, last hour, etc.) Ticket resolution date/time to filter against. Either specify an explicit timeframe, including the start and end time or choose one of the predefined periods (e.g., last 15 minutes, last hour, etc.) Ticket closed date/time to filter against. Either specify an explicit timeframe, including the start and end time or choose one of the predefined periods (e.g., last 15 minutes, last hour, etc.) User Query Options User queries are useful for reporting, dashboards and alerts based on user actions. For example, it can be used for tracking user logins and locked accounts. It could also be used to track user logins from accounts not authorized on the monitored systems. Option First Name Last Name Username Group Role Last Login Timeframe Account User first name to filter against. User last name to filter against. Actual username to filter against. Filter against the group the user(s) belong to. Filters against users who have the specified role. Filters against users based on their address. Filters against users whose last login was that the timeframe specified. Either specify an explicit timeframe, including the start and end time or choose one of the predefined periods (e.g., last 15 minutes, last hour, etc.). Filters against the user account state (locked vs. unlocked)
335 Option State Alert Query Options The Alert query is useful for reporting, dashboards and alerting when an alert has triggered. This is useful for situations where a report, dashboard element or conditional alert is required after the specified alert filter conditions have been met. For example, a daily report could be scheduled containing a query of all active alerts and their details. Option Name State Created Timeframe Modified Timeframe Last Triggered Timeframe Last Evaluated Timeframe Filter against alerts with the specified name. Filter against alerts with the specified description. Choose from All, Triggered, or Not Triggered. Filters against the alert creation timeframe specified. Either specify an explicit timeframe, including the start and end time or choose one of the predefined periods (e.g., last 15 minutes, last hour, etc.). Filters against the most recent alert modification timeframe specified. Either specify an explicit timeframe, including the start and end time or choose one of the predefined periods (e.g., last 15 minutes, last hour, etc.). Filters against the most recent alert trigger timeframe specified. Either specify an explicit timeframe, including the start and end time or choose one of the predefined periods (e.g., last 15 minutes, last hour, etc.). Filters against the most recent alert evaluation timeframe specified. Either specify an explicit timeframe, including the start and end time or choose one of the predefined periods (e.g., last 15 minutes, last hour, etc.)
336 Add a Query You can add queries from the Queries page or from the Vulnerability Analysis, Event Analysis, or Mobile Analysis pages. For more information about query options, see Queries. Note: If you want to create a mitigated vulnerabilities query, you must add the query from the Vulnerability Analysis page. To add a query from the Queries page: 1. Log in to SecurityCenter as an organizational user with appropriate permissions. For more information, see User Roles. 2. Click Analysis > Queries. The Queries page appears. 3. Click Add. 4. Type a Name and. 5. (Optional) If you want to add a tag, select a Tag from the drop-down. 6. Select a Type. The Tool drop-down updates with options for that type. 7. Select a Tool. 8. Click Add Filter. The Filters section expands. For more information, see Filters. 1. Select a filter component from the Select a Filter drop-down. The filter component criteria box appears. 2. In the filter component criteria box, type or select filter component criteria. 3. Click the apply icon ( ). The filter component is added. 9. (Optional) To add other filter components, repeat step Click Submit
337 To add a query from the Vulnerability Analysis, Event Analysis, or Mobile Analysis page: 1. Log in to SecurityCenter as an organizational user with appropriate permissions. For more information, see User Roles. 2. Click Analysis > Vulnerabilities, Analysis > Events, or Analysis > Mobile. The analysis page appears. 3. Apply a filter for the query, as described in Apply a Filter. The page updates to reflect the filter you applied. 4. In the Options drop-down box, click Save Query. 5. Type a Name and. 6. (Optional) If you want to add a tag, select a Tag from the drop-down. 7. Click Submit
338 Filters You can apply filters on many pages of the SecurityCenter web interface to filter the data displayed on the page. After you build and apply a filter, the number next to the filter icon ( ) updates to indicate the number of filters currently applied to the list. You can build filters using one or more filter components with defined filter component criteria. Filter components are types of data (e.g., CVE ID or Severity). After you select a filter component, you specify the filter component criteria (e.g., a specific CVE ID or a specific severity level). For more information, see Apply a Filter. If you want to save a filter for repeated use, create a query as described in Queries
339 Apply a Filter You can use filters to narrow the data displayed on specific pages in the SecurityCenter web interface. Some pages expand the filter options in the left side bar and some expand the filter options in the right side bar. For more information, see Filters. To filter data on a SecurityCenter page with a left side bar: 1. Log in to SecurityCenter. 2. Navigate to any page that supports filtering. 3. On the left side of the page, click the double arrow ( ). The Filters side bar expands. 4. Click Select Filters. The filter components selection window appears
340 5. Select one or more filter component check boxes. 6. Click Apply. The Filters side bar updates to show the filter components you selected. 7. Click the box for the filter component. The filter component criteria selection window appears

341 8. Modify the filter component criteria. 9. Click OK. The Filters side bar updates to show the filter component criteria you modified. The Apply All button appears. 10. Click Apply All. The page updates to reflect the filter you applied. To filter data on a SecurityCenter page with an inline filter icon and right side bar:

342 1. Log in to SecurityCenter. 2. Navigate to any page that supports filtering. 3. Locate the filter icon ( ). The Filters side bar expands. 4. Click the box for a filter component. The filter component criteria selection window appears

343 5. Modify the filter component criteria. 6. Click Apply. The Filters side bar updates to show the filter component criteria you modified. The page updates to reflect the filter you applied
344 Workflow Actions Path: Workflow Workflow actions allow organizational users to configure and manage alerting, ticketing, and accept risk or recast risk rules. These functions allow the user to be notified of and properly handle vulnerabilities and events as they come in. For more information, see Alerts, Tickets, Accept Risk Rules, and Recast Risk Rules

345 Alerts Path: Workflow > Alerts SecurityCenter can be configured to perform actions, such as alerts, for select vulnerability or alert occurrences to various users regardless of whether the events correlate to a local vulnerability or not. Other alert actions include UI notification, ticket creation/assignment, remediation scans, launching a report, notification, and syslog alerting. Many actions can be assigned per ticket. The user is presented with the ability to Add from the main Alerts page, and from the gear icon dropdown menu Edit, Evaluate, View (view details of), and Delete alerts. The Evaluate option allows an alert to be tested whether it has met the configured time criteria or not. Clicking on an alert will take the user to the Edit Alert page for the selected alert
346 Option Name Schedule Behavior Type Alert name Descriptive text for the alert The setting will determine how often the alert checks for the conditions to be matched. Selections vary in frequency from 15 minutes to monthly. Selecting the option of Never will create the alert to be launched only on demand. If set to alert on the first occurrence, the alert will only trigger when the condition initially changes from false to true. The other option is to trigger on each detection of the true condition. Vulnerability, Event, or Ticket. Trigger IP Count Trigger on vulnerabilities or events whose IP count matches the given parameters. Unique Vulnerability/Event Count Trigger an alert when the vul

347 Option nerability/event count matches the given parameters. This option is set to Unique Vulnerability Count for vulnerability alerts and Event Count for event alerts. Port Count Trigger an alert when the events/vulnerabilities using a certain port number match the given parameters. Query Filters Add Actions The dataset to which the trigger condition will be compared. Apply advanced filters to the vulnerability or event data. The complete filter set may be created here, or if a Query was selected those parameters may be edited. See tables 8 and 10 for filter options. Adding actions will determine what the alert does with triggered events. The options are Assign Ticket, , Generate Syslog, Launch Scan, Launch Report, or Notify Users. Multiple actions may be triggered for each alert. The configuration of each of these actions is described in the next table. Clicking Add Actions will present you with the following options: Tip: Use alerts to interface with third-party ticketing systems by adding variables in the message option
348 Option Subject Message Subject line of the alert . Message of the alert . Within the message body, the following variables can be defined for message customization: Alert ID Designated with the variable: %alertid%, this specifies the unique identification number assigned to the alert by SecurityCenter. Alert name Designated with the variable: %alertname%, this specifies the name assigned to the alert (e.g., Test alert ). Trigger Name Designated with the variable: %triggername%, this specifies if the trigger is IP count, Vulnerability count, or Port count. Trigger Operator Designated with the variable: %triggeroperator%, this specifies which operator was used for the count: >=, =, >= or!= Trigger value Designated with the variable: %triggervalue%, this specifies the specific threshold value set that will trigger the alert. Calculated value Designated with the variable: %calculatedvalue%, this specifies the actual value that triggered the alert. Alert Name Designated with the variable: %alertname%, this specifies the name given to the alert within SecurityCenter. Alert owner Designated with the variable: %owner%, this specifies the user that created the alert. SC URL Designated with the variable: %url%, this specifies the URL that the SecurityCenter can be accessed with. This is useful where the URL that users can access SecurityCenter with differs from the URL known by SecurityCenter. The sample alert below contains some of these keywords embedded into an HTML Alert <strong>%alertname%</strong> (id #%alertid%) has triggered
349 Option <strong>alert Definition:</strong> %triggername% %triggeroperator% %triggervalue% <strong>calculated Value:</strong> %calculatedvalue% Please visit your SecurityCenter (<a href="%url%">%url%</a>) for more information. This was automatically generated by SecurityCenter as a result of alert <strong>%alertname%</strong> owned by <strong>%owner%</strong>. If you do not wish to receive this , contact the alert owner. Include Results Users If this box is checked, the query results (maximum of 500) that triggered the alert are included in the . Users who will be ed. The user address is used with this function. Tip: If a user is configured within the action and that user is deleted, the action option within the alert turns red. In addition, a notification is displayed for the new alert owner with the new alert status. To resolve this, edit the alert action definitions and choose Edit Action to apply the correct users(s). Addresses Additional addresses to send the alert to. For multiple recipients, add one address per line or use a comma-separated list. Notify Users Message Users Custom notification message to generate when the alert triggers. Users who will receive the notification message. Generate Syslog
350 Option Host Port Severity Message Host that will receive the syslog alert. UDP port used by the remote syslog server. Severity level of the syslog messages (Critical, Warning, or Notice). Message to include within the syslog alert. Assign Ticket Name Assignee Name assigned to the ticket Ticket description User who will receive the ticket Scan Scan Scan template to be used for the alert scan. Allows the user to select from a list of available scan templates to launch a scan against a triggered host. Note: The scanned host will be the host that triggered the scan and not the host within the scan template itself. IPs used for the scan targets are limited to the top 100 results of the alert query. Report Report Template Allows the user to select an existing report template and generate the report based on triggered alert data
351 Tickets Path: Workflow > Tickets Tickets can be created both manually and automatically by a predefined set of conditions through the alerting functionality described above. For more information, see Open a Ticket. Option General Name Notes Assignee Name assigned to the ticket. Descriptive text for the ticket. Notes for the ticket assignee. User that the ticket is assigned to. Note: If the ticket assignee is deleted, the ticket is automatically reassigned to the assignee s owner along with a notification message indicating that the ticket has been reassigned. Status (Available during edit) The following ticket statuses become available after a ticket has been created and are available from the Edit page: Assigned Resolved More Information Not Applicable Duplicate Closed Classification Type Select a Query Ticket classification can be selected from a drop-down box containing such items as Information, Configuration, Patch, Disable, False Positive, and many others. Vulnerability, Event, or Ticket. List of queries to choose from for the ticket assignee to help provide context for coming up with a resolution
352 In addition to adding and editing tickets, a Browse command button is available. This option enables the user to view the vulnerability snapshot added during ticket creation. The displayed view matches the query that was used by the ticket. To view details about an existing ticket, click the ticket to bring up the edit ticket page, use the Edit option from the gear icon drop-down menu to view options that were set during the Add Ticket process or use the View option from the gear icon drop-down menu to view a Ticket Detail summary with the name, status, creator, assignee, history, queries, description, and ticket notes. Once a ticket has been mitigated, click Resolve from the gear icon drop-down menu to provide ticket resolution. Once the ticket is resolved it may be closed from the Close option from the gear icon drop-down menu. Within the Status drop-down box, the user can select from one of these status options: Assigned, Resolved, More Information, Duplicate, or Not Applicable. Choose the correct status and add notes relevant to the ticket resolution. Resolved tickets still show up in the user s ticket queue with an Active status. Closing a ticket removes the ticket from the Active status filter view, but does not provide the ability to add notes similar to the Update Ticket function. Tickets in the Resolved or Closed state can always be reopened as needed
353 Open a Ticket You can use tickets within SecurityCenter to coordinate the assessment and remediation of vulnerabilities and security events. You can configure a ticket from an analysis page, or from the Tickets page. For more information about the options to configure, see Tickets. To open a ticket from an analysis page: 1. Log in to SecurityCenter as an organizational user with appropriate permissions. For more information, see User Roles. 2. Click Analysis > Vulnerabilities or Analysis > Events. The Vulnerability Analysis or Event Analysis page appears. 3. In the upper-right corner, click the Options drop-down box. 4. Click Open Ticket. 5. In the Name box, type a name. 6. (Optional) In the box, type a description. 7. (Optional) In the Notes box, type a note to the assignee. 8. In the Assignee drop-down box, select an assignee. 9. In the Classification drop-down box, select a classification. 10. Click Submit. To open a ticket from the Tickets page: 1. Log in to SecurityCenter as an organizational user with appropriate permissions. For more information, see User Roles. 2. Click Workflow > Tickets. The Tickets page appears. 3. Click Add. 4. In the Name box, type a name
354 5. (Optional) In the box, type a description. 6. (Optional) In the Notes box, type a note to the assignee. 7. In the Assignee drop-down box, select an assignee. 8. In the Classification drop-down box, select a classification. 9. (Optional) Click Add Query View. 10. Click Submit

355 Accept Risk Rules Path: Workflow > Accept Risk Rules (Organizational users) Path: Repositories > Accept Risk Rules (Administrator users) The Accept Risk Rules page displays a list of accept risk rules configured in SecurityCenter. Organizational users must add accept risk rules before the rules appear on this page. For more information, see Add an Accept Risk Rule. Adding a rule moves vulnerabilities from the unfiltered cumulative database view. These vulnerabilities are not deleted, but only display in the cumulative database vulnerability view if the Accepted Risk filter option is checked. Administrator and organizational users can manage recast risk rules. You can access information on what particular vulnerabilities or hosts have been declared to be accepted and, if noted in the comments, the reason. If you decide to unaccept a vulnerability, you can delete it To view details for a rule, click the row. To delete the rule, click the gear icon. Then, click Delete. To apply your changes, click Apply Rules in the upper-right corner

356 Recast Risk Rules Path: Workflow > Recast Risk Rules (Organizational users) Path: Repositories > Recast Risk Rules (Administrator users) The Recast Risk Rules page displays a list of recast risk rules configured in SecurityCenter. Organizational users must add recast risk rules before the rules appear on this page. For more information, see Add a Recast Risk Rule. Administrator and organizational users can manage recast risk rules. You can access information on what particular vulnerabilities or hosts have had risk levels recast, their new severity level and, if noted in the comments, the reason for the severity change. Rules may be searched by Plugin ID or Repository. If you want to reset a vulnerability to its original severity level, you can delete the rule. To view details for a rule, click the row. To delete the rule, click the gear icon. Then, click Delete. To apply your changes, click Apply Rules in the upper-right corner
357 Reports Tenable provides extremely flexible and simplified reporting through an assortment of report templates and user-friendly report creation interface. Supported report types include the well-known Portable Document Format (PDF), Rich Text Format (RTF), and Comma-Separated Values (CSV) standards for a high level of compatibility and ease of use. CyberScope, DISA ASR, and DISA ARF are also available for specialized needs. To filter the Reports page, see Apply a Filter. These specialized reporting types are enabled or disabled by an admin user of the SecurityCenter. Reports can be scheduled and automatically ed, shared to one or more specified SecurityCenter users and/or published to one or more sites on completion. Reports can be copied and reused as required. Tenable provides many report templates based on industry standards. When configuring a scan, an existing report template can also be set to run on completion. Caution: Custom PDF reports and template-based reports require that either the Oracle Java JRE or OpenJDK (along with their accompanying dependencies) are installed on the system hosting the SecurityCenter
358 Manage Reports On the Reports page of SecurityCenter, you can manage report definitions and launch reports. To manage reports in SecurityCenter: 1. Click Reporting > Reports. The Reports page appears. 2. You can: Filter existing report definitions in the reports table. Create a custom report. Create a template report. Edit a report definition. Edit a report outline. Manage filters for a chapter report. Manage filters for a non-chapter report. View a report definition. Copy a report definition. Export a report definition. Import a report definition. Delete a report definition. Launch a report on demand. Add a report to a scan
359 Create a Custom Report To create a custom report definition in SecurityCenter: 1. Click Reporting > Reports. The Reports page appears. 2. Click Add. The Add Report page appears. 3. In the Custom section, click the icon corresponding type of the report you want to create: PDF Portable Document Format (PDF); can be viewed universally. CSV Comma Separated Values (CSV); can be imported into spreadsheets or databases. RTF Rich Text Format (RTF); can be viewed and edited in any text editor. DISA ARF Meets the standards of the Defense Information Systems Agency (DISA) Asset Reporting Format (ARF). DISA ASR Meets the standards of the Defense Information Systems Agency (DISA) ARF Summary Report (ASR). CyberScope Meets CyberScope reporting standards to support FISMA compliance. 4. Configure the options for the report. SecurityCenter displays options relevant to the report format you selected. 5. (Optional) Edit the report outline. 6. Click Submit to save your report
360 Create a Template Report Template reports are formatted reports that can be customized using chapter and target selections. Templates are available from the SecurityCenter feed. To create a template report in SecurityCenter: 1. Click Reporting > Reports. The Reports page appears. 2. Click Add. The Add Report page appears. 3. In the Search Templates box in the top right corner of the page, search for a specific template by keyword. Tip: After the initial search, you can limit search results by template category. -or- In the Template section, click a template category to view the related templates: Compliance & Configuration Assessment Discovery & Detection Executive Monitoring Security Industry Trends Threat Detection & Vulnerability Assessments 4. Click a template report to select it. Note: Each template description specifies which SecurityCenter data must be available to obtain a complete report. For more information, see Data Required for Template-Based Reports. 5. (Optional) In the Chapters section, select which chapters from the template you want to include in your report. By default, the report includes all chapters from the template
361 6. In the Focus section, target all systems in the report. Target specific assets in the report. Target specific IP addresses in the report. This is the default setting. To return to this setting, click All Systems in the Targets drop-down box. -or- a. In the Targets drop-down box, click Assets. b. Select Assets and Repositories. -or- a. In the Targets drop-down box, click IP Addresses. b. In the IP Addresses box, type the IP address or addresses where you want the report to focus. Use commas to separate multiple addresses. c. In the Repositories box, select a target repository or repositories. -or- Target specific repositories in the report. a. In the Targets drop-down box, click Repositories. b. In the Repositories box, select a target repository or repositories. 7. (Optional) Edit the default text in the box. Note: You cannot modify any information in the Details section of the page. 8. Click Add. SecurityCenter creates a report based on the template and displays the Reports page. The new report appears as the last entry in reports table. 9. (Optional) Modify report options that are common to both custom and template reports
362 For example, the default value for the Schedule option for all template-based reports is On Demand. If you want to run the report automatically, modify the Schedule option for the report. 10. (Optional) Edit the report outline. For example, you might want to use text elements to add your business context to templatebased chapters
363 Data Required for Template-Based Reports Each report template description contains icons that represent which types of data must be available on SecurityCenter to obtain a complete report. Hover the cursor over the icon to display the label. Icon Label Action Required Asset Required Audit File Required Configure an IPv4/IPv6 repository and store scan results in the repository; see Local Repositories and Scans. Upload audit files and add them to your scan policy; see Audit Files and Scan Policies. -or- Compliance Data Required Local Checks Required Mobile Data Required Active Data Required Passive Data Required Event Data Required Configure and run credentialed scans; see Active Scans. Configure a mobile repository and store scan results in the repository; see Local Repositories and Scans. Configure a Nessus scanner and run active scans. For more information, see Nessus Scanners and Active Scans. Configure a Nessus Network Monitor (NNM) scanner; see Nessus Network Monitor (PVS). Configure a Log Correlation Engine server; see Log Correlation Engines
364 Edit a Report Definition In SecurityCenter, you can edit both custom reports and reports based on templates. To edit a report definition: 1. Click Reporting > Reports. The Reports page appears. 2. In the reports table, click the name of the report you want to edit. The Edit Report page appears. 3. Modify the report options. Note: SecurityCenter displays options relevant to the report type. 4. (PDF, RTF, and template reports only) Edit the report outline. 5. Click Submit to save your changes to the report
365 Report Options In SecurityCenter, you can configure the options described below for both custom and template reports. Option descriptions below are grouped by the section where they appear in the Add Report and Edit Report pages. In the option description tables, the Relevant Reports column specifies which report types use each option. Note: SecurityCenter classifies a template-based report as a PDF report. You can configure the same options for that report as you can for a PDF report. During template report creation, SecurityCenter set these options to default values. You can change these options for a template report only after creation is complete. Report options include: General Options Report Options Definition Options Display Options Distribution Options General Options Option Relevant Reports Name Name assigned to the report. Any Descriptive text for the report. Any Schedule Operational Determines how often the report runs. Options are On Demand, Now, Once, Daily, Weekly, or Monthly. When you select a frequency from the drop-down box, SecurityCenter displays additional options for the selected time frame. Predefined operational attributes that add required information to DISA ARF or CyberScope report types. The drop-down box dis- Any DISA ARF, CyberScope
366 Option Attribute Set ASR Content ASR Record Format Include ARF Benchmarks plays only the attribute set defined for the report you are currently creating. When creating a report, this drop-down box offers a selection of Benchmark, IAVM, CVE, or Plugin ID to be included. This drop-down box determines the format (Summary or Detail) of the DISA ASR report. When enabled, allows for the inclusion of a DISA ARF attribute set for the report. Benchmarks are generated after a scan using certain audit files that have been successfully run against at least one target system. Relevant Reports DISA ASR DISA ASR DISA ASR DISA ASR, CyberScope Report Options Option Style A compound value that specifies the report style, paper size, and orientation. For example, Plain, Letter Report styles include: Plain a report with basic graphs; suppresses the footer logo on the cover page Tenable a report with basic graphs; includes the footer logo on the cover page Tenable 3D a report with enhanced 3D graphs; includes the footer logo on the cover page Relevant Reports PDF, RTF Note: If a SecurityCenter administrator configured a Classification Type banner, plain report styles are the only options listed. Paper sizes include:
367 Option Letter the standard 8.5 inches x 11 inches letter size Relevant Reports Note: Letter size is the default paper size, used by options that do not explicitly state a paper size. For example, the paper size for Plain, Landscape is letter size. A4 the standard 8.27 inches x inches A4 size Orientation options include: Portrait horizontal Note: Portrait is the default orientation, used by options that do not explicitly state an orientation. For example, the orientation for Plain, Letter is horizontal. Include Cover Page Include Header Include Footer Include Table of Contents Include Index Cover Logo Landscape vertical Include a cover page in the report. Include a predefined header in the report. Include a predefined footer in the report. Include a table of contents with the report. Include an Index with the report. Specifies which image to use for the lower-left footer logo on the cover page of the report. The default logo is the Tenable logo. To add a custom logo, see Report Images. PDF, RTF PDF PDF PDF, RTF PDF, RTF PDF
368 Option Relevant Reports Note: The Plain report style suppresses this footer logo on the cover page. Footer Logo Watermark Encrypt PDF Specifies which image to use for the lower-left footer logo on all pages except the cover page. The default logo is the Tenable logo. To add a custom logo, see Report Images. Specifies a watermark for each page of the report. The default watermark is no watermark. To add a custom watermark, see Report Images. Protect the PDF with a password. The encryption level is 40-bit RC4. When enabled, a password option is displayed for a text entry of a password to use. This password must be used to open the report and view its contents. For more information about this encryption mechanism, please refer to the following URL: PDF PDF PDF Definition Options SecurityCenter displays definition options relevant to the report or report element type. Option Relevant Reports Add Chapter Add Template Chapter Query The primary component in the report organization. Chapters are listed in the table of contents for the report and consist of sections and elements. For more information, see Add a Custom Chapter to a Report and Edit a Report Outline. A predefined chapter from a Tenable-provided report template. For more information, see Add a Template Chapter to a Report. A list of predefined queries you can use to retrieve data for the report. For more information, see Queries. PDF, RTF PDF, RTF CSV, DISA ARF, DISA ASR, CyberScope;
369 Option Relevant Reports Iterator, Table, and Chart elements in PDF and RTF Type The type of data to include in the report. CSV; Iterator, Table, and Chart elements in PDF and RTF Source The source of the data to include in the report. For CSV reports, valid values for this field differ based on the setting of the Type option: If Type is set to Vulnerability, valid Source values are: CSV, DISA ARF, DISA ASR, CyberScope; Iterator, Table, and Chart elements in PDF and RTF o Cumulative All vulnerabilities, regardless of whether the vulnerabilities have been remediated or not o MItigated Remediated vulnerabilities o Individual Scan Vulnerabilities identified in a specific scan Note: If you select Individual Scan, SecurityCenter displays the Selected Scan option, which allows you to select a scan to use as the basis of the report: a. Click one of the predefined date ranges, or click Custom Range and enter starting and ending days for the range. b. Click Fetch Scans to view a list of possible scans within the date range. c. Click the scan you want to use in the drop-down box. If Type is set to Event, valid Source values are: o Active Currently active events
370 Option Relevant Reports o Archive Archived events Note: If you select Archive, SecurityCenter displays additional options, allowing you to select the LCE that collected the events and the Silo that stores the archived events. Tool Filters Find/Update Filters If Type is set to Mobile, Ticket, or Alert, this option is absent. For DISA ARF and DISA ASR reports, you do not set the Type option. Valid Source values are limited to Cumulative and Individual Scan, which operate in the same way as they do for CSV reports. Select the tool SecurityCenter uses to analyze the data in the report. Specifies additional criteria to refine report data. See Manage Filters for a Non-Chapter Report. This option appears after you add at least one chapter to the report. For more information, see Manage Filters for Multiple Elements. CSV; Iterator, Table, and Chart elements in PDF and RTF CSV, DISA ARF, DISA ASR, CyberScope; Iterator, Table, and Chart elements in PDF and RTF PDF, RTF Display Options These options allow you to specify column format information format A selection to define the columns and number of results to appear in the report is then available for configuration. Option Relevant Reports Results The number of results included in the CSV file. CSV; Iterator, Table, Bar Chart,
371 Option Relevant Reports Displayed Sort Column Sort Direction Display Columns The column that SecurityCenter uses to sort results in the CSV file. Available columns depend on: the Type you selected in the Definition options the Display Columns value you select in the Display options The sort direction for results in the CSV file. The columns included in the CSV results file. Available columns depend on Definition options you select. and Pie Chart elements in PDF and RTF CSV; Iterator, Table, Bar Chart, and Pie Chart elements in PDF and RTF CSV; Iterator, Table, Bar Chart, and Pie Chart elements in PDF and RTF CSV; Iterator, Table, Bar Chart, and Pie Chart elements in PDF and RTF Distribution Options Distribution options specify the actions SecurityCenter takes when a report run completes. Option Users Addresses Share Allows you to select SecurityCenter users to whom SecurityCenter s the completed report. The drop-down list includes only users with defined addresses. Allows you to add addresses where SecurityCenter s the completed report. You can specify multiple addresses, separated by commas. Allows you to select which SecurityCenter users within your organization can view the completed report in SecurityCenter. Use this option if organizational policies prohibit ing potentially sensitive Relevant Reports Any Any Any
372 Option Publishing Sites data. Allows you to select predefined publishing sites where SecurityCenter uploads the completed report. Relevant Reports Any
373 Edit a Report Outline In SecurityCenter, the report outline allows you to modify the structure of a PDF, RTF, or templatebased report. The outline consists of the following components: Component Outline Level chapter primary Highest-level component. Can contain any type of element (grouping, text, chart). element subordinate A grouping, text, or chart element. Can be nested in a chapter or grouping component. To edit a report outline: 1. Click Reporting > Reports. The Reports page appears. 2. In the reports table, click the name of the report you want to edit. The Edit Report page appears. 3. In the left navigation bar, click Definition. The report outline appears. The outline is, by default, expanded. 4. In the report outline, you can: Expand or collapse elements nested in the outline by clicking Collapse All or Expand All in the top navigation bar. Expand or collapse elements nested in an individual chapter or element by clicking the arrow next to the element. Add a custom chapter. Add a template chapter. Add or edit a report element. Reorder chapters and elements in a report
374 Delete a report element by clicking the delete icon next to the element. Note: SecurityCenter does not ask you to confirm this deletion. However, the deletion is not final until you save all changes to the report. 5. Click Submit to save your changes to the report
375 Add a Custom Chapter to a Report In SecurityCenter, you can add custom chapters to PDF, RTF, or template-based reports. To add a custom chapter to a report definition: 1. Click Reporting > Reports. The Reports page appears. 2. In the reports table, click the name of the report you want to edit. The Edit Report page appears. 3. In the left navigation bar, click Definition. The report outline appears. This outline is, by default, expanded. For more information, see Edit a Report Outline. 4. In the bottom navigation bar of the report outline, click Add Chapter Tip: If the report contains multiple chapters or sections, scroll down to locate the bottom navigation bar. It can also be helpful to click Collapse All on the top navigation bar to collapse the outline to its highest-level components. The Add Chapter page appears. 5. In the Name box, enter a title for the chapter. 6. In the Location box, select a relative location for the chapter within the report. 7. In the Style box, select a style for the report. 8. Click Submit. SecurityCenter adds the chapter to the report and displays the Edit Report page. 9. Click Submit to save your changes to the report
376 Add a Template Chapter to a Report In SecurityCenter, you can add template chapters to template reports and custom PDF or RTF reports. To add a template-based chapter to a report definition: 1. Click Reporting > Reports. The Reports page appears. 2. In the reports table, click the name of the report you want to edit. The Edit Report page appears. 3. In the left navigation bar, click Definition. The report outline appears. This outline is, by default, expanded. For more information, see Edit a Report Outline. 4. In the top navigation bar of the outline, click Add Template Chapter. 5. In the Search Templates box in the top right corner of the page, search for a specific template by keyword. Tip: After the initial search, you can limit search results by template category. -or- Click a template category icon to view the related templates. 6. Click the report template that contains chapters you want to include in your custom report. 7. (Optional) Modify the default options for the report template: a. In the Chapters section, select which chapters from the template you want to include in your report. By default, the report includes all chapters from the template. b. In the Focus section, target all systems in the report. This is the default setting. To return to this setting, click All Systems in the Targets dropdown box. -or- Target specific assets in the report
377 Target specific IP addresses in the report. a. In the Targets drop-down box, click Assets. b. Select Assets and Repositories. -or- a. In the Targets drop-down box, click IP Addresses. b. In the IP Addresses box, type the IP address or addresses where you want the report to focus. Use commas to separate multiple addresses. c. In the Repositories box, select a target repository or repositories. -or- Target specific repositories in the report. a. In the Targets drop-down box, click Repositories. b. In the Repositories box, select a target repository or repositories. c. (Optional) Edit text in the box. Note: You cannot modify any information in the Details section. 8. Click Add. SecurityCenter adds the template chapter or chapters to your custom report and displays the Add Report page again. 9. (Optional) Change the template chapter options. a. Click the edit icon next to the chapter you added. b. In the Name box, edit the chapter title. c. In the Location box, change the relative location for the chapter within the report. d. In the Style box, select a style for the chapter. e. Click Submit to save your changes to the chapter. 10. Click Submit to save your changes to the report
378 Add or Edit a Report Element You can add or edit elements within chapters or grouping elements in SecurityCenter reports. To add or edit a report element: 1. Click Reporting > Reports. The Reports page appears. 2. In the reports table, click the name of the report you want to edit. The Edit Report page appears. 3. In the left navigation bar, click Definition. The report outline appears. This outline is, by default, expanded. For more information, see Edit a Report Outline. 4. Click Add Element next to the element where you want to add the element. -or- Click the edit icon next to the element you want to change. Tip: To display Add Element or the edit icon, hover the cursor over the element. 5. Configure any of the following types of elements: Grouping Text Charts 6. Click Submit to save your changes to the report
379 Configure a Grouping Element in a Report Grouping elements in SecurityCenterreports include: Type Relevant Reports Group Groups associated elements on the same page. PDF, RTF Section Allows you to organize content within chapters. PDF, RTF Iterator Allows you to specify how the report groups its data. For example, if an Iterator Type of Port Summary is chosen for a vulnerability report, vulnerability data in the report is grouped by detected ports. If you do not configure an iterator, hosts and vulnerabilities are listed in the report individually. PDF, RTF To configure a grouping element: 1. Click Reporting > Reports. The Reports page appears. 2. In the reports table, click the name of the report you want to edit. The Edit Report page appears. 3. In the left navigation bar, click Definition. The report outline appears. This outline is, by default, expanded. For more information, see Edit a Report Outline. 4. Click Add Element. Tip: To display Add Element, hover the cursor over the element. 5. Add a group to the report. a. In the Grouping section, click the Group icon. b. Configure the following options:
380 Option Name Location Style Action Type a name for the element. Select a location for the element in the report. Select a style for the element. Add a section to the report. a. In the Grouping section, click the Section icon. b. Configure the following options: Option Name Location Style Action Type a name for the element. Select a location for the element in the report. Select a style for the element. -or- -or- Add an iterator to the report. a. In the Grouping section, click the Iterator icon. b. Configure the following options: Option Action General Name Location Style Type a name for the element. Select a location for the element in the report. Select a style for the element. Definition
381 Query Type Source Select a predefined query to define the data included in the element. For more information, see Queries. Select the type of data to include in the element. Iterator elements support vulnerability or event data only. Select the source of the data included in the element. Valid values for this field differ based on the setting of the Type option: If Type is set to Vulnerability, valid Source values are: o Cumulative All vulnerabilities, regardless of whether the vulnerabilities have been remediated or not o MItigated Remediated vulnerabilities o Individual Scan Vulnerabilities identified in a specific scan Note: If you select Individual Scan, SecurityCenter displays the Selected Scan option, which allows you to select a scan to use as the basis of the report: a. Click one of the predefined date ranges, or click Custom Range and enter starting and ending days for the range. b. Click Fetch Scans to view a list of possible scans within the date range. c. Click the scan you want to use in the drop-down box. If Type is set to Event, valid Source values are: o Active Currently active events o Archive Archived events Note: If you select Archive, SecurityCenter displays addi
382 tional options, allowing you to select the LCE that collected the events and the Silo that stores the archived events. Filters Iterator Type Specify additional criteria to refine element data. See Manage Filters for a Chapter Report Select a grouping method for iteration data: IP Summary Group vulnerability or event data by the IP addresses of detected hosts. Port Summary Group vulnerability or event data by the detected ports. Type Summary Group event data by event type. User Summary Group event data by user. Vulnerability Summary Group vulnerability data by individual vulnerability. Results Displayed Sort Column Sort Direction Header Information Select the number of results you want to include in the iteration. Select the column that SecurityCenter uses to sort the iteration data. Select the sort direction for the iteration data. Select the columns you want to include in the iteration data. Available columns depend on the settings of the Type and Source options. 6. Click Submit to save the element. 7. Click Submit to save your changes to the report
383 Configure a Text Element in a Report Text elements in SecurityCenter reports include: Type Relevant Reports Matrix Data in a chart layout. PDF, RTF Table Data in a table layout (max results displayed: 999). PDF, RTF Paragraph Assurance Report Card The underlying data set determines the report display. The default view for most reports is host-centric and SecurityCenter presents the user with the ability to choose a vulnerability-centric report (a listing of vulnerabilities with all associated hosts). Descriptive text that can be inserted anywhere in the report. Use this option to describe table elements or report output for the viewer. An element based on the results of a selected Assurance Report Card. PDF, RTF PDF, RTF To configure a text element in a report: 1. Click Reporting > Reports. The Reports page appears. 2. In the reports table, click the name of the report you want to edit. The Edit Report page appears. 3. In the left navigation bar, click Definition. The report outline appears. This outline is, by default, expanded. For more information, see Edit a Report Outline. 4. Click Add Element to add an element. -or- Click the edit icon next to the element to edit an existing element
384 Tip: To display Add Element and the edit icon, hover the cursor over the element. Add a paragraph to the report. a. In the Text section, click the Paragraph icon. b. Configure the following options: Option Name Location Style Text Action Type a name for the element. Select a location for the element in the report. Select a style for the element. Type the text of the paragraph. 5. Add a matrix to the report. -or- Add a table to the report. -or- c. Click Submit to save your changes to the element. -or- Add an assurance report card to the report. a. In the Text section, click the Assurance Report Card icon. b. Configure the following options: Option Name Location Style Action Type a name for the element. Select a location for the element in the report. Select a style for the element
385 Assurance Report Card Select the Assurance Report Card (ARC) you want to add to the report. For more information on ARCs, see Assurance Report Cards. c. Click Submit to save your changes to the element. 6. Click Submit to save your changes to the report
386 Configure a Matrix Element in a Report A matrix element is a type of text element you can insert into a SecurityCenter report definition. For more information on text elements, see Configure a Text Element in a Report. To configure a matrix element in a SecurityCenter report: 1. Click Reporting > Reports. The Reports page appears. 2. In the reports table, click the name of the report you want to edit. The Edit Report page appears. 3. In the left navigation bar, click Definition. The report outline appears. This outline is, by default, expanded. For more information, see Edit a Report Outline. 4. Add a new element. a. Click Add Element. b. In the Text section, click the Matrix icon. -or- Click the edit icon next to the element you want to change. Tip: To display Add Element and the edit icon next to an element, hover the cursor over the element. 5. Configure the General options: Option Name Location Style Action Type a name for the element. Select a location for the element in the report. Select a style for the element. 6. In the Cells section, select the number of columns and rows you want the matrix to include. By
387 default, the matrix is 4 cells by 4 cells. 7. Click Generate Cells. SecurityCenter displays the empty matrix for configuration. 8. Edit a row or column header. a. Click the header for the row or column you want to edit. b. Click the gear icon next to the header label. c. Click Edit Header. d. In the Label box, type a new header. e. Click Submit. -or- Add a matrix component. a. Click the matrix cell where you want to add the component. b. In the Data Type drop-down box, select the type of data for the component. c. In the Type drop-down box, select the type of calculation you want the component to perform. d. In the Source drop-down box, select a data source. e. (Optional) In the Filter box, add or edit a filter using the same steps you would to add a filter to a report element; see Manage Filters for a Single Element. f. In the Rules section, click Add Rule to add a rule. -or- Click the edit icon next to a rule to edit an existing rule. g. Click Submit to save your changes to the component. -or- Copy a row or column

388 a. Click the header for the row or column you want to copy. b. Click the gear icon next to the header label. c. Click Copy. For columns, SecurityCenter inserts the copied column to the right of the original column For rows, SecurityCenter inserts the copied row under the original row. -or- Delete a row or column. a. Click the header for the row or column you want to delete. b. Click the gear icon next to the header label. c. Click Delete Cells. 9. Click Submit to save your changes to the element. 10. Click Submit to save your changes to the report. Example
389 Configure a Table Element in a Report A table element is a type of text element you can insert into a SecurityCenter report definition. For more information on text elements, see Configure a Text Element in a Report. To configure a table element in a SecurityCenter report: 1. Click Reporting > Reports. The Reports page appears. 2. In the reports table, click the name of the report you want to edit. The Edit Report page appears. 3. In the left navigation bar, click Definition. The report outline appears. This outline is, by default, expanded. For more information, see Edit a Report Outline. 4. Add a new element. a. Click Add Element. b. In the Text section, click the Table icon. -or- Click the edit icon next to the element you want to change. Tip: To display Add Element and the edit icon next to an element, hover the cursor over the element. 5. Configure the General options: Option Name Location Style Action Type a name for the element. Select a location for the element in the report. Select a style for the element. 6. Configure the Data options:
390 Option Type Query Source Tool Filters Action Equivalent to the Definition option of the same name in Report Options. Equivalent to the Definition option of the same name in Report Options. Equivalent to the Definition option of the same name in Report Options. Equivalent to the Definition option of the same name in Report Options. Equivalent to the Definition option of the same name in Report Options. 7. Configure the Display options: Option Results Displayed Sort Column Sort Direction Display Columns Action Equivalent to the Display option of the same name in Report Options. Equivalent to the Display option of the same name in Report Options. Equivalent to the Display option of the same name in Report Options. Equivalent to the Display option of the same name in Report Options. 8. Click Submit to save your changes to the element. 9. Click Submit to save your changes to the report. Example
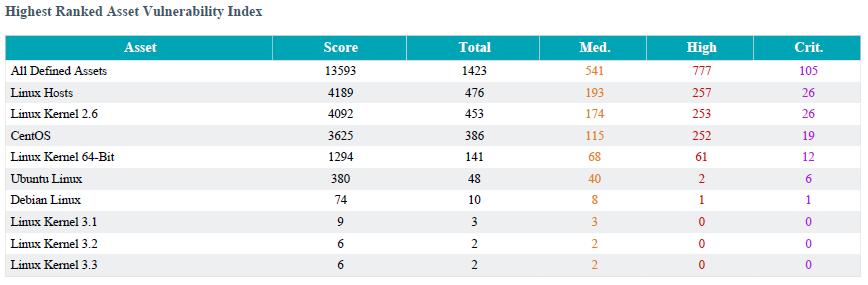
391

392 Configure a Charts Element in a Report Charts elements in SecurityCenter reports include: Option Bar Chart Click to add a bar chart element to the report. A sample bar chart is displayed below: Relevant Reports PDF, RTF Pie Chart Click to add a pie chart element to the report. A sample pie chart is displayed below: PDF, RTF Line Chart Click to add a line chart element to the report. A sample line chart is displayed below: PDF, RTF
393 Option Relevant Reports Area Chart Line charts are defined by time (x-axis) and series data (y-axis). When selecting the time, available options include Relative time and Absolute time. One or more series data elements can be chosen and displayed as discrete lines for easy comparison. Click to add an area chart element to the report. A sample area chart is displayed below: PDF, RTF Area charts are defined by time (x-axis) and series data (y-axis). When selecting the time, available options include Relative time and Absolute time. One or more series data elements can be chosen and displayed as a stackable view for easy comparison. To configure a chart element in a report: 1. Click Reporting > Reports. The Reports page appears. 2. In the reports table, click the name of the report you want to edit
394 The Edit Report page appears. 3. In the left navigation bar, click Definition. The report outline appears. This outline is, by default, expanded. For more information, see Edit a Report Outline. 4. Add a chart element a. Click Add Element to add an element. b. In the Charts section, click the icon for the type of chart you want to add. -or- Click the edit icon next to an existing chart element. Tip: To display Add Element and the edit icon, hover the cursor over the element. 5. For all charts, configure the General options: Option Name Location Style Action Type a name for the element. Select a location for the element in the report. Select a style for the element. 6. For bar charts and pie charts, configure the following Data options: Option Type Query Source Action Equivalent to the option the Definition option of the same name in Report Options. Equivalent to the option the Definition option of the same name in Report Options. Equivalent to the option the Definition option of the same name in Report Options
395 Tool Filters Equivalent to the option the Definition option of the same name in Report Options. Equivalent to the option the Definition option of the same name in Report Options. 7. For line charts and area charts, configure the following Data options: Option Data Type Data Range Action Valid values are Relative and Absolute. Use to configure the x-axis of the chart. Use to configure the x-axis of the chart: If you select Relative for Data Type, select a relative date range. If you select Absolute for Data Type, select a specific start and end date for the data. Series Use to configure the y-axis of the chart. Line charts and area charts require that you configure at least one series. 8. For bar charts and pie charts, configure the following Display options: Option Results Displayed Sort Column Sort Direction Display Columns Action Equivalent to the Display option of the same name in Report Options. Equivalent to the Display option of the same name in Report Options. Equivalent to the Display option of the same name in Report Options. Equivalent to the Display option of the same name in Report Options. 9. Click Submit to save your changes to the element. 10. Click Submit to save your changes to the report
396 Reorder Report Chapters and Elements In SecurityCenter, you can reorder chapters and elements in a PDF, CSV, or template-based report. To reorder report chapters and elements: 1. Click Reporting > Reports. The Reports page appears. 2. In the reports table, click the name of the report you want to edit. The Edit Report page appears. 3. In the left navigation bar, click Definition. The report outline appears. This outline is, by default, expanded. For more information, see Edit a Report Outline. 4. In the report outline, click the report element, then drag and drop it to its new location. -or- Click the edit icon for the component, and select a new location in the Location drop-down box. 5. Click Submit to save your changes to the report
397 Manage Filters for a Chapter Report In SecurityCenter, PDF, RTF, and template-based reports use a chapter structure, so you can specify different filters for individual chapter elements of those reports. You can manage filters for a single element or for multiple elements at the same time. For more information, see: Manage Filters for a Single Element Manage Filters for Multiple Elements
398 Manage Filters for a Single Element To manage filters for a single element in a chapter report in SecurityCenter: 1. Click Reporting > Reports. The Reports page appears. 2. In the reports table, click the name of the report you want to edit. The Edit Report page appears. 3. In the left navigation bar, click Definition. The report outline appears. This outline is, by default, expanded. For more information, see Edit a Report Outline. 4. Click the edit icon next to the element you want to edit. Tip: To display icons next to a element, hover the cursor over the element. 5. Add a filter. a. In the Data section, click Add Filter. b. Select a filter from the drop-down box. c. Set the filter value or operator, as prompted. Depending on the filter you selected earlier, SecurityCenter prompts you to type the value you want to filter for or to select from valid values and operators. Note: If SecurityCenter does not prompt you to specify an operator, the unstated operator is equivalent to is equal to or is set to. d. Click the check mark next to the filter to stop editing it. Note: The new filter is not saved until you click Submit. -or- Edit a filter
399 a. In the Data section, click the edit icon next to the filter. b. Edit the filter value or change the operator, as appropriate to the filter type. c. Click the check mark next to the filter to stop editing it. Note: Your changes to the filter are not saved until you click Submit. -or- Delete a filter. In the Data section, click the delete icon next to the filter. Note:SecurityCenter does not prompt you to confirm the deletion. However, the deletion is not final until you click Submit to save your changes. 6. Click Submit
400 Manage Filters for Multiple Elements When managing filters for a chapter report in SecurityCenter, you can search the report for elements that use certain filters, then update the filters for all matching elements in that report at the same time. You can use the following filters to search and update: Address, Audit File, Asset, CVE ID, DNS Name, IAVM ID, Repositories, Scan Policy, and Severity. For example, if you search a report definition for all elements where the Severity filter is set to Info, you can update the Severity filter to Medium for all elements, and add an Audit File filter to the elements at the same time. To manage filters for multiple elements in a chapter report: 1. Click Reporting > Reports. The Reports page appears. 2. In the reports table, click the name of the report you want to edit. The Edit Report page appears. 3. In the left navigation bar, click Definition. The report outline appears. This outline is, by default, expanded. For more information, see Edit a Report Outline. 4. In the top navigation bar of the outline, click Find/Update Filters. 5. Search for specific elements in the report. a. In the Search Filters section, click Add Search Filter. b. Select a filter from the drop-down box. c. Select an operator from the drop-down box. d. If you selected is equal to or contains as operator, type a filter value or select a value from the list of valid filter values, as appropriate to the filter you selected. e. Click the check mark at the end of the filter box. SecurityCenter searches the report outline for elements that match your search criteria and displays the results in the Matching Filters box
401 6. Specify the filter updates you want to make. a. In the Update Actions section, click Add Search Filter. b. Select a filter from the drop-down box. c. Select an operator from the drop-down box. d. Type a filter value or select a value from the list of valid filter values, as appropriate to the filter and operator you selected. e. Click the check mark at the end of the filter box. 7. In the Matching Filters box, review the list to verify that you want to apply the update to all the listed elements. Tip: If you do not want to apply the current update to all the listed elements, it may be more appropriate to manage filters by individual element. For more information, see Manage Filters for a Single Element. 8. Click Update Filters. SecurityCenter applies the updates to the matching elements and returns you to the report outline. 9. Click Submit to save your changes to the report
402 Manage Filters for a Non-Chapter Report In SecurityCenter, CSV, DISA ARF, DISA ASR, and Cyberscope reports do not use a chapter structure, so you can create a single set of filters that applies to every element of the report. To manage filters for a non-chapter report: 1. Click Reporting > Reports. The Reports page appears. 2. In the reports table, click the name of the report you want to edit. The Edit Report page appears. 3. Add a filter. a. In the Definition section, click Add Filter. b. Select a filter from the drop-down box. c. Set the filter value or operator, as prompted. Depending on the filter you selected earlier, SecurityCenter prompts you to type the value you want to filter for or to select from valid values and operators. d. Click the check mark next to the filter to stop editing it. Note: The new filter is not saved until you click Submit. Edit a filter. a. In the Definition section, click the edit icon next to the filter. b. Edit the filter value or change the operator, as appropriate to the filter type. c. Click the check mark next to the filter to stop editing it. Note: Your changes to the filter are not saved until you click Submit. -or- -or- Delete a filter
403 In the Definition section, click the delete icon next to the filter. Note:SecurityCenter does not prompt you to confirm the deletion. However, the deletion is not final until you click Submit to save your changes. 4. Click Submit to save your changes
404 View a Report Definition To view a report definition in SecurityCenter: 1. Click Reporting > Reports. The Reports page appears. 2. Click the gear icon next to the report definition you want to view. 3. Click View. SecurityCenter displays a read-only version of the report definition. Note: If you want to edit or delete the report definition from this page, click Options in the top right corner, then select Edit or Delete. For more information, see Edit a Report Definition and Delete a Report Definition
405 Copy a Report Definition You can share a copy of a report definition with other users in your organization in SecurityCenter. This feature is useful for maintaining consistency throughout your organization. After you share the copy, the other users own their local copy and can edit or delete as with any report they create themselves. Later changes you make to the original do not synchronize automatically to the copy. To copy a report defintion: 1. Click Reporting > Reports. The Reports page appears. 2. Click the gear icon next to the report you want to copy. 3. Click Copy. SecurityCenter displays the Copy Report page. 4. In the Group box, select the group you want to grant access to a copy of the report. 5. Specify a user or users that you want to grant access to a copy of the report. 6. Click Copy. SecurityCenter copies the report definition to the other accounts you specified. The copy retains its original title with "Copy of" prepended
406 Export a Report Definition In SecurityCenter, you can export a report definition as an XML file. This feature is useful for organizations running multiple SecurityCenters to provide consistent reports without duplicating the work needed to create definition templates. To export a report definition: 1. Click Reporting > Reports. The Reports page appears. 2. Click the gear icon next to the report you want to export. 3. Click Export. 4. Click Keep All References. Object References are kept intact. Importing users should be within the same organization and have access to all relevant objects for the components to be useable. -or- Click Remove All References. All Object References are removed, altering the definitions of the components. Importing users do not need to make any changes for components to be useable. -or- Click Replace with Placeholders. Object References are removed and replaced with their respective names. Importing users can see the name of the reference object, but must replace it with an applicable object within their organization before the component is useable. SecurityCenter downloads the report definition to your computer
407 Import a Report Definition In SecurityCenter, you can only import XML files in the same format used to export report definitions. This feature is useful for organizations running multiple SecurityCenters to provide consistent reports without duplicating the work needed to create definition templates. To import a report definition: 1. Copy the report definition file to your local computer. 2. Click Reporting > Reports. The Reports page appears. 3. In the top right corner of the page, click Options. 4. Click Import Report. 5. In the Name box, type a name for the report. 6. Click Choose File next to the Report Definition box. 7. Browse to the local copy of the report definition XML file. 8. Click Import. SecurityCenter imports the report definition. 9. (Optional) Edit the report definition as desired
408 Delete a Report Definition To delete a report definition in SecurityCenter: 1. Click Reporting > Reports. The Reports page appears. 2. Click the gear icon next to the report you want to delete. 3. Click Delete. 4. Click Delete to confirm the deletion. SecurityCenter deletes the report definition. Note: SecurityCenter retains any report results associated with the deleted definition. You must manually delete results associated with the report
409 Launch a Report on Demand To launch a SecurityCenter report on demand: 1. Click Reporting > Reports. The Reports page appears. 2. Click the gray triangle icon next to the report you want to launch. SecurityCenter starts the report. 3. (Optional) Monitor the status of the report in the Report Results page. To view this page, click View Report Results in the launch notification message. -or- Click Reporting > Report Results in the top navigation bar. Note: In the Report Results page, you can also stop the currently running report
410 Add a Report to a Scan After you create one or more on demand reports, you can add them to active scan or agent scan configurations. To add a preconfigured report to an active or agent scan: 1. Begin configuring an active or agent scan, as described in Add an Active Scan or Add an Agent Scan. 2. In the Post Scan section, click Add Report. The page displays available on demand reports. 3. Select the report you want to add. 4. Optionally, if you want the report to include cumulative data in SecurityCenter, enable the Create report using cumulative data option. If you disable this option, the report includes data only from the configured scan. 5. Click the checkmark icon to save the report. 6. Optionally, if you want to add multiple reports, repeat step 2 through step Click Submit
411 Manage Report Results On the Report Results page of SecurityCenter, you can manage both currently running reports and completed report results. Completed report results include successful and failed report runs, so you can access and distribute a successful report result or troubleshoot a report failure. 1. Click Reporting > Report Results. The Report Results page appears. 2. You can: Filter existing report results in the report results table. Stop a currently running report. Download a successful report result to your computer. View a successful report result. Publish a successful result. a copy of a successful result to specified users. Share a copy of a successful result with other SecurityCenter user accounts. View error conditions for a failed report. Delete a report result
412 Stop a Report Run If you want to stop a report that SecurityCenter is currently running: 1. Click Reporting > Report Results. The Report Results page appears. 2. Click the gray square icon next to the report you want to stop. SecurityCenter stops the report run. Note: You cannot restart a stopped report run. You can only launch the report again
413 Download a Report Result To download a successful report result to your computer: 1. Click Reporting > Report Results. The Report Results page appears. 2. Click the name of the report result in the results table. -or- Click the download icon next to the report result in the results table. -ora. Click the gear icon next to the report result. b. Click Options in the top right corner of the page. c. Click Download
414 View a Report Result To view a successful report result: 1. Click Reporting > Report Results. The Report Results page appears. 2. Click the gear icon next to the report result. 3. Click View. Note: When viewing a result, you can download or delete the result: a. Click Options in the top right corner of the page. b. Click Download to download the report result to your computer. -or- Click Delete to delete the report result
415 Publish a Report Result To publish a successful report result: 1. Click Reporting > Report Results. The Report Results page appears. 2. Click the gear icon next to the report result. 3. Click Publish. SecurityCenter displays the Publish Report Results window. 4. Search for and select a publishing site. 5. Click Publish
416 a Report Result To a copy of a successful report result to specific users: 1. Click Reporting > Report Results. The Report Results page appears. 2. Click the gear icon next to the report result. 3. Click Use the Group and User boxes to select the SecurityCenter user or users you want to receive the report result. -or- Type the address of recipients who are not SecurityCenter users. 5. Click Submit
417 Copy a Report Result To share a copy of a successful result with other SecurityCenter user accounts: 1. Click Reporting > Report Results. The Report Results page appears. 2. Click the gear icon next to the report result. 3. Click Copy. 4. In the Group box, select the group you want to grant access to a copy of the report result. 5. Specify a user or users that you want to grant access to a copy of the report result. 6. Click Copy. SecurityCenter copies the report result to the other accounts you specified. The copy retains its original title with "Copy of" prepended
418 View Errors for a Failed Report To view error conditions for a failed report: 1. Click Reporting > Report Results. The Report Results page appears. 2. Click the name of the failed result in the results table. SecurityCenter displays the View Report Results page. 3. Review the Error Details section
419 Delete a Report Result To delete a report result: 1. Click Reporting > Report Results. The Report Results page appears. 2. Click the gear icon next to the result you want to delete. 3. Click Delete. 4. Click Delete to confirm the deletion
420 Report Attributes Report attributes are used for adding required information to DISA ARF or CyberScope report types. When adding an attribute, if you select the type CyberScope or DISA ARF, SecurityCenter displays options appropriate to that attribute type. After adding attributes to the list, they are available for use during report creation of DISA or CyberScope reports. To filter the Report Attributes page, see Apply a Filter
421 Report Images Note: Image files must be of type.png or.jpg. Images used must be consistent when selecting the bit depth (8-bit, 16-bit, 24-bit, etc.). Otherwise, errors might be encountered when generating reports. In SecurityCenter, the Report Images interface allows a user with permissions to view details, add, edit, or delete PDF report images. Two types of images are managed from this interface: logos and watermarks. Logos are displayed at the bottom of each page, while watermarks are displayed prominently across the center of the report page. To filter the Report Images page, see Apply a Filter. Report Image Options Option Add Add a new logo or watermark image. Note that only PNG and JPEG formats are supported. The default image sizes are as follows, all at 300 DPI: default-cover-logo = 987x130 default-footer-logo = 380x
422 Option default-page-logo = 579x84 default-watermark = 887x610 While there are no set limitations on image size or resolution, using images that are different from these specifications can have a negative impact on report appearance. Note: The image size must be set to 300 DPI to prevent image breaks. Edit Detail Delete Edit any of the selected image s options, including name, description, type and file. View image details including: name, description, date uploaded, last modified and type. Delete the highlighted image
423 Additional Resources The topics in this section offer guidance in areas related to SecurityCenter, but are not required in many installations. Troubleshooting License Declarations Encryption Strength Manual LCE Key Exchange WebSEAL Nessus SSL Configuration Upload a Custom SSL Certificate SSL Client Authentication Regenerate SSL Certificate Offline SecurityCenter Plugin Updates LDAP Servers with Multiple OUs SecurityCenter CV Behavior on Expiration of Maintenance Period or License
424 Troubleshooting This troubleshooting section covers some of the common issues encountered with SecurityCenter and its connections to other Tenable products. SecurityCenter Troubleshooting LCE Troubleshooting Nessus Troubleshooting NNM Troubleshooting
425 SecurityCenter Troubleshooting SecurityCenter does not appear to be operational 1. If a login page does not appear, close and reopen the web browser. 2. Ensure that the remote httpd service is running on the SecurityCenter host: # ps ax grep httpd 1990? Ss 0:01 /opt/sc/support/bin/httpd -k start 3. Ensure that sufficient drive space exists on the SecurityCenter host: # df Filesystem 1K-blocks Used Available Use% Mounted on /dev/mapper/volgroup00-logvol % / /dev/sda % /boot tmpfs % /dev/shm 4. If there is not enough drive space, recover sufficient space and restart the SecurityCenter service: # df Filesystem 1K-blocks Used Available Use% Mounted on /dev/mapper/volgroup00-logvol % / /dev/sda % /boot tmpfs % /dev/shm # service SecurityCenter restart Shutting down SecurityCenter services: [ OK ] Starting SecurityCenter services: [ OK ] # Forgot login credentials
426 Contact Tenable Support Invalid license error If you receive an invalid license error while attempting to log in as a security manager or lower organizational user, an administrator user must log in and upload a new valid license key. A user with access to the host OS and valid permissions can also check that an up-to-date license exists in /opt/sc/daemons. Obtain a license from Tenable and copy it to the daemons directory as the tns user. -rw-r--r-- 1 tns tns 1942 Oct 29 12:14 license.key Reporting does not work Check your Java version. The system only supports OpenJDK and Oracle JRE. The existence of another type of Java on the system will likely break reporting
427 LCE Troubleshooting LCE server does not appear to be operational 1. Log in to SecurityCenter as an administrator user. 2. Confirm that the LCE server state is Working along with all attached LCE clients. 3. Check that you can SSH from the SecurityCenter host to the LCE host. 4. Check that the LCE daemon is running on its host and listening on the configured port (TCP port by default): # ss -pan grep lced tcp : :* LISTEN 30339/lced 5. Check that the listening ports can be reached from the network and are not blocked by a firewall. 6. If the LCE server is not operational, attempt to start the service: # service lce start Starting Log Correlation EngineLCE Daemon Configuration LICENSE: Tenable Log Correlation Engine 3-Silo Key for [user] EXPIRE: REMAIN: 30 days MESSAGE: LCE (3-silo license) MESSAGE: Valid authorization [ OK ] No events from an attached LCE server 1. Log in to SecurityCenter as an administrator user. 2. Confirm that the LCE server state is Working along with all attached LCE clients. 3. Confirm connectivity by checking that heartbeat events show up in the SecurityCenter UI
428 4. Check the LCE configuration settings in accordance with the LCE documentation. 5. Check the individual LCE client configuration and authorization. If syslog is being used to collect information and events, ensure that the syslog service is running and configured correctly on the target syslog server in accordance with LCE documentation. 6. Check for NTP time synchronization between the SecurityCenter, LCE, and LCE clients. Invalid LCE license 1. Log in to SecurityCenter as an administrator user. 2. Check that an up-to-date license exists on the LCE server LCE plugins fail to update 1. Log in to SecurityCenter as an administrator user. 2. Manually test a plugin update under Plugins with Update Plugins. If successful, the line Passive Plugins Last Updated will update to the current date and time. 3. Ensure that the SecurityCenter host is allowed outbound HTTPS connectivity to the LCE Plugin Update Site. 4. For all other LCE plugin update issues, contact Tenable Support at support@tenable.com
429 Nessus Troubleshooting Nessus server does not appear to be operational 1. Log in to SecurityCenter as an administrator user. 2. Verify that the Nessus scanner appears as Unable to Connect under Status. 3. SSH to the remote Nessus host to make sure the underlying operating system is operational. 4. Confirm that the Nessus daemon is running (Linux example below): # service nessusd status nessusd (pid 3853) is running If the Nessus service is not running, start the service: # service nessusd start Starting Nessus services: # ps -ef grep nessusd root :41 pts/2 00:00:05 nessusd q root :41 pts/2 00:00:00 grep nessusd # Cannot add a Nessus server 1. Make sure the Nessus daemon was registered using the SecurityCenter option for registration. 2. Check connectivity by telnetting from the SecurityCenter to the port the Nessus system is running on (e.g., 8834). If successful, the response will include: Escape character is '^]'. Nessus scans fail to complete 1. Ensure that the Nessus service is running on the Nessus host. 2. Ensure that Nessus scanner is listed in SecurityCenter under Resources and Nessus Scanners and that the status of the Nessus scanner is listed as Working. Click Edit to ensure that the IP address or hostname, port, username, password, and selected repositories for the Nessus scanner are all correct. Edit any incorrect entries to their correct state and click Submit to attempt to reinitialize the Nessus scanning interface
430 3. Right click the scan results and click Scan Details to obtain a more detailed description of the error. If the scan details indicate a Blocking error, this is indicative of a license IP count that has reached the limit. Either remove a repository to free up IP addresses or obtain a license for more IP addresses. 4. Ensure that scan targets are permitted within the configured scan zones. Nessus plugins fail to update 1. Log in to SecurityCenter as an administrator user. 2. Click System > Configuration. The Configuration page appears. 3. Click License and ensure that the Nessus Activation Code is marked as Valid. 4. Ensure that the user used to connect to the Nessus server is configured as an admin class user. 5. Ensure that the SecurityCenter system is allowed outbound HTTPS connectivity to the Nessus Plugin Update Site. If it is not, refer to the Nessus 6.x Installation and Configuration Guide for information on offline plugin updates. 6. Under System, Configuration, and Update in SecurityCenter, ensure that Active Plugins is not set to Never. Manually test a plugin update under Plugins with Update Plugins. If successful, the line Active Plugins Last Updated will update to the current date and time. 7. For all other Nessus plugin update issues, contact Tenable Support at support@tenable.com
431 NNM Troubleshooting NNM server does not appear to be operational 1. Log in to SecurityCenter as an administrator user. 2. Verify that the NNM server appears as Unable to Connect under Status. 3. SSH to the remote NNM host to make sure the underlying operating system is operational. 4. Confirm that the NNM is running (Linux example below): # service pvs status PVS is stopped PVS Proxy (pid 3142) is running # 5. If the NNM service is not running, start the service: # service pvs start Starting PVS Proxy [ OK ] Starting PVS [ OK ] # Cannot add a NNM server 1. Confirm that the NNM proxy is listening on the same port as SecurityCenter (port 8835 by default): # ss -pan grep 8835 tcp : :* LISTEN 406/pvs 2. Check connectivity by telnetting from the SecurityCenter console into the NNM server on port 8835 (the NNM listening port). If successful, the response includes: Escape character is '^]'. No vulnerabilities are being received from the NNM server
432 1. Ensure that the NNM service is running on the NNM host. 2. Ensure that the NNM appears in SecurityCenter under Resources > Passive Scanners and that the status of the NNM appears as Working. Click Edit to ensure that the IP address or hostname, port, username, password, and selected repositories for the NNM are correct. Edit any incorrect entries to their correct state and click Submit to attempt to reinitialize the NNM scanning interface. NNM plugins fail to update 1. Manually test a plugin update under Plugins with Update Plugins. If successful, Passive Plugins Last Updated updates to the current date and time. 2. Ensure that the SecurityCenter host allows outbound HTTPS connectivity to the NNM Plugin Update Site. 3. For all other NNM plugin update issues, contact Tenable Support at support@tenable.com
433 License Declarations SecurityCenter s Software License Agreement can be found on the machine SecurityCenteris installed on in the directory /opt/sc/docs. For a list of third-party software packages that Tenable utilizes with SecurityCenter, see Tenable Third-Party License Declarations
434 Encryption Strength Source Destination Encryption Strength Purpose SCCV Local Credentials AES-256-CBC Storing user and service accounts Repositories Local on SCCV None Storing scanned data SCCV Scanners and LCE SSL TLS 1.2 Scanned data from scanners to SCCV SCCV Tenable.io SSL TLS 1.2 Scanned data from Tenable.io instance SCCV Tenable Update Server SSL TLSv1.2 / ECDHE-RSA-AES256- GCM-SHA384 SCCV Tenable Portal SSL TLSv1.2 / ECDHE-RSA-AES256- GCM-SHA384 Plugin updates Product registration
435 Manual LCE Key Exchange You are not normally required to make a manual key exchange between SecurityCenter and the LCE; however, in some cases where you are prohibited from remote root login or required to do key exchange debugging, you must manually exchange the keys. For the remote LCE to recognize SecurityCenter, copy the SSH public key of SecurityCenter and append it to the /opt/lce/.ssh/authorized_keys file. The /opt/lce/daemons/lce-installkey.sh script performs this function. Note: The LCE server must have a valid license key installed and the LCE daemon must be running before you perform the steps below. To perform manual LCE key exchange: 1. Log in to SecurityCenter as an administrator user. 2. Download the SecurityCenter key, as described in Download the SecurityCenter SSH Key. 3. Save the file locally as SSHKey.pub. Do not edit the file or save it to any specific file type. 4. From the workstation where you downloaded the key file, use a secure copy program (e.g., WinSCP) to copy the SSHKey.pub file to the LCE system. You must have the credentials of an authorized user on the LCE server to perform this step. For example, if you have a user bob configured on the LCE server (hostname lceserver) whose home directory is /home/bob, the command on a Unix system would be as follows: # scp SSHKey.pub bob@lceserver:/home/bob 5. After you copy the file to the LCE server, move the file to /opt/lce/daemons: # mv /home/bob/sshkey.pub /opt/lce/daemons 6. On the LCE server, as the root user, change the ownership of the SSH key file to lce: # chown lce /opt/lce/daemons/sshkey.pub 7. Append the SSH public key to the /opt/lce/.ssh/authorized_keys file with the following steps:
436 # su lce # /opt/lce/daemons/lce-install-key.sh /opt/lce/daemons/sshkey.pub 8. To test the communication, as the user tns on the SecurityCenter system, attempt to run the id command: # su tns # ssh -C -o PreferredAuthentications=publickey lce@<lce-ip> id If you have not previously established a connection, a warning appears that is similar to the following: The authenticity of host ' ( )' can't be established. RSA key fingerprint is 86:63:b6:c3:b4:3b:ba:96:5c:b6:d4:42:b5:45:37:7f. Are you sure you want to continue connecting (yes/no)? Answer yes to this prompt. If the key exchange worked correctly, a message similar to the following will appear: # uid=251(lce) gid=251(lce) groups=251(lce) 7. You can add the IP address of SecurityCenter to the LCE system s /etc/hosts file. This prevents the SSH daemon from performing a DNS lookup that can add seconds to your query times. 8. You can add the LCE to SecurityCenter via the normal administrator process, described in Log Correlation Engines
437 WebSEAL Path: System > Configuration and click Security WebSEAL supports multiple authentication methods, provides Security Access Authorization service, and single sign on capabilities. Enable WebSEAL To enable WebSEAL, click the WebSEAL option on the Security Configuration page. When WebSEAL is enabled, the option is blue. Caution: It is strongly advised that the user confirm, in a separate session, that at least one user (preferably an administrator user) is able to log-in successfully via WebSEAL before the user that enabled WebSEAL logs out. Otherwise, if there is an issue, no one will be able to access SecurityCenter to turn WebSEAL off. Disable WebSEAL To disable WebSEAL, click the WebSEAL option on the Security Configuration page. When disabled, the option is grey and the password/confirm password boxes appear. This will update the password for the user turning WebSEAL off. Caution: Any user created while WebSEAL was enabled will not have a password and an admin must update the user account to establish a password. Any user that existed before the enabling of WebSEAL will have to revert to their old password
438 Nessus SSL Configuration This section describes how to generate and exchange SSL certificates for the Nessus vulnerability scanner to use with SecurityCenter. If you perform a software install, you must have access to the SecurityCenter system and administrative (root) access to all Nessus scanner systems. If you perform a virtual install, see the Tenable Appliance User Guide. Caution: Please note that users should be familiar with PKI deployments and it is not recommended that the Nessus server be used as the site s PKI system. The method described here is intended to assist in testing the functionality of the certificate exchange to assist users in the incorporation of the certificates into their current PKI system. In this method, the same key is shared between multiple servers. This may not be acceptable in some installations. Overview of SSL Certificates and Keys Nessus Configuration for Unix Nessus Configuration for Windows
439 Overview of SSL Certificates and Keys Nessus supports authentication protocols based on the OpenSSL toolkit (please see for more details about the toolkit). This provides cryptographic protection and secure authentication. This section provides an overview of the certificates and keys necessary for SSL communication with Nessus. In the example described in this document, there are three key system components: the Certificate Authority, the Nessus Server and the Nessus client, which in this case is SecurityCenter. It is necessary to generate the keys required for the SSL communication and copy them to the appropriate directories. Certificate Authority The Certificate Authority (CA) ensures that the certificate holder is authentic and not an impersonator. The Certificate Authority holds a copy of the certificates for registered users to certify that the certificate is genuine. When the Certificate Authority receives a Certificate Signing Request (CSR), it validates and signs the certificate. In the example provided in this document, the Certificate Authority resides on the Nessus server, but this is not the recommended method for a production environment. In proper PKI deployments, the Certificate Authority would be a separate system or entity, such as Thawte or Verisign. Nessus Server In the example described in this document, the Nessus server is the same physical system that holds the Certificate Authority, but this will not likely be the case in a production environment. The Nessus server is the target of the secure communication and its keys must be generated locally and copied to the systems that will need to communicate with it using the SSL protocol. The Nessus server has users defined that authenticate to it either by simple login and password or via SSL. These users will also have keys associated with them. Nessus Client The Nessus client, which is SecurityCenter in this case, communicates with the Nessus server via SSL. It uses keys generated for a Nessus client and stores these keys and the certificate for the Certificate Authority in the /opt/sc/daemons directory. These keys must be owned by the tns userid
440 Nessus Configuration for Unix Commands and Relevant Files The following section describes the commands and relevant files involved in the Nessus SSL process on a Red Hat Linux system. Certificate Authority and Nessus Server Certificate The /opt/nessus/sbin/nessuscli mkcert command creates the Certificate Authority and generates the server certificate. This command creates the following files: File Name Created Purpose Where to Copy to /opt/nessus/com/nessus/ca/cacert.pem /opt/nessus/com/nessus/ca/servercert.pem /opt/nessus/var/nessus/ca/cakey.pem This is the certificate for the Certificate Authority. If using an existing PKI, this will be provided to you by the PKI and must be copied to this location. This is the public certificate for the Nessus server that is sent in response to a CSR. This is the private key of the Certificate Authority. It may or may not /opt/nessus/com/nessus/ca on the initial Nessus server and any additional Nessus servers that need to authenticate using SSL. /opt/nessus/com/nessus/ca on any additional Nessus servers that need to authenticate using SSL. /opt/nessus/var/nessus/ca on any additional Nessus servers that need to authenticate using SSL
441 File Name Created Purpose Where to Copy to be provided by the Certificate Authority, depending on if they allow the creation of sub users. /opt/nessus/var/nessus/ca/serverkey.pem This is the private key of the Nessus server. /opt/nessus/var/nessus/ca on any additional Nessus servers that need to authenticate using SSL. Nessus Client Keys The Nessus user, in this case the user ID that SecurityCenter uses to communicate with the Nessus server, is created by the following command: # /opt/nessus/sbin/nessuscli mkcert-client This command creates the keys for the Nessus clients and optionally registers them appropriately with the Nessus server by associating a distinguished name (dname) with the user ID. It is important to respond y (yes) when prompted to register the user with the Nessus server for this to take effect. The user name may vary and is referred to here as user. The certificate filename will be a concatenation of cert_, the user name you entered and.pem. Additionally, the key filename will be a concatenation of key_, the user name you entered and.pem. If the user was previously added via the /opt/nessus/sbin/nessuscli adduser command, you will still need to run this program to register the user. If you have not previously created the user, it is not necessary to also run the nessuscli adduser command; the user will be created if it does not already exist. The following files are created by this command: File Name Created /tmp/nessus-xxxxxxxx/cert_ {user}.pem /tmp/nessus-xxxxxxxx/key_ Purpose This is the public certificate for the specified user. This is the private key for the specified user
442 File Name Created Purpose {user}.pem /opt/nessus/var/nessus/users/ {user}/auth/dname This is the distinguished name to be associated with this user. The distinguished name consists of a number of options separated by commas in the following format: /C={country}/ST={state}/L={location}/OU={organizational unit}/o={organization/cn={common name} Creating and Deploying SSL Authentication for Nessus An example SSL Certificate configuration for Nessus to SecurityCenter authentication is included below: In the example described here, SecurityCenter and the Nessus scanner are defined as follows. Your configuration will vary: SecurityCenter: IP: OS: Red Hat ES 5 Nessus Scanner: IP: OS: Red Hat ES 5 Create Keys and User on Nessus Server Log in to the Nessus scanner and use the su command to become the root user. Create the Certificate Authority and Nessus server certificate as follows: # /opt/nessus/sbin/nessuscli mkcert Creation of the Nessus SSL Certificate This script will now ask you the relevant information to create the SSL
443 certificate of Nessus. Note that this information will *NOT* be sent to anybody (everything stays local), but anyone with the ability to connect to your Nessus daemon will be able to retrieve this information. CA certificate life time in days [1460]: Server certificate life time in days [365]: Your country (two letter code) [US]: Your state or province name [NY]: Your location (e.g. town) [New York]: Your organization [Nessus Users United]: Tenable Network Security This host name [Nessus4_2]: Congratulations. Your server certificate was properly created. The following files were created :. Certification authority : Certificate = /opt/nessus//com/nessus/ca/cacert.pem Private key = /opt/nessus//var/nessus/ca/cakey.pem. Nessus Server : Certificate = /opt/nessus//com/nessus/ca/servercert.pem
444 Private key = /opt/nessus//var/nessus/ca/serverkey.pem Next, create the user ID for the Nessus client, which is SecurityCenter in this case, to log in to the Nessus server with, key and certificate. This is done with the command /opt/nessus/sbin/nessuscli mkcert-client. If the user does not exist in the Nessus user database, it will be created. If it does exist, it will be registered to the Nessus server and have a distinguished name (dname) associated with it. It is important to respond y (yes) when prompted to register the user with the Nessus server for this to take effect. The user must be a Nessus admin, so answer y when asked. The following example shows the prompts and typical answers: # /opt/nessus/sbin/nessuscli mkcert-client Do you want to register the users in the Nessus server as soon as you create their certificates? [n]: y Creation Nessus SSL client Certificate This script will now ask you the relevant information to create the SSL client certificates for Nessus. Client certificate life time in days [365]: Your country (two letter code) [FR]: US Your state or province name []: MD Your location (e.g. town) [Paris]: Columbia Your organization []: Tenable Network Security Your organizational unit []: **********
445 We are going to ask you some question for each client certificate If some question have a default answer, you can force an empty answer by entering a single dot '.' ********* User #1 name (e.g. Nessus username) []: paul User paul already exists Do you want to go on and overwrite the credentials? [y]: y Should this user be administrator? [n]: y Country (two letter code) [US]: State or province name [MD]: Location (e.g. town) [Columbia]: Organization [Tenable Network Security]: Organizational unit []: []: User rules nessusd has a rules system which allows you to restrict the hosts that $login has the right to test. For instance, you may want him to be able to scan his own host only. Please see the nessus-adduser(8) man page for the rules syntax Type the rules for this user, and enter a BLANK LINE once you are done:
446 (the user can have an empty rules set) User added to Nessus. Another client certificate? [n]: n Your client certificates are in /tmp/nessus-043c22b5 You will have to copy them by hand # The certificates created contain the username entered previously, in this case paul, and are located in the directory as listed in the example above (e.g., /tmp/nessus-043c22b5). Create the nessuscert.pem Key In the above specified tmp directory, the certificate and key files in this example are named cert_ paul.pem and key_paul.pem. These files must be concatenated to create nessuscert.pem as follows: # cd /tmp/nessus-043c22b5 # cat cert_paul.pem key_paul.pem > nessuscert.pem Note: The nessuscert.pem file will be used when configuring the Nessus scanner on SecurityCenter. This file needs to be copied to somewhere accessible for selection from your web browser during the Nessus configuration. Configure Nessus Daemons To enable certificate authentication on the Nessus server, the force_pubkey_auth setting must be enabled. Once enabled, log in to the Nessus server may only be completed by SSL certificates. Username and password login will be disabled. As the root (or equivalent) user on the Nessus server, run the following command: # /opt/nessus/sbin/nessuscli fix --set force_pubkey_auth=yes Restart the Nessus daemons with the appropriate command for your system. The example here is for Red Hat:
447 # /sbin/service nessusd restart Change the Nessus Mode of Authentication From the SecurityCenter web UI, go to Resources and then Nessus Scanners. Change the authentication mode from Password Based to SSL Certificate. During the setup of the Nessus scanner, click the previously created nessuscert.pem file for the Certificate option, then click Submit to confirm. Using Custom Certificates During an upgrade, SecurityCenter will check for the presence of custom SSL certificates. If certificates are found and the owner is not Tenable, any newly generated certificates will be named with a.new extension and placed in the /opt/sc/support/conf directory to avoid overwriting existing files. Deploy to Other Nessus Scanners
448 Note: Configure any other Nessus scanners for SecurityCenter use and certificate authentication prior to performing the following tasks. If you have other Nessus servers that will need to authenticate using the same SSL certificates and user names, simply copy the files to the other servers as follows: # cd /opt/nessus/var/nessus/ca # scp cakey.pem serverkey.pem root@nessusip:/opt/nessus/var/nessus/ca # cd /opt/nessus/com/nessus/ca # scp cacert.pem servercert.pem root@nessusip:/opt/nessus/com/nessus/ca You will then need to copy the Nessus user(s) to all the Nessus servers, replacing admin in the following command with the user s name: # cd /opt/nessus/var/nessus/users # tar zcvf admin ssh C root@nessusip "tar zxvf - -C /opt/nessus/var/nessus/users" Finally, restart the Nessus service on all the Nessus servers with the appropriate command for your system. This example is for Red Hat: # /sbin/service nessusd restart Use the steps from above (Changing the Nessus Mode of Authentication) to add the new server(s) to SecurityCenter using certificate-based authentication
449 Nessus Configuration for Windows Commands and Relevant Files The following section describes the commands and relevant files involved in the Nessus SSL process on a Windows system. Certificate Authority and Nessus Server Certificate The command C:\Program Files\Tenable\Nessus\nessuscli mkcert creates the Certificate Authority and generates the server certificate. This command creates the following files: File Name Created Purpose Where to Copy to C:\Program Files\Tenable\Nessus\nessus\CA\cacert.pem C:\Program Files\Tenable\Nessus\nessus\CA\servercert.pem This is the certificate for the Certificate Authority. If using an existing PKI, this will be provided to you by the PKI and must be copied to this location. This is the public certificate for the Nessus server that is sent in response C:\Program Files\Tenable\Nessus\nessus\CA\ on any additional Nessus servers that need to authenticate using SSL. C:\Program Files\Tenable\Nessus\nessus\CA\ on any additional Nessus servers that need to authenticate using SSL
450 File Name Created Purpose Where to Copy to to a CSR. C:\Program Files\Tenable\Nessus\nessus\CA\cakey.pem C:\Program Files\Tenable\Nessus\nessus\CA\serverkey.pem This is the private key of the Certificate Authority. It may or may not be provided by the Certificate Authority, depending on if they allow the creation of sub users. This is the private key of the Nessus server. C:\Program Files\Tenable\Nessus\nessus\CA\ on any additional Nessus servers that need to authenticate using SSL. C:\Program Files\Tenable\Nessus\nessus\CA\ on any additional Nessus servers that need to authenticate using SSL. Nessus Client Keys The Nessus user, which in this case is the user ID that SecurityCenter uses to communicate with the Nessus server, is created by the command C:\Program Files\Tenable\Nessus\nessuscli mkcert-client. This command creates the keys for the Nessus clients and optionally registers them appropriately with the Nessus server by associating a distinguished name (dname) with the user ID. It is important to respond y (yes) when prompted to register the user with the Nessus server for this to take effect. The user name may vary and is referred to here as user
451 The certificate filename will be a concatenation of cert_, the user name you entered and.pem. Additionally, the key filename will be a concatenation of key_, the user name you entered and.pem. The following files are created by this command: File Name Created C:\Documents and Settings\<UserAccount>\Local Settings\Temp\nessus-xxxxxxxx\cert_ <user>.pem C:\Documents and Settings\<UserAccount>\Local Settings\Temp\nessus-xxxxxxxx\key_ <user>.pem C:\Program Files\Tenable\Nessus\nessus\users\<user_ name>\auth\dname Purpose This is the public certificate for the specified user. This is the private key for the specified user. This is the distinguished name to be associated with this user. The distinguished name consists of a number of options separated by commas in the following format: "/C={country}/ST={state}/L={location}/OU= {organizational unit}/o={organization/cn={common name}" Creating and Deploying SSL Authentication for Nessus Create Keys and User on Nessus Server Create the Certificate Authority and Nessus server certificate using the command C:\Program Files\Tenable\Nessus\nessuscli mkcert and provide the requested information. Caution: Critical: Any Nessus Scanner that has previously processed scans will not initially accept these keys as a policy.db will have already been created on the Nessus Scanner. Remove the policies.db from the Nessus Scanner to ensure the deployment finishes successfully. To remove the policies.db on a Linux system issue this command as root: rm /opt/nessus/var/nessus/users/<username>/policies.db
452 To remove the policies.db on a Windows system, navigate to the C:\Program Files\Tenable\Nessus folder and remove the policies.db file. Actual location of the policies.db differs depending on the version of Windows that is running. Next, create the user ID for the Nessus client, which is SecurityCenter in this case, to log in to the Nessus server with, key and certificate. This is done with the command C:\Program Files\Tenable\Nessus\nessuscli mkcert-client. If the user does not exist in the Nessus user database, it will be created. If it does exist, it will be registered to the Nessus server and have a distinguished name (dname) associated with it. It is important to respond y (yes) when prompted to register the user with the Nessus server for this to take effect. The user must be a Nessus admin, so answer y when asked. The following example shows the prompts and typical answers: The certificates created contain the username entered previously, in this case admin, and are located in the directory as listed in the example above (e.g., C:\Documents and Settings\<UserAccount>\Local Settings\Temp\nessus-00007fb1). In the specified directory, the certificate and key files in this example are named cert_admin.pem and key_admin.pem. Transfer Certificates and Keys to SecurityCenter Transfer the cert_admin.pem and key_admin.pem files to a desired location on SecurityCenter, change into that directory and concatenate them as follows: # cat cert_admin.pem key_admin.pem > nessuscert.pem Note: The nessuscert.pem file will be used when configuring the Nessus scanner on SecurityCenter. This file needs to be copied to somewhere accessible for selection from your web browser during the Nessus configuration. Configure Nessus Daemons To enable certificate authentication on the Nessus server, the force_pubkey_auth setting must be enabled. Once enabled, log in to the Nessus server may only be completed by SSL certificates. Username and password login will be disabled. As the root (or equivalent) user on the Nessus server, run the following command: C:\Program Files\Tenable\Nessus\nessuscli fix --set force_pubkey_auth=yes Open the Nessus Server Manager GUI, click Stop Nessus Server and then click Start Nessus Server. Change the Nessus Mode of Authentication
453 From the SecurityCenter web UI, go to Resources and then Nessus Scanners. Change the authentication mode from Password Based to SSL Certificate. During the setup of the Nessus scanner, click the previously created nessuscert.pem file for the Certificate option, then click Submit to confirm
454 Upload a Custom SSL Certificate SecurityCenter ships with its own default SSL certificate; however, in many cases it is desirable to obtain a custom SSL certificate for enhanced security. Note: In the example below, two certificate files were received from the CA: host.crt and host.key. These file names vary depending on the CA used. Tip: The custom certificate address must not be SecurityCenter@SecurityCenter or subsequent upgrades cannot retain the new certificate. To upload a custom SSL certificate to SecurityCenter: 1. Back up the current certificates located in the /opt/sc/support/conf directory. These files are named SecurityCenter.crt and SecurityCenter.key. In the example below, we place the files in /tmp. # cp /opt/sc/support/conf/securitycenter.crt /tmp/securitycenter.crt.bak # cp /opt/sc/support/conf/securitycenter.key /tmp/securitycenter.key.bak 2. Copy the new certificates (e.g., host.crt and host.key) to the /opt/sc/support/conf directory and overwrite the current certificates. If prompted to overwrite, type y. # cp host.crt /opt/sc/support/conf/securitycenter.crt # cp host.key /opt/sc/support/conf/securitycenter.key 3. Ensure the files have the correct permissions (640) and ownership (tns) as follows: # ls -l /opt/sc/support/conf/securitycenter.crt -rw-r--r-- 1 tns tns 4389 May 15 15:12 SecurityCenter.crt # ls -l /opt/sc/support/conf/securitycenter.key -rw-r--r-- 1 tns tns 887 May 15 15:12 SecurityCenter.key
455 Caution: If an intermediate certificate is required, it must be copied to the system and given the correct permissions (640) and ownership (tns). Additionally, you must remove the # fromthe line in /opt/sc/support/conf/vhostssl.conf that begins with #SSLCertificateChainFile to enable the setting. Modify the path and filename to match the uploaded certificate. 4. Restart the SecurityCenter services: # service SecurityCenter restart 5. Browse to SecurityCenter using SSL (e.g., 6. When prompted, verify the new certificate details
456 SSL Client Certificate Authentication SecurityCenter allows users to use SSL client certificate authentication. This allows use of SSL client certificates, smart cards, personal identity verification (PIV) cards, and common access card (CAC) authentication when the browser is configured for this method. By default, SecurityCenter uses a password to authenticate. To configure SecurityCenter to allow SSL client certificate authentication the web server must be changed to allow such connections. To do this, the /opt/sc/support/conf/sslverify.conf file must be edited on the SecurityCenter server using any standard text editor. Edit the SSLVerifyClient setting to use an option of none, optional, or require as described in the following table. Option none optional When set to none, SSL certificates for SecurityCenter will not be accepted by the server for user authentication purposes. This is the default setting for SecurityCenter. When set to optional, valid SSL certificates for SecurityCenter may be used for user authentication. If a valid certificate is not presented, the user may log in using only a password. Caution: Depending on how they are configured, some web browsers may not connect to SecurityCenter when the optional setting is used. require When set to require, a valid SSL certificate for SecurityCenter must be presented to gain access to the web interface. If the user has an account that uses a certificate to authenticate, that user will be logged into SecurityCenter. Otherwise, the user will be presented with the standard SecurityCenter login page. When a user is initially created and configured, a password must be created for the user. Users who are configured to use SSL certificates will be prompted to determine if they want to always use the current certificate when they log in to SecurityCenter through a browser. If Yes is selected, the certificate will be associated with their account and future access to SecurityCenter will use the client certificate. If No is selected, the certificate will be ignored for the current session. Before You Begin: Configure SecurityCenter to trust certificates from your CA, as described in Configure SecurityCenter to Trust a Custom CA

457 To perform a certificate-based SecurityCenter login: Note: The following information is provided with the understanding that your browser is configured for SSL certificate authentication. Please refer to your browser s help files or other documentation to configure this feature. 1. Open a browser window and navigate to SecurityCenter. The browser presents a list of available certificate identities. 2. Select a certificate. 3. Click OK. An authentication prompt appears (if required to access your certificate)

458 4. (Optional) If prompted, type a PIN or password. 5. Click OK. The SecurityCenter login page appears. 6. Log in using the username to be associated with the selected certificate. Caution: Only one SecurityCenter user may be associated with a single certificate. If one user holds multiple user names and roles, a unique certificate must be provided for each login name. The Certificate Authentication window appears. 7. When prompted, specify whether the current certificate is to be used to authenticate the current user. If Yes is selected, the certificate will be associated with this user. If No is selected, the certificate will be ignored for the current session. Note: If the user s browser is configured for certificate authentication but is not configured for a SecurityCenter user, the following prompt will be presented for each login. When a user s account is associated with a certificate, it is displayed on the user s profile page. 8. Note: The Certificate Details section for a user only appears if there is an associated certificate and does not display until the user logs in again after the initial certificate configuration. If a user s certificate changes or is required to be revoked, the current certificate may be disassociated from the user by clicking the Clear Certification Details button If a new certificate is available the next time the user logs in, SecurityCenter will again attempt to associate the user with the certificate
SecurityCenter 5.6.x User Guide. Last Revised: December 18, 2017
 SecurityCenter 5.6.x User Guide Last Revised: December 18, 2017 Table of Contents SecurityCenter 5.6.x User Guide 1 Welcome to SecurityCenter 6 Getting Started Workflow 7 Hardware Requirements 9 Software
SecurityCenter 5.4 User Guide. Last Revised: December 01, 2017
 SecurityCenter 5.4 User Guide Last Revised: December 01, 2017 Table of Contents SecurityCenter 5.4 User Guide 1 Welcome to SecurityCenter 6 Getting Started 7 System Requirements 9 Installation Information
SecurityCenter 5.2 Guide
 SecurityCenter 5.2 Guide Revision 1.1 Thursday, December 17, 2015 SecurityCenter 5.2 Guide 1 Introduction 14 System Requirements 14 Recommended Minimum Hardware Requirements 14 Network Interfaces 15 Disk
SecurityCenter 5.1 Upgrade Guide. November 12, 2015 (Revision 2)
") SecurityCenter 5.1 Upgrade Guide November 12, 2015 (Revision 2) Table of Contents Introduction... 3 Standards and Conventions... 3 Software Requirements... 4 Supported Operating Systems... 4 Dependencies...
SecurityCenter 5.1 Upgrade Guide November 12, 2015 (Revision 2) Table of Contents Introduction... 3 Standards and Conventions... 3 Software Requirements... 4 Supported Operating Systems... 4 Dependencies...
SecurityCenter Upgrade Guide. July 21, 2015 (Revision 1)
") SecurityCenter 5.0.1 Upgrade Guide July 21, 2015 (Revision 1) Table of Contents Introduction... 3 Standards and Conventions... 3 Software Requirements... 4 Supported Operating Systems... 4 Dependencies...
SecurityCenter 5.0.1 Upgrade Guide July 21, 2015 (Revision 1) Table of Contents Introduction... 3 Standards and Conventions... 3 Software Requirements... 4 Supported Operating Systems... 4 Dependencies...
SecurityCenter 4.8.x Upgrade Guide. December 16, 2014 (Revision 1)
") SecurityCenter 4.8.x Upgrade Guide December 16, 2014 (Revision 1) Table of Contents Introduction... 3 Standards and Conventions... 3 Software Requirements... 4 Supported Operating Systems... 4 Dependencies...
SecurityCenter 4.8.x Upgrade Guide December 16, 2014 (Revision 1) Table of Contents Introduction... 3 Standards and Conventions... 3 Software Requirements... 4 Supported Operating Systems... 4 Dependencies...
Tenable for Palo Alto Networks
 How-To Guide Tenable for Palo Alto Networks Introduction This document describes how to deploy Tenable SecurityCenter and Nessus for integration with Palo Alto Networks next-generation firewalls (NGFW).
Tenable Common Criteria Evaluated Configuration Guide. October 29, 2009 (Revision 4)
") Tenable Common Criteria Evaluated Configuration Guide October 29, 2009 (Revision 4) Table of Contents TABLE OF CONTENTS... 2 OVERVIEW... 3 SECURITY CENTER COMPONENTS... 3 NESSUS VULNERABILITY SCANNER...
Tenable Common Criteria Evaluated Configuration Guide October 29, 2009 (Revision 4) Table of Contents TABLE OF CONTENTS... 2 OVERVIEW... 3 SECURITY CENTER COMPONENTS... 3 NESSUS VULNERABILITY SCANNER...
SecurityCenter 5.1 Administration Guide. November 12, 2015 (Revision 2)
") SecurityCenter 5.1 Administration Guide November 12, 2015 (Revision 2) Table of Contents Introduction... 6 Standards and Conventions... 6 Abbreviations... 7 SecurityCenter Administrator Functions... 7
SecurityCenter 5.1 Administration Guide November 12, 2015 (Revision 2) Table of Contents Introduction... 6 Standards and Conventions... 6 Abbreviations... 7 SecurityCenter Administrator Functions... 7
Tenable.io User Guide. Last Revised: November 03, 2017
 Tenable.io User Guide Last Revised: November 03, 2017 Table of Contents Tenable.io User Guide 1 Getting Started with Tenable.io 10 Tenable.io Workflow 12 System Requirements 15 Scanners and Agents 16 Link
ForeScout Extended Module for Tenable Vulnerability Management
 ForeScout Extended Module for Tenable Vulnerability Management Version 2.7.1 Table of Contents About Tenable Vulnerability Management Module... 4 Compatible Tenable Vulnerability Products... 4 About Support
Tenable.sc-Tenable.io Upgrade Assistant Guide, Version 2.0. Last Revised: January 16, 2019
 Tenable.sc-Tenable.io Upgrade Assistant Guide, Version 2.0 Last Revised: January 16, 2019 Table of Contents Welcome to the Tenable.sc-Tenable.io Upgrade Assistant 3 Get Started 4 Environment Requirements
How-to Guide: Tenable.io for Microsoft Azure. Last Updated: November 16, 2018
 How-to Guide: Tenable.io for Microsoft Azure Last Updated: November 16, 2018 Table of Contents How-to Guide: Tenable.io for Microsoft Azure 1 Introduction 3 Auditing the Microsoft Azure Cloud Environment
StreamSets Control Hub Installation Guide
 StreamSets Control Hub Installation Guide Version 3.2.1 2018, StreamSets, Inc. All rights reserved. Table of Contents 2 Table of Contents Chapter 1: What's New...1 What's New in 3.2.1... 2 What's New in
PVS 5.1 User Guide. Last Updated: October 10, 2016
 PVS 5.1 User Guide Last Updated: October 10, 2016 Table of Contents PVS 5.1 User Guide 1 Welcome to PVS 1 Getting Started with PVS 2 PVS Workflow 3 Hardware Requirements 4 Software Requirements 6 Licensing
SecurityCenter 4.6 Administration Guide. April 11, 2013 (Revision 5)
") SecurityCenter 4.6 Administration Guide April 11, 2013 (Revision 5) Table of Contents Introduction... 5 Standards and Conventions... 5 Abbreviations... 6 SecurityCenter Administrator Functions... 6 Starting/Halting
SecurityCenter 4.6 Administration Guide April 11, 2013 (Revision 5) Table of Contents Introduction... 5 Standards and Conventions... 5 Abbreviations... 6 SecurityCenter Administrator Functions... 6 Starting/Halting
Nessus Network Monitor 5.4 User Guide. Last Updated: February 20, 2018
 Nessus Network Monitor 5.4 User Guide Last Updated: February 20, 2018 Table of Contents Nessus Network Monitor 5.4 User Guide 1 Welcome to Nessus Network Monitor 8 NNM Workflow 9 System Requirements 10
Installation of RHEL 5 for Tenable SecurityCenter Evaluation
 Installation of RHEL 5 for Tenable SecurityCenter Evaluation These instructions are for the installation of Red Hat Enterprise Linux (RHEL) 5 in preparation for installing Tenable SecurityCenter 4.4 for
Entrust. Discovery 2.4. Administration Guide. Document issue: 3.0. Date of issue: June 2014
 Entrust Discovery 2.4 Administration Guide Document issue: 3.0 Date of issue: June 2014 Copyright 2010-2014 Entrust. All rights reserved. Entrust is a trademark or a registered trademark of Entrust, Inc.
PVS 4.4 User Guide. Revision April, 2016
 PVS 4.4 User Guide Revision 2 18 April, 2016 PVS 4.4 User Guide 1 About PVS 1 Getting Started with PVS 2 Hardware Requirements 3 Software Requirements 5 Licensing Requirements 6 Install, Upgrade, Configure,
Installing SmartSense on HDP
 1 Installing SmartSense on HDP Date of Publish: 2018-07-12 http://docs.hortonworks.com Contents SmartSense installation... 3 SmartSense system requirements... 3 Operating system, JDK, and browser requirements...3
CA Agile Central Administrator Guide. CA Agile Central On-Premises
 CA Agile Central Administrator Guide CA Agile Central On-Premises 2018.1 Table of Contents Overview... 3 Server Requirements...3 Browser Requirements...3 Access Help and WSAPI...4 Time Zone...5 Architectural
Nessus 7.0 User Guide. Last Updated: February 05, 2018
 Nessus 7.0 User Guide Last Updated: February 05, 2018 Table of Contents Welcome to Nessus 7.0 10 Nessus Workflow 13 Navigating Nessus 14 System Requirements 15 Hardware Requirements 16 Software Requirements
Data Protection Guide
 SnapCenter Software 4.1 Data Protection Guide For VMs and Datastores using the SnapCenter Plug-in for VMware vsphere September 2018 215-13399_B0 doccomments@netapp.com Table of Contents 3 Contents Deciding
Data Protection Guide
 SnapCenter Software 4.0 Data Protection Guide For VMs and Datastores using the SnapCenter Plug-in for VMware vsphere March 2018 215-12931_C0 doccomments@netapp.com Table of Contents 3 Contents Deciding
How-to Guide: Tenable Nessus for Microsoft Azure. Last Updated: April 03, 2018
 How-to Guide: Tenable Nessus for Microsoft Azure Last Updated: April 03, 2018 Table of Contents How-to Guide: Tenable Nessus for Microsoft Azure 1 Introduction 3 Auditing the Microsoft Azure Cloud Environment
Tenable.io for Thycotic
 How-To Guide Tenable.io for Thycotic Introduction This document describes how to deploy Tenable.io for integration with Thycotic Secret Server. Please email any comments and suggestions to support@tenable.com.
vcenter CapacityIQ Installation Guide
 vcenter CapacityIQ 1.0 This document supports the version of each product listed and supports all subsequent versions until the document is replaced by a new edition. To check for more recent editions
VMware Identity Manager Connector Installation and Configuration (Legacy Mode)
") VMware Identity Manager Connector Installation and Configuration (Legacy Mode) VMware Identity Manager This document supports the version of each product listed and supports all subsequent versions until
VMware Identity Manager Connector Installation and Configuration (Legacy Mode) VMware Identity Manager This document supports the version of each product listed and supports all subsequent versions until
Dell Storage Compellent Integration Tools for VMware
 Dell Storage Compellent Integration Tools for VMware Version 4.0 Administrator s Guide Notes, Cautions, and Warnings NOTE: A NOTE indicates important information that helps you make better use of your
CA Agile Central Installation Guide On-Premises release
 CA Agile Central Installation Guide On-Premises release 2016.2 Agile Central to Go 2017.1 rallysupport@rallydev.com www.rallydev.com 2017 CA Technologies (c) 2017 CA Technologies Version 2016.2 (c) Table
Dell Storage Integration Tools for VMware
 Dell Storage Integration Tools for VMware Version 4.1 Administrator s Guide Notes, cautions, and warnings NOTE: A NOTE indicates important information that helps you make better use of your product. CAUTION:
VMware AirWatch Content Gateway for Linux. VMware Workspace ONE UEM 1811 Unified Access Gateway
 VMware AirWatch Content Gateway for Linux VMware Workspace ONE UEM 1811 Unified Access Gateway You can find the most up-to-date technical documentation on the VMware website at: https://docs.vmware.com/
Storage Manager 2018 R1. Installation Guide
 Storage Manager 2018 R1 Installation Guide Notes, Cautions, and Warnings NOTE: A NOTE indicates important information that helps you make better use of your product. CAUTION: A CAUTION indicates either
Performing an ObserveIT Upgrade Using the Interactive Installer
 Performing an ObserveIT Upgrade Using the Interactive Installer ABOUT THIS DOCUMENT This document contains detailed procedures and instructions on how to upgrade ObserveIT by using the interactive "One
SafeConsole On-Prem Install Guide
 SafeConsole On-Prem Install Guide This guide applies to SafeConsole 5.0.5 Introduction This guide describes how to install a new SafeConsole server on Windows using the SafeConsole installer. As an option,
SafeConsole On-Prem Install Guide. version DataLocker Inc. July, SafeConsole. Reference for SafeConsole OnPrem
 version 5.2.2 DataLocker Inc. July, 2017 SafeConsole Reference for SafeConsole OnPrem 1 Contents Introduction................................................ 2 How do the devices become managed by SafeConsole?....................
Automation Anywhere Enterprise 10 LTS
 Automation Anywhere Enterprise 10 LTS Document Version: 1.3 Installation Guide Date of Publication: 15 th November, 2016 Update(s) to this document edition: Table of Contents 1. Client Prerequisites Processor
VMware AirWatch Content Gateway Guide for Linux For Linux
 VMware AirWatch Content Gateway Guide for Linux For Linux Workspace ONE UEM v9.7 Have documentation feedback? Submit a Documentation Feedback support ticket using the Support Wizard on support.air-watch.com.
ForeScout Extended Module for Qualys VM
 ForeScout Extended Module for Qualys VM Version 1.2.1 Table of Contents About the Qualys VM Integration... 3 Additional Qualys VM Documentation... 3 About This Module... 3 Components... 4 Considerations...
ElasterStack 3.2 User Administration Guide - Advanced Zone
 ElasterStack 3.2 User Administration Guide - Advanced Zone With Advance Zone Configuration TCloud Computing Inc. 6/22/2012 Copyright 2012 by TCloud Computing, Inc. All rights reserved. This document is
Cisco Unified Serviceability
 Cisco Unified Serviceability Introduction, page 1 Installation, page 5 Introduction This document uses the following abbreviations to identify administration differences for these Cisco products: Unified
Network Security Platform 8.1
 8.1.7.91-8.1.7.44 Manager-Virtual IPS Release Notes Network Security Platform 8.1 Revision B Contents About this release New features Enhancements Resolved issues Installation instructions Known issues
NGFW Security Management Center
 NGFW Security Management Center Release Notes 6.3.4 Revision A Contents About this release on page 2 System requirements on page 2 Build version on page 3 Compatibility on page 5 New features on page 5
McAfee Network Security Platform 8.3
 8.3.7.44-8.3.7.14 Manager-Virtual IPS Release Notes McAfee Network Security Platform 8.3 Revision A Contents About this release New features Enhancements Resolved issues Installation instructions Known
vcenter CapacityIQ Installation Guide
 vcenter CapacityIQ 1.0.1 This document supports the version of each product listed and supports all subsequent versions until the document is replaced by a new edition. To check for more recent editions
Installing and Configuring vcloud Connector
 Installing and Configuring vcloud Connector vcloud Connector 2.6.0 This document supports the version of each product listed and supports all subsequent versions until the document is replaced by a new
OpenManage Integration for VMware vcenter Quick Installation Guide for vsphere Web Client Version 3.2
 OpenManage Integration for VMware vcenter Quick Installation Guide for vsphere Web Client Version 3.2 Notes, cautions, and warnings NOTE: A NOTE indicates important information that helps you make better
WatchGuard Dimension v1.1 Update 1 Release Notes
 WatchGuard Dimension v1.1 Update 1 Release Notes Build Number 442674 Revision Date March 25, 2014 WatchGuard Dimension is the next-generation cloud-ready visibility solution for our Unified Threat Management
Administering vrealize Log Insight. September 20, 2018 vrealize Log Insight 4.7
 Administering vrealize Log Insight September 20, 2018 4.7 You can find the most up-to-date technical documentation on the VMware website at: https://docs.vmware.com/ If you have comments about this documentation,
How-to Guide: Tenable.io for Lieberman. Last Revised: August 14, 2018
 How-to Guide: Tenable.io for Lieberman RED Last Revised: August 14, 2018 Table of Contents Introduction 3 Integrations 4 Windows Integration 5 SSH Integration 11 Database Integration 17 Additional Information
vsphere Replication for Disaster Recovery to Cloud
 vsphere Replication for Disaster Recovery to Cloud vsphere Replication 6.0 This document supports the version of each product listed and supports all subsequent versions until the document is replaced
Online Help StruxureWare Data Center Expert
 Online Help StruxureWare Data Center Expert Version 7.2.7 What's New in StruxureWare Data Center Expert 7.2.x Learn more about the new features available in the StruxureWare Data Center Expert 7.2.x release.
Install and upgrade Qlik Sense. Qlik Sense 3.0 Copyright QlikTech International AB. All rights reserved.
 Install and upgrade Qlik Sense Qlik Sense 3.0 Copyright 1993-2016 QlikTech International AB. All rights reserved. Copyright 1993-2016 QlikTech International AB. All rights reserved. Qlik, QlikTech, Qlik
ForeScout CounterACT. Single CounterACT Appliance. Quick Installation Guide. Version 8.0
 ForeScout CounterACT Single CounterACT Appliance Version 8.0 Table of Contents Welcome to CounterACT Version 8.0... 4 CounterACT Package Contents... 4 Overview... 5 1. Create a Deployment Plan... 6 Decide
Dell Storage Compellent Integration Tools for VMware
 Dell Storage Compellent Integration Tools for VMware Administrator s Guide Version 3.1 Notes, Cautions, and Warnings NOTE: A NOTE indicates important information that helps you make better use of your
McAfee Network Security Platform 8.1
 Revision C McAfee Network Security Platform 8.1 (8.1.7.91-8.1.3.124 Manager-M-series Release Notes) Contents About this release New features Enhancements Resolved issues Installation instructions Known
ForeScout Extended Module for Carbon Black
 ForeScout Extended Module for Carbon Black Version 1.0 Table of Contents About the Carbon Black Integration... 4 Advanced Threat Detection with the IOC Scanner Plugin... 4 Use Cases... 5 Carbon Black Agent
Nessus 6.8 User Guide. Last Updated: November 28, 2017
 Nessus 6.8 User Guide Last Updated: November 28, 2017 Table of Contents Nessus 6.8 User Guide 1 Welcome to Nessus 10 Nessus Workflow 13 About Nessus Plugins 14 System Requirements 16 Hardware Requirements
Setting Up the Server
 Managing Licenses, page 1 Cross-launch from Prime Collaboration Provisioning, page 5 Integrating Prime Collaboration Servers, page 6 Single Sign-On for Prime Collaboration, page 7 Changing the SSL Port,
Zadara Enterprise Storage in
 Zadara Enterprise Storage in Google Cloud Platform (GCP) Deployment Guide March 2017 Revision A 2011 2017 ZADARA Storage, Inc. All rights reserved. Zadara Storage / GCP - Deployment Guide Page 1 Contents
Data Protection Guide
 SnapCenter Software 4.0 Data Protection Guide For Microsoft Exchange Server March 2018 215-12936_C0 doccomments@netapp.com Table of Contents 3 Contents Deciding whether to read the SnapCenter Data Protection
Installation Guide for Pulse on Windows Server 2012
 USER GUIDE MADCAP PULSE 4 Installation Guide for Pulse on Windows Server 2012 Copyright 2018 MadCap Software. All rights reserved. Information in this document is subject to change without notice. The
Installing Cisco CMX in a VMware Virtual Machine
 Installing Cisco CMX in a VMware Virtual Machine This chapter describes how to install and deploy a Cisco Mobility Services Engine (CMX) virtual appliance. Cisco CMX is a prebuilt software solution that
Installation on Windows Server 2008
 USER GUIDE MADCAP PULSE 4 Installation on Windows Server 2008 Copyright 2018 MadCap Software. All rights reserved. Information in this document is subject to change without notice. The software described
Administering vrealize Log Insight. 12-OCT-2017 vrealize Log Insight 4.5
 Administering vrealize Log Insight 12-OCT-2017 4.5 You can find the most up-to-date technical documentation on the VMware website at: https://docs.vmware.com/ If you have comments about this documentation,
SOURCEFIRE 3D SYSTEM RELEASE NOTES
 SOURCEFIRE 3D SYSTEM RELEASE NOTES Version 5.2.0.2 Original Publication: October 18, 2013 Last Updated: October 18, 2013 These release notes are valid for Version 5.2.0.2 of the Sourcefire 3D System. Even
NGFW Security Management Center
 NGFW Security Management Center Release Notes 6.4.0 Revision B Contents About this release on page 2 System requirements on page 2 Build version on page 3 Compatibility on page 4 New features on page 5
Upgrading an ObserveIT One-Click Installation
 Upgrading an ObserveIT One-Click Installation This document was written for ObserveIT Enterprise version 7.6.1. This document uses screenshots and procedures written for Windows Server 2012 R2 and SQL
Installing and Configuring VMware Identity Manager Connector (Windows) OCT 2018 VMware Identity Manager VMware Identity Manager 3.
 OCT 2018 VMware Identity Manager VMware Identity Manager 3.") Installing and Configuring VMware Identity Manager Connector 2018.8.1.0 (Windows) OCT 2018 VMware Identity Manager VMware Identity Manager 3.3 You can find the most up-to-date technical documentation on
Installing and Configuring VMware Identity Manager Connector 2018.8.1.0 (Windows) OCT 2018 VMware Identity Manager VMware Identity Manager 3.3 You can find the most up-to-date technical documentation on
McAfee Network Security Platform 8.3
 8.3.7.28-8.3.3.9 Manager-Mxx30-series Release Notes McAfee Network Security Platform 8.3 Revision C Contents About this release New features Enhancements Resolved issues Installation instructions Known
Dell Storage Manager 2016 R3 Installation Guide
 Dell Storage Manager 2016 R3 Installation Guide Notes, Cautions, and Warnings NOTE: A NOTE indicates important information that helps you make better use of your product. CAUTION: A CAUTION indicates either
HPE Security Fortify WebInspect Enterprise Software Version: Windows operating systems. Installation and Implementation Guide
 HPE Security Fortify WebInspect Enterprise Software Version: 17.10 Windows operating systems Installation and Implementation Guide Document Release Date: May 2017 Software Release Date: April 2017 Legal
VMware AirWatch Content Gateway Guide For Linux
 VMware AirWatch Content Gateway Guide For Linux AirWatch v9.2 Have documentation feedback? Submit a Documentation Feedback support ticket using the Support Wizard on support.air-watch.com. This product
KACE Systems Deployment Appliance 5.0. Administrator Guide
 KACE Systems Deployment Appliance 5.0 Administrator Guide Table of Contents About the KACE Systems Deployment Appliance...10 Getting started... 11 Tasks for getting started using the KACE SDA... 11 About
SOURCEFIRE 3D SYSTEM RELEASE NOTES
 SOURCEFIRE 3D SYSTEM RELEASE NOTES Version 5.3.0.2 Original Publication: April 21, 2014 Last Updated: April 25, 2016 These release notes are valid for Version 5.3.0.2 of the Sourcefire 3D System. Even
How-to Guide: Tenable Nessus for BeyondTrust. Last Revised: November 13, 2018
 How-to Guide: Tenable Nessus for BeyondTrust Last Revised: November 13, 2018 Table of Contents Welcome to Nessus for BeyondTrust 3 Integrations 4 Windows Integration 5 SSH Integration 10 API Configuration
Nessus 6.11 User Guide. Last Updated: June 13, 2018
 Nessus 6.11 User Guide Last Updated: June 13, 2018 Table of Contents Welcome to Nessus 6.11 10 Nessus Workflow 13 Navigating Nessus 14 System Requirements 15 Hardware Requirements 16 Software Requirements
Clearswift SECURE Gateway Installation & Getting Started Guide. Version Document Revision 1.0
 Clearswift SECURE Email Gateway Installation & Getting Started Guide Version 4.6.0 Document Revision 1.0 Copyright Revision 1.0, April, 2017 Published by Clearswift Ltd. 1995 2017 Clearswift Ltd. All rights
vsphere Replication for Disaster Recovery to Cloud vsphere Replication 8.1
 vsphere Replication for Disaster Recovery to Cloud vsphere Replication 8.1 You can find the most up-to-date technical documentation on the VMware website at: https://docs.vmware.com/ If you have comments
vsphere Replication for Disaster Recovery to Cloud vsphere Replication 6.5
 vsphere Replication for Disaster Recovery to Cloud vsphere Replication 6.5 You can find the most up-to-date technical documentation on the VMware website at: https://docs.vmware.com/ If you have comments
LCE Splunk Client 4.6 User Manual. Last Revised: March 27, 2018
 LCE Splunk Client 4.6 User Manual Last Revised: March 27, 2018 Table of Contents Getting Started with the LCE Splunk Client 3 Standards and Conventions 4 Install, Configure, and Remove 5 Download an LCE
NGFW Security Management Center
 NGFW Security Management Center Release Notes 6.4.4 Revision A Contents About this release on page 2 System requirements on page 2 Build version on page 3 Compatibility on page 5 New features on page 5
This guide details the deployment and initial configuration necessary to maximize the value of JetAdvantage Insights.
 HP JetAdvantage Insights Deployment Guide This guide details the deployment and initial configuration necessary to maximize the value of JetAdvantage Insights. 1. Overview HP JetAdvantage Insights provides
Redhat OpenStack 5.0 and PLUMgrid OpenStack Networking Suite 2.0 Installation Hands-on lab guide
 Redhat OpenStack 5.0 and PLUMgrid OpenStack Networking Suite 2.0 Installation Hands-on lab guide Oded Nahum Principal Systems Engineer PLUMgrid EMEA November 2014 Page 1 Page 2 Table of Contents Table
NGFW Security Management Center
 NGFW Security Management Center Release Notes 6.4.3 Revision A Contents About this release on page 2 System requirements on page 2 Build version on page 3 Compatibility on page 4 New features on page 5
Aspera Connect Windows XP, 2003, Vista, 2008, 7. Document Version: 1
 Aspera Connect 2.6.3 Windows XP, 2003, Vista, 2008, 7 Document Version: 1 2 Contents Contents Introduction... 3 Setting Up... 4 Upgrading from a Previous Version...4 Installation... 4 Set Up Network Environment...
SC-T35/SC-T45/SC-T46/SC-T47 ViewSonic Device Manager User Guide
 SC-T35/SC-T45/SC-T46/SC-T47 ViewSonic Device Manager User Guide Copyright and Trademark Statements 2014 ViewSonic Computer Corp. All rights reserved. This document contains proprietary information that
VMware Identity Manager Cloud Deployment. DEC 2017 VMware AirWatch 9.2 VMware Identity Manager
 VMware Identity Manager Cloud Deployment DEC 2017 VMware AirWatch 9.2 VMware Identity Manager You can find the most up-to-date technical documentation on the VMware website at: https://docs.vmware.com/
VMware Identity Manager Cloud Deployment. Modified on 01 OCT 2017 VMware Identity Manager
 VMware Identity Manager Cloud Deployment Modified on 01 OCT 2017 VMware Identity Manager You can find the most up-to-date technical documentation on the VMware Web site at: https://docs.vmware.com/ The
Firewall Enterprise epolicy Orchestrator
 Integration Guide McAfee Firewall Enterprise epolicy Orchestrator Extension version 5.2.1 COPYRIGHT Copyright 2011 McAfee, Inc. All Rights Reserved. No part of this publication may be reproduced, transmitted,
Clearswift SECURE Gateway Installation & Getting Started Guide. Version 4.3 Document Revision 1.0
 Clearswift SECURE Email Gateway Installation & Getting Started Guide Version 4.3 Document Revision 1.0 Copyright Revision 1.1, March, 2016 Published by Clearswift Ltd. 1995 2016 Clearswift Ltd. All rights
Cisco Prime Collaboration Deployment
 Install System Requirements for Installation, page 1 Browser Requirements, page 2 IP Address Requirements, page 2 Virtualization Software License Types, page 3 Frequently Asked Questions About the Installation,
Nessus 7.1 User Guide. Last Updated: July 12, 2018
 Nessus 7.1 User Guide Last Updated: July 12, 2018 Table of Contents Welcome to Nessus 7.1 10 Nessus Workflow 13 Navigating Nessus 14 System Requirements 15 Hardware Requirements 16 Software Requirements
Data Protection Guide
 SnapCenter Software 4.0 Data Protection Guide For Custom Plug-ins March 2018 215-12932_C0 doccomments@netapp.com Table of Contents 3 Contents Deciding on whether to read the SnapCenter Data Protection
Administering vrealize Log Insight. 05-SEP-2017 vrealize Log Insight 4.3
 Administering vrealize Log Insight 05-SEP-2017 4.3 You can find the most up-to-date technical documentation on the VMware website at: https://docs.vmware.com/ If you have comments about this documentation,
Log Correlation Engine 4.2 Quick Start Guide. September 4, 2014 (Revision 3)
") Log Correlation Engine 4.2 Quick Start Guide September 4, 2014 (Revision 3) Table of Contents Introduction... 3 Standards and Conventions... 3 Product Overview... 3 Prerequisites... 3 LCE Quick Start...
Log Correlation Engine 4.2 Quick Start Guide September 4, 2014 (Revision 3) Table of Contents Introduction... 3 Standards and Conventions... 3 Product Overview... 3 Prerequisites... 3 LCE Quick Start...
VIRTUAL GPU LICENSE SERVER VERSION , , AND 5.1.0
 VIRTUAL GPU LICENSE SERVER VERSION 2018.10, 2018.06, AND 5.1.0 DU-07754-001 _v7.0 through 7.2 March 2019 User Guide TABLE OF CONTENTS Chapter 1. Introduction to the NVIDIA vgpu Software License Server...
Network Security Platform 8.1
 8.1.7.91-8.1.3.124-2.11.9 Manager-XC-Cluster Release Notes Network Security Platform 8.1 Revision B Contents About this release New features Enhancements Resolved issues Installation instructions Known
VMware vrealize Log Insight Getting Started Guide
 VMware vrealize Log Insight Getting Started Guide vrealize Log Insight 2.5 This document supports the version of each product listed and supports all subsequent versions until the document is replaced