BPS 42 Chart Examples View
|
|
|
- Barry Lynch
- 6 years ago
- Views:
Transcription
1 BPS 42 Chart Examples View Functional Specifications Draft 3: August 3, 2006 Abstract This document presents the functional specifications of a new chart examples view. This allows user to immediately see the chart examples inside an Eclipse view without any configuration needed, and open the corresponding java code used to create a specific type of chart Document Revisions Draft Date Primary Author(s) Description of Changes 1 July 24, 2006 Nina Li Initial Draft 2 Aug 02, 2006 Nina Li Remove XML View 3 Aug 3, 2006 David Michonneau Minor updates - 1 -
2 Contents 1. Introduction UI Design Show View Examples Selector Preview Canvas Source Code View
3 1. Introduction 1.1 Scope 1.2 Goal This design document focuses on the UI design for the Chart Examples View. It describes how the view looks like (with mockups) and how to manipulate the view. At present, the design only supports for accessing the Examples View within Eclipse, not supported as a standalone application. The goal of this new view is to provide a quick overview and demo of the charting features inside an Eclipse view, as well as a tool for chart API developers to access quickly some code snippets to create different kinds of charts. 1.3 Packaging This view will be included in the SDK and example package. It is however not part of the BIRT perspective and has to be opened manually by users 2. UI Design 2.1 Show View BIRT chart examples view can be accessed within Eclipse Platform, go to the top menu, Window -> Show View -> Other - 3 -

4 Charting Examples is added into the view folder list. Expanding the Charting Examples folder, there is a sub-item: Examples View. The view will be opened in the South of the Eclipse platform by default

5 2.2 Examples Selector - 5 -
6 The Type Selector is placed in the left hand of the Examples View. It contains 9 example categories: Primitive Charts The primitive 2D chart examples (including all types & sub-types) D Charts 3D bar chart, 3D Line chart and 3D Area chart Live Charts Live charts (Data is feed dynamically) Combination Charts Combination Charts (only for ChartWithAxes) Formatted Charts Formatted charts category includes the following examples: curve fitting, X/Y axis label formatting, X/Y series value formatting, percentage values, colored by category/value series, plot formatting, title formatting, and legend formatting Scripted Charts Scripted charts category covers all supported script functions Interactive Charts Interactive charts category includes show_tooltip, url_redirect, toggle_visibility, highlight_series and call_back with different mouse actions Styled Charts Use the customized style to generate the chart model Data Operations Data operations category includes multiple Y series, multiple Y axes, grouping on Y axis, grouping on X series, min slice and auto-data binding N/A More categories could be added into the Examples View selector tree, if available. 2.3 Preview Canvas Preview When the user selects an item in a category from the selection tree, the generated chart is painted in the preview canvas. For interactivity charts, the mouse interactive events could be operated directly on the canvas. If the user selects a category, not an item, then leaves the canvas as blank

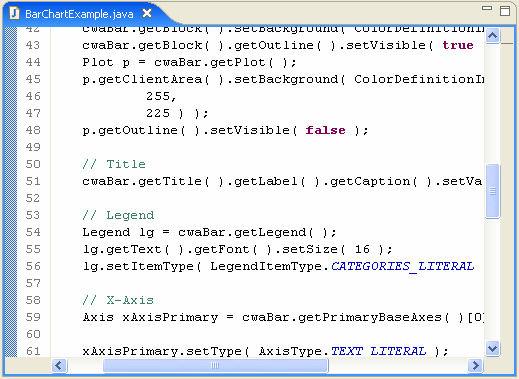
7 2.3.2 Description Description area is located in the right bottom of the Examples View. When the user selects an item in a category from the selection tree, the corresponding description is displayed. If the user selects a category, not an item, the description will be: Please select an example from the category ToolBar The ToolBar is placed on the top of the Examples View. The buttons could be added into the tool bar according to the requirements. At present, there are 2 buttons: The 1 st button (from left to right): save the chart models into xml file (*.chart) The 2 nd button (from left to right): open the corresponding source code Tooltips provided for these buttons If the user selects a category, not an item (example), the 2 buttons will be disabled. 2.4 Source Code View When the Open Source Code button is pushed, the corresponding source code will be opened in the Java Editor
8 - 8 -
BPS79- Sample Reports View
 Functional Specifications Draft 1.4: Apr. 03, 2007 Abstract This document presents the functional specifications of a sample reports view. It makes a set of sample reports easily accessible to the first
BPS 66 - Chart Simple API
 BPS 66 - Chart Simple API Functional Specification Draft 1: February 13, 2007 Abstract This document provides an API to easily modify charts inside a report design through the BIRT Report Engine Script
BPS 17 - Eclipse Chart Engine Scale/Axis/Grouping Enhancements
 BPS 17 - Eclipse Chart Engine Scale/Axis/Grouping Enhancements Draft 10: Dec 4 th, 2006 Abstract This document describes the enhancements for scale/axis/grouping support in the Eclipse Chart Engine. Document
This document describes the functional specifications of the Chart Scripting for BIRT release 1 and 2.
 Chart Scripting Functional Specifications Draft 5: November 1, 2005 Abstract This document describes the functional specifications of the Chart Scripting for BIRT release 1 and 2. Document Revisions Draft
3D Surface Plots with Groups
 Chapter 942 3D Surface Plots with Groups Introduction In PASS, it is easy to study power and sample size calculations for a range of possible parameter values. When at least 3 input parameters vary, you
Desktop Studio: Charts. Version: 7.3
 Desktop Studio: Charts Version: 7.3 Copyright 2015 Intellicus Technologies This document and its content is copyrighted material of Intellicus Technologies. The content may not be copied or derived from,
Desktop Studio: Charts
 Desktop Studio: Charts Intellicus Enterprise Reporting and BI Platform Intellicus Technologies info@intellicus.com www.intellicus.com Working with Charts i Copyright 2011 Intellicus Technologies This document
PASS Sample Size Software
 Chapter 941 Introduction In PASS, it is easy to study power and sample size calculations for a range of possible parameter values. When at least 2 input parameters vary, you can create stunning 3D power
Chart User Interface (v 2.0) Feature Specification
 Feature Specification") Chart User Interface (v 2.0) Feature Specification User Interface changes for Charts in BIRT v 2.0 This document is intended to give an overview of the UI changes for Charts in BIRT v 2.0. Table of Contents
Chart User Interface (v 2.0) Feature Specification User Interface changes for Charts in BIRT v 2.0 This document is intended to give an overview of the UI changes for Charts in BIRT v 2.0. Table of Contents
Module 4: Creating Content Lesson 4: Creating Charts Learn
 Module 4: Creating Content Lesson 4: Creating Charts Learn Welcome to Module 4, Lesson 4. In this lesson, you will learn how to create, edit, and save new charts based on your uploaded data using InfoAssist+.
Mend for Eclipse quick start guide local analysis
 The Semmle Mend for Eclipse plugin allows users to view Semmle results in Eclipse. This document describes how to install and use the plugin for local analysis. You can install the plugin using a Semmle
Technical Documentation Version 7.3 Output
 Technical Documentation Version 7.3 Output These documents are copyrighted by the Regents of the University of Colorado. No part of this document may be reproduced, stored in a retrieval system, or transmitted
This document describes the functional specifications of the Chart Components improvement for the BIRT 2.0 release.
 Chart Components Functional Specifications Draft 4: November 1, 2005 Abstract This document describes the functional specifications of the Chart Components improvement for the BIRT 2.0 release. Document
UI Course HTML: (Html, CSS, JavaScript, JQuery, Bootstrap, AngularJS) Introduction. The World Wide Web (WWW) and history of HTML
 Introduction. The World Wide Web (WWW) and history of HTML") UI Course (Html, CSS, JavaScript, JQuery, Bootstrap, AngularJS) HTML: Introduction The World Wide Web (WWW) and history of HTML Hypertext and Hypertext Markup Language Why HTML Prerequisites Objective
UI Course (Html, CSS, JavaScript, JQuery, Bootstrap, AngularJS) HTML: Introduction The World Wide Web (WWW) and history of HTML Hypertext and Hypertext Markup Language Why HTML Prerequisites Objective
9 POINTS TO A GOOD LINE GRAPH
 NAME: PD: DATE: 9 POINTS TO A GOOD LINE GRAPH - 2013 1. Independent Variable on the HORIZONTAL (X) AXIS RANGE DIVIDED BY SPACES and round up to nearest usable number to spread out across the paper. LABELED
Introduction to CS graphs and plots in Excel Jacek Wiślicki, Laurent Babout,
 MS Excel 2010 offers a large set of graphs and plots for data visualization. For those who are familiar with older version of Excel, the layout is completely different. The following exercises demonstrate
Tree and Data Grid for Micro Charts User Guide
 COMPONENTS FOR XCELSIUS Tree and Data Grid for Micro Charts User Guide Version 1.1 Inovista Copyright 2009 All Rights Reserved Page 1 TABLE OF CONTENTS Components for Xcelsius... 1 Introduction... 4 Data
Visualization Creator 03/30/06
 Visualization Creator 03/30/06 Overview In order to clearly communicate the interaction of various elements within the Visualization Creator (VC), we have described several scenarios in which the VC would
Exercise 4a: Creating and Editing XY Plots
 Exercise 4a: Creating and Editing XY Plots This exercise uses the data file, LINACC. Step 1: Load the file LINACC and create multiple plots. 1. Open HyperWorks Desktop and set the application to HyperGraph
Business Intelligence and Reporting Tools
 Business Intelligence and Reporting Tools Release 1.0 Requirements Document Version 1.0 November 8, 2004 Contents Eclipse Business Intelligence and Reporting Tools Project Requirements...2 Project Overview...2
DASYLab Techniques. Usage- Chart Recorder, Y/t Chart, X/Y Chart. Using Cursors in the Display Modules
 DASYLab Techniques Using Cursors in the Display Modules Updated to include DASYLab 2016 features The DASYLab graphical display modules render the data into a graphical chart display in the following DASYLab
BEAWebLogic Server. Using the WebLogic Diagnostic Framework Console Extension
 BEAWebLogic Server Using the WebLogic Diagnostic Framework Console Extension Version 10.0 Revised: March 30, 2007 Contents 1. Introduction and Roadmap What Is the WebLogic Diagnostic Framework Console
Creating and Modifying Charts
 Creating and Modifying Charts Introduction When you re ready to share data with others, a worksheet might not be the most effective way to present the information. A page full of numbers, even if formatted
A Simple First-Model Using the Berkeley-Madonna Program
 A Simple First-Model Using the Berkeley-Madonna Program For this introduction, we will be creating a model of a simple system with two compartments analogous to containers of a liquid which can flow between
Introduction to Layout Control with JMRI/PanelPro
 Introduction to Layout Control with JMRI/PanelPro Dick Bronson - R R -C irk its, I n c. Further Clinics in this series: Add Signals to your Layout with JMRI/PanelPro 10:00 PM, Sunday, July 13th Create
Microsoft Excel 2007
 Microsoft Excel 2007 1 Excel is Microsoft s Spreadsheet program. Spreadsheets are often used as a method of displaying and manipulating groups of data in an effective manner. It was originally created
Chart And Graph. Features. Features. Quick Start Folders of interest Bar Chart Pie Chart Graph Chart Legend
 Chart And Graph Features Quick Start Folders of interest Bar Chart Pie Chart Graph Chart Legend Overview Bar Chart Canvas World Space Category settings Pie Chart canvas World Space Pie Category Graph Chart
Auto Texture Tiling Tool
 Table of Contents Auto Texture Tiling Tool Version 1.77 Read Me 1. Basic Functionality...2 1.1 Usage...2 1.2 Unwrap Method...3 1.3 Mesh Baking...4 1.4 Prefabs...5 2. Gizmos and Editor Window...6 1.1 Offset...6
KaleidaGraph Quick Start Guide
 KaleidaGraph Quick Start Guide This document is a hands-on guide that walks you through the use of KaleidaGraph. You will probably want to print this guide and then start your exploration of the product.
Chemistry 30 Tips for Creating Graphs using Microsoft Excel
 Chemistry 30 Tips for Creating Graphs using Microsoft Excel Graphing is an important skill to learn in the science classroom. Students should be encouraged to use spreadsheet programs to create graphs.
Adding Support For a New Resource Manager
 Greg Watson PTP User/Developer Meeting, Chicago, September 2012 Adding Support For a New Resource Manager Introduction Based on The (JAXB) Configurable Resource Manager for PTP by Albert L. Rossi http://wiki.eclipse.org/images/2/28/jaxbdemo.pdf
Microsoft Excel. Charts
 Microsoft Excel Charts Chart Wizard To create a chart in Microsoft Excel, select the data you wish to graph or place yourself with in the conjoining data set and choose Chart from the Insert menu, or click
Notices. Restricted Rights Legend. Keysight Technologies Incorporated, Fountaingrove Pkwy., Santa Rosa, CA , United States
 Scripting MBP 2017 Notices Keysight Technologies Incorporated, 2002-2017 1400 Fountaingrove Pkwy., Santa Rosa, CA 95403-1738, United States All rights reserved. No part of this documentation may be reproduced
GE Fanuc Automation. CIMPLICITY HMI Plant Edition. Trend and XY Chart. CIMPLICITY Monitoring and Control Products.
 GE Fanuc Automation CIMPLICITY Monitoring and Control Products CIMPLICITY HMI Plant Edition Trend and XY Chart Operation Manual GFK-1260H July 2001 Following is a list of documentation icons: GFL-005 Warning
Transient Stability Analysis with PowerWorld Simulator
 Transient Stability Analysis with PowerWorld Simulator T8: Viewing Transient Stability Results 2001 South First Street Champaign, Illinois 61820 +1 (217) 384.6330 support@powerworld.com http://www.powerworld.com
Spreadsheet Software
 Spreadsheet Software Objectives: Working with Spreadsheets Enhancing Productivity Using the Application Open, close a spreadsheet application. Open, close documents. Create a new spreadsheet based on default
BEAWebLogic RFID. Enterprise Server. Using the Telemetry Console Extension
 BEAWebLogic RFID Enterprise Server Using the Telemetry Console Extension Version 2.0 Revised: October 12, 2006 Copyright Copyright 1995-2006 BEA Systems, Inc. All Rights Reserved. Restricted Rights Legend
BPS BIRT General Designer Usability Improvements Specification
 BPS 1131 - BIRT General Designer Usability Improvements Specification Feature Specification Abstract This is the feature specification for BIRT general designer usability improvements. Revisions Version
Chapter 3: Rate Laws Excel Tutorial on Fitting logarithmic data
 Chapter 3: Rate Laws Excel Tutorial on Fitting logarithmic data The following table shows the raw data which you need to fit to an appropriate equation k (s -1 ) T (K) 0.00043 312.5 0.00103 318.47 0.0018
Auto Texture Tiling Tool
 Table of Contents Auto Texture Tiling Tool Version 1.80 Read Me 1. Basic Functionality...2 1.1 Usage...2 1.1.1 Dynamic Texture Tiling...2 1.1.2 Basic Texture Tiling...3 1.1.3 GameObject menu item...3 1.2
WEB DESIGNING COURSE SYLLABUS
 F.A. Computer Point #111 First Floor, Mujaddadi Estate/Prince Hotel Building, Opp: Okaz Complex, Mehdipatnam, Hyderabad, INDIA. Ph: +91 801 920 3411, +91 92900 93944 040 6662 6601 Website: www.facomputerpoint.com,
Programming Mobile Applications with Android Lab1
 Programming Mobile Applications Lab1 22-26 September, Albacete, Spain Jesus Martínez-Gómez Android Lab I.- Create, compile and execute a hello world application Follow the instructions to prepare your
Flint - Eclipse Based IDE User Manual
 1 E M B I E N T E C H N O L O G I E S Flint - Eclipse Based IDE User Manual Embien Technologies No 3, Sankarapandian Street, Madurai, India 625017 www.embien.com 2 3 Table of Contents 1 Introduction...
Microsoft Word for Report-Writing (2016 Version)
") Microsoft Word for Report-Writing (2016 Version) Microsoft Word is a versatile, widely-used tool for producing presentation-quality documents. Most students are well-acquainted with the program for generating
Microsoft Word for Report-Writing (2016 Version) Microsoft Word is a versatile, widely-used tool for producing presentation-quality documents. Most students are well-acquainted with the program for generating
COMPUTER TECHNOLOGY SPREADSHEETS BASIC TERMINOLOGY. A workbook is the file Excel creates to store your data.
 SPREADSHEETS BASIC TERMINOLOGY A Spreadsheet is a grid of rows and columns containing numbers, text, and formulas. A workbook is the file Excel creates to store your data. A worksheet is an individual
4. In the Change Chart Type dialog box, click the type of chart to which you want to change. 5. Click the chart style. 6. Click OK.
 PROCEDURES LESSON 21: BUILDING BASIC CHARTS Creating a Chart 1 Select the range of data you want to chart 2 Click the INSERT tab Charts Group 3 Click the desired chart category button 4 In the gallery,
Spreadsheet definition: Starting a New Excel Worksheet: Navigating Through an Excel Worksheet
 Copyright 1 99 Spreadsheet definition: A spreadsheet stores and manipulates data that lends itself to being stored in a table type format (e.g. Accounts, Science Experiments, Mathematical Trends, Statistics,
Creating a Basic Chart in Excel 2007
 Creating a Basic Chart in Excel 2007 A chart is a pictorial representation of the data you enter in a worksheet. Often, a chart can be a more descriptive way of representing your data. As a result, those
Sharing and Deploying MATLAB Programs Sundar Umamaheshwaran Amit Doshi Application Engineer-Technical Computing
 Sharing and Deploying Programs Sundar Umamaheshwaran Amit Doshi Application Engineer-Technical Computing 2016 The MathWorks, Inc. 1 Summary: Data Analytics Workflow Business Systems Smart Connected Systems
DATASTREAM CHART STUDIO GETTING STARTED
 DATASTREAM DATASTREAM CHART STUDIO GETTING STARTED Thomson Reuters Training Quick and easy access to Technical Analysis charts and data is essential in today s fast moving markets. The Datastream Chart
A Closer Look at XPages in IBM Lotus Domino Designer 8.5 Ray Chan Advisory I/T Specialist Lotus, IBM Software Group
 A Closer Look at XPages in IBM Lotus Domino Designer 8.5 Ray Chan Advisory I/T Specialist Lotus, IBM Software Group 2008 IBM Corporation Agenda XPage overview From palette to properties: Controls, Ajax
STUDENT NAME ECDL: EXCEL MR BENNELL. This is an example of how to use this checklist / evidence document
 This part contains an instruction, task or a skill which you need to sow evidence of being able to do Once you have completed a task and shown evidence of it write the date underneath the task instruction
Open Excel by following the directions listed below: Click on Start, select Programs, and the click on Microsoft Excel.
 Candy is Dandy Grading Rubric You have been hired to conduct some market research about M&M's. First, you had your team purchase 4 large bags and the results are given for the contents of those bags. You
REV 1. Quick Start Guide. MBE Control Solutions
 Quick Start Guide MBE Control Solutions AMBER Setup AMBER is usually sold preinstalled on a Windows 7-64 Workstation. A Self installation guide and installation software is available from MBE Control Solutions:
Microsoft Excel Using Excel in the Science Classroom
 Microsoft Excel Using Excel in the Science Classroom OBJECTIVE Students will take data and use an Excel spreadsheet to manipulate the information. This will include creating graphs, manipulating data,
Angel International School - Manipay
 Grade 07 Angel International School - Manipay 1 st Term Examination November, 2017 Computing Duration: 1.30 Hours 1) Choose the best answer: Part - 1 1) If a column displays #####, it means: a) The column
BIRT: Introduction to the Eclipse Business Intelligence & Reporting Tools Project
 BIRT: Introduction to the Eclipse Business Intelligence & Reporting Tools Project Paul Clenahan Eclipse BIRT Project Management Committee VP Product Management, Actuate Corporation 2007 by Actuate; made
Comparison and merge use-cases from practice with EMF Compare
 Comparison and merge use-cases from practice with EMF Compare Laurent Delaigue Philip Langer EMF Compare Working with models Comparing text files EMF Compare Working with models Comparing models EMF Compare
This version is the same as NetCDF Extractor V.2.0, but it has an API for plotting contour and heat map graphs.
 What is NetCDF Extractor V..? This version is the same as NetCDF Extractor V..0, but it has an API for plotting contour and heat map graphs. For applying this tool, please following these steps: Step :
For the SIA Features of GigaView. Introduction. Initial Dialog Bar
 For the SIA-3000 Features of GigaView One button solution for multiple DataCom compliant standards jitter testing. Comprehensive and versatile jitter analysis software enables users to quickly understand
Overview
 HTML4 & HTML5 Overview Basic Tags Elements Attributes Formatting Phrase Tags Meta Tags Comments Examples / Demos : Text Examples Headings Examples Links Examples Images Examples Lists Examples Tables Examples
Software Requirements Specification. for WAVED. Version 3.0. Prepared By:
 Software Requirements Specification for WAVED Version 3.0 Prepared By: Sean Bluestein, Kristian Calhoun, Keith Horrocks, Steven Nguyen, Hannah Pinkos Advisor: Kurt Schmidt Stakeholder: Climate Central
Kendo UI. Builder by Progress : What's New
 Kendo UI Builder by Progress : What's New Copyright 2017 Telerik AD. All rights reserved. July 2017 Last updated with new content: Version 2.0 Updated: 2017/07/13 3 Copyright 4 Contents Table of Contents
ADD A 3-D PIE CHART TO THE WORKBOOK
 ADD A 3-D PIE CHART TO THE WORKBOOK A pie chart is an easy way to show the relationship of items to the whole. In this exercise, you will be creating a Pie Chart that will show the relationship between
Step-by-step guide to making a simple graph in Google Sheets Mariëlle Hoefnagels, University of Oklahoma
 Step-by-step guide to making a simple graph in Google Sheets Mariëlle Hoefnagels, University of Oklahoma The following tutorial includes bare-bones instructions for using Google Sheets to make two types
Smart Tool Suite. Documentation. Users Manual. Version 1.0
 Smart Tool Suite Documentation Users Manual Version 1.0 1 Smart Tool Suite Users Manual Smart Tool Suite Description Installation Supported Operation Systems and Additional Licenses Installation Instructions
News in RSA-RTE 10.2 updated for sprint Mattias Mohlin, January 2018
 News in RSA-RTE 10.2 updated for sprint 2018.03 Mattias Mohlin, January 2018 Overview Now based on Eclipse Oxygen.2 (4.7.2) Contains everything from RSARTE 10.1 and also additional features and bug fixes
BIRT Report Object Model Base Elements
 BIRT Report Object Model Base Elements Functional Specification Draft 2: April 26, 2005 Abstract Describes the base elements for many of the BIRT components. Report Element is the base element for all
Excel 2010 Level 1: The Excel Environment
 Excel 2010 Level 1: The Excel Environment Table of Contents The Excel 2010 Environment... 1 The Excel Window... 1 File Tab... 1 The Quick Access Toolbar... 4 Access the Customize the Quick Access Toolbar
Introduction to Automation. What is automation testing Advantages of Automation Testing How to learn any automation tool Types of Automation tools
 Introduction to Automation What is automation testing Advantages of Automation Testing How to learn any automation tool Types of Automation tools Introduction to Selenium What is Selenium Use of Selenium
BioFuel Graphing instructions using Microsoft Excel 2003 (Microsoft Excel 2007 instructions start on page mei-7)
") BioFuel Graphing instructions using Microsoft Excel 2003 (Microsoft Excel 2007 instructions start on page mei-7) Graph as a XY Scatter Chart, add titles for chart and axes, remove gridlines. A. Select
BioFuel Graphing instructions using Microsoft Excel 2003 (Microsoft Excel 2007 instructions start on page mei-7) Graph as a XY Scatter Chart, add titles for chart and axes, remove gridlines. A. Select
Lab 1: Getting Started with IBM Worklight Lab Exercise
 Lab 1: Getting Started with IBM Worklight Lab Exercise Table of Contents 1. Getting Started with IBM Worklight... 3 1.1 Start Worklight Studio... 5 1.1.1 Start Worklight Studio... 6 1.2 Create new MyMemories
Latvijas Banka Statistical Database
 Latvijas Banka Statistical Database User Manual Version 2.03 Riga, July 2015 Latvijas Banka Statistical Database. User Manual 2 Table of contents 1. GENERAL PRINCIPLES... 3 1.1. LAYOUT OF THE USER INTERFACE...
TABLE OF CONTENTS INTRODUCTION... 2 OPENING SCREEN BEGIN ANALYSIS... 4 Start a New File or Open a Previously Saved File... 4
 3D-BLAST August 2010 TABLE OF CONTENTS INTRODUCTION... 2 OPENING SCREEN... 3 BEGIN ANALYSIS... 4 Start a New File or Open a Previously Saved File... 4 PROGRAM TOOLBAR... 5 NAVIGATING IN THE PROGRAM...
Tools for Mobile Web Eclipse Day Paul Beusterien Symbian Foundation August 26, 2010
 Tools for Mobile Web Eclipse Day 2010 Paul Beusterien Symbian Foundation August 26, 2010 Tools for Mobile Web Agenda Why TMW? What does TMW do? How is TMW made? Demo Future Directions Copyright 2010 Symbian
The PALOMA Eclipse Plug-in User Manual
 The PALOMA Eclipse Plug-in User Manual Cheng Feng April 28, 2015 Contents 1 Installation Instructions 2 2 Creating a New Project 4 3 Parse a PALOMA Model 4 4 Time-series Analysis 5 4.1 Performing stochastic
CS-Studio Display Builder
 CS-Studio Display Builder Tutorial presented: Spring 2017 EPICS Collaboration Meeting at KURRI, Osaka, Japan Megan Grodowitz, Kay Kasemir (kasemir@ornl.gov) Overview Display Builder replaces OPI Builder
Data Resource Centre, University of Guelph CREATING AND EDITING CHARTS. From the menus choose: Graphs Chart Builder... 20/11/ :06:00 PM Page 1
 From the menus choose: Graphs Chart Builder... 20/11/2009 12:06:00 PM Page 1 The Chart Builder dialog box is an interactive window that allows you to preview how a chart will look while you build it. 20/11/2009
The Chart Title can be formatted to change color, pattern, typeface, size and alignment using the Format Chart Title dialog box.
 Excel 2003 Formatting a Chart Introduction Page 1 By the end of this lesson, learners should be able to: Format the chart title Format the chart legend Format the axis Formatting the Chart Title Page 2
Microsoft Office Excel 2013 Courses 24 Hours
 Microsoft Office Excel 2013 Courses 24 Hours COURSE OUTLINES FOUNDATION LEVEL COURSE OUTLINE Getting Started With Excel 2013 Starting Excel 2013 Selecting the Blank Worksheet Template The Excel 2013 Cell
Model Curriculum. Telecom Terminal Equipment Application Developer (Native) SECTOR: SUB-SECTOR: OCCUPATION: REF ID: NSQF LEVEL:
 SECTOR: SUB-SECTOR: OCCUPATION: REF ID: NSQF LEVEL:") Model Curriculum Telecom Terminal Equipment Application Developer (Native) SECTOR: SUB-SECTOR: OCCUPATION: REF ID: NSQF LEVEL: TELECOM HANDSET (TERMINAL APPLICATIONS) TERMINAL EQUIPMENT APPLICATION DEVELOPER
Model Curriculum Telecom Terminal Equipment Application Developer (Native) SECTOR: SUB-SECTOR: OCCUPATION: REF ID: NSQF LEVEL: TELECOM HANDSET (TERMINAL APPLICATIONS) TERMINAL EQUIPMENT APPLICATION DEVELOPER
Data Should Not be a Four Letter Word Microsoft Excel QUICK TOUR
 Toolbar Tour AutoSum + more functions Chart Wizard Currency, Percent, Comma Style Increase-Decrease Decimal Name Box Chart Wizard QUICK TOUR Name Box AutoSum Numeric Style Chart Wizard Formula Bar Active
V-BOX Cloud Configuration
 V-BOX Cloud Configuration Website: http://www.we-con.com.cn/en Technical Support: support@we-con.com.cn Skype: fcwkkj Phone: 86-591-87868869 QQ: 1043098682 Technical forum: http://wecon.freeforums.net/
DataPro Quick Start Guide
 DataPro Quick Start Guide Introduction The DataPro application provides the user with the ability to download and analyze data acquired using the ULTRA-LITE PRO range of Auto Meter products. Please see
Website Editor. User Guide - Table of Contents. Overview. Use Case(s) Accessing the Tool. Editor Tools. Quick Tab Toolbar. Menu Bar.
 Accessing the Tool. Editor Tools. Quick Tab Toolbar. Menu Bar.") 2016 - Fall Edition Website Editor User Guide - Table of Contents Overview Use Case(s) Accessing the Tool Editor Tools Quick Tab Toolbar Menu Bar Adding Content Inserting Content Inserting Images Styling
2016 - Fall Edition Website Editor User Guide - Table of Contents Overview Use Case(s) Accessing the Tool Editor Tools Quick Tab Toolbar Menu Bar Adding Content Inserting Content Inserting Images Styling
Chapter 3. Determining Effective Data Display with Charts
 Chapter 3 Determining Effective Data Display with Charts Chapter Introduction Creating effective charts that show quantitative information clearly, precisely, and efficiently Basics of creating and modifying
User Manual. pdoc Forms Designer. Version 3.7 Last Update: May 25, Copyright 2018 Topaz Systems Inc. All rights reserved.
 User Manual pdoc Forms Designer Version 3.7 Last Update: May 25, 2018 Copyright 2018 Topaz Systems Inc. All rights reserved. For Topaz Systems, Inc. trademarks and patents, visit www.topazsystems.com/legal.
UNIVERSITI TEKNIKAL MALAYSIA MELAKA FAKULTI KEJURUTERAAN ELEKTRONIK DAN KEJURUTERAAN KOMPUTER
 UNIVERSITI TEKNIKAL MALAYSIA MELAKA FAKULTI KEJURUTERAAN ELEKTRONIK DAN KEJURUTERAAN KOMPUTER FAKULTI KEJURUTERAAN ELEKTRONIK DAN KEJURUTERAAN KOMPUTER BENC 2113 DENC ECADD 2532 ECADD LAB SESSION 6/7 LAB
Getting Started with DADiSP
 Section 1: Welcome to DADiSP Getting Started with DADiSP This guide is designed to introduce you to the DADiSP environment. It gives you the opportunity to build and manipulate your own sample Worksheets
Name: Chapter 7 Review: Graphing Quadratic Functions
 Name: Chapter Review: Graphing Quadratic Functions A. Intro to Graphs of Quadratic Equations: = ax + bx+ c A is a function that can be written in the form = ax + bx+ c where a, b, and c are real numbers
Section 33: Advanced Charts
 Section 33 Advanced Charts By the end of this Section you should be able to: Use Chart Options Add Moving Averages to Charts Change a 3D Chart View Use Data Labels and Markers Create Stacked Bar Charts
Pass-through of External Context Objects to ODA Data Providers Project Features Specification
 Pass-through of External Context Objects to ODA Data Providers Project Features Specification BPS #35 Version 1.45: November 10December 13, 2005 Abstract The Open Data Access (ODA) runtime API is currently
User Interface Changes for SYSPRO
 User Interface Changes for SYSPRO User Interface Changes for SYSPRO 7 3 Table of Contents Introduction... 4 User Interface Themes and Preferences... 4 Changes to the main menu in SYSPRO... 11 Conversion
Microsoft Office Outlook 2007: Basic Course 01 - Getting Started
 Microsoft Office Outlook 2007: Basic Course 01 - Getting Started Slide 1 Getting Started Course objectives Identify the components of the Outlook environment and use Outlook panes and folders Use Outlook
XTRACTION NEW FEATURES
 XTRACTION NEW FEATURES The new release of Xtraction provides a wide range of dynamic new features to enhance its already robust reporting and dashboard capabilities. INTERFACE The interface has been redesigned
Arkansas Curriculum Framework for Computer Applications II
 A Correlation of DDC Learning Microsoft Office 2010 Advanced Skills 2011 To the Arkansas Curriculum Framework for Table of Contents Unit 1: Spreadsheet Formatting and Changing the Appearance of a Worksheet
A Simple First-Model Using the Berkeley-Madonna Program
 A Simple First-Model Using the Berkeley-Madonna Program For this introduction, we will be creating a model of a simple system with two compartments analogous to containers of a liquid which can flow between
Introduction to Eclipse
 Introduction to Eclipse Getting started with Eclipse 05/02/2010 Prepared by Chris Panayiotou for EPL 233 1 What is Eclipse? o Eclipse is an open source project http://www.eclipse.org Consortium of companies,
Advanced Excel. Click Computer if required, then click Browse.
 Advanced Excel 1. Using the Application 1.1. Working with spreadsheets 1.1.1 Open a spreadsheet application. Click the Start button. Select All Programs. Click Microsoft Excel 2013. 1.1.1 Close a spreadsheet
Using the reporting function
 11/17 ArtemiS SUITE 1 provides a very versatile reporting functionality, which makes it easy for you to present your analysis results in clearly arranged reports. This describes the first steps with this