Paper Abstract. Introduction. SAS Version 7/8 Web Tools. Using ODS to Create HTML Formatted Output. Background
|
|
|
- Roy Riley
- 5 years ago
- Views:
Transcription
1 Paper The International Studies Project : SAS Version 7/8 Web Tools To The Rescue Lilin She, UNC-CH, Department Of Biostatistics, Chapel Hill, NC Jeffrey M. Abolafia, UNC-CH, Department Of Biostatistics, Chapel Hill, NC Abstract The Output Delivery System (ODS) and PROC TEMPLATE introduced in Version 7 of the SAS System has made procedure output more flexible. This paper demonstrates how the International Studies Project has used these tools to easily produce both tabular and graphical HTML formatted output. The paper also discusses how ODS can be used to create a navigation system to organize large volumes of output and how ODS can be used to customize procedure output. Introduction The International Studies Project necessitates continuous collaboration between investigators from the United States, China, Pakistan, Russia, and Poland. In the past, , FAX, and mail were the primary methods of communication and the sharing of data among investigators. These methods were slow and unreliable and often delayed the preparation of manuscripts. This paper demonstrates how the International Studies Project has been able to use the world wide web combined with new SAS tools introduced in Version 7 to facilitate and speed up the manuscript preparation process. Through a series of examples, we will show how the International Studies Project: 1) used ODS to easily create HTML formatted output; 2) used ODS to create a navigation system to organize large volumes of output; 3) used output objects to change the default output and more concisely present data; 4) used ODS and newly available SAS/GRAPH drivers to output graphs directly to the WWW and to create a contents page to view a series of graphs; 5) used the Template Procedure to convert a SAS data set to an HTML table; 6) used ODS to link table cell to graphs. Background The International Studies Project involves crosssectional epidemiological surveys, rescreens, and mortality follow-up surveys in disease in Russia, People's Republic of China and Poland. A fourth study, being conducted in Pakistan, is a clinical trial to increase knowledge and attitudes about CVD. Two of the most important activities for this project are sharing data and publishing manuscripts. In order for the project to be successful, there must be constant and continuous communication among investigators from the various countries. Communication in the project has often been problematic. Differences in technology, resources, hardware and software have made the sharing of data and results slow and unreliable. When the world wide web (WWW) became available to all investigators in the project, it was decided that this would be the medium for sharing both data and results. However this often led to additional work because HTML formatted output could not be directly produced when using version 6.12 of the SAS system. Furthermore, in version 6.12 the output of many procedures could not be output directly to a SAS data set. This made it difficult to tersely summarize a large volume of results. SAS Version 7/8 Web Tools Prior to version 7, SAS procedures produced output that was just in text or ASCII format. Output was designed for a traditional line-printer and was limited to monospaced fonts. Beginning with version 7, SAS introduced new tools to make procedure output more flexible. The Output Delivery System (ODS) was designed to overcome the limitations of traditional SAS output and to make new formatting options available to users. By using ODS SAS can produce traditional monospace output, a SAS data set containing any piece of SAS output, or output that is formatted in HTML. Using ODS to Create HTML Formatted Output Example 1 demonstrates how to use ODS to produce HTML formatted output (see Figure 1). The ODS LISTING CLOSE statement closes the default listing

2 destination. This step is optional. If desired, the default listing destination can remain open. The ODS HTML statement opens an HTML destination where output will begin to be captured in HTML format. By default, output is stored in the current directory. The destination is specified in the FILE option on the ODS HTML statement. At this point all procedure output will be captured in the specified HTML file. The ODS HTML CLOSE statement tells SAS to close the HTML destination. The HTML destination must be closed before you can browse the HTML files. The ODS listing statement restores the default listing destination. Using ODS to Navigate Large Volumes of HTML Formatted Output In the International Studies Project, each SAS program usually generates output from several SAS procedures. Example 2 demonstrates how to create a navigation system when producing large volumes of HTML formatted output. In the SAS code below, the BODY option identifies the file that contains HTML formatted output. The BODY option is required (Note: The BODY and FILE statements are interchangeable). The CONTENTS, FRAME, and PAGE options can be used to create a frame that includes a table of contents and a table of pages that link to the contents of the body file. The CONTENTS option identifies a file that contains a table of contents to the HTML file. The contents file links to the body file. The FRAME option identifies the file that links the table of contents, the page contents, and the body file. If you open the frame file, you will see a table of contents, a table of pages, and the body file (see Figure 2). The PAGE options identifies the file that contains a description of each page of the body file. Example 1. ods listing close; ods html file="e01body.html"; proc tabulate data=temp formchar = ' ' noseps f=6.2 order=data; where age10>= 30; class sex age10; var chol; table (age10=' ' all='all '), (sex=' ' all='all ')*(chol=' '*(mean='mean' std='sd')) / rts=20 condense box="age in Years"; ods html close; ods listing; Figure 1:

3 Example 2. ods listing close; ods html body ="E02body.html" contents ='E02cont.html' frame ='E02fram.html' page ='E02page.html'; proc corr data=temp; by sex; var chol ldl hdl; with BMI; ods html close; ods listing; Using ODS to Customize Procedure Output Many of the SAS procedures produce output that is not needed for a given analysis. Prior to version 7, output often had to be edited to select the necessary information for a report. In version 7/8, output is much more flexible. ODS can be used to customize the output of any procedure, so that only the desired output is produced. Second, ODS can be used to save any piece of procedure output in a SAS data set. Example 3a demonstrates how only selected components of PROC LIFETEST are sent to the default listing and HTML destinations. Example 3b illustrates how selected components of PROC LIFETEST can be saved as a SAS data set. In order to customize output objects or create SAS data sets from output objects, you must be able to determine the output object s name, path, and template. This is accomplished with the ODS TRACE statement. When TRACE is set to ON, information about each output object that is created is displayed in the SAS log. The ODS TRACE OFF statement will stop sending this information to the SAS LOG. In the example below, the ODS TRACE ON statement is used to identify the output objects for PROC LIFETEST. A portion of the output generated by TRACE ON is shown in Figure 3. Once output object names and paths have been identified, a subset of output objects for a given procedure can be selected. From the output object information, we were able to determine that the statistics desired were contained in the output object HomTests. By using the ODS SELECT HOMTESTS statement in Example 3a, only statistics associated with the output object HOMTESTS are sent to the default listing and HTML destinations (see Figure 4). Figure 2.
; strata cholcat; by sex; format sex sexfmt.; quit; ods trace off; ods html close; Figure 3.")
4 Example 3a. ods trace on; ods select HomTests; ods html file="e3abody.html" frame='e3afram.html' contents='e3acont.html'; proc lifetest data=outfile; time futime * mort (0); strata cholcat; by sex; format sex sexfmt.; quit; ods trace off; ods html close; Figure 3. Output Added: Name: ProductLimitEstimates Label: Product-Limit Estimates Template: Stat.Lifetest.ProductLimitEstimates Path: Lifetest.ByGroup1.Stratum1.ProductLimitEstimates Output Added: Name: HomStats Label: Rank Statistics Template: Stat.Lifetest.HomStats Path: Lifetest.ByGroup1.StrataHomogeneity.HomStats Output Added: Name: LogHomCov Label: Log-Rank Covariance Template: Stat.Lifetest.Matrix Path: Lifetest.ByGroup1.StrataHomogeneity.LogHomCov Figure 4.
5 The ODS OUPUT statement can be used to create a data set from an output object. In example 3b, the ODS OUPUT statement is used to create two data sets. Data values from the output object ProductLimitestimates are copied to the SAS data set Est and data from the output object HomTests are copied to the SAS data set Stats. Data sets Est and Stats are used later to produce a customized report. Creating Graphics on the Web Example 4 demonstrates producing graphics for the WWW. The HTML device driver can produce graphics that can be viewed with any web browser (see Figure 5.). The HTML device driver creates one or more GIF files, and one HTML file that references the GIF files created. Example 4 contains the statement GOPTIONS DEVICE=HTML. This causes SAS to create a file called index.html. It also creates a GIF file for every graph produced by the following PROC GPLOT (only 1 GIF file in this example). The GSFNAME field in the GOPTIONS statement points to the location where the files are stored. The NAME option on the PLOT statement in PROC GPLOT, specifies the name of the GIF file (E04PLOT.GIF in this example) for the plot produced by that PLOT statement. Example 3b. ods trace output/listing; ods output ProductLimitEstimates = Est HomTests = Stats; proc lifetest data=outfile; time futime * mort (0); strata cholcat; by sex; format sex sexfmt.; title2 'All-cause mortality, Sex Specific'; quit; ods trace off; Example 4. goptions noprompt device=html rotate=landscape gsfname=graf1 gsfmode=replace ftext=swissl; symbol1 interpol=join v=diamond; axis1 length=60 pct order=20 to 28 by 1; axis2 length=40 pct order=20 to 80 by 10; PROC GPLOT DATA=means; PLOT mbmi*age10 / legend frame vaxis=axis1 vminor=0 haxis=axis2 hminor=0 name='e04plot'; RUN;

6 Figure 5. Using ODS to Navigate A Series of Graphs on the WWW The ODS HTML statement can also be used to create SAS/GRAPH output for the web, as well as frames and a table of contents to navigate a collection of graphs. This is demonstrated in Example 5 below. In the ODS HTML statement, the FILE option specifies the file that contains the body file. When this file is opened in a browser, you can view the entire series of graphs that was generated. The body file does not contain the actual graphs, it contains links to each graph. As in example two, the FRAME option along with the Contents option can be used to create a navigation system. When the frame file is opened, it displays a table of contents and the body file (see Figure 6). In Example 5, the statement GOPTIONS DEVICE=GIF is used. This causes one GIF file to be output for each graph produced. The name of the GIF file is specified in the NAME option of the PLOT statement. In the example below, eight GIF files are created, each containing one graph. The frame file, E05fram.HTM can be opened and used to navigate the series of graphs. Example 5. ods html file ='E05body.htm' contents ='E05cont.htm' frame ='E05fram.htm'; %let wkdir = c:\lilin\sugi25; filename graf1 "&wkdir"; goptions noprompt rotate=landscape device=gif gsfname=graf1 gsfmode=append ftext=swissl; symbol1 i=j v=circle; axis1 length=60 pct order=20 to 28 by 1; axis2 length=40 pct order=20 to 80 by 10; %macro plot(sex, sexl, cholc, cholcl, pnum); PROC GPLOT DATA=means; where sex=&sex and cholcat=&cholc; format age10 agefmt.; PLOT BMI*AGE10 / legend frame vaxis=axis1 vminor=0 haxis=axis2 hminor=0 name="e05_&sex&cholc"; RUN; quit; %mend plot; %plot(1, Men, 1, Very Low, Plot 1); %plot(2, Women, 1, Very Low, Plot 2); %plot(1, Men, 2, Low, Plot 3); %plot(2, Women, 2, Low, Plot 4); %plot(1, Men, 3, Medium, Plot 5); %plot(2, Women, 3, Medium, Plot 6); %plot(1, Men, 4, High, Plot 7); %plot(2, Women, 4, High, Plot 8);


7 Figure 6. Converting A SAS Data Set to HTML Format Example 6 demonstrates converting a SAS data set to HTML format. In this example both PROC TEMPLATE and ODS are utilized. The ODS HTML FILE statement is used to specify the destination for the HTML formatted data. The PROC TEMPLATE creates a table template and binds the template to a data set. Table templates contain the collection of attributes and statements that describe a table or data set. The DEFINE TABLE statement creates and allocates the template Mytables.bmi. The COLUMN statement defines and orders the columns of the table. The column names must be the same as the variable names on the input data set. The USE_NAME statement tells the template to use Example 6. ods html file='e06body.htm' the variable labels (or the variable name if a label has not been assigned) in the input data set as the column headers. Each DEFINE column/end block (where column is the name of a column specified in the COLUMN statement) specifies the definition for a given column. Column definitions include information about column attributes (such as format, width, justification, and label), cell-style (such as color and font face), specifications for computed variables, as well as a myriad of other options. In Example 6 the Classlevel and Blank_dups options blank out duplicate values in adjacent columns (i.e., Sex and Age10). The Format option gets rid of the decimal places for the N column. At the end, the TEST statement binds the template created to the specified data set (data=means). The HTML formatted table can be seen in Figure 7. Figure 7. proc template; define table mytables.bmi; column sex age10 cholcat n bmi; classlevels; use_name; define sex; blank_dups; end; define age10; blank_dups; end; define n; format=8.0; end; end; test data=means; quit; ods html close;
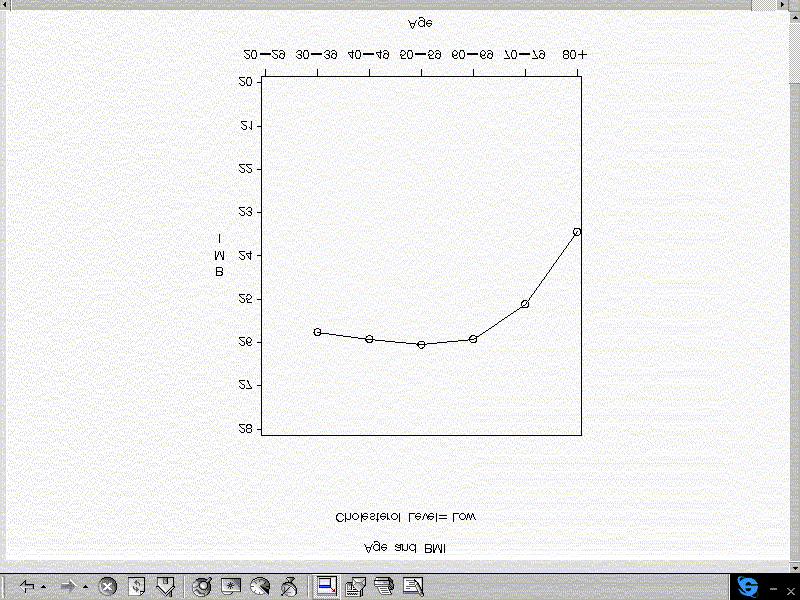
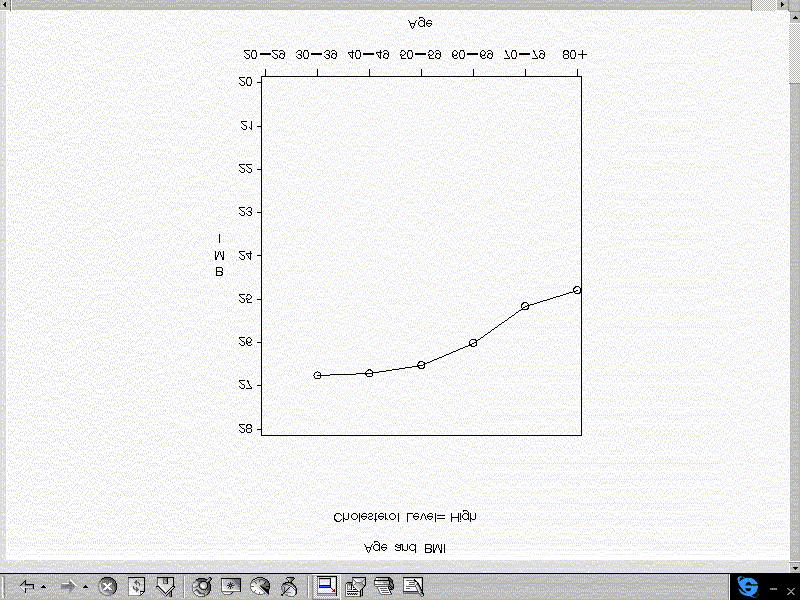
8 Embedding Hyperlinks in a HTML Formatted Table If you would like to present data details for each cell in a table, you may take advantage of the HTML s ability to embed hyperlinks in a web page. In the following example, the relationship between age and BMI (Body Mess Index) for four cholesterol groups (Very Low, Low, Medium and High) is depicted by four graphs (Figure 9, 10, 11 and 12). Also, the relationship between age, cholesterol, and BMI is shown in a table (see Figure 8). Instead of displaying all four graphs and the table on one Web page, you may want to create four hyperlinks in the table. Thus only the table is shown on a Web page, and the Example 7. %macro plot(cholc, cholcl); ods html file ="E07FIG&cholc..htm"; %let wkdir = c:\lilin\sugi25; filename graf1 "&wkdir"; goptions reset=all noprompt rotate=landscape device=gif gsfname=graf1 gsfmode=append ftext=swissl; symbol1 i=j v=circle; axis1 length=60 pct order=20 to 28 by 1; axis2 length=40 pct order=20 to 80 by 10; PROC GPLOT DATA=means; where cholcat=&cholc; format age10 agefmt.; PLOT BMI*AGE10 / legend frame vaxis=axis1 vminor=0 haxis=axis2 hminor=0 name="e07_&cholc"; label BMI='BMI'; RUN; quit; detailed data for each cholesterol group can be viewed by clicking on the corresponding link in the table. In the following SAS program, four HTML and four GIF files for the four graphs are created by using PROC GPLOT along with ODS. PROC FORMAT creates links to the HTML graph files for the four cholesterol groups (Very Low, Low, Medium and High). Then PROC TABULATE utilizes the format (i.e., chol1fmt) created in PROC FORMAT, embedding links in the table to each of the four graphs. A viewer can look at the details for any of the cholesterol groups by clicking on the link. %mend plot; %plot( 1, Very Low); %plot( 2, Low); %plot( 3, Medium); %plot( 4, High); proc format; value chol1fmt 1='<A HREF="E07FIG1.htm">Very Low</A>' 2='<A HREF="E07FIG2.htm">Low</A>' 3='<A HREF="E07FIG3.htm">Medium</A>' 4='<A HREF="E07FIG4.htm">High</A>'; ods listing close; ods html file="e07body.html ; proc tabulate data=means formchar = ' ' noseps f=6.2 order=data; class cholcat age10; var BMI; table cholcat=' ', age10='age in 10 years' *(BMI=' '*mean=' ') / rts=10 condense box="cholesterol Level"; format cholcat chol1fmt. age10 agefmt. ; quit; ods html close; ods listing;


9 Figure 8. Figure 9. Figure 11. Figure 10. Figure 12.
10 Conclusion The Output Delivery System (ODS) and PROC TEMPLATE along with the WWW have proven to be invaluable tools for the International Studies Project, a multi-center medical study. These new tools have facilitated the distribution of results and data and have expedited the manuscript preparation process. Furthermore, these new tools have made it easy to create a navigation system to present large volumes of results to a diverse group of end users. References Fehlner, W. (1999), Making the Output Delivery System (ODS) Work for You, Proceedings of the 24 th Annual SAS Users Group Intl. Conference, Paper 61. Kelley, D. & McNeill, S. (1999), Getting Stylish with Version 7 Base Reporting, Proceedings of the 24th Annual SAS Users Group Intl. Conference, Paper 190. Patel, H. & Caira, D. (1999), Using SAS/GRAPH Software to Create Graphs on the Web, Proceedings of the 24th Annual SAS Users Group Intl. Conference, Paper 189. Olinger, C. R. (1998), ODS for Data Analysis: Output As-You-Like-It in Version 7, Proceedings of the 23rd Annual SAS Users Group Intl. Conference, Paper 233. Olinger, C. R. (1999), Twisty Little Passages, All Alike ODS Templates Exposed, Proceedings of the 24th Annual SAS Users Group Intl. Conference, Paper 56. SAS Institute, Inc. (1999), The Complete Guide to the SAS Output Delivery System, Cary, NC: SAS Institute Inc. SAS, SAS/GRAPH are registered trademarks of SAS Institute Inc. in the USA and other countries. Indicates USA registration. Other brand and product names are registered trademarks or trademarks of their respective companies Contact Information Jeffrey Abolafia University of North Carolina Dept. of Biostatistics, CB #8030 Chapel Hill, NC uccjma@mail.cscc.unc.edu SubmissionNumber: I2114
Using SAS/GRAPH Software to Create Graphs on the Web Himesh Patel, SAS Institute Inc., Cary, NC Revised by David Caira, SAS Institute Inc.
 Paper 189 Using SAS/GRAPH Software to Create Graphs on the Web Himesh Patel, SAS Institute Inc., Cary, NC Revised by David Caira, SAS Institute Inc., Cary, NC ABSTRACT This paper highlights some ways of
Multiple Graphical and Tabular Reports on One Page, Multiple Ways to Do It Niraj J Pandya, CT, USA
 Paper TT11 Multiple Graphical and Tabular Reports on One Page, Multiple Ways to Do It Niraj J Pandya, CT, USA ABSTRACT Creating different kind of reports for the presentation of same data sounds a normal
Innovative Graph for Comparing Central Tendencies and Spread at a Glance
 Paper 140-28 Innovative Graph for Comparing Central Tendencies and Spread at a Glance Varsha C. Shah, CSCC, Dept. of Biostatistics, UNC-CH, Chapel Hill, NC Ravi M. Mathew, CSCC,Dept. of Biostatistics,
SAS Graphs in Small Multiples Andrea Wainwright-Zimmerman, Capital One, Richmond, VA
 Paper SIB-113 SAS Graphs in Small Multiples Andrea Wainwright-Zimmerman, Capital One, Richmond, VA ABSTRACT Edward Tufte has championed the idea of using "small multiples" as an effective way to present
Data Annotations in Clinical Trial Graphs Sudhir Singh, i3 Statprobe, Cary, NC
 PharmaSUG2010 - Paper TT16 Data Annotations in Clinical Trial Graphs Sudhir Singh, i3 Statprobe, Cary, NC ABSTRACT Graphical representation of clinical data is used for concise visual presentations of
Coders' Corner. Paper ABSTRACT GLOBAL STATEMENTS INTRODUCTION
 Paper 70-26 Data Visualization of Outliers from a Health Research Perspective Using SAS/GRAPH and the Annotate Facility Nadia Redmond Kaiser Permanente Center for Health Research, Portland, Oregon ABSTRACT
A Dynamic Imagemap Generator Carol Martell, Highway Safety Research Center, Chapel Hill, NC
 A Dynamic Imagemap Generator Carol Martell, Highway Safety Research Center, Chapel Hill, NC ABSTRACT We learned that our web developers were turning a picture of the state of North Carolina with its one
Internet, Intranets, and The Web
 Paper 186-25 Producing Interactive Internet Presentations in SAS Software Iza Peszek, Merck & Co., Inc., Rahway, NJ ABSTRACT The ODS in SAS v.7 and higher allows users to create HTML files with drill-down
Quick Results with the Output Delivery System
 Paper 58-27 Quick Results with the Output Delivery System Sunil K. Gupta, Gupta Programming, Simi Valley, CA ABSTRACT SAS s new Output Delivery System (ODS) opens a whole new world of options in generating
SUGI 29 Posters. Paper A Group Scatter Plot with Clustering Xiaoli Hu, Wyeth Consumer Healthcare., Madison, NJ
 Paper 146-29 A Group Scatter Plot with Clustering Xiaoli Hu, Wyeth Consumer Healthcare., Madison, NJ ABSTRACT In pharmacokinetic studies, abnormally high values of maximum plasma concentration Cmax of
Interactive Graphs from the SAS System
 Interactive Graphs from the SAS System Shi-Tao Yeh, GlaxoSmithKline, King of Prussia, PA. ABSTRACT An interactive graph is a dynamic graph interface that allows viewers interaction. The SAS System provides
The GANNO Procedure. Overview CHAPTER 12
 503 CHAPTER 12 The GANNO Procedure Overview 503 Procedure Syntax 504 PROC GANNO Statement 504 Examples 507 Example 1: Scaling Data-Dependent Output 507 Example 2: Storing Annotate Graphics 509 Example
ODS For Dummies. Creation of Output
 ODS For Dummies Chris Olinger, SAS, Cary, NC Abstract The Output Delivery System (ODS) in Version 7 and Version 8 of the SAS System provides a powerful feature set for customizing SAS output. This paper
A Juxtaposition of Tables and Graphs Using SAS /GRAPH Procedures
 A Juxtaposition of Tables and Graphs Using SAS /GRAPH Procedures Suhas R. Sanjee, MaxisIT Inc., Edison, NJ Sheng Zhang, Merck and Co., Upper Gwynedd, PA ABSTRACT Graphs provide high-impact visuals that
Using MACRO and SAS/GRAPH to Efficiently Assess Distributions. Paul Walker, Capital One
 Using MACRO and SAS/GRAPH to Efficiently Assess Distributions Paul Walker, Capital One INTRODUCTION A common task in data analysis is assessing the distribution of variables by means of univariate statistics,
Version 8 ODS (Output Delivery System)
") Version 8 ODS (Output Delivery System) Prepared by International SAS Training and Consulting A SAS Institute Quality Partner 100 Great Meadow Rd, Suite 601 Wethersfield, CT 06109-2379 Phone: (860) 721-1684
Version 8 ODS (Output Delivery System) Prepared by International SAS Training and Consulting A SAS Institute Quality Partner 100 Great Meadow Rd, Suite 601 Wethersfield, CT 06109-2379 Phone: (860) 721-1684
A SAS Macro to Generate Caterpillar Plots. Guochen Song, i3 Statprobe, Cary, NC
 PharmaSUG2010 - Paper CC21 A SAS Macro to Generate Caterpillar Plots Guochen Song, i3 Statprobe, Cary, NC ABSTRACT Caterpillar plots are widely used in meta-analysis and it only requires a click in software
QUERIES BY ODS BEGINNERS. Varsha C. Shah, Dept. of Biostatistics, UNC-CH, Chapel Hill, NC
 QUERIES BY ODS BEGINNERS Varsha C. Shah, Dept. of Biostatistics, UNC-CH, Chapel Hill, NC ABSTRACT This paper presents a list of questions often asked by those initially experimenting with ODS output. Why
Square Peg, Square Hole Getting Tables to Fit on Slides in the ODS Destination for PowerPoint
 PharmaSUG 2018 - Paper DV-01 Square Peg, Square Hole Getting Tables to Fit on Slides in the ODS Destination for PowerPoint Jane Eslinger, SAS Institute Inc. ABSTRACT An output table is a square. A slide
THE IMPACT OF DATA VISUALIZATION IN A STUDY OF CHRONIC DISEASE
 THE IMPACT OF DATA VISUALIZATION IN A STUDY OF CHRONIC DISEASE South Central SAS Users Group SAS Educational Forum 2007 Austin, TX Gabe Cano, Altarum Institute Brad Smith, Altarum Institute Paul Cuddihy,
Let There Be Highlights: Data-driven Cell and Row Highlights in %TAB2HTM and %DS2HTM Output
 Let There Be Highlights: Data-driven Cell and Row Highlights in %TAB2HTM and %DS2HTM Output Introduction The SAS System for Information Delivery provides powerful and flexible web publishing tools (SAS
ABC s of Graphs in Version 8 Caroline Bahler, Meridian Software, Inc.
 ABC s of Graphs in Version 8 Caroline Bahler, Meridian Software, Inc. Abstract Version 8 has greatly increased the versatility and usability of graphs that can be created by SAS. This paper will discuss
ODS and Web Enabled Device Drivers: Displaying and Controlling Large Numbers of Graphs. Arthur L. Carpenter and Richard O. Smith Data Explorations
 ODS and Web Enabled Device Drivers: Displaying and Controlling Large Numbers of Graphs Arthur L. Carpenter and Richard O. Smith Data Explorations ABSTRACT With the advent of the Output Delivery System,
Paper SIB-096. Richard A. DeVenezia, Independent Consultant, Remsen, NY
 Paper SIB-096 Tag Clouds - A list of tokens, sized by relative frequency Richard A. DeVenezia, Independent Consultant, Remsen, NY Abstract A tag cloud is a list of tokens, wherein the text size of a token
Chapter 28 Saving and Printing Tables. Chapter Table of Contents SAVING AND PRINTING TABLES AS OUTPUT OBJECTS OUTPUT OBJECTS...
 Chapter 28 Saving and Printing Tables Chapter Table of Contents SAVING AND PRINTING TABLES AS OUTPUT OBJECTS...418 OUTPUT OBJECTS...422 415 Part 2. Introduction 416 Chapter 28 Saving and Printing Tables
Chapter 6 Creating Reports. Chapter Table of Contents
 Chapter 6 Creating Reports Chapter Table of Contents Introduction...115 Listing Data...115 ListDataOptions...116 List Data Titles...118 ListDataVariables...118 Example:CreateaListingReport...119 Creating
SAS/GRAPH Introduction. Winfried Jakob, SAS Administrator Canadian Institute for Health Information
 SAS/GRAPH Introduction Winfried Jakob, SAS Administrator Canadian Institute for Health Information 1 Agenda Overview Components of SAS/GRAPH Software Device-Based vs. Template-Based Graphics Graph Types
Overview 14 Table Definitions and Style Definitions 16 Output Objects and Output Destinations 18 ODS References and Resources 20
 Contents Acknowledgments xiii About This Book xv Part 1 Introduction 1 Chapter 1 Why Use ODS? 3 Limitations of SAS Listing Output 4 Difficulties with Importing Standard Listing Output into a Word Processor
Tips to Customize SAS/GRAPH... for Reluctant Beginners et al. Claudine Lougee, Dualenic, LLC, Glen Allen, VA
 Paper SIB-109 Tips to Customize SAS/GRAPH... for Reluctant Beginners et al. Claudine Lougee, Dualenic, LLC, Glen Allen, VA ABSTRACT SAS graphs do not have to be difficult or created by SAS/GRAPH experts.
Data Presentation. Paper
 Paper 116-27 Using SAS ODS to Enhance Clinical Data Summaries: Meeting esub Guidelines Steven Light and Paul Gilbert, DataCeutics, Inc. Kathleen Greene, Genzyme Corporation ABSTRACT SAS programmers in
SAS/GRAPH : Using the Annotate Facility
 SAS/GRAPH : Using the Annotate Facility Jack S. Nyberg, ClinTrials Research, Inc., Lexington, KY. Stuart D. Nichols, ClinTrials Research, Inc., Lexington, KY. ABSTRACT The annotate facility in SAS/GRAPH
The GTESTIT Procedure
 967 CHAPTER 28 The GTESTIT Procedure Overview 967 About the Pictures 968 About the LOG 971 Procedure Syntax 972 PROC GTESTIT Statement 972 Examples 973 Example 1: Testing a GOPTIONS Statement 973 Overview
Internet/Intranet, the Web & SAS
 Dynamic Behavior from Static Web Applications Ted Durie, SAS, Overland Park, KS ABSTRACT Many Web applications, because of the infinite query combinations possible, require dynamic Web solutions. This
EXPORTING SAS OUTPUT ONTO THE WORLD WIDE WEB
 EXPORTING SAS OUTPUT ONTO THE WORLD WIDE WEB Shi-Tao Yeh, EDP Contract Services Andrew C. Yeh, Relyt Technologies Inc. ABSTRACT This paper presents a step by step demostration of exporting SAS list and
Choosing the Right Procedure
 3 CHAPTER 1 Choosing the Right Procedure Functional Categories of Base SAS Procedures 3 Report Writing 3 Statistics 3 Utilities 4 Report-Writing Procedures 4 Statistical Procedures 5 Efficiency Issues
Chapter 1 Introduction. Chapter Contents
 Chapter 1 Introduction Chapter Contents OVERVIEW OF SAS/STAT SOFTWARE................... 17 ABOUT THIS BOOK.............................. 17 Chapter Organization............................. 17 Typographical
Creating Forest Plots Using SAS/GRAPH and the Annotate Facility
 PharmaSUG2011 Paper TT12 Creating Forest Plots Using SAS/GRAPH and the Annotate Facility Amanda Tweed, Millennium: The Takeda Oncology Company, Cambridge, MA ABSTRACT Forest plots have become common in
Fly over, drill down, and explore
 ABSTRACT Paper 79-2013 Fly over, drill down, and explore Suzanne Brown, HealthInsight New Mexico, Albuquerque, NM Data often have a spatial dimension, whether it is a five-year financial plan and annual
It s Not All Relative: SAS/Graph Annotate Coordinate Systems
 Paper TU05 It s Not All Relative: SAS/Graph Annotate Coordinate Systems Rick Edwards, PPD Inc, Wilmington, NC ABSTRACT This paper discusses the SAS/Graph Annotation coordinate systems and how a combination
Effective Forecast Visualization With SAS/GRAPH Samuel T. Croker, Lexington, SC
 DP01 Effective Forecast Visualization With SAS/GRAPH Samuel T. Croker, Lexington, SC ABSTRACT A statistical forecast is useless without sharp, attractive and informative graphics to present it. It is really
IMPROVING A GRAPH USING PROC GPLOT AND THE GOPTIONS STATEMENT
 SESUG Paper 33-2017 IMPROVING A GRAPH USING PROC GPLOT AND THE GOPTIONS STATEMENT Wendi Wright, Questar Assessment, Inc. ABSTRACT Starting with a SAS PLOT program, we will transfer this plot into PROC
SAS Online Training: Course contents: Agenda:
 SAS Online Training: Course contents: Agenda: (1) Base SAS (6) Clinical SAS Online Training with Real time Projects (2) Advance SAS (7) Financial SAS Training Real time Projects (3) SQL (8) CV preparation
Making Presentations More Fun with DATA Step Graphics Interface (DSGI) Hui-Ping Chen, Eli Lilly and Company, Indianapolis, Indiana
 Hui-Ping Chen, Eli Lilly and Company, Indianapolis, Indiana") Paper CC03 Making Presentations More Fun with DATA Step Graphics Interface (DSGI) Hui-Ping Chen, Eli Lilly and Company, Indianapolis, Indiana ABSTRACT Microsoft PowerPoint is powerful and most popular
Paper CC03 Making Presentations More Fun with DATA Step Graphics Interface (DSGI) Hui-Ping Chen, Eli Lilly and Company, Indianapolis, Indiana ABSTRACT Microsoft PowerPoint is powerful and most popular
Using SAS/GRAPH Software to Create Graphs on The Web Himesh Patel, SAS Institute Inc., Cary, NC
 Using SAS/GRAPH Software to Create Graphs on The Web Himesh Patel, SAS Institute Inc., Cary, NC ABSTRACT Version 7 SAS/GRAPH software will contain several enhancements that enable users to easily display
SAS/STAT 14.1 User s Guide. Using the Output Delivery System
 SAS/STAT 14.1 User s Guide Using the Output Delivery System This document is an individual chapter from SAS/STAT 14.1 User s Guide. The correct bibliographic citation for this manual is as follows: SAS
USER TRAINING AND SUPPORT
 Printing in BAS- under OS/2- or Windows: A Tutoria1 Jeffrey M. Abolafia Collaborative Studies coordinating Center University of North Carolina at Chapel Hill Introduction Version 6.08 of the SAS System,
ABSTRACT MORE THAN SYNTAX ORGANIZE YOUR WORK THE SAS ENTERPRISE GUIDE PROJECT. Paper 50-30
 Paper 50-30 The New World of SAS : Programming with SAS Enterprise Guide Chris Hemedinger, SAS Institute Inc., Cary, NC Stephen McDaniel, SAS Institute Inc., Cary, NC ABSTRACT SAS Enterprise Guide (with
Automating the Production of Formatted Item Frequencies using Survey Metadata
 Automating the Production of Formatted Item Frequencies using Survey Metadata Tim Tilert, Centers for Disease Control and Prevention (CDC) / National Center for Health Statistics (NCHS) Jane Zhang, CDC
ODS in an Instant! Bernadette H. Johnson, The Blaze Group, Inc., Raleigh, NC
 Paper 210-28 ODS in an Instant! Bernadette H. Johnson, The Blaze Group, Inc., Raleigh, NC ABSTRACT Do you need to generate high impact word processor, printer- or web- ready output? Want to skip the SAS
ODS Meets SAS/IntrNet
 Paper 9-27 ODS Meets SAS/IntrNet Susan J. Slaughter, Avocet Solutions, Davis, CA Sy Truong, Meta-Xceed, Inc, Fremont, CA Lora D. Delwiche, University of California, Davis Abstract The SAS System gives
Displaying Multiple Graphs to Quickly Assess Patient Data Trends
 Paper AD11 Displaying Multiple Graphs to Quickly Assess Patient Data Trends Hui Ping Chen and Eugene Johnson, Eli Lilly and Company, Indianapolis, IN ABSTRACT Populating multiple graphs, up to 15, on a
Presentation Quality Graphics with SAS/GRAPH
 Presentation Quality Graphics with SAS/GRAPH Keith Cranford, Marquee Associates, LLC Abstract The SASI GRAP~ Annotate Facilily along with hardware fonts can be used to produce presentation qualily graphics
PharmaSUG Paper TT10 Creating a Customized Graph for Adverse Event Incidence and Duration Sanjiv Ramalingam, Octagon Research Solutions Inc.
 Abstract PharmaSUG 2011 - Paper TT10 Creating a Customized Graph for Adverse Event Incidence and Duration Sanjiv Ramalingam, Octagon Research Solutions Inc. Adverse event (AE) analysis is a critical part
SparkLines Using SAS and JMP
 SparkLines Using SAS and JMP Kate Davis, International Center for Finance at Yale, New Haven, CT ABSTRACT Sparklines are intense word-sized graphics for use inline text or on a dashboard that condense
Chapter 27 Saving and Printing Graphics
 Chapter 27 Saving and Printing Graphics Chapter Table of Contents CHOOSING FONTS...404 SETTING DISPLAY OPTIONS...406 SAVING GRAPHICS...407 SavingGraphicsCatalogs...407 SavingGraphicsFiles...408 PRINTING...410
Tips and Tricks in Creating Graphs Using PROC GPLOT
 Paper CC15 Tips and Tricks in Creating Graphs Using PROC GPLOT Qin Lin, Applied Clinical Intelligence, LLC, Bala Cynwyd, PA ABSTRACT SAS/GRAPH is a very powerful data analysis and presentation tool. Creating
SAS Graphs in Small Multiples. Andrea Wainwright-Zimmerman Capital One, Inc.
 SAS Graphs in Small Multiples Andrea Wainwright-Zimmerman Capital One, Inc. Biography From Wikipedia: Edward Rolf Tufte (1942) is an American statistician, and Professor Emeritus of statistics, information
ABSTRACT INTRODUCTION THE ODS TAGSET FACILITY
 Graphs in Flash Using the Graph Template Language Himesh Patel, SAS Institute Inc., Cary, NC David Kelley, SAS Institute Inc., Cary, NC Dan Heath, SAS Institute Inc., Cary, NC ABSTRACT The Graph Template
Beginning Tutorials. A Beginner's Guide to Incorporating SAS Output in Microsoft Office Applications Vincent DelGobbo, SAS Institute Inc.
 A Beginner's Guide to Incorporating SAS Output in Microsoft Office Applications Vincent DelGobbo, SAS Institute Inc., Cary, NC ABSTRACT This paper provides techniques for incorporating the output from
Arthur L. Carpenter California Occidental Consultants
 Paper HOW-004 SAS/GRAPH Elements You Should Know Even If You Don t Use SAS/GRAPH Arthur L. Carpenter California Occidental Consultants ABSTRACT We no longer live or work in a line printer - green bar paper
INTRODUCTION TO THE SAS ANNOTATE FACILITY
 Improving Your Graphics Using SAS/GRAPH Annotate Facility David J. Pasta, Ovation Research Group, San Francisco, CA David Mink, Ovation Research Group, San Francisco, CA ABSTRACT Have you ever created
Compute; Your Future with Proc Report
 Paper PO10 Compute; Your Future with Proc Report Ian J Dixon, GlaxoSmithKline, Harlow, UK Suzanne E Johnes, GlaxoSmithKline, Harlow, UK ABSTRACT PROC REPORT is widely used within the pharmaceutical industry
Paper CC01 Sort Your SAS Graphs and Create a Bookmarked PDF Document Using ODS PDF ABSTRACT INTRODUCTION
 Paper CC01 Sort Your SAS Graphs and Create a Bookmarked PDF Document Using ODS PDF Dirk Spruck, Accovion GmbH, Marburg, Germany Monika Kawohl, Accovion GmbH, Marburg, Germany ABSTRACT Graphs are a great
Using Annotate Datasets to Enhance Charts of Data with Confidence Intervals: Data-Driven Graphical Presentation
 Using Annotate Datasets to Enhance Charts of Data with Confidence Intervals: Data-Driven Graphical Presentation Gwen D. Babcock, New York State Department of Health, Troy, NY ABSTRACT Data and accompanying
Six Cool Things You Can Do In Display Manager Jenine Milum, Charlotte, NC Wachovia Bank
 Paper CC-029 Six Cool Things You Can Do In Display Manager Jenine Milum, Charlotte, NC Wachovia Bank ABSTRACT Many people use Display Manager but don t realize how much work it can actually do for you.
ODS LAYOUT is Like an Onion
 Paper DP03_05 ODS LAYOUT is Like an Onion Rich Mays, University of Rochester Medical Center, Rochester, NY Abstract ODS LAYOUT is like an onion. They both make you cry? No! They both have layers! In version
A Plot & a Table per Page Times Hundreds in a Single PDF file
 A Plot & a Table per Page Times Hundreds in a Single PDF file Daniel Leprince DIEM Computing Services, Inc. Elizabeth Li DIEM Computing Services, Inc. SAS is a registered trademark or trademark of SAS
Producing Summary Tables in SAS Enterprise Guide
 Producing Summary Tables in SAS Enterprise Guide Lora D. Delwiche, University of California, Davis, CA Susan J. Slaughter, Avocet Solutions, Davis, CA ABSTRACT This paper shows, step-by-step, how to use
The GSLIDE Procedure. Overview. About Text Slides CHAPTER 27
 959 CHAPTER 27 The GSLIDE Procedure Overview 959 About Text Slides 959 About Annotate Output 960 Procedure Syntax 960 PROC GSLIDE Statement 961 Examples 963 Example 1: Producing Text Slides 963 Example
SAS CLINICAL SYLLABUS. DURATION: - 60 Hours
 SAS CLINICAL SYLLABUS DURATION: - 60 Hours BASE SAS PART - I Introduction To Sas System & Architecture History And Various Modules Features Variables & Sas Syntax Rules Sas Data Sets Data Set Options Operators
SAS Graphics Accelerator: User s Guide
 SAS Graphics Accelerator: User s Guide SAS Documentation January 24, 2019 The correct bibliographic citation for this manual is as follows: SAS Institute Inc. 2017. SAS Graphics Accelerator: User s Guide.
SAS Graph: Introduction to the World of Boxplots Brian Spruell, Constella Group LLC, Durham, NC
 DP06 SAS Graph: Introduction to the orld of Boxplots Brian Spruell, Constella Group C, Durham, NC ABSTRACT Boxplots provide a graphical representation of a data s distribution. Every elementary statistical
Setting the Percentage in PROC TABULATE
 SESUG Paper 193-2017 Setting the Percentage in PROC TABULATE David Franklin, QuintilesIMS, Cambridge, MA ABSTRACT PROC TABULATE is a very powerful procedure which can do statistics and frequency counts
A Generalized Macro-Based Data Reporting System to Produce Both HTML and Text Files
 A Generalized Macro-Based Data Reporting System to Produce Both HTML and Text Files Jeff F. Sun, Blue Cross Blue Shield of North Carolina, Durham, North Carolina Abstract This paper will address the inter-connection
Applications Development. Paper 24-27
 Paper 24-27 Optimizing SAS Version 8 in a Windows Environment from the User Interface to Automated Document Production Roger D. Muller, Ph.D., Elanco Animal Health, Indianapolis, IN ABSTRACT The Microsoft
Paper S Data Presentation 101: An Analyst s Perspective
 Paper S1-12-2013 Data Presentation 101: An Analyst s Perspective Deanna Chyn, University of Michigan, Ann Arbor, MI Anca Tilea, University of Michigan, Ann Arbor, MI ABSTRACT You are done with the tedious
APPENDIX 4 Migrating from QMF to SAS/ ASSIST Software. Each of these steps can be executed independently.
 255 APPENDIX 4 Migrating from QMF to SAS/ ASSIST Software Introduction 255 Generating a QMF Export Procedure 255 Exporting Queries from QMF 257 Importing QMF Queries into Query and Reporting 257 Alternate
Developing Graphical Standards: A Collaborative, Cross-Functional Approach Mayur Uttarwar, Seattle Genetics, Inc., Bothell, WA
 PharmaSUG 2014 - DG03 Developing Graphical Standards: A Collaborative, Cross-Functional Approach Mayur Uttarwar, Seattle Genetics, Inc., Bothell, WA ABSTRACT Murali Kanakenahalli, Seattle Genetics, Inc.,
The Evolution of a SAS/GRAPH Application Jenine Eason, AutoTrader.com, Atlanta, GA
 Paper P05-04 The Evolution of a SAS/GRAPH Application Jenine Eason, AutoTrader.com, Atlanta, GA INTRODUCTION Graphs are an excellent way to represent any activity. The author is using web server errors
ImageNow eforms. Getting Started Guide. ImageNow Version: 6.7. x
 ImageNow eforms Getting Started Guide ImageNow Version: 6.7. x Written by: Product Documentation, R&D Date: September 2016 2014 Perceptive Software. All rights reserved CaptureNow, ImageNow, Interact,
I AlB 1 C 1 D ~~~ I I ; -j-----; ;--i--;--j- ;- j--; AlB
 PROC TABULATE: CONTROLLNG TABLE APPEARANCE August V. Treff Baltimore City Public Schools Office of Research and Evaluation ABSTRACT Proc Tabulate provides one, two, and three dimensional tables. Tables
Information Visualization
 Paper 158-25 Graphs In a Minute Harry J. Maxwell Jr., SAS Institute Inc, Cary, NC ABSTRACT Software from SAS Institute provides multiple ways of producing attractive graphics quickly using simple and intuitive
Chapter 3 Managing Results in Projects. Chapter Table of Contents
 Chapter 3 Managing Results in Projects Chapter Table of Contents Introduction... 55 Managing Projects... 55 CreatingaProject... 55 SavingaProject... 56 SavingaProjectUnderAnotherName... 57 RenamingaFolder...
A Generalized Procedure to Create SAS /Graph Error Bar Plots
 Generalized Procedure to Create SS /Graph Error Bar Plots Sanjiv Ramalingam, Consultant, Octagon Research Solutions, Inc. BSTRCT Different methodologies exist to create error bar related plots. Procedures
Report Writing, SAS/GRAPH Creation, and Output Verification using SAS/ASSIST Matthew J. Becker, ST TPROBE, inc., Ann Arbor, MI
 Report Writing, SAS/GRAPH Creation, and Output Verification using SAS/ASSIST Matthew J. Becker, ST TPROBE, inc., Ann Arbor, MI Abstract Since the release of SAS/ASSIST, SAS has given users more flexibility
MANAGING SAS/GRAPH DISPLAYS WITH THE GREPLAY PROCEDURE. Perry Watts IMS Health
 MANAGING SAS/GRAPH DISPLAYS WITH THE PROCEDURE Perry Watts IMS Health Abstract PROC is used for redisplaying graphs that have been stored in temporary or permanent catalogs. This tutorial will show how
Chapter 25 PROC PARETO Statement. Chapter Table of Contents. OVERVIEW SYNTAX SummaryofOptions DictionaryofOptions...
 Chapter 25 PROC PARETO Statement Chapter Table of Contents OVERVIEW...793 SYNTAX...794 SummaryofOptions...794 DictionaryofOptions...795 791 Part 7. The CAPABILITY Procedure SAS OnlineDoc : Version 8 792
The Implementation of Display Auto-Generation with Analysis Results Metadata Driven Method
 PharmaSUG 2015 - Paper AD01 The Implementation of Display Auto-Generation with Analysis Results Metadata Driven Method Chengxin Li, Boehringer Ingelheim Pharmaceuticals Inc., Ridgefield, CT, USA ABSTRACT
SAS Macros for Grouping Count and Its Application to Enhance Your Reports
 SAS Macros for Grouping Count and Its Application to Enhance Your Reports Shi-Tao Yeh, EDP Contract Services, Bala Cynwyd, PA ABSTRACT This paper provides two SAS macros, one for one grouping variable,
Output Delivery System (ODS) Simply the Basics
 Simply the Basics") Output Delivery System (ODS) Simply the Basics Kirk Paul Lafler, Software Intelligence Corporation, Spring Valley, California Abstract Are you looking for ways to improve or enhance the appearance of your
Output Delivery System (ODS) Simply the Basics Kirk Paul Lafler, Software Intelligence Corporation, Spring Valley, California Abstract Are you looking for ways to improve or enhance the appearance of your
Getting Up to Speed with PROC REPORT Kimberly LeBouton, K.J.L. Computing, Rossmoor, CA
 SESUG 2012 Paper HW-01 Getting Up to Speed with PROC REPORT Kimberly LeBouton, K.J.L. Computing, Rossmoor, CA ABSTRACT Learning the basics of PROC REPORT can help the new SAS user avoid hours of headaches.
Version 8 Base SAS Performance: How Does It Stack-Up? Robert Ray, SAS Institute Inc, Cary, NC
 Paper 9-25 Version 8 Base SAS Performance: How Does It Stack-Up? Robert Ray, SAS Institute Inc, Cary, NC ABSTRACT This paper presents the results of a study conducted at SAS Institute Inc to compare the
APPENDIX 2 Customizing SAS/ASSIST Software
 241 APPENDIX 2 Customizing SAS/ASSIST Software Introduction 241 Setting User Profile Options 241 Creating an Alternate Menu Bar 243 Introduction This appendix describes how you can customize your SAS/ASSIST
Easing into Data Exploration, Reporting, and Analytics Using SAS Enterprise Guide
 Paper 809-2017 Easing into Data Exploration, Reporting, and Analytics Using SAS Enterprise Guide ABSTRACT Marje Fecht, Prowerk Consulting Whether you have been programming in SAS for years, are new to
A Macro to replace PROC REPORT!?
 Paper TS03 A Macro to replace PROC REPORT!? Katja Glass, Bayer Pharma AG, Berlin, Germany ABSTRACT Some companies have macros for everything. But is that really required? Our company even has a macro to
A Fully Automated Approach to Concatenate RTF outputs and Create TOC Zhiping Yan, Covance, Beijing, China Lugang Xie, Merck, Princeton, US
 PharmaSUG China 2015 - Paper 28X-B9F7B4B9P8 A Fully Automated Approach to Concatenate RTF outputs and Create TOC Zhiping Yan, Covance, Beijing, China Lugang Xie, Merck, Princeton, US ABSTRACT Statistical
SAS Drug Development Program Portability
 PharmaSUG2011 Paper SAS-AD03 SAS Drug Development Program Portability Ben Bocchicchio, SAS Institute, Cary NC, US Nancy Cole, SAS Institute, Cary NC, US ABSTRACT A Roadmap showing how SAS code developed
New for SAS 9.4: A Technique for Including Text and Graphics in Your Microsoft Excel Workbooks, Part 1
 Paper HOW-245 New for SAS 9.4: A Technique for Including Text and Graphics in Your Microsoft Excel Workbooks, Part 1 Vincent DelGobbo, SAS Institute Inc. ABSTRACT A new ODS destination for creating Microsoft
Paper CC-016. METHODOLOGY Suppose the data structure with m missing values for the row indices i=n-m+1,,n can be re-expressed by
 Paper CC-016 A macro for nearest neighbor Lung-Chang Chien, University of North Carolina at Chapel Hill, Chapel Hill, NC Mark Weaver, Family Health International, Research Triangle Park, NC ABSTRACT SAS
Essential ODS Techniques for Creating Reports in PDF Patrick Thornton, SRI International, Menlo Park, CA
 Thornton, S. P. (2006). Essential ODS techniques for creating reports in PDF. Paper presented at the Fourteenth Annual Western Users of the SAS Software Conference, Irvine, CA. Essential ODS Techniques