Process Discovery Guide
|
|
|
- Paula Marshall
- 6 years ago
- Views:
Transcription


1 Interstage Business Process Manager Analytics V12.0 Process Discovery Guide Windows/Linux B1X January 2012
2 About this Manual This user guide explains how to install the Interstage Business Process Manager Analytics (BPMA). Intended Audience This manual is intended for Process Discovery users. It is assumed that the end user has a working knowledge of the following topics: - Database administration Chapter Overview Chapter Title 1 Process Discovery Overview Describes Process Discovery overview. 2 Data Requirements for Process Discovery Describes about data requirements for Process Discovery. 3 Preparing Business Data Describes about preparing Business Data. 4 Business Process Analysis and Interpretation Describes about business process analysis and interpretation. 5 Process Generator Overview Describes about Process Generator overview. 6 Process Generator Features Explains how to use Process Generator. 7 Process Analyzer Overview Describes about Process Analyzer overview. 8 Process Analyzer Features Explains how to use Process Generator. 9 Fixed-point Monitoring of Business Using Process Discovery Describes about fixed-point monitoring of business using Process Discovery. 10 Process Analysis Using IBPM Events Describes about process analysis using IBPM events. Appendix A Parameter Ranges Provides details of parameter ranges. Appendix B Commands Explains how to use commands. Typographical Conventions The following conventions are used throughout this manual. Command screen text Reference Parameter Example Meaning User input that must be typed is identified by the Courier font - GUI options to be selected by the end user are bold - GUI options that are emphasized are bold Reference material or related documentation is specified in italics Command parameters are identified by the Courier font Reference Materials The following related documentation is also available. Release Notes Contains an overview of the Analytics software and late-breaking information that could not be included in the manuals Overview Describes the architecture and features of the Analytics software - i -
3 Installation Guide Explains how to install Analytics Dashboard / Output Guide Explains how to use the Analytics Dashboard Administration Guide Covers administration tools and tips, message references, and troubleshooting Analytics Studio Guide Explains how to use the Analytics Studio to configure parameters that enforce Analytics features Management Console Guide Explains how to use the Management Console and Management Commands to configure key parameters, such as how to start/stop the Analytics software service or how to display the software status Abbreviations The following abbreviations are used throughout this document. Name Microsoft(R) Windows Server(TM) 2003, Standard Edition Microsoft(R) Windows Server(TM) 2003, Enterprise Edition Microsoft(R) Windows Server(TM) 2003 R2, Standard Edition Microsoft(R) Windows Server(TM) 2003 R2, Enterprise Edition Microsoft(R) Windows Server(R) 2008, Standard Edition Microsoft(R) Windows Server(R) 2008, Enterprise Edition Microsoft(R) Windows Server(R) 2008 R2 Standard Microsoft(R) Windows Server(R) 2008 R2 Enterprise Microsoft(R) Windows Server(TM) 2003, Standard x64 Edition Microsoft(R) Windows Server(TM) 2003, Enterprise x64 Edition Microsoft(R) Windows Server(TM) 2003 R2, Standard x64 Edition Microsoft(R) Windows Server(TM) 2003 R2, Enterprise x64 Edition Microsoft(R) Windows(R) XP Professional operating system Microsoft(R) Windows(R) XP Home Edition operating system Microsoft(R) Windows Vista(R) Business Microsoft(R) Windows Vista(R) Enterprise Microsoft(R) Windows Vista(R) Ultimate Microsoft(R) Windows(R) 7 Home Premium Microsoft(R) Windows(R) 7 Professional Microsoft(R) Windows(R) 7 Ultimate Microsoft(R) Internet Explorer 7.0 Microsoft(R) Internet Explorer 8.0 Microsoft(R) Internet Explorer 9.0 Solaris(TM) 10 operating system Red Hat Enterprise Linux AS Red Hat Enterprise Linux ES Red Hat Enterprise Linux 5 Red Hat Enterprise Linux 6 Interstage Application Server Enterprise Edition Interstage Application Server Standard-J Edition Interstage Studio Enterprise Edition Interstage Studio Standard-J Edition Abbreviation Windows Server Windows Server 2003( x64) or Windows Server 2003 Windows XP or Windows Windows Vista or Windows Windows 7 or Windows Internet Explorer Solaris 10 or Solaris Linux Interstage Application Server Interstage Studio or Studio - ii -
4 Name Interstage Business Process Manager Oracle Database 10g Enterprise Edition R10.1.0/R Oracle Database 10g Standard Edition R10.1.0/R Oracle Database 10g Standard Edition One R10.1.0/R Oracle Database 11g Enterprise Edition Oracle Database 11g Standard Edition Oracle Database 11g Standard Edition One Oracle Database 11g R2 Enterprise Edition Oracle Database 11g R2 Standard Edition Oracle Database 11g R2 Standard Edition One Microsoft SQL Server 2005 Standard Edition Microsoft SQL Server 2005 Enterprise Edition Microsoft SQL Server 2008 Standard Edition Microsoft SQL Server 2008 Enterprise Edition Abbreviation Interstage BPM or IBPM Oracle10g or Oracle Oracle11g or Oracle SQL Server 2005 or SQL Server SQL Server 2008 or SQL Server Export Regulations Fujitsu documents may include special technology regulated by foreign exchange and foreign trade regulation laws. If special technology is included, permission must be obtained under these laws before exporting a document or providing it to a non-resident. Trademarks - Microsoft, Windows, and Windows Server are trademarks or registered trademarks of Microsoft Corporation in the United States and other countries. - Oracle and Java are registered trademarks of Oracle and/or affiliates. Other names may be trademarks of their respective owners. - Linux is a registered trademark or trademark of Linus Torvalds in the United States and other countries. - Red Hat is a trademark or registered trademark of Red Hat Inc. in the United States and other countries. - SQL Server is a Microsoft Corporation (USA) product. - All other company and product names referred to in this document are general trademarks or registered trademarks of their respective owners. Requests - This document may be revised without notice. - Do not pass on this document to other parties without permission. - Our company bears no responsibility for third-party infringements of patent or other rights arising out of use of the data contained in this document. Copyright Copyright 2012 FUJITSU LIMITED Jan 2012 First Edition - iii -
5 Contents Chapter 1 Process Discovery Overview High-Level View of Business Process Visualization How to Use Business Process Visualizations Procedure Technical words of Process Discovery...3 Chapter 2 Data Requirements for Process Discovery Basic Requirements Recommended Requirements Table Structures that can be Processed...6 Chapter 3 Preparing Business Data Extracting Business Data Checking and Normalizing Data Plain Text Excel Files Database Dump Files Confirmation after Normalization Analyzing the Table Structure When Multiple Tables with the Same Schema Exist History Tables Timestamp Format Analyzing Event Keys Defining Events by Generalizing Attributes...11 Chapter 4 Business Process Analysis and Interpretation Checking Correctness of Data Business Analysis Testing Predictions about Processes Validating Conformation of Processes to Business Rules Discovering Inefficiencies in Processes Using Properties to Compare Processes Assessing Changes in Processes Over Time Assessing the Extent of Standardization Cost Simulation...21 Chapter 5 Process Generator Overview Window Configuration Getting Started Sample Process Generator Scenarios Data Type Data Type Data Type Chapter 6 Process Generator Features Process Generation Overview Selecting Model Creating New Models Renaming Models Profiling Setting Composite Items Selecting Correlation Candidates Selecting Correlation Candidates in Correlation Charts Selecting Correlation Candidates - Detailed Settings Extraction Item Settings Selecting Property Item for Analysis and Timestamp Type iv -
6 6.5.2 Selecting Timestamp Item and Event Name Item Generating Process Data Business Calendars Creating a Business Calendar Using Business Calendars...54 Chapter 7 Process Analyzer Overview Window Configuration Getting Started...55 Chapter 8 Process Analyzer Features Operation Menus Selecting Model Control Panel Slider Discover Typical Process Process Analysis Show Processes Show Property Distribution Show Action Time Distribution Set Filter Criteria Adding Filter Criteria Cost Settings Event Search Bar Route Analysis Route List Route Sorting Repeats Loopbacks Process View Panel Action Details Panel Exceptional Route Analysis Exceptional Process View Deviation Degree Process View Panel KPI Configuration Creating Alerts Creating Charts Pareto Chart Process Details Search...96 Chapter 9 Fixed-point Monitoring of Business Using Process Discovery Overview Auto-Generation of Processes KPI Alert KPI Chart Drilling down into Process Details Chapter 10 Process Analysis Using IBPM Events Overview Unit of Analysis Setting up for Event Collection How to launch the Process Analyzer Functionality of Process Analyzer Action count and time Parallel Analysis Process Details Not available functionalities v -
7 10.5 Deleting IBPM Events Appendix A Parameter Ranges Appendix B Commands B.1 Importing and Exporting Models B.2 Command to Forcibly Unlock Models in the Process Generator vi -


8 Chapter 1 Process Discovery Overview 1.1 High-Level View of Business Process Visualization 1.2 How to Use Business Process Visualizations For analyzing processes in an existing system - Understand the implementation of real time business process - Detect irregular processes and identify operational inefficiencies in a business For use as test scenarios when modifying or rebuilding a system - Used in theoretical assessments - Used to create data for system testing - Used to prioritize system testing scenarios Upgrading to a "Visualizable" system - Used as a measure to enforce business rules - Used to point out business processes that need improvement - 1 -


9 1.3 Procedure Refer to Chapter 3 Preparing Business Data for details about preparing data to be used by Process Discovery. Refer to Chapter 6 Process Generator Features for details on the Process Generator
10 Refer to Chapter 8 Process Analyzer Features for details on the Process Analyzer. 1.4 Technical words of Process Discovery Some technical words that are frequently used in the Process Discovery are explained. Model This represents a unit of Business Analysis. Event This represents a specific work. (Estimation, Purchase, Acceptance) Action This represents an occurrence of event, and arrow that connects between events is defined as Action. Action Time A difference between event occurrence times is defined as Action Time. Process An object that events are chronologically connected is defined as Process. Route A group of processes, which order of event occurrence is same respectively, is defined as Route. Process Diagram A group of whole processes (routes) is defined as Process Diagram. Property This is an additional information process possesses. Property can be used for filtering or analyzing of processes


11 Chapter 2 Data Requirements for Process Discovery This chapter covers the key characteristics of the type of data that must be fed into Process Discovery for effective business process visualization. 2.1 Basic Requirements The source data must include the following three types of information used as the input for Process Discovery - Time information Time when the event occurred - Event key Key that identifies a process (business event); at least one event key should exist for each record - Event type (event name) Is indicative of the meaning of a business event; for example, the table name might correspond to the event name, or the item value in the table might correspond to the event name 2.2 Recommended Requirements The following recommended requirements should be met for greater accuracy of business process visualization using Process Discovery
 - There must be enough event types (more than five event types is recommended).")
12 - Related event key - If each table has a different ID (event key), a common ID (related event key) across all tables is required. - Number of event types (event types or merged event types) - There must be enough event types (more than five event types is recommended). - Time information - This must be the history of business process execution times (a delivery schedule, however, does not provide suitable time information). - This time information cannot be overwritten (it is no longer usable when previous time information is deleted). - It should provide enough accuracy (for business processes that are updated every minute, dates are not sufficient). - Data period and amount - The period of the data must be longer than the average life span of a process. In order to generate processes certainly using actual business data, enough time for acquiring business data should be taken. - There must be a reasonable amount of data in the CSV data files (more than ten entries). - Mainframe system requirements - The data can be converted to RDB data, which can be forwarded to an open system, and then, be converted into CSV data. - DB access log requirements (journal) - It should be a business event log (a physical database log cannot be used). - Time information must be recorded, and its period renewed

, event key, and time information. These must all be available in one CSV file for Process Discovery.")
13 2.3 Table Structures that can be Processed Many different table structures are used in business databases, but only particular data patterns can be used by Process Discovery. Table structures that require processing Some data will need to be converted into a structure that Process Discovery can use. Do this when outputting the data to CSV. This applies to the following cases: - When data making up events is distributed across different tables. Each event consists of three types of information; event type (or event name), event key, and time information. These must all be available in one CSV file for Process Discovery. However, the structure of some database tables does not meet this condition. The following illustration shows an example of this. In a situation where two tables have been associated with ID fields that have no bearing on the actual business process, the event type can be generated from the table name (which is the CSV file name), but the event key and time information are in another table, so Process Discovery cannot use the data as is. In this case, by merging the tables using the ID fields (shown to the right of illustration (A), a CSV file can be created that includes the event ID and time information in the same table, and can therefore, be used by Process Discovery. The event type will also be unable to be extracted correctly if, as shown in illustration (B), the event type is in a table separate from the event key and time information, referenced by a "Status" field. In this case, by merging the tables using the ID fields (shown to the right of (B), a CSV file can be created that includes the "Status" field, "Order No." field, and "Time" field in the same table, and can therefore, be used by Process Discovery. Figure 2.1 Example of event data distributed across multiple tables - When data is stored in two or more tables There may be cases where data that should be stored in one table is spread out across several tables. This may occur due to backup requirements where one month's worth of data is stored in one table. These tables all have the same schema. When this data is applied to Process Discovery as multiple CSV files, Process Discovery recognizes every CSV file as a different event type. When this situation occurs, use a text editor to combine all the different CSV files into one before using them in Process Discovery. When making the conversion, take care of the header rows in the CSV files. Table structures that do not require processing or that have already been processed Tables are classified into eight different types, based on a combination of the following factors: - One table or multiple tables - One piece of information regarding time of actual job executions or multiple pieces - 6 -
.")
 (2) (3) (4) (5) (6) (7) (8) Figure 2.")
14 Note Times that do not relate directly to jobs may be excluded (projected times of delivery, for example, that do not relate to actual job executions). - Whether there is a field that indicates the process type Number of tables Pieces of time information Field that indicates the process type Classification One Two or more One Two or more None Exists (1) (2) (3) (4) (5) (6) (7) (8) Figure 2.2 Example table structure for each classification - Classification (1) Processes with only one event type are displayed in this case
15 - Classification (2) An event type is extracted from one of the tables. The event name will be the CSV filename plus the time field name. The event key will be the field specified by the event extraction tool. The event time will also be the field specified by the event extraction tool. This structure is used mainly when tables are created for each different process. - Classification (3) Event types are extracted from one table equal to the number of pieces of time information. The event name will be the CSV filename plus the time field name. This structure is mainly used when one table is created to see the progress of a process. - Classification (4) This is similar to classification 3, but the number of processes to be analyzed is greater. - Classification (5) The number of fields in the table that indicate the event type is greater than one. The event name will be the CSV filename plus the names of the items used to classify events (if more than one, they will be put one after the other) plus the time field name. This structure is used mainly when one table is created for the purpose of managing the history of a process. - Classification (6) This represents a case where a variety of processes are viewed from different perspectives, with each being managed using the method described in classification 5. - Classification (7) This represents a case where a group of events (equal to the number of pieces of time information) is treated as one record. For example, each process (for example, ordering or estimating) has a start time and a finish time. The table might, therefore, have fields for the different process, start times, and finish times. - Classification (8) This is similar to classification 7, but the number of processes to be analyzed is greater
16 Chapter 3 Preparing Business Data It is assumed that the data to be processed by Process Discovery is in the CSV format, converted from the data used in an RDB system. This chapter explains the preparations and precautions when analyzing data with the Process Discovery tool. 3.1 Extracting Business Data Extract data to the CSV format and ensure the first line of the CSV is a header with the titles of the items in the following rows 3.2 Checking and Normalizing Data This section explains what measures need to be taken when CSV format data cannot be obtained. The following data formats can be used as input: - Plain text - Excel file - Database dump files Plain Text Plain text can be in one of the following formats: CSV - Ensure each CSV file has a header row. If there is no header row, open the file in a text editor, and add an appropriate header. Tab separated values Open the file in a text editor, and replace the tabs with commas. After this conversion, follow the other points noted for CSV files. Other text formats If possible, convert to CSV format. This may be achieved with macro features available in some text editors. After this conversion, follow the other points noted for CSV files Excel Files Save the Microsoft Excel file in the CSV format. After this conversion, follow the other points noted for CSV files. Note the following points when saving the file: - Open the converted file in an editor to ensure that data, particularly those pertaining to time, have been saved as expected. Depending on the cell formatting, precision down to the second, or time may be output as numeric values. - Strings starting with "0" may be treated as numeric values. Leading zeros ("0") are not output if this is the case (for example, " " may be output as "12345"). Because event IDs are treated as strings, " " and "12345" would be determined as different values in Process Discovery. - Cells may include linefeeds. Ensure that the file conforms to the CSV formatting rules described above, or delete the linefeeds within cells before converting to CSV Database Dump Files Extract dump files from the business system and load them into another database environment. After that, convert the data into CSV format
17 Refer to the database manual for information on extracting dump files and loading data Confirmation after Normalization Confirm that the generated CSV data meets the following conditions by using Excel or similar products: - The number of columns, including the header line, is correct - The column expected to contain time information does not contain other types of information. 3.3 Analyzing the Table Structure Before analysis with Process Discovery, use the following points to determine if the table structure is one that can be analyzed When Multiple Tables with the Same Schema Exist Even when the specifications of the database only show one schema, there may actually be more than one type of CSV data corresponding to it. This situation can occur in the following cases: - Separate files are created for each period, though the usage is the same. In Process Discovery, each file is processed as a different event type. If the files have only been separated by period, but in effect, there is no need to separate them, they can easily be merged into one file and treated as one event type. Combine the CSV data before extracting the event. - The same schema is used for different types of information. In this case, information in the file name itself might be missed when the CSV data is merged, and it may not be processed correctly. In this case, it may be better to treat the CSV data as separate event types. Even if they are to be treated as separate events types, if there are fields within the data that indicates the type, the CSV data can be merged and the fields can be used to have the data recognized as a different type of event History Tables In a history table that contains two or more event types in one table, more than one field that identifies the event type will exist. Confirm which field identifies the event type Timestamp Format A template to detect the timestamp is built into Process Discovery. The template can handle the following formats. yyyy-mm-dd HH:mm:ss yyyy/mm/dd HH:mm:ss yyyy/m/d H:mm:ss yyyymmdd't'hhmmss yyyymmddhhmmss yyyy/mm/dd HH:mm yyyy/m/d H:mm yyyymmddhhmm millisec yyyy/mm/dd yyyy/m/d yyyymmdd yymmdd
18 d/m/yyyy H:mm:ss d/m/yyyy yy/m/d d/m/yy ddmmmyyyy yyyy+m+d yy-m-d d.m.yyyy M/d/yyyy M/d/yyyy H:mm:ss yyyy-m-d't'h:mm:ss yyyy-mm-dd HH:mm:ss.SSS yyyy/mm/dd HH:mm:ss.SSS yyyymmdd't'hhmmss.sss yyyymmddhhmmss.sss d/m/yyyy H:mm:ss.SSS M/d/yyyy H:mm:ss.SSS yyyy-m-d't'h:mm:ss.sss HH:mm:ss HHmmss HHmm H:mm:ss H:mm:ss.SSS HHmmss.SSS Analyzing Event Keys Find out whether the event key is composed of a single field (simple event key) or composed of multiple fields (composite event key). Confirm whether the composite event key relates to other tables Defining Events by Generalizing Attributes In some instances, the CSV data received from a customer may not contain file names or fields that can be interpreted as events. In this type of situation, we can rely on the fact that Process Discovery is a tool designed to deduce tasks performed by people from the data it is provided and produce a reliable event from the CSV data. In the following example of CSV data, shipping statuses are known to be entered using numbers. "0" for order received, "1" for ready for shipment, "2" for unshipped, and "3" for cancelled


19 An event for shipping status "0" can, therefore, be defined by combining field values, as shown below. This means that an event can be defined, which is easily recognizable as a task performed by a person
20 Chapter 4 Business Process Analysis and Interpretation This chapter explains how to analyze business processes, using Process Discovery, to identify irregularities that indicate inefficient processes. Timely detection of such weak processes requires prompt corrective action, which results in effective business processes characteristic of a productive business environment. 4.1 Checking Correctness of Data Business data must be correctly processed before it can be analyzed using the Process Discovery - Process Analyzer. Of course, the ideal scenario would be to enter the correct parameters in the Process Generator and generate the correct process. However, this is not always possible because the required information may not be available or, simply, due to mistakes. It is, therefore, recommended to perform certain checks before beginning the analysis. This ensures the results are closer to real-time expectation, reduces any rework, and saves both time and effort. Look out for the following scenarios to ensure the source data is correct for use by the Process Analyzer: - Routes are independent of the main process There may be cases where branches occur from INITIAL_STATE and flow to FINAL_STATE without crossing over. This indicates that there is no correlation between the event keys of these processes. Ensure the processes do not have correlations from a business perspective. If, however, it seems that correlations may exist, look for the Correlative Event Key. - Uncorrelated events are mixed Possible causes: - Event keys have been given associations even though they should never have been associated - Event keys that are different are considered to be the same - A Composite Event Key has been mistakenly defined as a Plain Event Key Refer to correlations in the Correlation Candidates Selection tab of the Process Generator, and check whether it is a Composite Event Key. - Order of events is not as expected Possible causes: - Time information may not be synchronized properly if the CSV data has been taken from different systems - Data from systems based on hours, minutes, and seconds could be mixed with data from systems based only on the date - Batch processes may have been included When batch processes are included, all the processes in a batch have exactly the same time information, or at least, it is very close. Process Discovery works on the principle that the order indicated by the time is the order in which processes are performed. This means that the order shown for events in batch processes may differ real-time. - Time information may have been updated by the system Some systems overwrite time information when some repetition occurs. 4.2 Business Analysis Testing Predictions about Processes This section explains how to test business processes and determine if the predefined process specified in the design document matches its real-time implementation. There are three key objectives for testing processes: - To understand the current process - Identify the types of processes applicable in a business scenario and distinguish between them - Processes that occur frequently conform to the predefined business rules and are referred to as Typical Processes
21 - Low-frequency processes or processes that are infrequent are more likely to have inconsistencies with the business rules and are referred to as Exceptional Processes - Find out whether there are discrepancies between the design and real-time implementation of processes - Some of the primary reasons for process discrepancies include: - Outdated design documents not up-to-date with the system or changes in procedures - Operational issues, such as usability of the system, may cause real-time processes to operate differently than their expected, predefined behavior - Underlying data, used for generating processes in Process Discovery, has not been collected correctly (for example, not enough data or mistakes in associations) Note Process Discovery uses data obtained from customers. It is, therefore, not always possible to obtain data for an extensive period (a year or more) due to the substantial work involved in data collection. This means that the collected data may not include data for certain seasons or special events (for example, end-of-year events). So, even if a process is specified in design documents, it cannot always be replicated using Process Discovery. Refer to the following procedures for testing business processes. Comparison with Typical Processes From Process Analyzer, select the Process Analysis tab to display the process diagram. Refer to the Process Filter area of the Control Panel. By default, the slider is set to 100% the maximum frequency of processes. This means that all processes are ordered by the occurrence rate of the route, with the highest number of occurrences first and showing up to 100%. Move the slider up to display processes that occur fewer times, making the process diagram more complex. Additionally, click Show Typical Process to display the Typical Process for your business. Doing this automatically sets the slider to a specific position. The process diagram displayed, at this point, depicts the Typical Process process that conforms to the predefined business rules. Check the flow of events in the process diagram for any irregularities. Comparison with predefined processes If process diagrams have been created as part of the design, compare these with the predefined Process Discovery diagram. Note that the granularity of the two diagrams may differ. While in Process Discovery, an event is the data entering a business system, a design may describe the instructions given to end users or show the flow of data. This means the two process diagrams will depict different aspects of the business process and the amount of detail they go into will also differ. Additionally, the order of events may differ between the processes generated using Process Discovery and the ones described in the design documents. Also, check for differences in the time information, if any Validating Conformation of Processes to Business Rules This section explains how to test if processes do not follow business rules. As defined in "1.2.1, Testing Predictions about Processes", there are two types of processes Typical and Exceptional. To analyze Exceptional Processes, use the following procedures to derive the degree of their deviation from business rules: High-level analysis of Exceptional Processes Exceptional Processes, that occur infrequently, often take steps that are not followed in most processes. Using Process Analyzer, you can display Exceptional Processes with Typical Processes and compare them to identify Exceptional Process activities that do not map with the Typical Process. These are the activities that do not conform to business rules

22 Filter Exceptional Processes that do not meet specific business rules If you are aware of specific business rules, Process Analyzer allows you to filter processes that do not conform to those rules. Consider a rule that requires an event called "Deliberation" to be triggered before the event "Approval". We can specify this rule in the Process Analyzer and filter specific processes that do not follow this rule. The following procedure describes how to filter Exceptional Processes using the Process Analyzer. 1. From the Process Analyzer, select the Exceptional Route Analysis tab. 2. Click Sort to display the Route Sorting dialog box. 3. Edit the available options to specify your filter criteria. a. Select the List Routes that do not meet the condition below first. b. Select an event from the Target Event list. c. Select an event from the Target Event Precondition box. This event will precede the event selected in the previous step
23 4. Click Apply. Processes that do not meet the specified criteria are displayed in the Exceptional Route List. Refer to " Route Sorting" for details. Filter Exceptional Processes that show specific actions For actions that do not conform to business rules, Process Analyzer allows you to filter processes that use these actions. The following procedure explains how to filter processes with specific actions using the Process Analyzer. 1. From the Process Analyzer, select the Exceptional Route Analysis tab. 2. Click Sort to display the Route Sorting dialog box. 3. Edit the available options to provide your filter criteria. a. Select List Routes containing these actions first. b. Select appropriate values for the Action Source and Action Destination. 4. Click Apply. Processes that follow the specified actions are displayed in the Exceptional Route List. Refer to " Route Sorting" for details Discovering Inefficiencies in Processes This section explains how to discover inefficiencies in business processes. Use the following guidelines to derive process inefficiencies using Process Analyzer: - Search for repetitious processes - Search for loopback processes - Search for bottlenecks that increase operational time Repetitious processes Inefficiencies are often associated with processes that are performed repeatedly. There are, of course, cases where processes must be repeated, and so, this is not the main criteria for identifying erroneous processes. Similarly, there are cases that appear to be repetitious but actually involve issuing of very similar details. Therefore, before determining if the repetitious nature of a process is actually a problem, consider the peculiarities of the system
24 To view the repetition frequency of a process, refer to the Repeats header in the Route List or Exceptional Route List for Typical Process and Exceptional Processes, respectively. Additionally, select the header to display the processes in the ascending or descending order. Loopback Processes Inefficiencies can also be discovered where a process that has already been successfully executed is performed again. Such processes are referred to as Loopback Processes. These processes, however, do not always indicate inefficiencies. Use your discretion to interpret loopback processes as erroneous

25 To view the number of loopbacks for a process, refer to the Loopbacks header in the Route List or Exceptional Route List for Typical Process and Exceptional Processes, respectively. Additionally, select the header to display the processes in the ascending or descending order. Bottlenecks that increase operational time Adjust the Control Panel settings to display the average action time and the standard deviation in a process diagram. Use the Show Action Time in options to enable the arrows - indicative of actions in a process - to display the average action time and standard deviation. Review the process diagram to identify actions that consume substantial average time or have significant standard deviation. Further, where the standard deviation is high, the time differences are also considerable. These are the areas in a process that need to be improvised for efficiency

26 4.2.4 Using Properties to Compare Processes You can use process properties to compare how different departments employ their processes, or perhaps, how processes differ in varied production scenarios for different products. This type of comparison can reveal the best practices observed by a particular process or weak areas that require improvement. Filtering processes by property By creating process diagrams for each department, you can see how processes differ across departments. If the business data includes a unique property for a department, Process Analyzer enables you to filter specific processes that match the given property. This enables you to view a customized process diagram that shows distinct workflow pattern for that department. The same can be done for other departments. Additionally, because different departments deal with different products and customers, there are bound to be differences in the way each department employs their business process. By comparing the process diagrams for each department, these differences become apparent. The following procedure describes how to generate process diagrams that contain a specific property. 1. From the Process Analyzer, click Tools > Analyze > Filter. Doing this displays the Define Filter Criteria dialog box that provides various options for defining a process filter. 2. Click Add > Property
27 3. From the Property Name list, select the property you want to filter. 4. Specify additional filter criteria using Condition 1 and Condition Click Apply to execute the filter. Process diagrams that match the specified property are displayed. Refer to "8.4.4 Set Filter Criteria" for details. Filtering action time distribution by property Process Analyzer allows you to compare the action times of processes filtered by a unique property. The following procedure explains how to display the distribution of time in actions for each property. 1. In a process diagram, right-click an action and Show Action Time Distribution. 2. In the Action Time Distribution dialog box, select the properties to be compared. When properties are selected for comparison, the action time statistics for the properties are shown in the Action Time list. Histograms showing the distribution for each property can also be shown or hidden. Refer to "8.4.3 Show Action Time Distribution" for details Assessing Changes in Processes Over Time You can monitor changes in a business process by making regular observations over a period of time. If the expected behavior of a process is known, it is possible to assess the deviation of a process from its ideal state. Process Discovery allows you to compare process diagrams for a specific time period or monitor Key Performance Indicator (KPI) values in a chronological order. Differences in process diagrams by period Some deviations are obvious and can be determined by simply looking at the differences in business processes generated for a specific time period. If a years worth of data is available, Process Analyzer provides you the flexibility to perform custom analysis on it. For example, you may generate processes for quarterly periods and examine the differences. The following procedure explains how to display processes for a specific period. 1. From the Process Analyzer home page, click Tools > Analyze > Filter. Doing this displays the Define Criteria dialog box that provides various options for defining a process filter. 2. Click Add > Period to display the Period Filter Criteria area. 3. Select Start Date, and specify the start date for the process. 4. Select End Date, and specify the end date for the process. 5. Click Apply to execute the filter. A process diagram with processes for the specified time period is displayed. Refer to "8.4.4 Set Filter Criteria" for details Assessing the Extent of Standardization For some production tasks, it is important that procedures are performed exactly the same way, without exception. Hints for improvement can be gained by finding out the extent of standardization in such cases, with the aim to have the business processes use the same pattern whatever the case. You can assess the extent of standardization in business processes by: - Assessing the fluctuations in action time - Understanding the concentration of routes
28 Assessing fluctuations in action time There may be a problem if the average time taken for an action is too long, but there is also a high likelihood of a problem if the action time fluctuates. If the fluctuations of a particular action time are significant, the possible cause may be: - Details of processes differ, and so, the action times are different - Details of processes are the same, but the properties are different so the action times are different - Details of processes extracted using Process Analyzer are the same, but there are certain processes in the paths between nodes that cannot be extracted using this tool; also, the differences in the times taken to perform these processes cause differences in the action times To view the fluctuations in action time using the Process Analyzer, click View > Action > Time > Standard Deviation. Alternatively, you may select the Standard Deviation check box from the Control Panel. This shows the differences in standard deviation - higher the values, greater the time differences. The standard deviation for actions that occur only once is shown as "0.0". Understanding the concentration of routes A process is considered to be more standardized the more it concentrates on one particular route. If a particular process is not an obvious candidate, however, the following situations may be occurring: - Steps in the processes are different (few common steps) - Tasks that could have been treated as the same, but with different properties, were made into different event types when the process was generated - There are parallel processes which would be the same route if described in parallel, but because the order of execution is different, they appear to be different routes Pareto charts in the Process Analyzer graphically represent the concentration of routes. The horizontal axis displays the different processes represented as bars, while the vertical axis displays the frequency of occurrence of processes. The height of a bar is indicative of the frequency of the process it represents. The Pareto chart lists the processes in a descending order with the process that has the highest frequency listed first. The line graph shows the cumulative total of occurrences of routes. For example, if the route occurring most occurs 50% of the time, then the next most frequent route occurs 10% of the time, the line graph will start at 50%, then grow to 60%, thus increasing to finish at 100%. Therefore, the Pareto chart will climb swiftly if the procedure consists of a few Typical Processes. If the climb is smooth, on the other hand, a dominant route does not exist and rather evenly distributed. Also, if the total number of processes is the same and the number of routes is low, this means there are not many variations and standardization has progressed. To display the Pareto chart, click Tools > Analyze > Pareto Chart. Refer to "8.8 Pareto Chart" for details Cost Simulation Using Process Analyzer, you can add sample costs to events and actions in a process and estimate the total cost for operating the entire process. For this, click Tools > Cost Settings to display the Cost Settings dialog box where you can specify the cost for events or actions of a process. Refer to "8.4.5 Cost Settings" for details


29 Chapter 5 Process Generator Overview 5.1 Window Configuration 5.2 Getting Started Preparations Set up the Process Discovery database before using the Process Generator. Refer to Chapter 4, "Installing and Setting Up Analytics Server" in the Interstage Business Process Manager Analytics V12.0 Installation Guide for details. Creating users and assigning groups Create users, and assign them to the Process Generator User group to log into the Analytics Console. Refer to the Interstage Business Process Manager Analytics V12.0 Management Console Guide for details
30 Starting the Analytics Console Specify the following URL to display the Analytics Console. The Process Generator tab appears after you login. 5.3 Sample Process Generator Scenarios Use of the Process Generator depends on the type of CSV file input. This section explains how to use the tool for different types of CSV files Data Type 1 Business logs are a common data format fed into the Process Generator. - 1 CSV file is used - There are IDs allocated per process with slip numbers - There is one "Time" field for the timestamp - The "Process name" field is indicative of the actual process Example CSV file: Request ID Event Name Person Name Time ID001 Accept Goto 2006/12/11 07:12:13 ID002 Accept Tanaka 2006/12/13 09:21:58 ID001 Publish Estimation Goto 2006/12/14 11:52:41 ID001 Accept Goto 2006/12/16 19:17:44 ID002 Publish Estimation Tanaka 2006/12/16 21:48:38 ID003 Accept Tanaka 2006/12/19 14:55:36 ID001 Design Goto 2006/12/19 15:02:41 ID001 Confirmation Goto 2006/12/21 17:13:22 ID002 Cancel Tanaka 2006/12/23 16:24:23 ID003 Publish Estimation Tanaka 2006/12/23 17:00:11 ID003 Accept Tanaka 2006/12/25 20:26:08 ID001 Delivery Goto 2007/01/08 10:34:

31 Correlation Candidates Selection Refer to "6.4 Selecting Correlation Candidates" for details. Extraction Items Selection With this type of data, process with the same slip numbers are considered to be the same and processes are generated according to the order in which the process name appears (starting from the earliest time). Taking slip number ID001 as an example, the following process is generated. (Receipt.time) -> (Estimate.time) -> (Order.time) -> (Design.time) -> (Confirmation.time) -> (Delivery.time) There is one Event Name Item and one timestamp for each event with this type of data, so the event name is the combination of these two. Refer to "6.5 Extraction Item Settings" for details Data Type 2 Another data format fed into the Process Generator is the business event log. - 1 CSV file is used - There are IDs allocated per process with slip numbers - There are eight fields for the timestamp and each of these corresponds to a particular process Example CSV file: Request ID Person Name Accept time Publish Estimation time Receive Order time Design time Confirmation time ID001 Goto 2006/12/ /12/ /12/ /12/ /12/21 ID002 Tanaka 2006/12/ /12/16 ID003 Tanaka 2006/12/ /12/ /12/ /01/ /01/17 ID004 Suzuki 2007/01/ /01/ /01/ /01/ /02/05 ID005 Goto 2007/01/ /01/ /01/ /02/ /02/12 ID006 Saito 2007/01/16 ID003 Tanaka 2007/01/ /01/
 Delivery time Reject time Cancel time 2007/01/08 2007/02/10 2007/02/15 2007/01/26 2007/01/17 2007/02/13 2007/02/16 2007/02/21 2006/12/23 2007/01/17 Correlation Candidates Selection")
32 Request ID Person Name Accept time Publish Estimation time Receive Order time Design time Confirmation time ID007 Suzuki 2007/01/ /02/ /02/ /02/ /02/08 ID007 Suzuki 2007/02/18 (continuing above) Delivery time Reject time Cancel time 2007/01/ /02/ /02/ /01/ /01/ /02/ /02/ /02/ /12/ /01/17 Correlation Candidates Selection Refer to "6.4 Selecting Correlation Candidates" for details. Extraction Items Selection Taking slip number ID001 as an example, the following process is generated. (ReceiptTime) -> (EstimateTime) -> (OrderTime) -> (DesignTime) -> (ConfirmationTime) -> (DeliveryTime) -> (ReturnTime) -> (CancelTime) The Event Name Item is not specified with this type of data, so the timestamp item name is used as the Event name. See the Correlation Candidates Selection for details. Refer to "6.5 Extraction Item Settings" for details
33 5.3.3 Data Type 3 This example considers the data format of a business event log with the following specification: - Eight CSV files are used - Each CSV file has a "Time" field for the timestamp - IDs are different for the processes, depending on the CSV file Example CSV file: Cancel.csv Request ID Order ID Person Name Time ID /12/23 16:24:23 ID006 Saito 2007/01/17 11:19:20 ID008 J06 Saito 2007/02/10 11:26:13 Publish estimation.csv Request ID Person Name Time ID001 Goto 2006/12/14 11:52:41 ID002 Tanaka 2006/12/16 21:48:38 ID003 Tanaka 2006/12/23 17:00:11 ID004 Suzuki 2007/01/12 11:31:30 ID005 Goto 2007/01/20 08:45:19 ID007 Suzuki 2007/02/01 07:59:47 ID008 Saito 2007/02/05 11:48:02 ID008 Saito 2007/02/05 18:48:51 Reject.csv Request ID Person Name Time J02 Tanaka 2007/01/17 17:50:54 J05 Suzuki 2007/02/16 10:10:28 Receive order.csv Request ID Order ID Person Name Time ID001 J01 Goto 2006/12/16 19:17:44 ID003 J02 Tanaka 2006/12/25 20:26:08 ID004 J03 Suzuki 2007/01/19 19:39:38 ID005 J04 Goto 2007/01/25 12:36:48 ID007 J05 Suzuki 2007/02/04 15:01:48 ID008 J06 Saito 2007/02/09 08:10:29 Accept.csv Request ID Person Name Time ID001 Goto 2006/12/11 07:12:13 ID002 Tanaka 2006/12/13 09:21:58 ID003 Tanaka 2006/12/19 14:55:
34 Request ID Person Name Time ID004 Suzuki 2007/01/10 09:06:02 ID005 Goto 2007/01/15 14:09:53 ID006 Saito 2007/01/16 15:30:47 ID007 Suzuki 2007/01/22 16:11:52 ID008 Saito 2007/01/24 11:48:12 Design.csv Request ID Person Name Time J01 Goto 2006/12/19 15:02:41 J02 Tanaka 2007/01/10 18:19:40 J02 Tanaka 2007/01/21 15:49:27 J03 Suzuki 2007/01/28 16:36:31 J04 Goto 2007/02/02 09:18:11 J05 Suzuki 2007/02/05 19:11:50 Confirmation.csv Request ID Person Name Time J01 Goto 2006/12/21 17:13:22 J02 Tanaka 2007/01/17 08:33:52 J02 Tanaka 2007/01/24 07:50:29 J03 Suzuki 2007/02/05 18:41:03 J05 Suzuki 2007/02/08 10:05:03 J04 Goto 2007/02/12 13:09:29 J05 Suzuki 2007/02/18 05:09:17 Delivery.csv Request ID Person Name Time J01 Goto 2007/01/08 10:34:38 J02 Tanaka 2007/01/26 14:23:18 J03 Suzuki 2007/02/10 09:41:26 J05 Suzuki 2007/02/13 09:16:35 J04 Goto 2007/02/15 18:27:59 J05 Suzuki 2007/02/21 21:13:


35 Correlation Candidates Selection Refer to "6.4 Selecting Correlation Candidates" for details
 -> (Publish estimation.time) -> (Receive order.time) -> (Design.Time) -> (Confirmation.Time) -> (Delivery.")

36 Extraction Items Selection Taking slip number J01 as an example, the following process is generated. (Accept.Time) -> (Publish estimation.time) -> (Receive order.time) -> (Design.Time) -> (Confirmation.Time) -> (Delivery.Time) The Event Name Item is not specified with this type of data, and only one Timestamp Item is specified. So, the event name is the combination of CSV file name and Timestamp Item. Refer to "6.5 Extraction Item Settings" for details
37 Chapter 6 Process Generator Features This chapter covers the Process Discovery - Process Generator features. 6.1 Process Generation Overview Process Generation involves the following steps. Select a model [Required] Configure a CSV file, also referred to as a "model", for process data generation; refer to "6.2 Selecting Model" for details Select composite items Combine several fields of a CSV file, and create one new field, referred to as a "composite item"; refer to "6.3.1 Setting Composite Items" for details Profiling [Required] Involves analysis of the characteristics of CSV fields, including capturing the time information; analysis results are later used for different purposes, such as generating timestamps; refer to "6.3 Profiling" for details Analyze correlations Involves calculating similarities between the CSV fields, also referred to as "properties", in a source and destination CSV file; allows event keys to be automatically set and to calculate correlation scores - a score that indicates the probability of correlation between the source and destination CSV files Use this process only when importing two or more CSV files; do not use when there is only one CSV file or if the event keys are already known. Select Correlation Candidates Set the relationship between correlated properties for items that will be used as key properties in CSV files and when more than one CSV file is input. Refer to "6.4 Selecting Correlation Candidates" for details. Select extraction items Select the following items for each CSV file Timestamp Items [Required] Select the items you want to use for time. Event Name Item If there are items that express more than one event in one CSV file, select these items as Event Name Items; the CSV file will be used if this is not selected Property Item for Analysis Select the properties o be used for analysis Refer to "6.5 Extraction Item Settings" for details. Generate Process Data [Required] Generate processes using the selected correlation candidates and the timestamp items. Refer to "6.6 Generating Process Data" for details. 6.2 Selecting Model Process Discovery uses the term "model" to refer to the CSV file (or files) analyzed to generate the process data. To begin generating the process data, login to the Analytics Console and select the Process Generator tab. Doing this displays a list of models defined in Analytics. From the Model Type list, select either Business Event or IBPM Event to display a list of models. Select a model to edit its configuration
![- For business event models, the Process Generator displays the following options GUI Option Model Name Condition Last Modified CSV Directory Update [button] Edit [button] Rename Model [button]](/docs-images/75/72892259/images/38-0.jpg "Create New Model [button] Delete [button] Displays the name of the model Displays the current processing status of the model, such as \"Process Data Generated\" or \"Process Data Generating Failed\";")
38 - For business event models, the Process Generator displays the following options GUI Option Model Name Condition Last Modified CSV Directory Update [button] Edit [button] Rename Model [button] Create New Model [button] Delete [button] Displays the name of the model Displays the current processing status of the model, such as "Process Data Generated" or "Process Data Generating Failed"; refer to "Model status (Business Events)" below for details Displays the date when the model was last updated Displays the complete path of the directory that stores the CSV file Updates the window Enables you to edit a model Allows you to change the current name of the model; refer to "Renaming Models" below for details Enables you to create a new model of the business event type; refer to "Creating New Models" below for details Allows you to delete a model; Note Model, which is used for configuring KPI from the Process Analyzer, cannot be used Edit, Rename Model and Delete button. - For IBPM Event models, the Process Generator displays the following options: Item Model series Project Name Condition Last Modified CSV Directory Update [button] Edit [button] Displays the name of the model series Displays name of the project to which the model belongs Displays the current processing status of the model, such as "Process Data Generated" or "Process Data Generating Failed"; refer to "Model status (IBPM)" for details Displays the date when the model was last updated Displays the complete path of the directory that stores the CSV file Updates the window Not available
39 Item Rename Model [button] Create New Model [button] Delete [button] Not available Not available Allows you to delete a model Model status (Business Events) Business Event-based models can have the following statuses. - Initial - Profiling - Profiling Finished - Correlation Candidates Selected - Extraction Items Selected - Process Data Generating - Process Data Updating - Process Data Generated - Profiling Failed - Process Data Generating Failed - Process Data Updating Failed Model status (IBPM Events) IBPM, Wily Events-based models can have the following statuses. - Process Data Generated - Process Data Generating Failed Display transition with model status When executing Edit button, display is transited to following destination. Model status Initial Profiling Profiling Finished Correlation Candidates Selected Extraction Items Selected Process Data Generating Process Data Updating Process Data Generated Profiling Failed Process Data Generating Failed Process Data Updating Failed Destination Profiling Correlation Candidates Selection Extraction Items Selection Process Data Generation Profiling Process Data Generation Locking for model operation Model which is being operated by other user cannot be operated


40 This locked status is released when returning to Model List after generating Process Data or clicking Model List on the header. A command is used for unlocking models forcibly. Refer to the "Appendix B Commands" for details Creating New Models From the Process Generator tab, click Create New Model to display the Create New Model dialog box. As the name suggests, this dialog box provides options that allow you to create new models. The Process Generator provides two options for uploading CSV files - from the server or client. Additionally, you can upload multiple CSV files simultaneously. GUI Option Model Name CSV Directory Upload Files Reference [button] Upload [button] Apply [button] Cancel [button] Type a model name; Do not include illegal characters (\ /, = : " *? < > &) or spaces in the name Specify the directory on the server that stores the CSV file Allows you to upload CSV files from the client; selecting this option displays additional options for uploading files Allows you to browse to a CSV file on the client, and select it for upload Starts the upload Creates the model, and closes the dialog box Closes the dialog box without creating a model The new model appears in the Model List on the Process Generator tab Renaming Models The Process Generator allows you to change models names according to your requirement. For this, click Rename Model from the Process Generator tab. Doing this displays the Rename Model dialog box that provides the following options to change the model name
![GUI Option Model Name New Model Name Apply [button] Cancel [button] Displays the current model name Type the new model name; Do not include illegal characters (\ /, = : " *?](/docs-images/75/72892259/images/41-0.jpg "< > &) or spaces in the name Confirms the new model name, and closes the dialog box Closes the dialog box without changing the model name 6.")
41 GUI Option Model Name New Model Name Apply [button] Cancel [button] Displays the current model name Type the new model name; Do not include illegal characters (\ /, = : " *? < > &) or spaces in the name Confirms the new model name, and closes the dialog box Closes the dialog box without changing the model name 6.3 Profiling From the Process Generator tab, select a model and click Edit to display the model s configuration. Select the Profiling tab to display the profiling configuration options for the model. Using these options, you can set composite items, perform profiling, and analyze correlations. GUI Option Analyze Correlations Progress Set Composite Properties Start Profiling [button] Select this check box to automatically perform correlation analysis Do not select if the correlations between CSV files are already known and correlation analysis is to be performed manually Displays the progress of the profiling As profiling continues, the indicator moves from 0% to 100% where 100% indicates that profiling has finished successfully; the indicator returns to 0% if profiling fails Enables you to set composite items; refer to "6.3.1 Setting Composite Items" below for details Select this button to begin profiling; doing this changes the button to Cancel Profiling that allows you to terminate profiling, if required When profiling completes, the button changes to Restart Profiling Profiling needs to be performed again if you have changed any composite item settings Setting Composite Items The Process Generator allows you to combine several fields in a CSV file to create one new field referred to as a "composite item". For example, you may combine the Day, Month, and Year fields to generate the Date field, which will contain a value that is a resultant of all the three fields. Here, "Date" is a composite item. From the Profiling tab, click Set Composite Properties to display the following options that enable you to configure composite item properties
![GUI Option (check box) Composite Properties Item Name CSV File Edit [button] Create [button] Delete [button] Select a composite property you want to edit or delete Select only one](/docs-images/75/72892259/images/42-0.jpg "property for editing Select one or more property when deleting Displays the composite properties Displays the item name Displays the name of the CSV file that the composite item refers")

42 GUI Option (check box) Composite Properties Item Name CSV File Edit [button] Create [button] Delete [button] Select a composite property you want to edit or delete Select only one property for editing Select one or more property when deleting Displays the composite properties Displays the item name Displays the name of the CSV file that the composite item refers to Allows you to edit the configuration of an existing composite item; Refer to "Editing composite items" for details Allows you to create new composite item properties Select this button to display the Set Composite Properties dialog box Refer to "Creating composite item properties" below for details Allows you to delete a composite item Creating composite item properties
43 GUI Option CSV File Name Composite Property Name Config [button] Selected Property Name Add [button] Item Name List Delete [button] Apply [button] Cancel [button] Displays CSV files included this model Type the composite property name; Do not include illegal characters (, " ' < > &) or spaces in the name Configures selected CSV files and composite property name Displays items that are included in the selected CSV file Allows you to add the selected item Displays added items Deletes items that are checked in the list Creates the Composite Property, and closes the dialog box Closes the dialog box without changing the model name The following procedure describes how to create new composite item properties. 1. From the Set Composite Properties area (on the Profiling tab), click Create to display the Set Composite Properties dialog box. 2. From the CSV File Name list, select the CSV file that contains the fields to be added as composite items. 3. In the Composite Property Name box, type a meaningful name for the composite property to be created. Do not include illegal characters (, " ' < > &) and spaces in the name. 4. Click Config to confirm the selected CSV file and composite item property name. 5. From the Selected Property Name list, select the CSV fields or composite items to be included in the composite property. 6. Click Add to add the selected CSV fields. 7. Repeat step 5-6 to add multiple CSV fields. 8. Refer to the list of CSV fields to ensure you have added appropriate composite items. 9. Click Apply to create the composite property

44 Editing composite items The content of already set composite items is displayed. You can edit the names and change the composite item properties. (You cannot change the CSV file names.) 6.4 Selecting Correlation Candidates In the Correlation Candidates Selection, event key each CSV file can be selected. Moreover, correlations between CSV files are configured when multiple CSV files are used. Note It is crucial to select the correct event keys. You can use the Process Generator to assess the importance of data and whether it can be used as a key, but its deductions are not always correct. Use your discretion to identify event keys. Event Key, Correlation Source, Correlation Destination Process Discovery applies the following rules to identify correlations in a CSV file determined to be an RDB table. - Each column or field is a considered a property. - There is only one property that can be used as an event key. - When the values of properties in two different CSV files are the same, a correlation is considered to be established between the two files. Here is an example to illustrate the above points. Consider two CSV files - an "Orders" table and a "Quotes" table. The "Orders" table contains the Order_No and Quote_No fields, and the "Quotes" table contains the Quotation_No field. Considering the Process Discovery rules, these fields are referred to as "properties". If the Quote_No property, for an order HA-0050, from the "Orders" table has the same value, MI-0111, as the Quotation_No property of the "Quotes" table, a correlation is considered to be established between the records HA-0050 and MI-0111 of the "Orders" and "Quotes" tables, respectively. If many such correlations exist between the records of two tables, the tables are correlated


45 6.4.1 Selecting Correlation Candidates in Correlation Charts From the Process Generator tab, select a model and click Edit to display the model s configuration. Select the Correlation Candidates Selection tab to display the correlation between different CSV files. Additionally, the Correlation Candidates Selection tab provides the following options to generate correlations directly by selecting event keys and correlation candidate keys
46 GUI Option Submit Candidates [button] Reset [button] Delete All Correlations [button] Submits the event key and correlation candidate selections Resets the event key and correlation candidate selections If correlation candidates have not been submitted, the Correlation Candidates Selection window is restored to the state after profiling. If correlation candidates have been submitted, the Correlation Candidates Selection window is restored to the state it was in when the last correlation candidate was submitted. Deletes all correlations Note When correlation candidate selections are dynamically changed, profiling is automatically executed. Followings are details of operations


 Selection and Deletion of Correlation Candidate")


47 Selection and Deletion of Event Key, Correlation Candidate Key Selection of Event Key Select an event key from list box. "Overlap" is also displayed in this list. (See the later for explanation of "overlap".) Selection and Deletion of Correlation Candidate Key Select a correlation candidate key from list box. After selecting, another list box for selecting a correlation candidate key is shown up. In case deleting a correlation candidate key, click the X button. And then, correlation setting is deleted as well


48 Creation and Deletion of Correlation Group Correlation When overlapping each event key, group correlation is configured. These tables are regarded as one table. Common Correlation When overlapping a correlation candidate key on an event key of another table, common correlation is configured. Deletion of Group Correlation When left-clicking in the frame of group correlation, list of deletable group correlations are shown up. When deleting all group correlations, Remove All Group Correlations can be used
 > All Correlation can be used. 6.4.")
49 Deletion of Common Correlation When left-clicking in the edge of arrow, list of deletable common correlations are shown up. When deleting all common correlations, (correlation source) > All Correlation can be used Selecting Correlation Candidates - Detailed Settings This section describes additional settings to be configured when selecting correlation candidates. From the Correlation Candidates Selection tab, select the CSV file icon to display the Select Correlation Candidates dialog box. This dialog box provides options to configure the event key or set correlations between CSV files, if more than one is loaded. Selecting correlations from the list of correlation candidates This list shows only those candidates found to have possible correlation during profiling. Make new correlations if you need to set correlations that do not appear in this list
 Score Correlation Destination CSV File Property Correlation Source Details CSV File Property Create New Correlation [button] Apply")
50 This table describes the items in the Select Correlation Candidates dialog box. GUI Options (check box for each correlation candidate listed) Score Correlation Destination CSV File Property Correlation Source Details CSV File Property Create New Correlation [button] Apply [button] Cancel [button] Select to set correlations. If correlations have already been set, this will be selected and you will not be able to change it. Indicates the probability of correlation between CSV files. Is a numeric value of up to four decimal places. Higher the value, greater is the probability of correlation. Is calculated using data values found in the properties of the Correlation Source and Correlation Destination. Displays the name of the CSV file designated as the correlation destination Displays properties of the CSV file designated as the correlation destination Displays the name of the CSV file designated as the correlation source Displays properties of the CSV file designated as the correlation source Displays a detailed account of source and destination correlations in a separate window Launches a wizard for creating new correlations; refer to "Creating new correlations" below for details Submits the event key and correlation candidate selections, and closes the dialog box Cancels the event key and correlation candidate selections, and closes the dialog box Creating new correlations From the Correlation Candidate List tab (of the Select Correlation Candidates dialog box), click Create New Correlation to launch the wizard that creates new correlations. This table lists the key options common across all the wizard screens
![GUI options Back [button] Next [button] Cancel [button] Select this button to return to the previous screen Applies the settings specified in the current screen and moves to the next screen](/docs-images/75/72892259/images/51-0.jpg "Terminates the process of creating new correlations and closes the wizard The following procedure explains how to create new correlations using the Wizard: 1.")
51 GUI options Back [button] Next [button] Cancel [button] Select this button to return to the previous screen Applies the settings specified in the current screen and moves to the next screen Terminates the process of creating new correlations and closes the wizard The following procedure explains how to create new correlations using the Wizard: 1. Select Correlation Direction screen This screen enables you to specify the direction of correlation between CSV file items. Select either Correlations from this CSV File or Correlations to this CSV File, and click Next. 2. Select CSV File screen Select the CSV file to be used as the correlation source or destination, and click Next. 3. Select Correlation Candidate screen Select the items to be correlated, and click Next. This describes the various options in the Select Correlation Candidates dialog box. Filter Score GUI Option Type parts of characters to narrow down the items displayed in the correlation candidate list Indicates the probability of correlation between CSV files. Is a numeric value up to four decimal places. Higher the value, greater is the probability of correlation. Is calculated using data values found in the properties of the Correlation Source and Correlation Destination

52 GUI Option Correlation Destination CSV File Property Correlation Source CSV File Property Change Property of Correlation Destination Displays the name of the CSV file designated as the correlation destination Displays properties of the CSV file designated as the correlation destination Displays the name of the CSV file designated as the correlation source Displays properties of the CSV files designated as the Correlation Source or Correlation Destination Allows you to change the properties to be used as event keys for the Correlation Destination. Properties have already been set by the assumptions made about event keys in the destination, so use this option only when necessary. Select the event key candidate, and click Next. If replace of event key for correlation destination is required, Change Property of Correlation Destination can be used. In this screen, select the key candidate and click Next. This table describes the items in the Create New Correlation dialog box. Filter Overlap GUI Option Type parts of characters to narrow down the items displayed in the correlation candidate list Displays the overlap between keys after correlations have been analyzed. Specified in numeric value, a higher value denotes greater overlap, while '0' indicates no overlap

53 GUI Option Key Candidate Up to four decimal places are shown. Displays the name of properties included CSV file 4. Correlation Confirmation screen Displays all the settings specified in the previous screens of the Wizard, including the Converse Coverage rate or the rate of correlation between properties of the Correlation Source and Correlation Destination. 5. Click Completion to create new correlations. Specifying event keys From the Select Correlation Candidates dialog box, select the Key Item Selection tab to select event keys. This table describes the items in the Key Item Selection tab. GUI Option Filter Overlap Key Candidate Apply [button] Cancel [button] Type parts of characters to narrow down the items displayed in the Correlation Candidate List. Displays the overlap between keys after correlations have been analyzed. Specified in numeric value, a higher value denotes greater overlap, while '0' indicates no overlap. Up to four decimal places are shown. Displays properties of the CSV file Submits the event key selection, and closes the dialog box Cancels the event key selection, and closes the dialog box Deleting correlations From the Select Correlation Candidates dialog box, select the Correlations Removal tab to delete correlations you have configured
 Score Relation Type Type parts of characters to narrow down the items displayed in the Correlation Candidate List Select the check box for the")
54 This table describes the items in the Correlation Removal tab. Filter GUI Option (checkbox for each correlation listed) Score Relation Type Type parts of characters to narrow down the items displayed in the Correlation Candidate List Select the check box for the correlation you want to delete Indicates the probability of correlation between properties of the CSV files. Is a numeric value of up to four decimal places. Higher the value, greater is the probability of correlation. Is calculated using data values found in the properties of the Correlation Source and Correlation Destination. Displays "Common" or "Group" - Common - Indicates correlations exists between event keys and correlative properties (correlation candidate keys) - Group - Indicates correlations between event keys Self Property Direction Property CSV File Select All Group Correlations [button] Apply [button] Cancel [button] Displays properties of the selected CSV file Right-pointing arrow indicates that the self property is the Correlation Source. Left-pointing arrow indicates that the self property is the Correlation Destination. Displays the source or destination property name Displays the source or destination CSV filename Selects all group correlations Deletes the correlations, and closes the dialog box Closes the dialog box without deleting correlations

55 6.5 Extraction Item Settings From the Process Generator tab, select a model and click Edit to display the model s configuration. Select the Extraction Items Selection tab to determine how events are demarcated and the items to be used for analysis. Demarcating events Process Discovery uses a combination of the Event Name Item and Timestamp Item to demarcate events. Event names take the following format: "Value of Event Name Item"."Timestamp Item name" The order in which an event occurs is determined by the Timestamp Item, so this must be specified. You can specify more than one Timestamp Item. In this case, the Timestamp Item names are appended to the Event Name Item value. Specify the Event Name Item when it is to be used as a part of the event name. If you do not specify the Event Name Item, the CSV filename is used as part of the event name. If you specify multiple Event Name Items, they are concatenated. Properties used for analysis The processes you have generated can be analyzed in the following ways using the properties as starting points. - Show Property Distribution See the "8.4.2 Show Property Distribution" for details. - Show Action Time Distribution See the "8.4.3 Show Action Time Distribution" for details. Specify the properties you want to use for analysis. The following table describes the various options provided by the Extraction Items Selection tab. GUI Option CSV File Name Event Name Item Timestamp Item Displays the name of the CSV file Displays the Event Name Item; items are separated by commas if there are more than one Displays the Timestamp Item; items are separated by commas if there are more than one
![GUI Option Property Item for Analysis Property Item for Analysis and Timestamp Type [button] Timestamp Item and Event Name Item [button] Apply [button] Displays the properties used for analysis;](/docs-images/75/72892259/images/56-0.jpg "items are separated by commas if there are more than one Allows you to select the Property Item for Analysis and Timestamp Type; refer to 6.5.")
56 GUI Option Property Item for Analysis Property Item for Analysis and Timestamp Type [button] Timestamp Item and Event Name Item [button] Apply [button] Displays the properties used for analysis; items are separated by commas if there are more than one Allows you to select the Property Item for Analysis and Timestamp Type; refer to Selecting Property Item for Analysis and Timestamp Type below for details Allows you to select Timestamp Item and Event Name Item; refer to "6.5.2 Selecting Timestamp Item and Event Name Item below for details Submits the selected extraction items Selecting Property Item for Analysis and Timestamp Type From the Extraction Items Selection tab, select a CSV file and click Edit to display the Edit Extraction Items dialog box. This dialog provides options to select the properties to be used for analysis, including the timestamp type. Refer to the following table for a brief description of these options. GUI Option Item Name For Analysis Timestamp Type Timestamp Score Apply [button] Cancel [button] Displays the composite items in the selected CSV file Select this check box to use the property for analysis Select the timestamp type. When profiling is performed, the automatically detected timestamp types are selected; change the timestamp type if it differs from the actual type. Indicates the likelihood of timestamp type; the closer the score is to 1, the more likely the assumption Submits the selection, and closes the dialog box Cancels the selection, and closes the dialog box Selecting Timestamp Item and Event Name Item From the Extraction Items Selection tab, select a CSV file and click Select to display the Select Extraction Items dialog box. This dialog box provides options to select the Timestamp Items and Event Name Items. Refer to the following table for a brief description of these options
57 Item List GUI Option Show Overlap Timestamp Items Add > [button] Join > [button] Displays the items in the selected CSV file Select this check box to show the overlap of the items displayed in the Item List Displays the added timestamp items Adds the item in the CSV file as a Timestamp Item < Delete [button] Removes a Timestamp Item Event Name Item Add > [button] Enables you to add all items, displayed in the Item List, collectively as a single timestamp item in a joined CSV file; select more than one CSV file item by using the Ctrl key Displays the added event name items Adds the item in the CSV file as an Event Name Item < Delete [button] Removes an Event Name Item Apply [button] Cancel [button] Submits the selection, and closes the dialog box Cancels the selection, and closes the dialog box 6.6 Generating Process Data From the Process Generator tab, select a model and click Edit to display the model s configuration. Select the Process Data Generation tab to generate process data from CSV files

58 The following table lists the various options provided by the Process Data Generation tab. CSV Directory Edit [button] GUI Option Business Calendar Event Repetition Progress Message Update Process Data Properties [button] Add Process Data [button] Generate New Process Data [button] Displays the complete path of the directory that stores the CSV file Allows you to choose another CSV directory instead of the default. Select this button to display the Edit CSV Directory dialog box. Allows you to specify the business calendar to be used when calculating the action times; a business calendar is not used for calculation if you specify nothing; refer to "6.7 Business Calendars" for details. Select any of the given options - Treat all distinct, Ignore repetitions of more than twice, or Ignore all repetitions - to specify how to treat event repetitions; refer to "Event repetition" below for details Displays the progress of process generation Displays error messages; up to 50 of the most recent errors are displayed Adds properties to the process data that you have already generated. Is valid when the properties to be used for analysis have been changed for process data that has been generated. Button label changes to Cancel Update Process Data Properties; enabling you to terminate an update. Adds process data to existing process data; Is available when a process has already been generated; refer to "Adding process data" below for information on adding process data Allows you to create new process data. If process data already exists, data will be deleted and replaced by new process data. Button label changes to Stop Generate New Process Data, enabling you to terminate the process. This table lists the options available in the Edit CSV Directory dialog box. Item Add Directory Add [button] Base Directory Specify the directory on the server where the CSV file is stored Adds the specified directory Displays the directory used to store the CSV file determined when the model was generated
59 Item Added Directory Apply [button] Cancel [button] Displays the directory you added Submits the edits to the CSV directory, and closes the dialog box Cancels the edits to the CSV directory, and closes the dialog box Note Occasionally, progress of process data generation may not be terminated in the timing of executing the Stop Generate New Process Data button. After stopping the process data generation, status of model is changed to one of following statuses. - Process Data Generating Failed - Process Data Generating Note In case Business Calendar is not specified, action time is calculated with the date coverage from 2001/01/01 to 2099/12/31. Event repetition If there is data that shows that the same event is being repeated, you can change how to treat these repetitions. For example, there are the following processes. 1. Event A -> Event C 2. Event A -> Event B -> Event C 3. Event A -> Event B -> Event B -> Event C 4. Event A -> Event B -> Event B -> Event B -> Event C - Treat all distinct This distinguishes not only by the existence of repetitions, but also by the number of repetitions. In the above examples, processes 1 to 4 would all be distinct routes. - Ignore repetitions of more than twice The existence of repetitions is taken into account, but otherwise there is not distinction made. In the above examples, processes 1 to 3 would all be distinct routes, but routes 3 and 4 would be the same. As a result, three types of routes would be identified. - Ignore all repetitions The existence of repetitions is not taken into account. In other words, the only the existence of an event is considered when distinguishing routes. In the above examples, processes 1 and 2 would all be distinct routes, but routes 2, 3, and 4 would be the same. As a result, two types of routes would be identified. Adding process data From the Process Data Generation tab, select Add Process Data to add newly generated process data to the process data you already have. - Put the new CSV in a different directory. Create directory different to the one used to when the model was generated and store the CSV file in there
60 When adding process data, there must be the same number of CSV files with the same names in the new directory as in the directory originally used for generation. Delete the header rows that have the field names if the files have them. Click Add Process Data when the files have been stored in the new directory. 6.7 Business Calendars When calculating the action time between events, you can use a business calendar that reflects the working hours in your business. Specify this predefined calendar file when generating a process to take the calendar into account Creating a Business Calendar A business calendar is a file with a ".cal" extension where the file name is 50 characters or fewer. Any character may be used in the name. The format of a business calendar is "item=value". The following table lists the various items with their respective values. The following table describes these options. Item Value Required/Optional EVERYDAY Define business hours by specifying time or by using a reserved word; is case insensitive Time range HH:MM,H'H':M'M'; HH:MM indicates the start of business hours and H'H':M'M' indicates the end of business hours. Multiple intervals can be specified. (Up to five) If you do specify multiple intervals and some of these intervals overlap, they are still treated as business hour definitions. For example: If the series 9:00,14:00;10:00,15:00 is specified, business hours will be from 9:00 to 15:00. Using a reserved word "ALL_TIME" is a reserved word that can be used to indicate a 24-hour operation. Required Day of week Year/month/day CALENDAR_BEGIN *1 CALENDAR_END *1 If the item is entered in the file but no hours are specified, the entire time will be considered out of business hours (holidays). Define business hours by specifying SUN, MON, TUE, WED, THU, FRI, SAT; is case insensitive Use the same time format as "EVERYDAY". If this item is entered, the values entered for "EVERYDAY" will be overwritten. Define business hours by specifying the date in the YYYY/MM/DD format; this date format is fixed Use the same time format as "EVERYDAY". If this item is entered, the values entered for "EVERYDAY" and day of the week will be overwritten. Specify a start date for the calendar in the YYYY/MM/DD format. Specify an end date for the calendar in the YYYY/MM/DD format. Optional Optional Required Required
61 *1: Events occurring outside the range delimited by CALENDAR_BEGIN and CALENDAR_END will be considered to have occurred on a holiday. Example 1: To define a calendar where Saturdays and Sundays are off, there is a six-day year-end break, and the business hours for every other day are between 9:00 and 17:00: EVERYDAY=9:00,17:00; SAT=; SUN=; 2011/01/01=; 2011/01/02=; 2011/01/03=; 2011/12/29=; 2011/12/30=; 2011/12/31=; CALENDAR_BEGIN=2001/01/01; CALENDAR_END=2099/12/31; Example 2: To define a calendar where Sundays are off, Saturday business hours are between 9:00 and 12:00, business hours on 12 August are between 13:00 and 17:00, and the business hours for every other day are from 9:00 to 12:00, and then, from 13:00 to 17:00: EVERYDAY=9:00,12:00;13:00,17:00; SAT=9:00,12:00; SUN=; 2011/08/12=13:00,17:00; CALENDAR_BEGIN=2001/01/01; CALENDAR_END=2099/12/31; Example 3: To define a calendar for a business that operates around the clock: EVERYDAY=ALL_TIME; CALENDAR_BEGIN=2001/01/01; CALENDAR_END=2099/12/31; Using Business Calendars To begin using a business calendar, save the business calendar you have created at the following location: <Analytics data directory>/bpme/calendar For example: C:/ibpmm_data/bpme/calendar

62 Chapter 7 Process Analyzer Overview 7.1 Window Configuration 7.2 Getting Started Preparations Set up the Process Discovery database before using the Process Analyzer. Refer to Chapter 4,"Installing and Setting Up Analytics Server" in the Interstage Business Process Manager Analytics V12.0 Installation Guide for details. Creating users and assigning groups Create users, and assign them to groups to log into the Analytics Console. Assign users to the Process Analyzer User group if they only need to use the Process Analyzer. Assign users to the Process Analyzer Power User group if the user needs to configure fixed-point monitoring linked with Analytics. This allows the user to use the Process Analyzer, Analytics Dashboard, and Analytics Studio. Refer to the Interstage Business Process Manager Analytics V12.0 Management Console Guide for details. Starting the Analytics Console Specify the following URL to display the Analytics Console
63 Select the Process Analyzer tab to begin analyzing business processes
64 Chapter 8 Process Analyzer Features 8.1 Operation Menus File The File menu contains the following menu options. - Select Model Allows you to select a model for display. Refer to "8.2 Selecting Model" for details. - New Window Displays the process diagram in a new window.; if you have set a filter criteria, it will be retained - Save As Save process diagrams as SVG, PNG, and XPDL View The View menu contains the following menu options. - Zoom Zoom in or out, or show the entire business process. Refer to "8.3 Control Panel" for details. - Process Endpoints Displays "INITIAL_STATE" at the beginning and "FINAL_STATE" at the end - Typical Process Displays the typical processes. Refer to "8.3.2 Discover Typical Process" for details. - Event Search Bar Displays a search bar that provides options to search for events using the event s display name or its actual name. Refer to "8.4.6 Event Search Bar" for details. - Control Panel Invokes the Control Panel - Properties of Model Displays the number of processes displayed, Cost Average, Process Update Time, and Filter Criteria - Action - Count Displays action count. Refer to "8.3 Control Panel" for details. - Time Displays time details, such as average action time and standard deviation in the process diagram. Refer to "8.3 Control Panel" for details. - Time Unit Selects from Days, Hours, Minutes, and Seconds
65 - Sequential Number Displays sequential number in the process diagram. Note that sequential numbers are only available for the Route Analysis tab. Tools - Analyze - Filter Indicates filter criteria for narrowing down. Refer to "8.4.4 Set Filter Criteria" for details. - Pareto Chart Displays the Pareto Chart. Refer to "8.8 Pareto Chart" for details. - Process Details Searches process details using the Process Search Key. Refer to "8.9 Process Details Search" for details. - Cost Settings Allows you to assign costs for events and actions. Refer to "8.4.5 Cost Settings" for details. - Options - Set Maximum Visible Events and Action Sets maximum number of events and action displayed in a process diagram. (It may take much time if large number is set.) - Date Format Configures the date format to be displayed in the process diagram Help - Help Displays the help contents - About Process Analyzer Displays the version and copyright information of Process Analyzer 8.2 Selecting Model Select a model whose process you want to display

66 The following describes the items in the Select Model dialog box. Name Model Name Last Modified Update [button] Show [button] Set Event Display Name [button] Displays the model name Displays the date when the model was last updated Updates the window Displays the process diagram for the selected model Enables editing of the event s display name Refer to "Edit Event Display Name" for details Edit Event Display Name You can edit the event name, given when the process was generated, to be used as the event s display name

67 The following describes the items in the Event Display Name Settings dialog box. Name Event Name Event Display Name Import from CSV [button] Export to CSV [button] Apply [button] Cancel [button] Displays the event name Type a display name for the event Enter "\n" for line feeds Imports a CSV file to enter a number of event display names at once. The CSV file is one line per event, event name in column one and display name in column two. (A header row is unnecessary.) Event display names currently being edited are exported to a CSV file Applies the event display name Closes the dialog box without modifying event name Note The display names INITIAL_STATE and FINAL_STATE cannot be edited. 8.3 Control Panel The Control Panel has various controls for the process view

68 Zoom Zoom Out Zooms in on a business process Zoom In Display All Zoom out from a business process Adjusts the zoom factor so that the whole business process is shown Process Filter Slider Move the slider to change which processes are displayed based on their frequency. The display refreshes when the slider is dragged and then released. The percentage selected with the slider is the rate of accumulated processes compared to the total. Route Count Total Process Count Refer to Slider below for details. Displays the number of routes for the selected frequency Displays the number of processes in the model
69 Show Typical Process Moves the slider to the frequency previously determined to display the Typical Process Refer to Discover Typical Process below for information on Typical Processes. Display Option Actions Count Displays the action count on action arrows Show Action Time In Time Unit Average Standard Deviation Highlight Bottlenecks Displays the average action time on action arrows. Displays the standard deviation of the action time on action arrows. The actions taking the longest average time are emphasized in red (default). Select the units used for time displays; Days, Hours, Minutes, and Seconds Slider Operations Move the slider to display processes corresponding to the selected frequency. The display refreshes when the slider is dragged and released. The slider and the Route Count box are linked. The values in the Route Count box change as you move the slider. Enter a number between 0 and 100 and the slider will move to the relevant position. The percentage selected with the slider is the rate of accumulated processes compared with the total. When a model is selected, the slider is set to a percentage indicative of the Typical Process for that model. Principles used to determine the display Processes that follow the same actions in the same order are allocated the same route. These routes are then sorted by the number of processes that they account for. Routes are then allocated percentages. A percentage of a route is calculated by comparing the number of processes covered by that route added to the processes in the routes with higher frequencies and the total number of all processes. The slider points to a percentage and any routes allocated that percentage or lower are displayed. The following is an example. In this example, there are three routes; Route1, Route2, and Route3. There are 100 processes in Route1, 50 in Route2, and 20 in Route3. With the routes sorted by the number of processes they account for, the order looks like this. Route Process Route1 100 Route2 30 Route3 20 Total Amount 150 Now we will allocate the percentages, calculated by adding the number of processes cumulatively. Route Process Sum of processes from routes with higher frequencies Percentage Route % (0/150) Route % (100/150) Route % (130/150) So here, if the slider is anywhere between 0% and 66%, only Route1 is displayed. If the slider is then moved between 67% and 86%, Route1 and Route2 are displayed. If the slider is then moved above 87%, all the routes (Route1, Route2, and Route3) are displayed

70 Even if processes have been filtered by Property, Action Time, or Event, the slider always uses the data from all processes for its percentage calculations Discover Typical Process The Typical Process has three or fewer inputs and three or fewer outputs per event, and is the one that is the drawn using the highest frequency percentage. When deciding whether a process is typical, consider the following: - Do not count actions where the Action Source and Action Destination are the same event - Do not count edges that connect to the INITIAL and FINAL events If process diagram do not meet this conditions, all processes are drawn
 INITIAL, FINAL Action (when INITIAL and FINAL are included) Show Processes - Filter Processes by this Event - - - - Show Property Distribution -")
71 8.4 Process Analysis The following table shows operations available when an element drawn on a process is right-clicked. The symbol indicates that the operation is available for an element. Event Action (when INITIAL and FINAL are not included) INITIAL, FINAL Action (when INITIAL and FINAL are included) Show Processes - Filter Processes by this Event Show Property Distribution Show Action Time Distribution Set Cost of Event Set Cost of Action Create Chart Create Alert - - Field Outline - Show Processes Displays processes that pass through the event or instance Refer to "8.4.1 Show Processes" below for details. - Filter Processes by this Event Display processes that include the selected event A search that includes the event name is automatically created and specified in the Filter Criteria. To remove the event name as a condition, go to Tools > Analyze > Filter to display the Define Filter Criteria dialog box and remove the event name
72 - Show Property Distribution Displays the distribution of property values for the selected event or for the process that passes through the event Refer to "8.4.2 Show Property Distribution" below for details. - Show Action Time Distribution Displays the time distribution for the selected action as well as the total action time for each property value Refer to "8.4.3 Show Action Time Distribution" below for details. - Set Cost of Event Specify a value to the selected event Refer to "8.4.5 Cost Settings" below for details. - Set Cost of Action Specify a value to the selected action Refer to "8.4.5 Cost Settings" below for details. - Create Chart Set a chart KPI that is linked to Analytics for an event or action Refer to "8.7.2 Creating Charts" below for details. - Create Alert Set an alert KPI that is linked to Analytics for an event or action Refer to "8.7.1 Creating Alerts" below for details Show Processes Displays processes that pass through the event or instance

73 Process Display The following describes the items in the Process Display dialog box. Item Route List Frequency Repeats Route ID Route Process List Process ID Execution Time Show Details [button] Close [button] Displays a list of processes that pass through events or actions selected in a business process. Select a route from the list to show a list of processes included in the route in the Process List area below. Displays the frequency of processes in a route Displays the repetition frequency of a route Displays a number that identifies a route Displays the order of events in a process Events are put onto a time line and connected with arrows. The number of times an event repeats consecutively is shown in brackets to the right of an event class (not shown if there are no repeats). Displays a list of processes included in routes selected in the Route List Displays the process ID Displays the time taken for execution of a process Displays details about a process. Select the process, and then click the Show Details button to show the details in a separate window. Closes the dialog box

74 Process Details Selecting the Show Details button displays the Process Details dialog box with the following options: Item Execution Time Process ID Execution order display area Order Event Occurrence Time Accumulated Time Event Property Property Name Property Value Exit [button] Displays the time taken for execution of a process Displays the process ID Events in the process are displayed in the order they occurred. Select an event to show a list of the properties belonging to that event in the Event Property area below. Displays the order of the event Displays the event name Displays the time and date for the event Displays the accumulated time Displays a list of the properties belonging to the event selected in the Execution order display area Displays the Property Name Displays the Property Value Closes the dialog box Show Property Distribution Displays the distribution of property values of the selected event or of the process that passes through the event Filter criteria can be automatically set by specifying a range of the histogram
 Property (list) This is displayed as a percentage of process display volume Displays the names of events that have been made selected for property")
75 Property Distribution Display Displays a histogram showing the distribution of the property values of the selected event. The following table describes the items in the dialog box. Item Visible Processes Event Event (list) Property (list) This is displayed as a percentage of process display volume Displays the names of events that have been made selected for property distribution display Displays "Complete Process" and event name which is included in the process that possesses the selected event. Complete Process Property values, which are included in the process that possesses the selected event, are targeted. Event Name Property values which are included in the selected event are targeted. Displays properties which are included in the selected event from the event list
76 Property Value Item Interpret Property Value As String Numeric Lower Bound Boundary Value Width of Section No. of Sections Range of Selection Initial Display [button] Add Value To Filter Exit [button] Selects some parameters related to displaying property values Select whether to treat the selected property as a string or numeric value Specify this to treat the selected property as a string Specify this to treat the selected property as a number Specifies the lower boundary of the histogram. Specify this when attributes are to be treated as numbers. Numbers, periods, and hyphens can be entered. The default is the minimum value in the display condition range. Specify the width intervals in the histogram. Specify this when attributes are to be treated as numerical attributes. Numbers and periods can be entered. The default is the result of dividing the range between minimum and maximum values in the display condition range by 20 minutes. Specify the number of intervals in the histogram. Specify this when attributes are to be treated as numerical attributes. Numbers and periods can be entered. The default is 20. Displays the selected range of selection Restores the default display Automatically sets filter criteria and close the dialog box. Available when a filter criteria range is specified on the histogram. Closes the dialog box Specifying a filter criteria Specify a range to filter by selecting histogram elements. The range specifiable by the property values can be selected. Click Ctrl click Shift click Drag Select a single element Select multiple elements Select the range of elements from the previously selected element to the current element Drag the mouse across multiple elements to select them Show Action Time Distribution Displays the distribution of time for the selected action, and the total action time for each property value Filter criteria can be automatically set by specifying a range of the histogram

77 The following describes the items in the Action Time Distribution dialog box. Item Visible Processes Action List of details for action time Action Time Time Unit Lower Bound Boundary Value Interval Interval Count Comparison Property Event This is displayed as a percentage of process display volume. Displays the selected event action. Refer to "List of details for action time" below for details. Select some parameters related to displaying action time Select days, hours, minutes, or seconds for the time display. Specify the lower boundary of the histogram. Numbers, periods, and hyphens can be entered. The default is the minimum value of the display condition range. Specify the intervals in the histogram The default is the result of dividing the range between minimum and maximum values in the display condition range by 20 minutes. Specify the number of intervals in the histogram. The default is 20. Select the properties in the process included the selected action as the properties to compare. This is a list of event included in the displayed process. Select "Complete Process" to select the entire process. All events in the entire process will be compared if you select "Complete Process"
78 Property Property Value Item Interpret Property Value As Value Range Boundary Value Interval Range of Selection Initial Display [button] Add Value to Filter Exit [button] Displays a list showing the properties of the event selected in the list of events. Selects some parameters related to displaying property values Specify how property values are to be evaluated. Property values are evaluated as strings. The Property Value Standard Boundary Value and Width of Property Value Section cannot be selected. The property values are treated as numbers and the ranges are evaluated. The Property Value Standard Boundary Value and Width of Property Value Section can be selected. Specify the lower boundary for property values. Specify the width of property value sections. Displays the selected range of selection Restores the default display. Automatically sets filter criteria and close the dialog box. Available when a filter criteria range is specified on the histogram. Closes the dialog box. List of details for action time Values are displayed in the list of details for action time according to whether you have specified property values in Comparison Property. Item No. Average Time Standard Deviation Maximum Time Minimum Time Count Property Value/Section View Displays the sequential number Displays the average time taken for execution The displayed units can be changed by selecting different time units. Displays the Standard Deviation Displays the Maximum Time The displayed units can be changed by selecting different time units. Displays the Minimum Time The displayed units can be changed by selecting different time units. Displays the number of actions that include the property value This may not necessarily equal the number of processes because the same action may occur more than once in one process (caused by repetitions or rework). Displays the property value or the section of the property value This links to the histogram, showing or hiding it. Examples of Comparison Property This illustrates an example that there are three processes including action of "Accept -> Publish estimation". Processes (property = Person Name): 1. Accept (Tanaka) -> Publish estimation -> Confirmation -> Delivery (Goto) 2. Accept (Tanaka) -> Publish estimation -> Design -> Delivery (Yamada) 3. Accept (Suzuki) -> Publish estimation -> Design -> Confirmation -> Delivery (Yamada) Action time of "Accept -> Publish estimation" is as follows respectively:
79 1. 20 minutes minutes minutes Under this condition, followings are displayed in the list of details for action time. Event: "Accept", Property: "Person Name" Average Time Maximum Time Minimum Time Count Property Value 40 minutes 60 minutes 20 minutes 2 Tanaka 40 minutes 40 minutes 40 minutes 1 Suzuki Event: "Delivery", Property: "Person Name" Average Time Maximum Time Minimum Time Count Property Value 20 minutes 20 minutes 20 minutes 1 Goto 50 minutes 60 minutes 40 minutes 2 Yamada Event: "Complete Process", Property: "Person Name" Average Time Maximum Time Minimum Time Count Property Value 40 minutes 60 minutes 20 minutes 2 Tanaka 40 minutes 40 minutes 40 minutes 1 Suzuki 20 minutes 20 minutes 20 minutes 1 Goto 50 minutes 60 minutes 40 minutes 2 Yamada Set Filter Criteria You can filter the processes displayed by specifying conditions such as property values, periods, and event statuses

80 The following describes the items in the Filter Criteria dialog box. Item No. State Type Operation Condition Condition number The states displayed are "New", "Change", and "Set". "New" is the state of conditions that have been newly added. "Change" is the state of conditions that have been changed after they were set. "Set" is the state of conditions that were already set before opening the Filter Criteria dialog box. The types displayed are "Property", "Period", "Event", and "Action Time". "Property" indicates that you have specified a property filter criteria. "Period" indicates that you have specified a period filter criteria. "Event" indicates that you have specified an event filter criteria. "Action Time" indicates that you have specified an action time filter criteria. Displays condition combinations Nothing is displayed at the top of the list AND is displayed in other places on the list. (Only the AND operation is used.) Displays the details of the conditions you have set
81 Item The display for each type is as follows. [Properties] For numeric values: A.Data=-011 For strings: A.Data='011' [Period] 2011/06/31 00:00: /12/31 23:59:59 (overlap ON) 2011/06/31 00:00: /12/31 23:59:59 (overlap OFF) [Event] Including A.Time Not including A.Time [Action Time] 1h <= A.Time -> B.Time 1h <= A.Time -> B.Time < 2h A.Time -> B.Time < 2h If the filter criteria has already been set, you can display the content of the setting in the lower part of the dialog box by selecting a filter condition. Operations The following describes the operations available in the Filter Criteria dialog box. Item Add [button] Delete [button] Apply [button] Cancel [button] Adds a filter criteria. Refer to " Adding Filter Criteria" below for details. Deletes a condition selected in the list Executes the filter using the set conditions Closes the Filter Criteria dialog box Adding Filter Criteria
82 Property Filter Criteria The following table describes the options that appear when you add a property filter criteria. Item Target Property Name Property Type String Numeric Condition Operator Value OK [button] This is a list box with the event names. Select "Complete Process" to select the entire process. This is a list box with the property names. These are the names allocated to properties when the process is generated, and are used for analysis. Specify the property name from the list for the events specified in Target. Select the property type. This indicates that the value specified is to be evaluated as a string. This can be selected for any property. This indicates that the value specified is to be evaluated as a number. This can be selected when the values for the selected property can all be treated as numbers. Set the conditions. Select "=" (equal), "!=" (not equal), "<=" (less than), or ">=" (greater than) as an operator. The less than and greater than operators can be selected when evaluating numbers. This is a list box with the values of the specified properties. If equal or not equal has been selected as the operator, only Condition1 needs to be set. If less than or greater than has been selected as the operator, Condition1 and Condition2 need to be set. Applies the filter criteria

83 Period Filter Criteria The following table describes the options that appear when you add a period filter criteria. Item Start Date End Date Include Partly Overlapped Processes OK [button] Specify the start date for the period. Select the checkbox to enable input. Specify the end date for the period. Select the checkbox to enable input. Select the checkbox to include processes that overlap the start and end dates. Applies the filter criteria. Event Filter Criteria The following table describes the options that appear when you add an event filter criteria
84 Item Event Filter Criteria Event Name Not Use Include Exclude Event Name Event Condition Not Use Include Exclude OK [button] Specify the event filter criteria Specify the event name to show only those events that match the given name. Select the checkbox to display events whose Include Type is "Not Use". Select the checkbox to display events whose Include Type is "Include". Select the checkbox to display events whose Include Type is "Exclude". Displays the event name. Specify the event condition. Do not specify as a filter criteria. Specify that the event must be included. Specify that the event must be excluded. Applies the filter criteria. Action Time Filter Criteria The following table describes the options that appear when you add an action time filter criteria. Item Action Time Unit Condition Displays a list of event names used in the Process View. Set the event name for the Action Source and the event name for the Action Destination. The event display name or event name can be used as the action event. Select days, hours, minutes, or seconds for the time unit. Set the action time to be used as the condition. Selects the checkbox to enable input. Numbers and periods can be entered. If the condition is not set, processes including the specified action name are included in the search
![OK [button] Item Applies the filter criteria. 8.4.5 Cost Settings Set numerical values for events and actions. The costs can then be used to see the total cost for different routes.](/docs-images/75/72892259/images/85-0.jpg "Applying the values in a batch from the Tools menu The following describes the Cost Settings dialog box, accessible from the Tools menu.")
85 OK [button] Item Applies the filter criteria Cost Settings Set numerical values for events and actions. The costs can then be used to see the total cost for different routes. Applying the values in a batch from the Tools menu The following describes the Cost Settings dialog box, accessible from the Tools menu. Item Event/Action Switch between setting costs for events and actions. Event Name Displays the event name. Action Displays the action Cost Enter costs. Numbers and periods can be entered. Clear [button] Resets all costs to 0. Import [button] Specifies a CSV file to import to make cost settings in a batch. Export [button] Outputs a CSV file containing all the current cost settings. Apply [button] Executes cost settings. Cancel [button] Closes the dialog box
86 Format of the CSV file for cost settings This is the format of the header for the CSV file. type, display_name, original_name, cost Set the following values in each of the columns. type Enter "event" when specifying a cost for an event and "action" when specifying a cost for an action. Any other string is ignored. display_name Enter the event display name or action display name. (The strings entered here are not evaluated upon import.) original_name Enter the event name or action name. This is ignored if the event or action does not exist. The format for the action name is as follows. Action Source event name=>action Destination event name cost Specify the cost. This is ignored if the entered value cannot be treated as a number. Applying costs individually to events and actions The following describes the Cost Settings dialog box, accessible from events and actions in a process diagram. For events, right-click the event and select Set Cost of Event. For actions, right-click an action and select Set Cost of Action. Item Event Name/Action Cost Apply [button] Cancel [button] Displays the event or action name. Input costs. Numbers and periods can be entered. Executes cost settings. Closes the dialog box Event Search Bar Click View > Event Search Bar to invoke a search option that enables you to search for events in a process. Focus shifts to the event that meets the conditions entered. Text Box Item Enter the search string. Enter "\" for line feeds
![Item Event Display Name Search/ Event Name Search Search [button] Exit [button] Select whether to search by display name or event name. Starts the event name search.](/docs-images/75/72892259/images/87-0.jpg "The search string is case sensitive and event names that partially match are considered matches. Focus shifts to the next event if more than one event matches the conditions.")
87 Item Event Display Name Search/ Event Name Search Search [button] Exit [button] Select whether to search by display name or event name. Starts the event name search. The search string is case sensitive and event names that partially match are considered matches. Focus shifts to the next event if more than one event matches the conditions. Closes the event search bar. 8.5 Route Analysis You can display details for business processes and actions in the routes* displayed by the current process frequency. * A route is a particular pattern of actions in a process Route List In the Process Analyzer, select the Route List tab to display details of each route. Header Route Count Item Visible Processes Sort [button] Displays the number of routes. Displays the selected process display volume as a percentage. Displays the Route Sorting dialog box. << button Displays the first page. Refer to " Route Sorting" below for details. < button Displays the previous page. > button Displays the next page. >> button Displays the last page. Text box (to specify page number) Total number of pages displayed This button is disabled if the number of pages is 0 or 1, or if the first page is being displayed. This button is disabled if the number of pages is 0 or 1, or if the first page is being displayed. This button is disabled if the number of pages is 0 or 1, or if the last page is being displayed. This button is disabled if the number of pages is 0 or 1, or if the last page is being displayed. Enter a page number and press the Enter key to go to that page. Displays the total number of pages
88 Route List Click the items in the header to sort by ascending or descending order. The units displayed for time correspond to the units selected in the Control Panel. The maximum number of items that can be listed is 500.The page changes when this is exceeded. Item Route Route ID Frequency Average Time Maximum Time Minimum Time Repeats Loopbacks Cost Sort Score Displays the route. Displays a number that indicates the route. Displays the total number of instances. Displays the average time taken for execution. Displays the Maximum Time taken for execution. Displays the Minimum Time taken for execution. Displays the repetition frequency. Refer to " Repeats" below for details. Displays the loopbacks. Refer to " Loopbacks" below for more details. Displays the cumulative total for all the events and actions that make up the route. Event types with no cost settings are treated in calculations as having a cost of 0. The score is displayed if the button for sorting has been clicked. Refer to " Route Sorting" below for details Route Sorting Click Sort in Route Analysis to display the Route Sorting dialog box. There are two methods of sorting: List Routes containing these actions first and List Routes that do not meet the condition below first

89 List Routes containing these actions first When this option is selected, the numbers of action arrows in between particular Action Sources and Action Destinations are used as a score and the processes are sorted accordingly. Item Action Source Action Destination Specify the name of the event to be used as the Action Source. A list box with the event names (display names) plus the INTIAL_STATE event is displayed. INITIAL_STATE is the default selection. Specify the name of the event to be used as the Action Destination. A list box with the event names (display names) plus the FINAL_STATE event is displayed. FINAL_STATE is the default selection. List Routes that do not meet the condition below first When this option is selected, a score of 1 is given to processes that meet both of the following conditions. Other processes receive a score of 0, then the processes are sorted accordingly. - The event specified as the Target Event occurs in the process. - Events specified as prerequisites have not occurred before the Target Event. (If the Target Event occurs multiple times throughout the process, the one closest to the Target Event is the one evaluated.) Item Target Event Target Event Precondition Specify the Target Event. A list box with the event names (display names) is displayed. Specify the prerequisites. Press the Ctrl key or Shift key to select more than one prerequisite. A list with the event names (display names) is displayed
 and event D is executed three times (repeated twice).")

90 Repeats "Repeats" is the total number of times that events occur in succession in a particular process. A B B C D D D We will use the above process as an example. The numbers of actions indicate the order of execution. Event B is executed twice (repeated once) and event D is executed three times (repeated twice). The total of all such repetitions in the entire process is Loopbacks "Loopbacks" is the total number of recurrences of events in a process. A B C D B C D E D E We will use the above process as an example. The numbers of actions indicate the order of execution. Actions 4 and 8 are seen as recurring, so the loopbacks is 2. Actions 5, 6, and 9 recurred due to the rework, so they are not counted


91 8.5.2 Process View Panel Displays the process view for the selected routes. This panel has the same features as the right-click context menu in the Process Analysis window Action Details Panel Displays the action details for selected routes


92 Click the items in the header to sort by ascending or descending order. The units displayed for time correspond to the units selected in the control panel. Item No. Action Frequency Average Time Maximum Time Minimum Time Displays the number allocated to an action according to its order of occurrence. Displays the action. Displays the action frequency. Displays the average time taken for the action. Displays the maximum time taken for a action. Displays the minimum time taken for a action. 8.6 Exceptional Route Analysis This view is used to focus analysis on processes that exhibit exceptional behavior, for example a large number of repetitions. Routes that are not displayed when a certain percentage is specified are considered to be exceptional and are included in the list Exceptional Process View This displays details about the exceptional processes for each route. Header Item Exceptional Route Count Visible Processes Sort [button] Displays the number of exceptional routes. Displays the selected process display volume as a percentage. Displays the Route Sorting dialog box. Refer to " Route Sorting" above for details
93 Item << button Displays the first page. < button Displays the previous page. > button Displays the next page. >> button Displays the last page. Text box (to specify page number) Total number of pages displayed This button is disabled if the number of pages is 0 or 1, or if the first page is being displayed. This button is disabled if the number of pages is 0 or 1, or if the first page is being displayed. This button is disabled if the number of pages is 0 or 1, or if the last page is being displayed. This button is disabled if the number of pages is 0 or 1, or if the last page is being displayed. Enter a page number and press the Enter key to go to that page. Displays the total number of pages. Exceptional Route List Click the items in the header to sort by ascending or descending order. The units displayed for time correspond to the units selected in the control panel. The maximum number of items that can be listed is 500.The page changes when this is exceeded. Item Exceptional Route Frequency Deviation Degree Repeats Loopbacks Cost Sort Score Displays the route. Displays the total number of instances. A lower number of instances indicate a higher chance that the process is exceptional. Displays the degree of deviation. Refer to Deviation Degree below for details. Displays the repetition frequency in the exceptional process. Refer to " Repeats" above for details. Displays the loopbacks in the exceptional process. Refer to " Loopbacks" above for details. Displays the cumulative total for all the events and actions that make up the sequence in an exceptional process. Event types with no cost settings are treated in calculations as having a cost of 0. The score is displayed if the button for sorting has been clicked. Refer to " Route Sorting above for details Deviation Degree "Deviation degree" is defined as the number of operations on events required to morph the standard process into the exceptional process being considered. Any of the following operations on events are counted. - Insert - Remove - Replace


94 Any of the processes currently displayed by the percentage selected with the slider may be considered candidates for the standard process. A tentative deviation degree is calculated for each of these against the exceptional process being considered. Of these, the lowest deviation degree is displayed as the 'official' one. Here is an example Process View Panel The actions for selected exceptional processes are shown as red broken lines
 INITIAL, FINAL Action (when INITIAL and FINAL are included) Show Processes - Filter Processes by this Event - - - - - Show Property Distribution")
95 The following table shows operations available when an element drawn on a process is right-clicked. Event Action (when INITIAL and FINAL are not included) INITIAL, FINAL Action (when INITIAL and FINAL are included) Show Processes - Filter Processes by this Event Show Property Distribution Show Action Time Distribution Set Cost of Event Set Cost of Action Create Chart Create Alert - - Field
96 8.7 KPI Configuration Set a KPI that is linked to Analytics for an event or action. When monitoring events over time, an extracted process can be set as a monitoring point and used as a KPI. This feature is used for fixed-point monitoring of business using Process Discovery. Refer to Chapter9 for details Creating Alerts Alert Creation In a displayed process, right-click an element and select Create Alert to display the Alert Creation dialog box. The following table describes the various options of the Alert Creation dialog box. Item Alert Name KPI Type Repetition Specify the alert name. The name entered here is used as the Analytics alert definition name. Select alert types from the list. - When you open the Alert Creation dialog box of an event, the frequency of repetitions of the event is set as a threshold value for monitoring. - When you open the Alert Creation dialog box of an action, the frequency of repetitions of the Action Source event of the action is set as a threshold value for monitoring. When you open the Alert Creation dialog box of a field, the frequency of repetitions of the entire process is set as a threshold value for monitoring. Exceptional Action Action Delay Repetition Count Alert Action A particular action can be monitored for unexpected activity. - When you open the Alert Creation dialog box of an event or action, the execution time of the selected action is set as a threshold value for monitoring. When you open the Alert Creation dialog box of a field, the execution time of the entire process is set as a threshold value for monitoring. Set the repetition frequency to be used as the threshold value. Available when Repetition is selected as the KPI Type. Set the Action Source event and the Action Destination event for the action that will trigger the alert. Available when Exceptional Action is selected as the KPI Type. Default value
97 Item - When you open the Alert Creation dialog box of an event, it displays the selected event name on the Action Source event name. - When you open the Alert Creation dialog box of a action, it displays the selected action event name on the Action Source and Action Destination event names. When you open the Alert Creation dialog box of a field, there is no default value. [Add] button Displays the Filtering by Event Name dialog box used to search for event names in existing processes. Refer to "Filtering by Event Name dialog box" below for details. Action Set the Action Source event and the Action Destination event for the action whose action delay is to be monitored. Available when Action Delay is selected as the Alert Type. Default value - When you open the Alert Creation dialog box of an event, it displays the selected event name on the Action Source event name. When you open the Alert Creation dialog box of a action, it displays the selected action event name on the Action Source and Action Destination event names. Action Time Sets the action delay to be used as the threshold value. Select days, hours, minutes, or seconds for the time unit. Available when Action Delay is selected as the Alert Type. Alert Message Enter the message to be displayed when an alert occurs. The message entered here is used as the Alert Message in the Analytics alert definition. Create [button] Cancel [button] Creates an Analytics alert definition. Closes the dialog box without creating an Analytics alert definition. Point Alert definition is created with following parameters. - Type : Critical - Level : 100 Note that input alert message is used in common between English and Japanese. Edit using Analytics Studio if necessary

98 Filtering by Event Name dialog box This displays a dialog box that has a list of event names that can be selected for use when specifying actions when setting up alerts for exceptional actions or when specifying actions for action delay alerts. The list can be filtered by entering the first few characters of the event name. If you have edited a name, that is the name that is displayed. Select the name from the list and click Apply to have that name applied to the previous window Creating Charts Creating charts for a particular action In a displayed process, right-click an action and select Create Chart to display the Chart Creation dialog box
99 The following table describes the various options of the Chart Creation dialog box. Item Chart Name Comparison Category None Property Process Route Time Line KPI Action Time (ave) Action Time (max) Action Time (min) Action Time Enter a chart name. The name entered here is used as the Analytics chart definition name. Select Comparison Category for the KPI values from the list. This selection is then used as an item in the chart definitions in the Analytics Studio. Nothing is used for comparison. KPI values are shown on a one-dimensional chart. Properties are used for comparison. Select from the properties set for analysis when the process was generated. Processes are used for comparison. Routes are used for comparison. The time axis is used for comparison. Select KPI values from the list. Use the average action time as a KPI value. Available when "None", "Property", "Route", or "Time Line" is selected as the Comparison Category. Use the maximum action time as a KPI value. Available when "None", "Property", "Route", or "Time Line" is selected as the Comparison Category. Use the minimum action time as a KPI value. Available when "None", "Property", "Route", or "Time Line" is selected as the Comparison Category. Use the action time as a KPI value. Available when "Process" is selected as the Comparison Category
100 Item Action Count Chart Type Line Chart Bar Chart Tachometer Signal Process Filter Upper Threshold Lower Threshold Create [button] Cancel [button] Use the action time as a KPI value. Available when "None", "Property", "Route", or "Time Line" is selected as the Comparison Category. Select chart types from the list. Use the Line Chart. Available when "Property", "Route", or "Time Line" is selected as the Comparison Category. Use the Bar Chart. Available when "Property", "Route", or "Time Line" is selected as the Comparison Category. Use the Tachometer. Available when "None" is selected as the Comparison Category. Use the Signal. Available when "None" is selected as the Comparison Category. Specify how many processes to display in the KPI chart. The current process display volume is the default. Set the upper threshold value. Specify "Days", "Hours", "Minutes", or "Seconds" if the KPI value is one of the following; "Action Time", " Action Time (ave)", " Action Time (max)", " Action Time (min)". There is no upper threshold if nothing is entered. Set the lower threshold value. Specify "Days", "Hours", "Minutes", or "Seconds" if the KPI value is one of the following; " Action Time", " Action Time (ave)", " Action Time (max)", " Action Time (min)". There is no lower threshold if nothing is entered. Creates an Analytics chart definition. Closes the dialog box without creating an Analytics chart definition. Creating charts for the entire process Right-click in the Process Analysis tab and select Create Chart from the context menu to display the Chart Creation dialog box. This dialog box enables you to create a chart for the entire process. The following table describes the various options of the Chart Creation dialog box. Chart Name Item Display Type Comparison of Action Comparison of Route Enter a chart name. The name entered here is used as the Analytics chart definition name. Select the KPI display type from the list. Displays KPI values for each action. The action ID is used for the Analytics chart definition category. The action ID is made up of the "Action Source event name", an underscore, and the Action Destination event name". The KPI values are shown on the chart for each route. The Route ID is used for the Analytics chart definition category
101 KPI Item KPI Rate each Process KPI Rate each Route Action Time (ave) Action Time (max) Action Time (min) Action Time Action Count Repetition Count Chart Type Line Chart Bar Chart Stack Bar Chart Process Filter Upper Threshold Lower Threshold The KPI values are shown on the chart as percentages for each process. The process identifier is used as an item in the Analytics chart definition. The action ID is used for the Analytics chart definition series. The KPI values are shown on the chart as percentages for each route. The route identifier is used as an item in the Analytics chart definition. The action ID is used for the Analytics chart definition series. Select KPI values from the list. Use the average action time as a KPI value. Available when "Comparison of Action", "Comparison of Route", or "KPI Rate each Route" is selected as the Display Type. Use the maximum action time as a KPI value. Available when "Comparison of Action", "Comparison of Route", or "KPI Rate each Route" is selected as the Display Type. Use the minimum action time as a KPI value. Available when "Comparison of Action", "Comparison of Route", or "KPI Rate each Route" is selected as the Display Type. Use the action time as a KPI value. Available when "KPI Rate each Process" is selected as the Display Type. Use the action time as a KPI value. Available when "Comparison of Action" or "KPI Rate each Route" is selected as the Display Type. Use the repetition frequency as a KPI value. Available when "Comparison of Route" is selected as the Display Type. Select chart types from the list. Use the Line Chart. Available when "Comparison of Action" or "Comparison of Route" is selected as the Display Type. Use the Bar Chart. Available when "Comparison of Action" or "Comparison of Route" is selected as the Display Type. Use the Stack Bar Chart. Available when KPI Rate each Process or KPI Rate each Route is selected as the Display Type. Specify how many processes to display in the KPI chart. The current process display volume is the default. Set the upper threshold value. Specify "Days", "Hours", "Minutes", or "Seconds" if the KPI value is one of the following; "Action Time", " Action Time (ave)", " Action Time (max)", " Action Time (min)". There is no upper threshold if nothing is entered. Available when "Comparison of Action" or "Comparison of Route" is selected as the Display Type. Set the lower threshold value. Specify "Days", "Hours", "Minutes", or "Seconds" if the KPI value is one of the following; " Action Time", " Action Time (ave)", " Action Time (max)", " Action Time (min)". There is no lower threshold if nothing is entered
102 Item Create [button] Cancel [button] Available when "Comparison of Action" or "Comparison of Route" is selected as the Display Type. Creates an Analytics alert definition. Closes the dialog box. Point Chart definition is created with following parameters. - Period of Each Step : Latest data Note that unit of action time is "second". Edit using Analytics Studio if necessary. 8.8 Pareto Chart Use Pareto charts to visually represent the concentration of routes. Click Tools > Analyze > Pareto Chart to display the Pareto Chart dialog box. The following table lists the options in the Pareto Chart dialog box. Item Model Name Route Count Total Process Count Event Type Count Event Count Displays the model name. Displays the number of routes found from amongst all processes generated. Displays the number of all processes generated. Displays the number of event types found in all processes generated. Displays the number of events found in all processes generated

103 Item Pareto Chart Process Count Ratio Displays the Pareto Chart. The vertical axis on the left side of the chart is the number of processes, and the bars show the number of processes per route. The routes with the most number of processes are displayed first from the left. The right hand vertical axis is a percentage corresponding to the cumulative rate of routes compared to the total. 8.9 Process Details Search Click Tools > Analyze > Process Detail to display the Process Details dialog box. Specify process search keys to display the events that make up the process and the properties of those events. This allows you to learn more about the details of processes where alerts occurred due to threshold values (set as alert KPI in the Process Analyzer) being exceeded. Charts shown for separate process instances can be used to learn more about processes that have been identified as bottlenecks. Item Process Search Key This is used for searching process details. The process search keys can be checked in the Analytics Dashboard. Only number can be input. Other details about the Process Details Search are the same as covered in the Show Processes section above

104 Chapter 9 Fixed-point Monitoring of Business Using Process Discovery 9.1 Overview Use fixed-point analysis when it is necessary to monitor processes over an extended period. This may be necessary when changes are introduced after As-Is analysis with Process Discovery, or if some other inefficient activities have been introduced. Fixed-point monitoring allows you to schedule the generation of processes so that they are generated at regular intervals. You can take advantage of this real-time nature to set alerts in recognized bottlenecks and to produce KPI charts that allow you to see the results of improvement activities. Point In case of using fixed-point monitoring of business, an environment, where CSV data that is formed same as type used at initial model generation can be prepared regularly, should be prepared. Point In case of creating Alerts or Charts using Process Analyzer, group of Process Analyzer Power User should be allocated for user. 9.2 Auto-Generation of Processes In order to generate processes automatically, creating Analytics event each model and activating Process Discovery sensor are required. Under these configurations, processes are automatically generated when execution timing of Process Discovery sensor has come if CSV files in the CSV directory are updated. Creating Analytics Event This is configured using Fixed-point Monitoring Settings in the Management Console. Creating Alerts and Charts using Process Analyzer can be operated on the model which this configuration is done
![GUI Option Model Name System Sensor Event Group Event Name Scheduler Schedule Type Execution Schedule Create [button] Modify [button] Delete [button] This shows a list of models created with the](/docs-images/75/72892259/images/105-0.jpg "Process Generator that have been generated correctly. Select a model from this list for fixed-point monitoring settings. This shows a list of system sensors configured in Analytics.")
105 GUI Option Model Name System Sensor Event Group Event Name Scheduler Schedule Type Execution Schedule Create [button] Modify [button] Delete [button] This shows a list of models created with the Process Generator that have been generated correctly. Select a model from this list for fixed-point monitoring settings. This shows a list of system sensors configured in Analytics. Default value should be selected if multiple system sensors are not configured. This shows a list of event groups configured in Analytics Studio. If you do not care about Event Group, "System" can be selected as Event Group. Specify an arbitrary name for the Analytics event definition. This is used in the Analytics Studio. Specify Enabled if fixed-point monitoring of business is to be performed according to a schedule. Specify how to save process information generated by this feature. If Accumulate Data is specified, add new process information to existing process information. This type should be selected if only difference business data can be acquired. If Update Data is specified, existing process information will be deleted and save only create process information. This type should be selected if whole business information can be acquired every time. Set up the schedule of auto-generating processes. Create a configuration for fixed-point monitoring. Modify a configuration for fixed-point monitoring. Delete a configuration for fixed-point monitoring. Note When selecting Interval as Execution Schedule, time setting is not configured. (00:00 is displayed constantly.) In this case, executed date-time of configuration is used as starting point of scheduler. Activation of Process Discovery sensor This is configured using Connection Status in the Management Console. Process Discovery Connection should be activated


106 Confirmation of CSV directory where Process Discovery sensor is monitored This can be confirmed using Model List in the Process Generator. The directory which is shown in the CSV directory item is monitored by Process Discovery sensor. 9.3 KPI Alert Flow Chart for the Fixed-point Monitoring by KPI Alert Type of Monitoring Process Discovery supports the following types of monitoring techniques when integrated with the alert monitoring functions of the Analytics. Repetition Monitoring Threshold values are set to repeat individual events or entire processes


107 Exceptional Action Monitoring Monitoring is performed to look for actions that are not allowed or that absolutely must be performed Action Delay Monitoring Threshold values are set for the action time between events or time taken for the entire process Point After creating Alert definitions using Process Analyzer, you can publish right away if you need not to configure using Analytics Studio. Refer to the Studio Guide for details. Refer to "8.7.1 Creating Alerts" for details. 9.4 KPI Chart Flow Chart for the Fixed-point Monitoring by KPI Chart Chart KPI definitions for particular actions Chart KPI definition can be set using the following perspectives for particular actions. Comparison Category Chart Type KPI None Tachometer, Signal Action Time (ave, max, min), Action Count
108 Comparison Category Chart Type KPI Property Line Chart, Bar Chart Action Time (ave, max, min), Action Count Process Line Chart, Bar Chart Action Time Route Line Chart, Bar Chart Action Time (ave, max, min), Action Count Time Line Line Chart, Bar Chart Action Time (ave, max, min), Action Count Usage types are as follows: KPI values for Property values The properties for selected actions can be used and the property values can be made into chart items to display KPI values on the charts. This can be specified in case properties are focused as cause of business bottlenecks. KPI values for Processes The identifiers for processes can be made into chart items to display KPI values on the charts. This can be specified in case processes are focused as cause of business bottlenecks. KPI values for Routes The identifiers for routes can be made into chart items to display KPI values on the charts. This can be specified in case routes are focused as cause of business bottlenecks. Chronological display of KPI values The timing of fixed-point monitoring can be linked to the timing of Analytics scheduling and KPI values can be displayed in chronological order. This can be used to see the effects of improvements over time. Chart KPI definitions for entire processes Chart KPI definition can be set from the following perspectives for entire processes. Display Type Chart Type KPI Comparison of Action Line Chart, Bar Chart Action Time (ave, max, min), Action Count KPI Rate each Process Stack Bar Chart Action Time Comparison of Route Line Chart, Bar Chart Action Time (ave, max, min), Repetition Count KPI Rate each Route Stack Bar Chart Action Time (ave, max, min), Action Count Usage types are as follows: Comparing Actions The actions in the overall process can be made into chart items to display KPI values on the charts. This can be specified in case actions are focused as cause of business bottlenecks. KPI Rate each Process The KPI values are shown on the chart as percentages for each process. This can be specified in case KPI of actions including process are compared for specifying cause of business bottlenecks. Comparison of Routes Routes can be made into chart items to display KPI values on the charts. This can be specified in case routes are focused as cause of business bottlenecks
109 KPI Rate each Route The KPI values are shown on the chart as percentage for each route. This can be specified in case KPI of actions including route are compared for specifying cause of business bottlenecks. Refer to "8.7.2 Creating Charts" for details. Point After creating Chart definitions using Process Analyzer, you can publish right away if you need not to configure using Analytics Studio. Refer to the Studio Guide for details. Point In case of displaying charts under the condition that there are many actions, processes and routes, controlling plot volume is recommended. Max number of plot for category and series can be configured respectively. See the Analytics Studio Guide for details. 9.5 Drilling down into Process Details In order to drill down into process details, ProcessId should be confirmed from Alert details or displaying Chart. This value can be used as Process Search Key. Refer to "8.9 Process Details Search" for details. Example: Display of Alert details
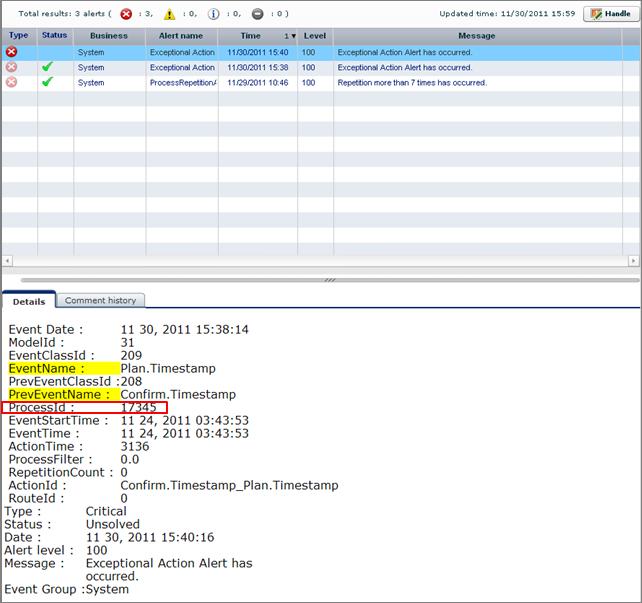
110
111 Chapter 10 Process Analysis Using IBPM Events 10.1 Overview When monitoring is configured for IBPM Processes, process visualization by Process Analyzer can be done using this process data. It may be effective in case Dynamic Processes need to be visualized as process diagram. Point Only finished processes can be integrated with this feature. Note IBPM events cannot be used as Fixed-point Monitoring Unit of Analysis In case IBPM events are analyzed, Model Series and Project Name are used to manage unit of analysis. Model Series Model Series corresponds to process for analysis. Following rules of naming is applied. Event Group Name and Event Name are indicated when configuring for monitoring IBPM processes in the Analytics. Defined Process (Event Group Name)_(Event Name)_(Process Name) Dynamic Process (Event Group Name)_(Event Name)_(Root Task Name) Project Name This represents the term including collected events Setting up for Event Collection Preparations Set up the Process Discovery database before event collection. Refer to Chapter 4,"Installing and Setting Up Analytics Server" in the Interstage Business Process Manager Analytics V12.0 Installation Guide for details. Configuration of schedule for event collection Configuration of schedule for IBPM event collection is required


112 Item Scheduler Execution Schedule Preservation Type Select Enabled to have the data generated according to a schedule. Setup a schedule to generate IBPM events for use in Process Discovery. Select how the data will be stored. Select Persistence to accumulate the data in Process Discovery. Select Temporary to discard old data and create latest data in Process Discovery. Note Restarting the Analytics Server to apply configuration is required. Point A term from former collected time to current time is a scope of event collection How to launch the Process Analyzer Log in to the IBPM Console. After logging in, go to the Analysis of Process Performance in Analytics Dashboard menu. Process Analyzer can be launched by clicking Analyze Process Patterns button. This button can be shown up when clicking: - process name ( in case of defined process) - root task name (in case of dynamic process)
 Screen of Select Process - 106 -")
113 10.4 Functionality of Process Analyzer This section explains about parts of difference compared with the functionalities of Process Analyzer whose Model Type is Business Event. Others have same functionalities. (Chapter 8 Process Analyzer Features) Screen of Select Process
 Display the standard deviation of action time. 10.4.")
114 Screen of Process Analyzer Action count and time Action Count Display the execution count on event. Show Action Time in (Average) Display the average of action time on event. <Parallel> is displayed for concurrent events. Show Action Time in (Standard Deviation) Display the standard deviation of action time Parallel Analysis Use the Parallel Analysis window to see the state of overlapping in event execution times (the difference between the event start time and end time). The overlapping in event execution time is shown for processes that are seen to be of the same type

115 Item Frequency Average Time Gantt Chart Displays the frequency of processes for each type of parallel execution. Displays the average time of processes for each type of parallel execution. Displays the overlaps in execution time as a Gantt chart. Note that the length of the bars in the chart does not represent the actual execution time Process Details Both Occurrence Time and End Time are displayed in Process Details


116 Not available functionalities Following functionalities are not available. - Action Time Distribution - Process Details Search 10.5 Deleting IBPM Events IBPM Events can be deleted using Model List in the Process Generator. IBPM Event should be selected in the Model Type in order to show up lists related to IBPM events
Process Discovery Guide
 FUJITSU Software Interstage Business Process Manager Analytics V12.2 Process Discovery Guide Windows/Linux B1X1-0110-03ENZ0(00) February 2014 About this Manual This section explains summary, chapter overview,
Handbook for the Process Discovery
 Interstage Business Process Manager Analytics V12.1 Handbook for the Process Discovery Solaris J2S0-0435-01ENZ0(00) April 2013 About this Manual This section explains summary, chapter overview, abbreviations,
Process Discovery (BPM-E) Web Flow Viewer User's Guide
 Web Flow Viewer User's Guide") Interstage Business Process Manager Analytics V11.1 Process Discovery (BPM-E) Web Flow Viewer User's Guide Windows B1X1-0030-01ENZ0(00) July 2010 About this Manual This manual explains the web-based flow
Interstage Business Process Manager Analytics V11.1 Process Discovery (BPM-E) Web Flow Viewer User's Guide Windows B1X1-0030-01ENZ0(00) July 2010 About this Manual This manual explains the web-based flow
Dashboard / Output Guide
 Interstage Business Process Manager Analytics V11.0 Dashboard / Output Guide Windows/Solaris/Linux J2U3-0053-01(00) December 2009 About this Manual This document describes how to use the Dashboard to display
Setup Guide for Wily Introscope Integration
 Interstage Business Process Manager Analytics V11.1 Setup Guide for Wily Introscope Integration Windows/Solaris/Linux B1X1-0028-01ENZ0(00) July 2010 About this Manual This document provides how to setup
Interstage Business Process Manager Analytics V11.1. Overview. Windows/Solaris/Linux
 Interstage Business Process Manager Analytics V11.1 Overview Windows/Solaris/Linux J2U3-0051-02(00) July 2010 About this Manual This document provides an overview of Interstage Business Process Manager
Interstage Business Process Manager Analytics V12.1. Overview. Solaris
 Interstage Business Process Manager Analytics V12.1 Overview Solaris J2S0-0428-01ENZ0(00) April 2013 About this Manual This section explains summary, chapter overview, abbreviations, and provides useful
Interstage Business Process Manager Analytics V12.1. Migration Guide. Windows/Linux
 Interstage Business Process Manager Analytics V12.1 Migration Guide Windows/Linux B1X1-0160-02ENZ0(00) January 2013 Preface This chapter provides a general introduction to this user guide, describing its
Dashboard / Output Guide
 FUJITSU Software Interstage Business Process Manager Analytics V12.2.1 Dashboard / Output Guide Linux B1X1-0106-04ENZ0(00) December 2014 About this Manual This section explains summary, chapter overview,
Interstage Business Process Manager Analytics V12.0 Studio Guide
 Interstage Business Process Manager Analytics V12.0 Studio Guide Windows/Linux January 2012 Studio Guide Trademarks Trademarks of other companies are used in this documentation only to identify particular
FUJITSU Software Interstage Business Process Manager Analytics V12.2. Overview. Windows/Linux
 FUJITSU Software Interstage Business Process Manager Analytics V12.2 Overview Windows/Linux B1X1-0104-03ENZ0(00) February 2014 About this Manual This section explains summary, chapter overview, abbreviations,
Interstage Business Process Manager Analytics V11.1. Installation Guide. Windows/Solaris/Linux
 Interstage Business Process Manager Analytics V11.1 Installation Guide Windows/Solaris/Linux J2U3-0052-02(00) July 2010 About this Manual This document describes how to install Interstage Business Process
Management Console Guide
 Interstage Business Process Manager Analytics V12.0 Management Console Guide Windows/Linux B1X1-0109-01 January 2012 About this Manual This document describes how to use the Management Console and Management
Interstage Business Process Manager Analytics V12.1. Administration Guide. Solaris
 Interstage Business Process Manager Analytics V12.1 Administration Guide Solaris J2S0-0431-01ENZ0(00) April 2013 About this Manual This section explains summary, chapter overview, abbreviations, and provides
FUJITSU Software Interstage Business Process Manager Analytics V Migration Guide. Linux
 FUJITSU Software Interstage Business Process Manager Analytics V12.2.1 Migration Guide Linux B1X1-0160-04ENZ0(00) December 2014 Preface This chapter provides a general introduction to this user guide,
Interstage Business Process Manager Analytics V12.1 Studio Guide
 Interstage Business Process Manager Analytics V12.1 Studio Guide Solaris April 2013 Studio Guide Trademarks Trademarks of other companies are used in this documentation only to identify particular products
Interstage Business Process Manager Analytics V12.1. Installation Guide. Solaris
 Interstage Business Process Manager Analytics V12.1 Installation Guide Solaris J2S0-0429-01ENZ0(00) April 2013 About this Manual This section explains summary, chapter overview, abbreviations, and provides
Management Console Guide
 FUJITSU Software Interstage Business Process Manager Analytics V12.2 Management Console Guide Windows/Linux B1X1-0109-03ENZ0(00) February 2014 About this Manual This section explains summary, chapter overview,
Interstage Business Process Manager Analytics V11.0. Administration Guide. Windows/Solaris/Linux
 Interstage Business Process Manager Analytics V11.0 Administration Guide Windows/Solaris/Linux J2U3-0054-01(00) December 2009 About this Manual This document describes the maintenance issues and techniques
Interstage Shunsaku Data Manager Using the Shunsaku Manuals
 Interstage Data Manager Using the Manuals Using the Manuals Trademarks Trademarks of other companies are used in this manual only to identify particular products or systems. Product Microsoft, Visual C++,
Troubleshooting Guide
 Systemwalker Runbook Automation Troubleshooting Guide Windows/Linux B1X1-0122-03ENZ0(00) July 2012 Preface Purpose of This Document This document describes how to deal with problems that occur with the
User's Guide - Master Schedule Management
 FUJITSU Software Systemwalker Operation Manager User's Guide - Master Schedule Management UNIX/Windows(R) J2X1-3170-14ENZ0(00) May 2015 Preface Purpose of This Document This document describes the Master
Structure and Overview of Manuals
 FUJITSU Software Systemwalker Operation Manager Structure and Overview of Manuals UNIX/Windows(R) J2X1-6900-08ENZ0(00) May 2015 Introduction Purpose of This Document Please ensure that you read this document
ETERNUS SF AdvancedCopy Manager Operator's Guide for Cluster Environment
 ETERNUS SF AdvancedCopy Manager 14.2 Operator's Guide for Cluster Environment J2X1-7452-04ENZ0(00) June 2011 Preface Purpose This manual explains the installation and customization of ETERNUS SF AdvancedCopy
User's Guide (Systemwalker User Management and Single Sign-On Edition)
") Systemwalker Service Quality Coordinator User's Guide (Systemwalker User Management and Single Sign-On Edition) Windows/Solaris/Linux J2X1-7665-02ENZ0(00) January 2013 Preface Purpose of this manual This
Systemwalker Service Quality Coordinator User's Guide (Systemwalker User Management and Single Sign-On Edition) Windows/Solaris/Linux J2X1-7665-02ENZ0(00) January 2013 Preface Purpose of this manual This
ETERNUS SF Express V15.3/ Storage Cruiser V15.3/ AdvancedCopy Manager V15.3. Migration Guide
 ETERNUS SF Express V15.3/ Storage Cruiser V15.3/ AdvancedCopy Manager V15.3 Migration Guide B1FW-5958-06ENZ0(00) June 2013 Preface Purpose This manual describes how to upgrade to this version from the
SAS Web Report Studio 3.1
 SAS Web Report Studio 3.1 User s Guide SAS Documentation The correct bibliographic citation for this manual is as follows: SAS Institute Inc. 2006. SAS Web Report Studio 3.1: User s Guide. Cary, NC: SAS
ETERNUS SF AdvancedCopy Manager V15.0. Quick Reference
 ETERNUS SF AdvancedCopy Manager V15.0 Quick Reference B1FW-5967-02ENZ0(00) April 2012 Preface Purpose This manual describes the pre-installation requirements, installation procedure, configuration procedure,
Troubleshooting Guide
 Systemwalker Runbook Automation Troubleshooting Guide Windows/Linux B1X1-0122-04ENZ0(00) September 2012 Preface Purpose of This Document This document describes how to deal with problems that occur with
Systemwalker Runbook Automation. Studio User's Guide. Windows/Linux
 Systemwalker Runbook Automation Studio User's Guide Windows/Linux B1X1-0116-05ENZ0(00) April 2014 Preface Purpose of this Document This document describes the procedures for developing and managing Automated
ETERNUS SF Express V15.1/ Storage Cruiser V15.1/ AdvancedCopy Manager V15.1. Migration Guide
 ETERNUS SF Express V15.1/ Storage Cruiser V15.1/ AdvancedCopy Manager V15.1 Migration Guide B1FW-5958-03ENZ0(00) August 2012 Preface Purpose This manual describes how to upgrade to this version from the
FUJITSU Storage ETERNUS SF Express V16.3 / Storage Cruiser V16.3 / AdvancedCopy Manager V16.3. Migration Guide
 FUJITSU Storage ETERNUS SF Express V16.3 / Storage Cruiser V16.3 / AdvancedCopy Manager V16.3 Migration Guide B1FW-6000-04ENZ0(00) October 2015 Preface Purpose This manual describes how to upgrade to this
ETERNUS SF AdvancedCopy Manager V13.3 Message Guide
 B1WW-8881-05ENZ0 (00) ETERNUS SF AdvancedCopy Manager V13.3 Message Guide ii Preface About This Manual This manual explains the messages output by ETERNUS SF AdvancedCopy Manager. Intended Reader This
Systemwalker Software Configuration Manager. Operation Guide. Windows/Linux
 Systemwalker Software Configuration Manager Operation Guide Windows/Linux B1X1-0128-04ENZ0(00) January 2013 Preface Purpose of this Document This document explains how to use the different features and
FUJITSU Software Systemwalker Software Configuration Manager. Operator's Guide. Windows/Linux
 FUJITSU Software Systemwalker Software Configuration Manager Operator's Guide Windows/Linux B1X1-0129-04ENZ0(00) March 2014 Preface Purpose of this Document This document explains patch management procedures
FUJITSU Software Systemwalker Software Configuration Manager. Release Notes. Windows/Linux
 FUJITSU Software Systemwalker Software Configuration Manager Release Notes B1X1-0125-05ENZ0(00) August 2014 Preface Purpose of this Document This document presents an overview of the functions that have
Business Insight Authoring
 Business Insight Authoring Getting Started Guide ImageNow Version: 6.7.x Written by: Product Documentation, R&D Date: August 2016 2014 Perceptive Software. All rights reserved CaptureNow, ImageNow, Interact,
FUJITSU Storage ETERNUS SF Storage Cruiser V16.3 / AdvancedCopy Manager V16.3. Cluster Environment Setup Guide
 FUJITSU Storage ETERNUS SF Storage Cruiser V16.3 / AdvancedCopy Manager V16.3 Cluster Environment Setup Guide B1FW-6006-04ENZ0(00) October 2015 Preface Purpose This manual provides information on installation
Working with Reports
 The following topics describe how to work with reports in the Firepower System: Introduction to Reports, page 1 Risk Reports, page 1 Standard Reports, page 2 About Working with Generated Reports, page
FUJITSU Software Systemwalker Software Configuration Manager. Parameter Reference. Windows/Linux
 FUJITSU Software Systemwalker Software Configuration Manager Parameter Reference /Linux B1X1-0313-03ENZ0(00) November 2015 Preface Purpose of this Document This document explains the parameter information
FUJITSU Software Interstage Business Process Manager Analytics V Installation Guide. Linux
 FUJITSU Software Interstage Business Process Manager Analytics V12.2.1 Installation Guide Linux B1X1-0105-04ENZ0(00) December 2014 About this Manual This section explains summary, chapter overview, abbreviations,
The following topics describe how to work with reports in the Firepower System:
 The following topics describe how to work with reports in the Firepower System: Introduction to Reports Introduction to Reports, on page 1 Risk Reports, on page 1 Standard Reports, on page 2 About Working
Interstage Shunsaku Data Manager Operator s Guide
 Interstage Shunsaku Data Manager Operator s Guide Operator s Guide Trademarks Trademarks of other companies are used in this manual only to identify particular products or systems. Product Microsoft, Visual
Systemwalker Service Quality Coordinator. Technical Guide. Windows/Solaris/Linux
 Systemwalker Service Quality Coordinator Technical Guide Windows/Solaris/Linux J2X1-6800-03ENZ0(00) May 2011 Preface Purpose of this manual This manual explains the functions and usage of Systemwalker
Interstage Business Process Manager V10.1. ARIS Process Performance Manager Integration Guide
 Interstage Business Process Manager V10.1 ARIS Process Performance Manager Integration Guide B1WD-1441-03ENZ0(00) September 2008 Publication Date Revision Trademarks All Rights Reserved, Copyright FUJITSU
ZENworks Reporting System Reference. January 2017
 ZENworks Reporting System Reference January 2017 Legal Notices For information about legal notices, trademarks, disclaimers, warranties, export and other use restrictions, U.S. Government rights, patent
FUJITSU Storage ETERNUS SF Express V16.5 / Storage Cruiser V16.5 / AdvancedCopy Manager V16.5. Migration Guide
 FUJITSU Storage ETERNUS SF Express V16.5 / Storage Cruiser V16.5 / AdvancedCopy Manager V16.5 Migration Guide B1FW-6000-06ENZ0(01) June 2017 Preface Purpose This manual describes how to upgrade to this
User's Guide for Tenant Users
 ServerView Resource Orchestrator Cloud Edition V3.0.0 User's Guide for Tenant Users Windows/Linux J2X1-7615-01ENZ0(05) April 2012 Preface Purpose This document explains how to operate the ROR Console provided
ServerView Resource Orchestrator Virtual Edition V User's Guide. Windows/Linux
 ServerView Resource Orchestrator Virtual Edition V3.0.0 User's Guide Windows/Linux J2X1-7606-01ENZ0(05) April 2012 Preface Purpose This manual provides an outline of ServerView Resource Orchestrator (hereinafter
Systemwalker Service Quality Coordinator. Technical Guide. Windows/Solaris/Linux
 Systemwalker Service Quality Coordinator Technical Guide Windows/Solaris/Linux J2X1-6800-02ENZ0(00) November 2010 Preface Purpose of this manual This manual explains the functions and usage of Systemwalker
xpression 3 Getting Started with xpression Enterprise Edition
 xpression 3 Getting Started with xpression Enterprise Edition 2001-2008 by EMC. All rights reserved. The copyright protection claimed includes all formats of copyrightable material and information governed
Oracle Financial Services Behavior Detection Platform: Administration Tools User Guide. Release May 2012
 Oracle Financial Services Behavior Detection Platform: Administration Tools User Guide Release 6.1.1 May 2012 Oracle Financial Services Behavior Detection Platform: Administration Tools User Guide Release
Systemwalker Software Configuration Manager. Reference Guide. Windows/Linux
 Systemwalker Software Configuration Manager Reference Guide Windows/Linux B1X1-0130-04ENZ0(00) January 2013 Preface Purpose of this Document This document explains the commands and files provided by Systemwalker
ETERNUS SF AdvancedCopy Manager Overview
 ETERNUS SF AdvancedCopy Manager 14.2 Overview J2X1-7443-04ENZ0(00) June 2011 Preface Purpose This manual provides an overview of the ETERNUS SF AdvancedCopy Manager. This manual describes the ETERNUS SF
User's Guide (Website Management Functions Edition)
") Systemwalker Service Quality Coordinator User's Guide (Website Management Functions Edition) Windows/Solaris/Linux J2X1-6860-03ENZ0(00) May 2011 Preface Purpose of this manual This manual explains how
Systemwalker Service Quality Coordinator User's Guide (Website Management Functions Edition) Windows/Solaris/Linux J2X1-6860-03ENZ0(00) May 2011 Preface Purpose of this manual This manual explains how
ETERNUS SF Storage Cruiser V15.0. Quick Reference
 ETERNUS SF Storage Cruiser V15.0 Quick Reference B1FW-5963-02ENZ0(00) April 2012 Preface Purpose This manual describes the pre-installation requirements, installation procedure, configuration procedure,
Systemwalker Software Configuration Manager. Technical Guide. Windows/Linux
 Systemwalker Software Configuration Manager Technical Guide Windows/Linux B1X1-0126-04ENZ0(00) January 2013 Preface Purpose of this Document This document explains the functions of Systemwalker Software
FUJITSU Software Systemwalker Operation Manager. Upgrade Guide. UNIX/Windows(R)
") FUJITSU Software Systemwalker Operation Manager Upgrade Guide UNIX/Windows(R) J2X1-3150-16ENZ0(00) May 2015 Preface Purpose of This Document This document describes the migration method, and notes when
FUJITSU Software Systemwalker Operation Manager Upgrade Guide UNIX/Windows(R) J2X1-3150-16ENZ0(00) May 2015 Preface Purpose of This Document This document describes the migration method, and notes when
User Guide. Modified: November 25, 2013 Version 9.0
 User Guide Modified: November 25, 2013 Version 9.0 Licensed Materials - Property of Management Information Tools, Inc. DBA MITS 801 Second Ave, Suite 1210 Seattle, WA 98104 2013 Management Information
Adobe Campaign Business Practitioner Adobe Certified Expert Exam Guide. Exam number: 9A0-395
 Adobe Campaign Business Practitioner Adobe Certified Expert Exam Guide Exam number: 9A0-395 Revised 08 September 2016 About Adobe Certified Expert Exams To be an Adobe Certified Expert is to demonstrate
User's Guide for Infrastructure Administrators (Resource Management)
") ServerView Resource Orchestrator Cloud Edition V3.0.0 User's Guide for Infrastructure Administrators (Resource Management) Windows/Linux J2X1-7612-01ENZ0(05) April 2012 Preface Purpose This manual provides
ServerView Resource Orchestrator Cloud Edition V3.0.0 User's Guide for Infrastructure Administrators (Resource Management) Windows/Linux J2X1-7612-01ENZ0(05) April 2012 Preface Purpose This manual provides
FUJITSU Storage ETERNUS SF Storage Cruiser V16.5 / AdvancedCopy Manager V16.5. Cluster Environment Setup Guide
 FUJITSU Storage ETERNUS SF Storage Cruiser V16.5 / AdvancedCopy Manager V16.5 Cluster Environment Setup Guide B1FW-6006-06ENZ0(00) May 2017 Preface Purpose This manual provides information on installation
IBM InfoSphere Information Server Version 8 Release 7. Reporting Guide SC
 IBM InfoSphere Server Version 8 Release 7 Reporting Guide SC19-3472-00 IBM InfoSphere Server Version 8 Release 7 Reporting Guide SC19-3472-00 Note Before using this information and the product that it
Sage Getting Started Guide. September 2017
 Sage 100 2018 Getting Started Guide September 2017 2017 The Sage Group plc or its licensors. All rights reserved. Sage, Sage logos, and Sage product and service names mentioned herein are the trademarks
Procedures Oracle FLEXCUBE Universal Banking Release 12.0 [May] [2012] Oracle Part Number E
![Procedures Oracle FLEXCUBE Universal Banking Release 12.0 [May] [2012] Oracle Part Number E](/thumbs/82/86805977.jpg "Procedures Oracle FLEXCUBE Universal Banking Release 12.0 [May] [2012] Oracle Part Number E") Procedures Oracle FLEXCUBE Universal Banking Release 12.0 [May] [2012] Oracle Part Number E51527-01 Table of Contents Procedures 1. ABOUT THIS MANUAL... 1-1 1.1 INTRODUCTION... 1-1 1.2 AUDIENCE... 1-1
Procedures Oracle FLEXCUBE Universal Banking Release 12.0 [May] [2012] Oracle Part Number E51527-01 Table of Contents Procedures 1. ABOUT THIS MANUAL... 1-1 1.1 INTRODUCTION... 1-1 1.2 AUDIENCE... 1-1
Oracle Financial Services Compliance Regulatory Reporting Indonesia Suspicious Transaction Report User Guide. Release 2.5.
 Oracle Financial Services Compliance Regulatory Reporting Indonesia Suspicious Transaction Report User Guide Release 2.5.5 December 2015 Oracle Financial Services Compliance Regulatory Reporting Indonesia
ER/Studio Enterprise Portal User Guide
 ER/Studio Enterprise Portal 1.1.1 User Guide Copyright 1994-2009 Embarcadero Technologies, Inc. Embarcadero Technologies, Inc. 100 California Street, 12th Floor San Francisco, CA 94111 U.S.A. All rights
Oracle Financial Services Common Reporting Standard User Guide. Release March 2017
 Oracle Financial Services Common Reporting Standard User Guide Release 8.0.4.0.0 March 2017 Oracle Financial Services Common Reporting Standard User Guide Release 8.0.4.0.0 March 2017 Part Number: E80239-01
Oracle Financial Services Common Reporting Standard Singapore User Guide. Release May 2018
 Oracle Financial Services Common Reporting Standard Singapore User Guide Release 8.0.6 May 2018 Oracle Financial Services Common Reporting Standard Singapore User Guide Release 8.0.6 May 2018 Part Number:
BW C SILWOOD TECHNOLOGY LTD. Safyr Metadata Discovery Software. Safyr User Guide
 BW C SILWOOD TECHNOLOGY LTD Safyr Metadata Discovery Software Safyr User Guide S I L W O O D T E C H N O L O G Y L I M I T E D Safyr User Guide Safyr 7.1 This product is subject to the license agreement
Systemwalker Service Quality Coordinator. Installation Guide. Windows/Solaris/Linux
 Systemwalker Service Quality Coordinator Installation Guide Windows/Solaris/Linux J2X1-7658-01ENZ0(01) September 2012 Preface Purpose of this manual This manual explains how to install Systemwalker Service
Java Platform, Standard Edition Advanced Management Console User's Guide 2.9
 Java Platform, Standard Edition Advanced Management Console User's Guide 2.9 E62444-13 January 2018 Java Platform, Standard Edition Advanced Management Console User's Guide, 2.9 E62444-13 Copyright 2014,
Sitecore Experience Platform 8.0 Rev: September 13, Sitecore Experience Platform 8.0
 Sitecore Experience Platform 8.0 Rev: September 13, 2018 Sitecore Experience Platform 8.0 All the official Sitecore documentation. Page 1 of 455 Experience Analytics glossary This topic contains a glossary
Microsoft Windows NT Microsoft Windows Softek AdvancedCopy Manager Operator's Guide V10.0L30
 Microsoft Windows NT Microsoft Windows 2000 Softek AdvancedCopy Manager Operator's Guide V10.0L30 Preface ++ Purpose This manual describes the operations on Softek AdvancedCopy Manager. ++ Intended Readers
Elixir Ad-hoc Report. Release Elixir Technology Pte Ltd
 Elixir Ad-hoc Report Release 4.0.0 Elixir Technology Pte Ltd Elixir Ad-hoc Report: Release 4.0.0 Elixir Technology Pte Ltd Published 2015 Copyright 2015 Elixir Technology Pte Ltd All rights reserved. Java
Talend Open Studio for Data Quality. User Guide 5.5.2
 Talend Open Studio for Data Quality User Guide 5.5.2 Talend Open Studio for Data Quality Adapted for v5.5. Supersedes previous releases. Publication date: January 29, 2015 Copyleft This documentation is
Product Documentation SAP Business ByDesign August Analytics
 Product Documentation PUBLIC Analytics Table Of Contents 1 Analytics.... 5 2 Business Background... 6 2.1 Overview of Analytics... 6 2.2 Overview of Reports in SAP Business ByDesign... 12 2.3 Reports
Enterprise 3.4 RC1. Managing Alfresco Content from within Microsoft Office
 Enterprise 3.4 RC1 Managing Alfresco Content from within Microsoft Office Contents Copyright... 3 Typographic conventions...4 Introduction... 5 System requirements and prerequisites...5 Get started...6
Test Information and Distribution Engine
 SC-Alt Test Information and Distribution Engine User Guide 2018 2019 Published January 14, 2019 Prepared by the American Institutes for Research Descriptions of the operation of the Test Information Distribution
Oracle Financial Services Common Reporting Standard Canada User Guide. Release May 2018
 Oracle Financial Services Common Reporting Standard Canada User Guide Release 8.0.6 May 2018 Oracle Financial Services Common Reporting Standard Canada User Guide Release 8.0.6 May 2018 Part Number: E93132-01
Talend Open Studio for MDM Web User Interface. User Guide 5.6.2
 Talend Open Studio for MDM Web User Interface User Guide 5.6.2 Talend Open Studio for MDM Web User Interface Adapted for v5.6.2. Supersedes previous releases. Publication date: May 12, 2015 Copyleft This
Oracle Financial Services Compliance Regulatory Reporting India Suspicious Transaction Report User Guide. Release
 Oracle Financial Services Compliance Regulatory Reporting India Suspicious Transaction Report User Guide Release 8.0.6.0.0 May 2018 Oracle Financial Services Compliance Regulatory Reporting India Suspicious
Decision Manager Help. Version 7.1.7
 Version 7.1.7 This document describes products and services of Pegasystems Inc. It may contain trade secrets and proprietary information. The document and product are protected by copyright and distributed
MMS DATA SUBSCRIPTION SERVICES USER INTERFACE GUIDE
 MMS DATA SUBSCRIPTION SERVICES USER INTERFACE GUIDE VERSION: 2.01 DOCUMENT REF: PREPARED BY: MMSTDPD69 EMD DATE: 16 February 2010 Final Copyright Copyright 2012 Australian Energy Market Operator Limited
Administration Tools User Guide. Release April 2015
 Administration Tools User Guide Release 6.2.5 April 2015 Administration Tools User Guide Release 6.2.5 April 2015 Part Number: E62969_05 Oracle Financial Services Software, Inc. 1900 Oracle Way Reston,
Data Express 4.0. Data Subset Extraction
 Data Express 4.0 Data Subset Extraction Micro Focus The Lawn 22-30 Old Bath Road Newbury, Berkshire RG14 1QN UK http://www.microfocus.com Copyright Micro Focus 2009-2014. All rights reserved. MICRO FOCUS,
Dell EMC Data Protection Advisor
 Dell EMC Data Protection Advisor Version 6.4 Custom Report Guide 302-004-008 REV 01 Copyright 2005-2017 Dell Inc. or its subsidiaries. All rights reserved. Published June 2017 Dell believes the information
Oracle Financial Services Regulatory Reporting Rwanda Suspicious Transaction Report User Guide. Release October 2014
 Oracle Financial Services Regulatory Reporting Rwanda Suspicious Transaction Report User Guide Release 2.5.2 October 2014 Oracle Financial Services Regulatory Reporting Rwanda Suspicious Transaction Report
Oracle Financial Services Regulatory Reporting Uganda Suspicious Transaction Report User Guide. Release October 2014
 Oracle Financial Services Regulatory Reporting Uganda Suspicious Transaction Report User Guide Release 2.5.2 October 2014 Oracle Financial Services Regulatory Reporting Uganda Suspicious Transaction Report
SAS Publishing SAS. Forecast Studio 1.4. User s Guide
 SAS Publishing SAS User s Guide Forecast Studio 1.4 The correct bibliographic citation for this manual is as follows: SAS Institute Inc. 2006. SAS Forecast Studio 1.4: User s Guide. Cary, NC: SAS Institute
Batch Scheduler. Version: 16.0
 Batch Scheduler Version: 16.0 Copyright 2018 Intellicus Technologies This document and its content is copyrighted material of Intellicus Technologies. The content may not be copied or derived from, through
User's Guide (Website Management Functions Edition)
") Systemwalker Service Quality Coordinator User's Guide (Website Management Functions Edition) Windows/Solaris/Linux J2X1-7664-01ENZ0(00) July 2012 Preface Purpose of this manual This manual explains how
Systemwalker Service Quality Coordinator User's Guide (Website Management Functions Edition) Windows/Solaris/Linux J2X1-7664-01ENZ0(00) July 2012 Preface Purpose of this manual This manual explains how
Sage Getting Started Guide
 Sage 100 2016 Getting Started Guide This is a publication of Sage Software, Inc. Version 2016 Copyright 2015 Sage Software, Inc. All rights reserved. Sage, the Sage logos, and the Sage product and service
MasterScope Virtual DataCenter Automation Media v3.0
 MasterScope Virtual DataCenter Automation Media v3.0 Release Memo 1st Edition June, 2016 NEC Corporation Disclaimer The copyrighted information noted in this document shall belong to NEC Corporation. Copying
Elixir Ad-hoc Report. Release Elixir Technology Pte Ltd
 Elixir Ad-hoc Report Release 3.5.0 Elixir Technology Pte Ltd Elixir Ad-hoc Report: Release 3.5.0 Elixir Technology Pte Ltd Published 2014 Copyright 2014 Elixir Technology Pte Ltd All rights reserved. Java
Inline Processing Engine User Guide. Release: August 2017 E
 Inline Processing Engine User Guide Release: 8.0.5.0.0 August 2017 E89148-01 Inline Processing Engine User Guide Release: 8.0.5.0.0 August 2017 E89148-01 Oracle Financial Services Software Limited Oracle
equestionnaire User Guide
 Prodika Product Lifecycle Management equestionnaire User Guide Release 5.1 Part Number: TPPR-0045-5.1A Make sure you check for updates to this manual at the Oracle Documentation Web site Copyrights and
Policy Commander Console Guide - Published February, 2012
 Policy Commander Console Guide - Published February, 2012 This publication could include technical inaccuracies or typographical errors. Changes are periodically made to the information herein; these changes
Style Report Enterprise Edition
 INTRODUCTION Style Report Enterprise Edition Welcome to Style Report Enterprise Edition! Style Report is a report design and interactive analysis package that allows you to explore, analyze, monitor, report,
Reporting and Analysis Guide
 Reporting and Analysis Guide Oracle Health Sciences InForm 6.1 Part number: E51802-01 Copyright 2014, Oracle and/or its affiliates. All rights reserved. The Programs (which include both the software and