Mathematical Methods 2019 v1.2
|
|
|
- Pauline Jennings
- 5 years ago
- Views:
Transcription
1 Problem-solving and modelling task This sample has been compiled by the QCAA to assist and support teachers to match evidence in student responses to the characteristics described in the assessment objectives. Assessment objectives This assessment instrument is used to determine student achievement in the following objectives: 1. select, recall and use facts, rules, definitions and procedures drawn from Unit 1 Topic 2 2. comprehend mathematical concepts and techniques drawn from Unit 1 Topic 2 3. communicate using mathematical, statistical and everyday language and conventions 4. evaluate the reasonableness of solutions 5. justify procedures and decisions by explaining mathematical reasoning 6. solve problems by applying mathematical concepts and techniques drawn from Unit 1 Topic
2 Task Context Computer-generated images in video games and film and TV special effects are created using a number of mathematical concepts and techniques, including basic arithmetic, geometry, trigonometry, linear algebra and calculus. A computer animation studio is interested in developing its own physics engine. They have asked you to work on one aspect of the engine how free-hanging objects act under the influence of gravity. It has been suggested that as a proof of concept, a function can be used to model the shape of a hanging chain. Task Consider a flexible chain of length, l, that hangs freely. The ends of the chain are secured at two fixed points that are at the same height and are distance, d, apart. Develop a function that models the shape of the hanging chain, and then produce a report that explains how you developed and refined your model. You must consider: a polynomial function the sum of a number of even-degree polynomials described as: yy = aa 0 + bb 2 (xx aa 2 ) 2 + bb 4 (xx aa 4 ) bb 2nn (xx aa 2nn ) 2nn +. Sample response Criterion Marks allocated Result Assessment objectives 1, 2, 5 Solve Assessment objectives 1 and 6 Evaluate and verify Assessment objectives 4 and 5 Communicate Assessment objective 3 Total Page 2 of 15

3 Communicate coherent and concise organisation of the response The introduction describes what the task is about and briefly outlines how the writer intends to complete the task. accurate translation of all aspects of the problem by identifying mathematical concepts and techniques Introduction In this report, the model that best describes the shape of a freely hanging chain of length 433 mm, supported at two ends that are 180 mm apart is determined. To carry out the investigation, a suitable frame of reference data is used to determine the primary data needed to generate feasible mathematical models. Both polynomial models and a real-valued polynomial model consisting of the sum of a number of even-degree polynomials of the type yy = aa 0 + bb 2 (xx aa 2 ) 2 + bb 4 (xx aa 4 ) bb 2nn (xx aa 2nn ) 2nn + are considered. Both technological and mathematical procedures are used to find the models, including transformations, simultaneous equation solving and technology, such as Excel and Desmos. The feasibility of the models is tested by considering measures including the correlation coefficient and residual analysis. Recommendations as to the usefulness of models are also discussed. Method A 1 mm 1 mm sheet of graph paper was attached with adhesive to a large fixed window. It was important that the graph paper s grid lines were aligned vertically and horizontally. The experimental set-up is shown in Figure 1 below. accurate translation of all aspects of the problem by identifying mathematical concepts and techniques accurate translation of all aspects of the problem identifying mathematical concepts and techniques; accurate documentation of relevant observations Figure 1: A photograph showing the experimental set-up with the graph paper stuck to the window and the freely hanging chain. The bottom left-hand corner of the graph paper was chosen as the origin of the Cartesian plane. The chain was affixed very precisely to the graph paper at coordinates (0, 270) and (180, 270). The domain for the model will therefore be 0 xx 270. A fine needle was inserted through the hollow centres of the chain links to pierce the graph paper beneath. Care was taken to avoid contact with the chain to ensure there was no effect on its free hanging position, ensuring accurate data was collected. Needle pricks were made in the graph paper approximately every half centimetre along the chain length, giving 35 data points. Since the chain hangs freely under its own weight, the curve is symmetrical about the vertical line through its apex or turning point. It was decided, nonetheless, to collect data points along the entire length of the chain. This allowed the data set to be doubled (by reflecting the data points in the vertical line through the turning point). The 35 needle pricks were then converted into Cartesian coordinates relative to the origin. Page 3 of 15
4 Communicate coherent and concise organisation of the response The data points are tabulated in Figure 2. Cartesian coordinates of a freely hanging chain x (mm) y (mm) x (mm) y (mm) x (mm) y (mm) Figure 2: Tabulated (x, y) position data for a freely hanging chain. Communicate coherent and concise organisation of the response Analysis Figure 3 below shows a plot of the data using technology. Figure 3: Graph showing the (x, y) position data for a freely hanging chain. All dimensions are in mm. documentation of appropriate assumptions It was observed the sketch resembled a parabola in shape. It was therefore assumed that a quadratic function would provide a reasonable model. This was investigated. Using coordinates: Page 4 of 15
5 accurate documentation of relevant observations Left fixation coordinate (0, 270) Right fixation coordinate (180, 270) Turning point 180, 86 = (90, 86) 2 Basic quadratic function: yy = xx 2 Turning point (0, 0) Transformed quadratic function Solve discerning application of mathematical concepts and techniques relevant to the task Student determines the function by shifting vertically and horizontally and by stretching or compressing. yy = aa(xx + bb) 2 + cc (1) The turning point of the basic function is (0, 0), while the turning point of the transformed function is (90, 86). This means that the curve has been translated in the positive y-direction by 86 mm and translated in the positive x-direction by 90 mm; therefore, the parameter values of cc and bb are 86 and -90 respectively. Substituting these values into equation (1) gives: yy = aa(xx 90) (2) The point (0, 270) lies on the curve. Substituting (0, 270) into equation (2): 270 = aa(0 90) and re-arranging: = aa = aa 90 2 aa = aa = The proposed parabolic function to model the position data of the freely hanging chain is: y = (xx 90) " " model (A) The graph of model (A) and the raw position data is shown in Figure 4 below. Figure 4: Graph showing the (x, y) position data of a freely hanging chain and model (A) determined analytically. All dimensions are in mm. Page 5 of 15
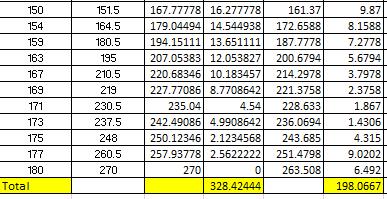
6 accurate documentation of relevant observations Evaluate and verify evaluation of the reasonableness of solutions by considering the results, assumptions and observations It was observed that the curve made by a freely hanging chain is flatter than the parabolic function. While the parabola fits the data at the two fixation points and the turning point (since that was how the parabolic function was derived), it is too narrow everywhere else. Using Excel, the best fitting parabolic function was also found (yy = xx xx Model (B)). The graph of Model (B) is shown in Figure 5. Even though the RR 2 value is which indicates a very strong positive correlation, it is clear from the graph that the fit is also not appropriate. Cartesian co-ordinates of a freely hanging chain and quadratic regression model y coordinates (mm) y = x x R² = x coordinates (mm) Figure 5: Graph showing the (x, y) position data of a freely hanging chain and technologygenerated quadratic Model (B). The analysis was repeated using technology and the quartic regression model produced a higher RR 2 value of The quartic model is shown in Figure 6. Quartic regression model y coordinate y = 1E-06x x x x R² = x coordinate Figure 6: Graph showing the (x, y) position data of a freely hanging chain and Excel s best fitting quartic polynomial model. accurate translation of all aspects of the problem by identifying mathematical concepts and techniques The viability of all models was further investigated using a residual analysis, which showed the variation between the observed y-value data set and the predicted y-value data set using the model, ideally resulting in residuals that are small. The sum of the absolute values of the vertical residuals between points generated by the model and corresponding points in the data was then calculated. Page 6 of 15
7 Solve accurate and appropriate use of technology Figure 7 shows an excerpt from the residual analysis for both quadratic Model (A) and quadratic Model (B). An Excel spreadsheet was used to make the comparison and determine if either model was feasible. The full analysis and formulas used for the spreadsheet can be found in Appendix 1 and Appendix 2. x-coordin ate y- coordi nate model A predicte d y- coordina te Absolute residual (model A) model B predicate d y - coordi nate Absolut e residual (model B) Total Figure 7: Absolute residual analysis for analytic quadratic model (A) and Excel parabolic model (B) (excerpt). Using a similar procedure, the residual analysis for the Excel quartic polynomial model was found to be (see Appendix 3). Evaluate and verify evaluation of the reasonableness of solutions by considering the results, assumptions and observations accurate documentation of relevant observations; documentation of appropriate assumptions Neither a quadratic or a quartic model are valid models to represent how the chain hangs. The total variation is less using the technologically generated quadratic model (Model B), however the model required further refinement. Refining the model Using Desmos software, it was observed that even-powered polynomials of the form yy = xx 2nn (nn 1, nn ZZ) always produced U-shaped sketches (see Appendix 4). An analytic procedure was used to generate the quartic function of the form aa(xx bb) 2nn + cc for the hanging chain (nn = 2). The parameter values a, b and c move the sketch to the right and left, up and down and stretch or compress the sketch, but the shape remains U- Page 7 of 15
8 shaped therefore it is an appropriate assumption to use this type of function to model a chain. Known coordinates: Left fixation point (0, 270) Right fixation point (180, 270) Turning point ( 180, 86) = (90, 86) 2 Basic quartic function: yy = xx 4 Turning point (0, 0) Transformed function yy = aa(xx + bb) 4 + c (3) The turning point of the basic function is (0, 0), while the turning point of the transformed function is (90, 86). The curve has been translated in the positive y-direction by 86mm, and translated in the positive x-direction by 90mm, producing the c and b parameter values of 86 and -90 respectively. Substituting these values into equation (3) gives: yy = aa(xx 90) (4) Communication coherent and concise organisation of the response Substituting (0, 270) into equation (4) and using a similar procedure to the parabolic model on page 10 produced the following quartic function: yy = (xx 90) Model (C) Figure 8 below shows the graph of model (C), the quadratic model (A) and the raw data values. Solve accurate and appropriate use of technology Evaluate and verify documentation of relevant strengths and limitations of the model accurate documentation of relevant observations; documentation of appropriate assumptions; Figure 8: Graph showing the (x, y) position data of a freely hanging chain, the analytical quadratic model (A) (pink) and the analytical quartic model (C) (orange). Figure 8 shows that while the quadratic function (model (A)) is too narrow, the quartic function (model (C)) is too wide. It was assumed a combination of the two functions would give a better fit. New parameter values were required as clearly the sum of the quadratic and quartic functions would produce a result that was incorrect (e.g. adding the y-values for a given x- value for both functions would produce a coordinate which clearly does Page 8 of 15
9 accurate translation of all aspects of the problem Solve accurate use of complex procedures; discerning application of mathematical concepts and techniques relevant to the task not lie on the chain). Known coordinates: Left fixation point (0, 270) Point along the chain (36.0, 132.5) Combination function 1: yy = aa (xx 23 90)2 +b (xx 90)4 +86 Setting up a simpler form of the function to solve for the parameter values A and B: yy = A(xx 90) 2 + B(xx 90) (5) Substituting the points (0, 270) into equation (5): 270 = AA(0 90) 2 + B(0 90) = AA( 90) 2 + B( 90) = 8100A B 184 = 8100(AA BB) BB = AA (6) 8100 Substitute (36.0, 132.5) into equation (5) Communicate correct use of appropriate technical vocabulary, procedural vocabulary, and conventions to develop the response = AA(36 90) 2 + BB(36 90) = AA( 54) 2 + B( 54) = 54 2 (A B) BB = AA (7) Substitute equation (6) into equation (7) BB = BB 5184BB = BB = (to 5 significant figures) Substitute B into equation (6) AA = AA = Combination function 1: yy = (xx 90) (xx 90) Model (D) Combination function 2: The procedure was repeated using a different subset of two points (0,270) and (144.5, 136.5) and produced the following model: yy = (xx 90) (xx 90) Model (E) Page 9 of 15
10 Evaluate and verify justification of decisions made using mathematical reasoning; documentation of relevant strengths and limitations of the model The sum of the absolute residuals for model (D) is and for model (E) is The most feasible analytical function to use for modelling the chain is model (E) which resulted in the lowest deviation of actual values from the y values generated using the model (as indicated by the smallest absolute residual sum). It should be noted however, that another subset of two points could be used to produce a different model; and consequently a different residual analysis could be considered. The graph of the model (E) is given below in Figure 9. The points are also plotted. Figure 9: Graph showing the (x, y) position data of a freely hanging chain and model (E) the sum of even powered polynomials. accurate translation of all aspects of the problem by identifying techniques Solve accurate and appropriate use of technology Technology was used to generate an alternative model. Using Desmos, the original data values (xx 1, yy 1 ) were input in a table and the function type was given, as shown below: yy ~ (aa(xx 1 bb) 2 + cc(xx 1 dd) 4 + ff (see Figure 10). Note: the tilde (~) notation is used in Desmos to signify a regression analysis; the parameter values are adjusted to fit the data as closely as possible. Page 10 of 15
11 Solve accurate and appropriate use of technology Evaluate and verify documentation of relevant strengths and limitations of the solution and/or model Figure 10: Graph showing the (x, y) position data of a freely hanging chain and the technologygenerated model using the given function type. The following parameter values were generated: yy = (xx ) (xx ) Model (F) (RR 2 = ) The results for this model, and model (E) are very comparable. However, using Excel, the sum of the absolute residuals for the Desmos model (F) was The most feasible model to use to represent how the chain hangs is therefore Model (F): Communicate coherent and concise organisation of the response including a conclusion yy = (xx ) (xx ) where 0 xx 270. Conclusion The observation that models of the form yy = aa(xx bb) 2nn were always U- shaped in appearance provided the most successful approach to develop an accurate model for the shape of the chain. The model developed using the sum of even degree polynomial expressions was the most feasible. The summation of the quartic and quadratic models enabled the flatness of the quartic model and the narrowness of the quadratic model to be adjusted to more accurately model the hanging chain. A residual analysis provided better justification for the choice of the final model for the hanging chain. The polynomial models that were developed, produced residual results that were far greater than the summation model. The summation model that was generated using technology was the most valid. Further analysis could involve investigating the sum of a sixthdegree, fourth-degree polynomial and second-degree polynomial, or any combination of these. Page 11 of 15

12 Appendix 1 Page 12 of 15


13 Appendix 2 Appendix 3 x-coordinate y-coordinate Technologygenerated quartic regression model Absolute residual Page 13 of 15
14 Total Page 14 of 15
15 Appendix 4 Page 15 of 15
Honors Algebra 2 Function Transformations Discovery
 Honors Algebra Function Transformations Discovery Name: Date: Parent Polynomial Graphs Using an input-output table, make a rough sketch and compare the graphs of the following functions. f x x. f x x.
Concept of Curve Fitting Difference with Interpolation
 Curve Fitting Content Concept of Curve Fitting Difference with Interpolation Estimation of Linear Parameters by Least Squares Curve Fitting by Polynomial Least Squares Estimation of Non-linear Parameters
Section 6: Quadratic Equations and Functions Part 2
 Section 6: Quadratic Equations and Functions Part 2 Topic 1: Observations from a Graph of a Quadratic Function... 147 Topic 2: Nature of the Solutions of Quadratic Equations and Functions... 150 Topic
Q.4 Properties of Quadratic Function and Optimization Problems
 384 Q.4 Properties of Quadratic Function and Optimization Problems In the previous section, we examined how to graph and read the characteristics of the graph of a quadratic function given in vertex form,
Algebra II Quadratic Functions
 1 Algebra II Quadratic Functions 2014-10-14 www.njctl.org 2 Ta b le o f C o n te n t Key Terms click on the topic to go to that section Explain Characteristics of Quadratic Functions Combining Transformations
ON THE VELOCITY OF A WEIGHTED CYLINDER DOWN AN INCLINED PLANE
 ON THE VELOCITY OF A WEIGHTED CYLINDER DOWN AN INCLINED PLANE Raghav Grover and Aneesh Agarwal RG (Grade 12 High School), AA (Grade 11 High School) Department of Physics, The Doon School, Dehradun. raghav.503.2019@doonschool.com,
b) develop mathematical thinking and problem solving ability.
 develop mathematical thinking and problem solving ability.") Submission for Pre-Calculus MATH 20095 1. Course s instructional goals and objectives: The purpose of this course is to a) develop conceptual understanding and fluency with algebraic and transcendental
Submission for Pre-Calculus MATH 20095 1. Course s instructional goals and objectives: The purpose of this course is to a) develop conceptual understanding and fluency with algebraic and transcendental
Algebra 2 Semester 1 (#2221)
") Instructional Materials for WCSD Math Common Finals The Instructional Materials are for student and teacher use and are aligned to the 2016-2017 Course Guides for the following course: Algebra 2 Semester
Instructional Materials for WCSD Math Common Finals The Instructional Materials are for student and teacher use and are aligned to the 2016-2017 Course Guides for the following course: Algebra 2 Semester
Linear Functions. College Algebra
 Linear Functions College Algebra Linear Function A linear function is a function whose graph is a straight line. Linear functions can be written in the slope-intercept form of a line: f(x) = mx + b where
The Discriminant and Quadratic Formula:
 AFDA Unit 4: Quadratic Functions Day 7 Notes: Quadratic Formula and Regression Name: Block: Date: Today you will be using the Discriminant to determine the number and type of solutions for a quadratic
6.4 Vertex Form of a Quadratic Function
 6.4 Vertex Form of a Quadratic Function Recall from 6.1 and 6.2: Standard Form The standard form of a quadratic is: f(x) = ax 2 + bx + c or y = ax 2 + bx + c where a, b, and c are real numbers and a 0.
Exemplar for Internal Achievement Standard. Mathematics and Statistics Level 1
 Exemplar for Internal Achievement Standard Mathematics and Statistics Level 1 This exemplar supports assessment against: Achievement Standard (2.2) Apply graphical methods in solving problems An annotated
Course Number 432/433 Title Algebra II (A & B) H Grade # of Days 120
 H Grade # of Days 120") Whitman-Hanson Regional High School provides all students with a high- quality education in order to develop reflective, concerned citizens and contributing members of the global community. Course Number
Whitman-Hanson Regional High School provides all students with a high- quality education in order to develop reflective, concerned citizens and contributing members of the global community. Course Number
round decimals to the nearest decimal place and order negative numbers in context
 6 Numbers and the number system understand and use proportionality use the equivalence of fractions, decimals and percentages to compare proportions use understanding of place value to multiply and divide
Section 1: Introduction to Geometry Points, Lines, and Planes
 Section 1: Introduction to Geometry Points, Lines, and Planes Topic 1: Basics of Geometry - Part 1... 3 Topic 2: Basics of Geometry Part 2... 5 Topic 3: Midpoint and Distance in the Coordinate Plane Part
MEI Desmos Tasks for AS Pure
 Task 1: Coordinate Geometry Intersection of a line and a curve 1. Add a quadratic curve, e.g. y = x² 4x + 1 2. Add a line, e.g. y = x 3 3. Select the points of intersection of the line and the curve. What
number Understand the equivalence between recurring decimals and fractions
 number Understand the equivalence between recurring decimals and fractions Using and Applying Algebra Calculating Shape, Space and Measure Handling Data Use fractions or percentages to solve problems involving
Standard Form of Quadratic Functions
 Math Objectives Students will be able to predict how a specific change in the value of a will affect the shape of the graph of the quadratic ax bx c. Students will be able to predict how a specific change
Assessment Schedule 2012 Mathematics and Statistics: Investigate relationships between tables, equations and graphs (91028)
") NCEA Level 1 Mathematics and Statistics (928) 12 page 1 of 7 Assessment Schedule 12 Mathematics and Statistics: Investigate relationships between tables, equations and graphs (928) Evidence Statement Question
NCEA Level 1 Mathematics and Statistics (928) 12 page 1 of 7 Assessment Schedule 12 Mathematics and Statistics: Investigate relationships between tables, equations and graphs (928) Evidence Statement Question
Course of study- Algebra Introduction: Algebra 1-2 is a course offered in the Mathematics Department. The course will be primarily taken by
 Course of study- Algebra 1-2 1. Introduction: Algebra 1-2 is a course offered in the Mathematics Department. The course will be primarily taken by students in Grades 9 and 10, but since all students must
Ohio Tutorials are designed specifically for the Ohio Learning Standards to prepare students for the Ohio State Tests and end-ofcourse
 Tutorial Outline Ohio Tutorials are designed specifically for the Ohio Learning Standards to prepare students for the Ohio State Tests and end-ofcourse exams. Math Tutorials offer targeted instruction,
Guide to Planning Functions and Applications, Grade 11, University/College Preparation (MCF3M)
") Guide to Planning Functions and Applications, Grade 11, University/College Preparation (MCF3M) 006 007 Targeted Implementation and Planning Supports for Revised Mathematics This is intended to provide
Guide to Planning Functions and Applications, Grade 11, University/College Preparation (MCF3M) 006 007 Targeted Implementation and Planning Supports for Revised Mathematics This is intended to provide
INDEPENDENT SCHOOL DISTRICT 196 Rosemount, Minnesota Educating our students to reach their full potential
 INDEPENDENT SCHOOL DISTRICT 196 Rosemount, Minnesota Educating our students to reach their full potential MINNESOTA MATHEMATICS STANDARDS Grades 9, 10, 11 I. MATHEMATICAL REASONING Apply skills of mathematical
Maths. Formative Assessment/key piece of work prior to end of unit: Term Autumn 1
 Term Autumn 1 3 weeks Negative numbers Multiples and factors Common factors Prime numbers Ordering decimal numbers Rounding Square numbers and square roots Prime factor decomposition LCM and HCF Square
Activity 7. The Slope of the Tangent Line (Part 2) Objectives. Introduction. Problem
 Objectives. Introduction. Problem") Activity 7 Objectives Use the CellSheet App to find the approximate slope of a tangent line of a curve Compare the x-slope relationship of parabolic and cubic curves Introduction In Activity 6, you found
Activity 7 Objectives Use the CellSheet App to find the approximate slope of a tangent line of a curve Compare the x-slope relationship of parabolic and cubic curves Introduction In Activity 6, you found
Summer Review for Students Entering Pre-Calculus with Trigonometry. TI-84 Plus Graphing Calculator is required for this course.
 Summer Review for Students Entering Pre-Calculus with Trigonometry 1. Using Function Notation and Identifying Domain and Range 2. Multiplying Polynomials and Solving Quadratics 3. Solving with Trig Ratios
1.1 Functions. Cartesian Coordinate System
 1.1 Functions This section deals with the topic of functions, one of the most important topics in all of mathematics. Let s discuss the idea of the Cartesian coordinate system first. Cartesian Coordinate
Algebra I Notes Absolute Value Functions Unit 04c
 OBJECTIVES: F.IF.B.4 Interpret functions that arise in applications in terms of the context. For a function that models a relationship between two quantities, interpret key features of graphs and tables
Mathematics. Algebra, Functions, and Data Analysis Curriculum Guide. Revised 2010
 Mathematics Algebra, Functions, and Data Analysis Curriculum Guide Revised 010 This page is intentionally left blank. Introduction The Mathematics Curriculum Guide serves as a guide for teachers when planning
QUADRATIC FUNCTIONS Investigating Quadratic Functions in Vertex Form
 QUADRATIC FUNCTIONS Investigating Quadratic Functions in Verte Form The two forms of a quadratic function that have been eplored previousl are: Factored form: f ( ) a( r)( s) Standard form: f ( ) a b c
CCSSM Curriculum Analysis Project Tool 1 Interpreting Functions in Grades 9-12
 Tool 1: Standards for Mathematical ent: Interpreting Functions CCSSM Curriculum Analysis Project Tool 1 Interpreting Functions in Grades 9-12 Name of Reviewer School/District Date Name of Curriculum Materials:
Final Exam Review Algebra Semester 1
 Final Exam Review Algebra 015-016 Semester 1 Name: Module 1 Find the inverse of each function. 1. f x 10 4x. g x 15x 10 Use compositions to check if the two functions are inverses. 3. s x 7 x and t(x)
Middle School Math Course 3
 Middle School Math Course 3 Correlation of the ALEKS course Middle School Math Course 3 to the Texas Essential Knowledge and Skills (TEKS) for Mathematics Grade 8 (2012) (1) Mathematical process standards.
Let s review some things we learned earlier about the information we can gather from the graph of a quadratic.
 Section 6: Quadratic Equations and Functions Part 2 Section 6 Topic 1 Observations from a Graph of a Quadratic Function Let s review some things we learned earlier about the information we can gather from
Foundations for Functions Knowledge and Skills: Foundations for Functions Knowledge and Skills:
 Texas University Interscholastic League Contest Event: Mathematics The 40-minute, 60-question contest is designed to test knowledge and understanding in the areas of algebra I and II, geometry, trigonometry,
MEI GeoGebra Tasks for AS Pure
 Task 1: Coordinate Geometry Intersection of a line and a curve 1. Add a quadratic curve, e.g. y = x 2 4x + 1 2. Add a line, e.g. y = x 3 3. Use the Intersect tool to find the points of intersection of
Graphs and Linear Functions
 Graphs and Linear Functions A -dimensional graph is a visual representation of a relationship between two variables given by an equation or an inequality. Graphs help us solve algebraic problems by analysing
Suggested Foundation Topics for Paper 2
 Suggested Foundation Topics for Paper 2 Number N a N b N b N c N d Add, subtract, multiply and divide any positive and negative integers Order decimals and integers Order rational numbers Use the concepts
Investigating Transformations With DESMOS
 MPM D0 Date: Investigating Transformations With DESMOS INVESTIGATION Part A: What if we add a constant to the x in y = x? 1. Use DESMOS to graph the following quadratic functions on the same grid. Graph
Lesson #6: Basic Transformations with the Absolute Value Function
 Lesson #6: Basic Transformations with the Absolute Value Function Recall: Piecewise Functions Graph:,, What parent function did this piecewise function create? The Absolute Value Function Algebra II with
Maths PoS: Year 7 HT1. Students will colour code as they work through the scheme of work. Students will learn about Number and Shape
 Maths PoS: Year 7 HT1 Students will learn about Number and Shape Number: Use positive and negative numbers in context and position them on a number line. Recall quickly multiplication facts up to 10 10
This lesson is designed to improve students
 NATIONAL MATH + SCIENCE INITIATIVE Mathematics g x 8 6 4 2 0 8 6 4 2 y h x k x f x r x 8 6 4 2 0 8 6 4 2 2 2 4 6 8 0 2 4 6 8 4 6 8 0 2 4 6 8 LEVEL Algebra or Math in a unit on function transformations
SLStats.notebook. January 12, Statistics:
 Statistics: 1 2 3 Ways to display data: 4 generic arithmetic mean sample 14A: Opener, #3,4 (Vocabulary, histograms, frequency tables, stem and leaf) 14B.1: #3,5,8,9,11,12,14,15,16 (Mean, median, mode,
Introduction to ANSYS DesignXplorer
 Lecture 4 14. 5 Release Introduction to ANSYS DesignXplorer 1 2013 ANSYS, Inc. September 27, 2013 s are functions of different nature where the output parameters are described in terms of the input parameters
UNIT 1: NUMBER LINES, INTERVALS, AND SETS
 ALGEBRA II CURRICULUM OUTLINE 2011-2012 OVERVIEW: 1. Numbers, Lines, Intervals and Sets 2. Algebraic Manipulation: Rational Expressions and Exponents 3. Radicals and Radical Equations 4. Function Basics
WESTMORELAND COUNTY PUBLIC SCHOOLS Integrated Instructional Pacing Guide and Checklist Algebra, Functions & Data Analysis
 WESTMORELAND COUNTY PUBLIC SCHOOLS 2013 2014 Integrated Instructional Pacing Guide and Checklist Algebra, Functions & Data Analysis FIRST QUARTER and SECOND QUARTER (s) ESS Vocabulary A.4 A.5 Equations
Eureka Math. Geometry, Module 4. Student File_B. Contains Exit Ticket, and Assessment Materials
 A Story of Functions Eureka Math Geometry, Module 4 Student File_B Contains Exit Ticket, and Assessment Materials Published by the non-profit Great Minds. Copyright 2015 Great Minds. No part of this work
Curriculum Connections (Fractions): K-8 found at under Planning Supports
: K-8 found at under Planning Supports") Curriculum Connections (Fractions): K-8 found at http://www.edugains.ca/newsite/digitalpapers/fractions/resources.html under Planning Supports Kindergarten Grade 1 Grade 2 Grade 3 Grade 4 Grade 5 Grade
Curriculum Connections (Fractions): K-8 found at http://www.edugains.ca/newsite/digitalpapers/fractions/resources.html under Planning Supports Kindergarten Grade 1 Grade 2 Grade 3 Grade 4 Grade 5 Grade
Algebra. Chapter 4: FUNCTIONS. Name: Teacher: Pd:
 Algebra Chapter 4: FUNCTIONS Name: Teacher: Pd: Table of Contents Day1: Chapter 4-1: Relations SWBAT: (1) Identify the domain and range of relations and functions (2) Match simple graphs with situations
Further Maths Notes. Common Mistakes. Read the bold words in the exam! Always check data entry. Write equations in terms of variables
 Further Maths Notes Common Mistakes Read the bold words in the exam! Always check data entry Remember to interpret data with the multipliers specified (e.g. in thousands) Write equations in terms of variables
REVIEW FOR THE FIRST SEMESTER EXAM
 Algebra II Honors @ Name Period Date REVIEW FOR THE FIRST SEMESTER EXAM You must NEATLY show ALL of your work ON SEPARATE PAPER in order to receive full credit! All graphs must be done on GRAPH PAPER!
7 Fractions. Number Sense and Numeration Measurement Geometry and Spatial Sense Patterning and Algebra Data Management and Probability
 7 Fractions GRADE 7 FRACTIONS continue to develop proficiency by using fractions in mental strategies and in selecting and justifying use; develop proficiency in adding and subtracting simple fractions;
Year 10 General Mathematics Unit 2
 Year 11 General Maths Year 10 General Mathematics Unit 2 Bivariate Data Chapter 4 Chapter Four 1 st Edition 2 nd Edition 2013 4A 1, 2, 3, 4, 6, 7, 8, 9, 10, 11 1, 2, 3, 4, 6, 7, 8, 9, 10, 11 2F (FM) 1,
Areas and Paper Folding
 Year 7, Years 8 and 9, Years 0 to (Geometry (extension) and Calculus (extension)) Between 45 and 90 minutes, depending on the number of modules chosen. This activity seeks the triangle of largest area
2. In which of the following diagrams is one shape the reflection of the other in the mirror line shown? Make a correct diagram for those that are
 2. In which of the following diagrams is one shape the reflection of the other in the mirror line shown? Make a correct diagram for those that are not correct. 70 Worksheet 4 1. Use a coordinate grid to
Exploring Quadratic Graphs
 Exploring Quadratic Graphs The general quadratic function is y=ax 2 +bx+c It has one of two basic graphs shapes, as shown below: It is a symmetrical "U"-shape or "hump"-shape, depending on the sign of
Year 9: Long term plan
 Year 9: Long term plan Year 9: Long term plan Unit Hours Powerful procedures 7 Round and round 4 How to become an expert equation solver 6 Why scatter? 6 The construction site 7 Thinking proportionally
DOWNLOAD PDF BIG IDEAS MATH VERTICAL SHRINK OF A PARABOLA
 Chapter 1 : BioMath: Transformation of Graphs Use the results in part (a) to identify the vertex of the parabola. c. Find a vertical line on your graph paper so that when you fold the paper, the left portion
Eureka Math. Grade 7, Module 6. Student File_A. Contains copy-ready classwork and homework
 A Story of Ratios Eureka Math Grade 7, Module 6 Student File_A Contains copy-ready classwork and homework Published by the non-profit Great Minds. Copyright 2015 Great Minds. No part of this work may be
Quadratic Functions Date: Per:
 Math 2 Unit 10 Worksheet 1 Name: Quadratic Functions Date: Per: [1-3] Using the equations and the graphs from section B of the NOTES, fill out the table below. Equation Min or Max? Vertex Domain Range
Ohio Tutorials are designed specifically for the Ohio Learning Standards to prepare students for the Ohio State Tests and end-ofcourse
 Tutorial Outline Ohio Tutorials are designed specifically for the Ohio Learning Standards to prepare students for the Ohio State Tests and end-ofcourse exams. Math Tutorials offer targeted instruction,
Things to Know for the Algebra I Regents
 Types of Numbers: Real Number: any number you can think of (integers, rational, irrational) Imaginary Number: square root of a negative number Integers: whole numbers (positive, negative, zero) Things
SECONDARY DRAFT SYLLABUS. 2. Representation of functions. 3. Types of functions. 4. Composition of functions (two and three)
") et et et CLASS IX Topic :Set Language et et 1. Describing and representing sets SECONDARY DRAFT SYLLABUS Able to describe a set in Descriptive, Set- builder and roster forms and through Venn diagram. Use
et et et CLASS IX Topic :Set Language et et 1. Describing and representing sets SECONDARY DRAFT SYLLABUS Able to describe a set in Descriptive, Set- builder and roster forms and through Venn diagram. Use
The Course Structure for the MCA Programme
 The Course Structure for the MCA Programme SEMESTER - I MCA 1001 Problem Solving and Program Design with C 3 (3-0-0) MCA 1003 Numerical & Statistical Methods 4 (3-1-0) MCA 1007 Discrete Mathematics 3 (3-0-0)
Geometry I Can Statements I can describe the undefined terms: point, line, and distance along a line in a plane I can describe the undefined terms:
 Geometry I Can Statements I can describe the undefined terms: point, line, and distance along a line in a plane I can describe the undefined terms: point, line, and distance along a line in a plane I can
Voluntary State Curriculum Algebra II
 Algebra II Goal 1: Integration into Broader Knowledge The student will develop, analyze, communicate, and apply models to real-world situations using the language of mathematics and appropriate technology.
Mathematics. Scheme of Work. Year 7. New Mathematics Framework
 Mathematics Scheme of Work Year 7 New Mathematics Framework 1 YEAR 7: Overview of year 7 scheme of work YEAR 7 Topics Assessment Tests Term 1 Algebra 1 Number 1 Geometry and Measures 1 Test 1 Sequences
Quadratic Functions. *These are all examples of polynomial functions.
 Look at: f(x) = 4x-7 f(x) = 3 f(x) = x 2 + 4 Quadratic Functions *These are all examples of polynomial functions. Definition: Let n be a nonnegative integer and let a n, a n 1,..., a 2, a 1, a 0 be real
VW 1LQH :HHNV 7KH VWXGHQW LV H[SHFWHG WR
 PreAP Pre Calculus solve problems from physical situations using trigonometry, including the use of Law of Sines, Law of Cosines, and area formulas and incorporate radian measure where needed.[3e] What
Minnesota Academic Standards for Mathematics 2007
 An Alignment of Minnesota for Mathematics 2007 to the Pearson Integrated High School Mathematics 2014 to Pearson Integrated High School Mathematics Common Core Table of Contents Chapter 1... 1 Chapter
Integrated Math I. IM1.1.3 Understand and use the distributive, associative, and commutative properties.
 Standard 1: Number Sense and Computation Students simplify and compare expressions. They use rational exponents and simplify square roots. IM1.1.1 Compare real number expressions. IM1.1.2 Simplify square
Honors Precalculus: Solving equations and inequalities graphically and algebraically. Page 1
 Solving equations and inequalities graphically and algebraically 1. Plot points on the Cartesian coordinate plane. P.1 2. Represent data graphically using scatter plots, bar graphs, & line graphs. P.1
demonstrate an understanding of the exponent rules of multiplication and division, and apply them to simplify expressions Number Sense and Algebra
 MPM 1D - Grade Nine Academic Mathematics This guide has been organized in alignment with the 2005 Ontario Mathematics Curriculum. Each of the specific curriculum expectations are cross-referenced to the
Topic. Section 4.1 (3, 4)
") Topic.. California Standards: 6.0: Students graph a linear equation and compute the x- and y-intercepts (e.g., graph x + 6y = ). They are also able to sketch the region defined by linear inequality (e.g.,
Topic.. California Standards: 6.0: Students graph a linear equation and compute the x- and y-intercepts (e.g., graph x + 6y = ). They are also able to sketch the region defined by linear inequality (e.g.,
Slide 2 / 222. Algebra II. Quadratic Functions
 Slide 1 / 222 Slide 2 / 222 Algebra II Quadratic Functions 2014-10-14 www.njctl.org Slide 3 / 222 Table of Contents Key Terms Explain Characteristics of Quadratic Functions Combining Transformations (review)
This is called the vertex form of the quadratic equation. To graph the equation
 Name Period Date: Topic: 7-5 Graphing ( ) Essential Question: What is the vertex of a parabola, and what is its axis of symmetry? Standard: F-IF.7a Objective: Graph linear and quadratic functions and show
The Graph of an Equation Graph the following by using a table of values and plotting points.
 Precalculus - Calculus Preparation - Section 1 Graphs and Models Success in math as well as Calculus is to use a multiple perspective -- graphical, analytical, and numerical. Thanks to Rene Descartes we
Quadratic Functions CHAPTER. 1.1 Lots and Projectiles Introduction to Quadratic Functions p. 31
 CHAPTER Quadratic Functions Arches are used to support the weight of walls and ceilings in buildings. Arches were first used in architecture by the Mesopotamians over 4000 years ago. Later, the Romans
Unit 1 Quadratic Functions
 Unit 1 Quadratic Functions This unit extends the study of quadratic functions to include in-depth analysis of general quadratic functions in both the standard form f ( x) = ax + bx + c and in the vertex
Rationale. Instructional Task
 A-E Strand(s): Algebra. Sample Courses: Middle School Course 2, Middle School One-Year Advanced Course, Integrated 3, and Algebra II. Topic/Expectation A.C.1 Elementary functions g. Explain, illustrate
Quadratic Equations. Learning Objectives. Quadratic Function 2. where a, b, and c are real numbers and a 0
 Quadratic Equations Learning Objectives 1. Graph a quadratic function using transformations. Identify the vertex and axis of symmetry of a quadratic function 3. Graph a quadratic function using its vertex,
Robust Linear Regression (Passing- Bablok Median-Slope)
") Chapter 314 Robust Linear Regression (Passing- Bablok Median-Slope) Introduction This procedure performs robust linear regression estimation using the Passing-Bablok (1988) median-slope algorithm. Their
Chapter 314 Robust Linear Regression (Passing- Bablok Median-Slope) Introduction This procedure performs robust linear regression estimation using the Passing-Bablok (1988) median-slope algorithm. Their
Visit MathNation.com or search "Math Nation" in your phone or tablet's app store to watch the videos that go along with this workbook!
 Topic 1: Introduction to Angles - Part 1... 47 Topic 2: Introduction to Angles Part 2... 50 Topic 3: Angle Pairs Part 1... 53 Topic 4: Angle Pairs Part 2... 56 Topic 5: Special Types of Angle Pairs Formed
Quadratic Functions. Chapter Properties of Quadratic Functions... p Investigating Quadratic Functions... p. 6 in Vertex Form: Part 1
 Chapter 3 Quadratic Functions 3. Properties of Quadratic Functions........... p. 1 3.1 Investigating Quadratic Functions........... p. 6 in Vertex Form: Part 1 3.1 Investigating Quadratic Functions...........
Common core standards from Grade 8 Math: General categories/domain:
 Common core standards from Grade 8 Math: General categories/domain: 1. Ratio and Proportional Relationship (5 %) 2. Then Number System (5 %) 3. Expressions and Equations (25%) 4. (25 %) 5. Geometry (20
Planting the Seeds Exploring Cubic Functions
 295 Planting the Seeds Exploring Cubic Functions 4.1 LEARNING GOALS In this lesson, you will: Represent cubic functions using words, tables, equations, and graphs. Interpret the key characteristics of
ALGEBRA II A CURRICULUM OUTLINE
 ALGEBRA II A CURRICULUM OUTLINE 2013-2014 OVERVIEW: 1. Linear Equations and Inequalities 2. Polynomial Expressions and Equations 3. Rational Expressions and Equations 4. Radical Expressions and Equations
Quickstart for Web and Tablet App
 Quickstart for Web and Tablet App What is GeoGebra? Dynamic Mathematic Software in one easy-to-use package For learning and teaching at all levels of education Joins interactive 2D and 3D geometry, algebra,
Counting shapes 1.4.6
 GRADE R_TERM 1 WEEK TOPIC CONTENT CAMI KEYSTROKE CAMI Program Count in ones 1.1.1.1; 1.1.1.2; 1.1.1.3 1.1.1.4 Cami Math Count pictures 1.1.3.1; 1.1.3.2; 1 & 2 Counting 1.1.3.3; 1.1.3.4; Counting in units
Unit 1. Name. Basics of Geometry Part 1. 2 Section 1: Introduction to Geometry Points, Lines and Planes
 Name Period Date Points, lines, and planes are the building blocks of geometry. What is geometry? Unit 1 Basics of Geometry Part 1 Geometry means, and it involves the properties of points, lines, planes
Sequence of Geometry Modules Aligned with the Standards
 Sequence of Geometry Modules Aligned with the Standards Module 1: Congruence, Proof, and Constructions Module 2: Similarity, Proof, and Trigonometry Module 3: Extending to Three Dimensions Module 4: Connecting
1
 Zeros&asymptotes Example 1 In an early version of this activity I began with a sequence of simple examples (parabolas and cubics) working gradually up to the main idea. But now I think the best strategy
1.1 Pearson Modeling and Equation Solving
 Date:. Pearson Modeling and Equation Solving Syllabus Objective:. The student will solve problems using the algebra of functions. Modeling a Function: Numerical (data table) Algebraic (equation) Graphical
Solve problems involving proportional reasoning. Number Sense and Algebra
 MFM 1P - Grade Nine Applied Mathematics This guide has been organized in alignment with the 2005 Ontario Mathematics Curriculum. Each of the specific curriculum expectations are cross-referenced to the
A-SSE.1.1, A-SSE.1.2-
 Putnam County Schools Curriculum Map Algebra 1 2016-2017 Module: 4 Quadratic and Exponential Functions Instructional Window: January 9-February 17 Assessment Window: February 20 March 3 MAFS Standards
Y9 Maths. Summative Assessment 1 hour written assessment based upon modules 1-5 during Autumn 2. Term Cycle 1
 Term Cycle 1 Whole Numbers and Decimals Powers of 10 Rounding Order of operations Multiples, factors, divisibility and prime numbers Prime factors, the HCF and the LCM Ordering decimals Estimating and
Conic Sections. College Algebra
 Conic Sections College Algebra Conic Sections A conic section, or conic, is a shape resulting from intersecting a right circular cone with a plane. The angle at which the plane intersects the cone determines
LASER s Level 2 Maths Course - Summary
 LASER s Level 2 Maths Course - Summary Unit Code Unit Title Credits Level Status SER945 Shape, Space and Measurement 3 2 Mandatory SER946 Collecting, Recording and Analysing Data 3 2 Mandatory SER947 Development
DEPARTMENT - Mathematics. Coding: N Number. A Algebra. G&M Geometry and Measure. S Statistics. P - Probability. R&P Ratio and Proportion
 DEPARTMENT - Mathematics Coding: N Number A Algebra G&M Geometry and Measure S Statistics P - Probability R&P Ratio and Proportion YEAR 7 YEAR 8 N1 Integers A 1 Simplifying G&M1 2D Shapes N2 Decimals S1
Test Name: Chapter 4 Test Prep
 Test Name: Chapter 4 Test Prep 1. Given the following function: g ( x ) = -x + 2 Determine the implied domain of the given function. Express your answer in interval notation. 2. Given the following relation: