Analyzing ICAT Data. Analyzing ICAT Data
|
|
|
- Russell Barber
- 5 years ago
- Views:
Transcription
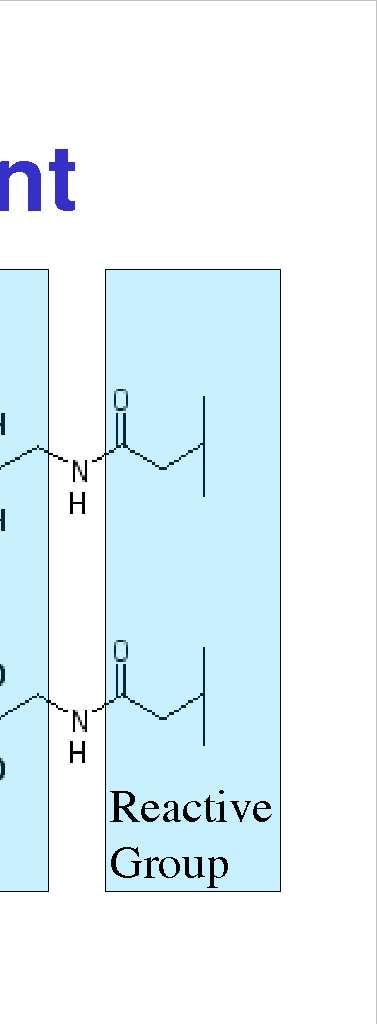
1 Analyzing ICAT Data Gary Van Domselaar University of Alberta Analyzing ICAT Data ICAT: Isotope Coded Affinity Tag Introduced in 1999 by Ruedi Aebersold as a method for quantitative analysis of complex protein mixtures Steven P. Gygi, Beate Rist, Scott A. Gerber, Frantisek Turecek, Michael H. Gelb, Ruedi Aebersold (1999) Nature Biotechnology 17,
2 The Quantitation Problem Mass spec peak intensities do not correlate well with sample amounts for different analytes: Differential ability of peptides to acquire a charge. Relationship between atomic composition and peak intensity is poorly understood. The Quantitation Problem Mass spec peak intensities are quantitative for chemically identical peptides in identical experimental conditions ICAT methodology exploits this fact by isotopically labeling peptide fragments from different cell states

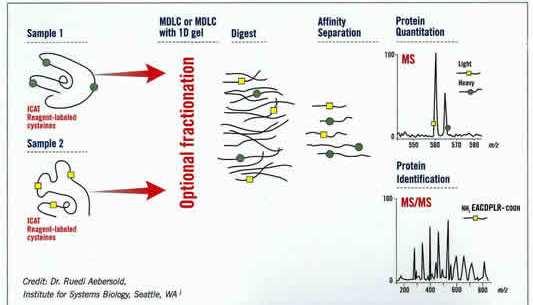
3 The ICAT Strategy
4 Quantitating ICAT Peaks Quantitating ICAT Peaks

5 Identifying ICAT Peaks Identifying ICAT Peaks
6 ICAT Quantitation Software ProICAT ABI SpectrumMill Agilent XPRESS Institute for Systems Biology ASAPRatio Institute for Systems Biology XPRESS and ASAPRatio Work with Peptide Prophet and Protein Prophet ICAT Quantitation Software Sashimi: free open source tools for downstream analysis of mass spectrometric data Glossolalia: a common file format for MS Data XPRESS & ASAPRatio Foor relative quantification of isotopically labeled peptides
7 Goal of ICAT To identify changes in expression How do we know if the changes we see are significant? To correlate the changes with biochemical processes What underlies the changes that we see? ICAT and GeneChip Comparison
8 A Real Example Meehan and Sadar Proteomics 2004, 4, A Real Example Meehan and Sadar Proteomics 2004, 4,
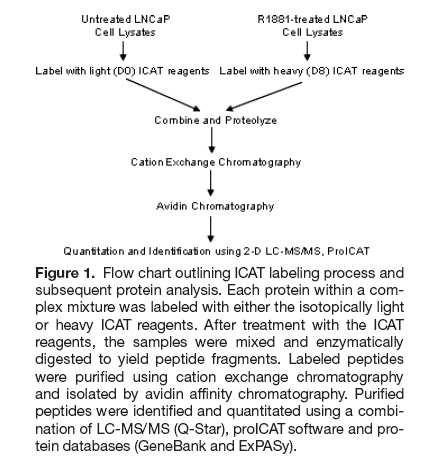
9 A Real Example A Real Example
10 A Real Example Scatter Plots Simplest kind of data plot (data scattered over a two-axis plot) No assumed connectivity (no lines connecting the dots) Challenge is to fit a line or a curve to the raw data to reveal a trend
11 A Scatter Plot Heavy Light Correlation + correlation Uncorrelated - correlation
12 Correlation High correlation Low correlation Perfect correlation Correlation Coefficient r = Σ(x i - µ x )(y i - µ y ) Σ(x i - µ x ) 2 (y i - µ y ) 2 r = 0.85 r = 0.4 r = 1.0
13 Correlation Coefficient Sometimes called coefficient of linear correlation or Pearson product-moment correlation coefficient A quantitative way of determining what model (or equation or type of line) best fits a set of data Commonly used to assess most kinds of predictions or simulations Correlation and Outliers Experimental error or something important? A single bad point can destroy a good correlation
14 Outliers Can be both good and bad When modeling data -- you don t like to see outliers (suggests the model is bad) Often a good indicator of experimental or measurement errors -- only you can know! When plotting ICAT data you do like to see outliers A good indicator of something significant Cross Sectioning a Scatter Plot
15 What kind of point scatter do you see? Gaussian or Normal Distribution Features of a Normal Distribution Symmetric Distribution Has an average or mean value (µ ) at the centre Has a characteristic width called the standard deviation (σ) Most common type of distribution known µ = mean
16 Gaussian Distribution P 2 ( x µ ) 1 2 2σ ( x) = e 2πσ µ - 3 σ µ - 2 σ µ - σ µ µ + σ µ + 2 σ µ + 3 σ Some Equations Mean µ = Σx i N Variance σ 2 = Σ(x i - µ ) 2 N Standard Deviation σ = Σ(x i - µ ) 2 N
17 Standard Deviations (Z-values) µ ± 1.0 S.D > µ S.D µ ± 2.0 S.D > µ S.D µ ± 3.0 S.D > µ S.D µ ± 4.0 S.D > µ S.D µ ± 5.0 S.D > µ S.D P 2 ( x µ ) 1 2 2σ ( x) = e 2πσ µ - 2 σ µ - σ µ µ + σ µ - 3 σ µ + 2 σ µ + 3 σ Significance & Z-values Generally if something is more than 2 SD away from the mean, then it is considered significant (p > 0.95) Sometimes used to detect signals from noise or unusual from normal Gene expression levels that are SD above mean are often considered significant
18 Mean, Median & Mode Mode Median Mean Log Transformation linear scale log 2 scale ICAT heavy intensity exp t A ch1 intensity exp t A ICAT Light intensity
19 Choice of Base is Not Important log10 ln 6 14 exp t A exp t A Why Log2 Transformation? Makes variation of intensities and ratios of intensities more independent of absolute magnitude Makes normalization additive Evens out highly skewed distributions Gives more realistic sense of variation Approximates normal distribution Treats increased and diminished expression equally. 15
20 Log Transformations Applying a log transformation makes the variance and offset more proportionate along the entire graph H L H/L log 2 L Area log 2 H log 2 L log 2 ratio log 2 H area 16 Log Transformations
21 Signal-to-noise Significant? Detecting Clusters Height Weight
22 Is it Right to Calculate a Correlation Coefficient? Height r = 0.73 Weight Or is There More to This? Boy Height Girl Weight
23 Clustering Applications in Bioinformatics 2D Gel or ProteinChip Analysis Microarray or GeneChip Analysis Protein Interaction Analysis Phylogenetic and Evolutionary Analysis Structural Classification of Proteins Protein Sequence Families ICAT :-) Clustering Definition - a process by which objects that are logically similar in characteristics are grouped together. Clustering is different than Classification In classification the objects are assigned to pre-defined classes, in clustering the classes are yet to be defined Clustering helps in classification
24 Clustering Requires... A method to measure similarity (a similarity matrix) or dissimilarity (a dissimilarity coefficient) between objects A threshold value with which to decide whether an object belongs with a cluster A way of measuring the distance between two clusters A cluster seed (an object to begin the clustering process) Clustering Algorithms K-means or Partitioning Methods - divides a set of N objects into M clusters -- with or without overlap Hierarchical Methods - produces a set of nested clusters in which each pair of objects is progressively nested into a larger cluster until only one cluster remains Self-Organizing Feature Maps - produces a cluster set through iterative training
25 K-means or Partitioning Methods Make the first object the centroid for the first cluster For the next object calculate the similarity to each existing centroid If the similarity is greater than a threshold add the object to the existing cluster and redetermine the centroid, else use the object to start new cluster Return to step 2 and repeat until done K-means or Partitioning Methods Initial cluster choose 1 choose 2 test & join centroid= centroid= Rule: λ T = λ centroid + 50 nm -
26 Hierarchical Clustering Find the two closest objects and merge them into a cluster Find and merge the next two closest objects (or an object and a cluster, or two clusters) using some similarity measure and a predefined threshold If more than one cluster remains return to step 2 until finished Hierarchical Clustering Initial cluster pairwise select select compare closest next closest Rule: λ T = λ obs + 50 nm -
27 Hierarchical Clustering A A B A B C B C D E Find 2 most similar protein express levels or curves Find the next closest pair of levels or curves F Iterate Self-Organizing Feature Maps T=0 T=0 T=1day T=20 h T=2days T=3days SvOutPlaceObject


28 Self-Organizing Feature Maps Cluster 1 Cluster 2 Cluster 3 Cluster 4 Cluster 5 Cluster 6 Plot Chip Data Compute Feature Examine Clusters for Map with 6 nodes Biological Meaning SOMs - Details Specify the number of nodes (clusters) desired, and a 2-D geometry for the nodes (rectangular or hexagonal) G1 G2 G3 G6 G4 G5 N1 N2 G7 G9 G8 G10 G11 N = Nodes G = Genes G26 G28 G29 G27 N3 N5 N4 N6 G12 G13 G14 G15 G23 G25 G24 G16 G17 G18 G19 G20 G21 G22
29 SOMs - Details Choose a random protein, e.g., G9 G2 G1 G3 G6 G4 G5 N1 N2 G7 G9 G8 G10 G11 G26 G28 G29 G27 N3 N5 N4 N6 G12 G13 G14 G15 G23 G25 G24 G17 G20 G18 G22 G16 G19 G21 Move the nodes in the direction of G9. The node closest to G9 (N2) is moved the most, and the other nodes are moved by smaller varying amounts. The farther away the node is from N2, the less it is moved. G2 G1 G3 SOMs - Details G6 G4 G5 N1 N2 G7 G9 G8 G10 G11 G26 G28 G29 G27 N3 N5 N4 N6 G12 G13 G14 G15 G23 G25 G24 G17 G20 G18 G22 G16 G19 G21
30 SOMs - Details Repeat the process many (usually several thousand) times choosing different proteins. With each iteration, the amount that the nodes move is decreased. G2 G1 G3 G6 G4 G5 N1 N2 G7 G9 G8 G10 G11 G26 G28 G29 G27 N3 N5 N4 N6 G12 G13 G14 G15 G23 G25 G24 G17 G20 G18 G22 G16 G19 G21 SOMs - Details Finally, each node will nestle among a cluster of genes, and a protein will be considered to be in the cluster if its distance to the node in that cluster is less than its distance to any other node. G1 G6 G2 N1 G4 G3 G5 G7 G8 G9 N2 G10 G11 G26 G27 N3 G28 G29 N5 G23 G25 G24 G12 N4 G13 G14 G15 G16 G17 G18 G19 G20 N6 G21 G22
31 Statistics Software Excel MATLAB Octave SAS SPSS S-PLUS Statistica R Cluster Annotation Once you have your clusters, annotate them and look for patterns that can reveal the underlying process Metabolism: KEGG Roche/Boeringer EcoCyc PathDB
32 Cluster Annotation Interaction Databases BIND DIP MINT PathCalling Cluster Annotation Bibliographic Databases PubMed Medline Science Citation Index Your Local Library Current Contents
33 Cluster Annotation Other SWISSPROT: Curated Expert Annotations Subcellular Localization Genome Ontology
9/29/13. Outline Data mining tasks. Clustering algorithms. Applications of clustering in biology
 9/9/ I9 Introduction to Bioinformatics, Clustering algorithms Yuzhen Ye (yye@indiana.edu) School of Informatics & Computing, IUB Outline Data mining tasks Predictive tasks vs descriptive tasks Example
Gene Clustering & Classification
 BINF, Introduction to Computational Biology Gene Clustering & Classification Young-Rae Cho Associate Professor Department of Computer Science Baylor University Overview Introduction to Gene Clustering
/ Computational Genomics. Normalization
 10-810 /02-710 Computational Genomics Normalization Genes and Gene Expression Technology Display of Expression Information Yeast cell cycle expression Experiments (over time) baseline expression program
Statistical Analysis of Metabolomics Data. Xiuxia Du Department of Bioinformatics & Genomics University of North Carolina at Charlotte
 Statistical Analysis of Metabolomics Data Xiuxia Du Department of Bioinformatics & Genomics University of North Carolina at Charlotte Outline Introduction Data pre-treatment 1. Normalization 2. Centering,
Clustering. Lecture 6, 1/24/03 ECS289A
 Clustering Lecture 6, 1/24/03 What is Clustering? Given n objects, assign them to groups (clusters) based on their similarity Unsupervised Machine Learning Class Discovery Difficult, and maybe ill-posed
Network Traffic Measurements and Analysis
 DEIB - Politecnico di Milano Fall, 2017 Introduction Often, we have only a set of features x = x 1, x 2,, x n, but no associated response y. Therefore we are not interested in prediction nor classification,
Exploratory data analysis for microarrays
 Exploratory data analysis for microarrays Jörg Rahnenführer Computational Biology and Applied Algorithmics Max Planck Institute for Informatics D-66123 Saarbrücken Germany NGFN - Courses in Practical DNA
ECS 234: Data Analysis: Clustering ECS 234
 : Data Analysis: Clustering What is Clustering? Given n objects, assign them to groups (clusters) based on their similarity Unsupervised Machine Learning Class Discovery Difficult, and maybe ill-posed
EECS730: Introduction to Bioinformatics
 EECS730: Introduction to Bioinformatics Lecture 15: Microarray clustering http://compbio.pbworks.com/f/wood2.gif Some slides were adapted from Dr. Shaojie Zhang (University of Central Florida) Microarray
Methodology for spot quality evaluation
 Methodology for spot quality evaluation Semi-automatic pipeline in MAIA The general workflow of the semi-automatic pipeline analysis in MAIA is shown in Figure 1A, Manuscript. In Block 1 raw data, i.e..tif
Further Maths Notes. Common Mistakes. Read the bold words in the exam! Always check data entry. Write equations in terms of variables
 Further Maths Notes Common Mistakes Read the bold words in the exam! Always check data entry Remember to interpret data with the multipliers specified (e.g. in thousands) Write equations in terms of variables
Clustering. RNA-seq: What is it good for? Finding Similarly Expressed Genes. Data... And Lots of It!
 RNA-seq: What is it good for? Clustering High-throughput RNA sequencing experiments (RNA-seq) offer the ability to measure simultaneously the expression level of thousands of genes in a single experiment!
Distances, Clustering! Rafael Irizarry!
 Distances, Clustering! Rafael Irizarry! Heatmaps! Distance! Clustering organizes things that are close into groups! What does it mean for two genes to be close?! What does it mean for two samples to
CLUSTERING IN BIOINFORMATICS
 CLUSTERING IN BIOINFORMATICS CSE/BIMM/BENG 8 MAY 4, 0 OVERVIEW Define the clustering problem Motivation: gene expression and microarrays Types of clustering Clustering algorithms Other applications of
IAT 355 Visual Analytics. Data and Statistical Models. Lyn Bartram
 IAT 355 Visual Analytics Data and Statistical Models Lyn Bartram Exploring data Example: US Census People # of people in group Year # 1850 2000 (every decade) Age # 0 90+ Sex (Gender) # Male, female Marital
Tutorial 2: Analysis of DIA/SWATH data in Skyline
 Tutorial 2: Analysis of DIA/SWATH data in Skyline In this tutorial we will learn how to use Skyline to perform targeted post-acquisition analysis for peptide and inferred protein detection and quantification.
Hard clustering. Each object is assigned to one and only one cluster. Hierarchical clustering is usually hard. Soft (fuzzy) clustering
 clustering") An unsupervised machine learning problem Grouping a set of objects in such a way that objects in the same group (a cluster) are more similar (in some sense or another) to each other than to those in other
An unsupervised machine learning problem Grouping a set of objects in such a way that objects in the same group (a cluster) are more similar (in some sense or another) to each other than to those in other
Cluster Analysis for Microarray Data
 Cluster Analysis for Microarray Data Seventh International Long Oligonucleotide Microarray Workshop Tucson, Arizona January 7-12, 2007 Dan Nettleton IOWA STATE UNIVERSITY 1 Clustering Group objects that
Clustering. Chapter 10 in Introduction to statistical learning
 Clustering Chapter 10 in Introduction to statistical learning 16 14 12 10 8 6 4 2 0 2 4 6 8 10 12 14 1 Clustering ² Clustering is the art of finding groups in data (Kaufman and Rousseeuw, 1990). ² What
Foundations of Machine Learning CentraleSupélec Fall Clustering Chloé-Agathe Azencot
 Foundations of Machine Learning CentraleSupélec Fall 2017 12. Clustering Chloé-Agathe Azencot Centre for Computational Biology, Mines ParisTech chloe-agathe.azencott@mines-paristech.fr Learning objectives
10701 Machine Learning. Clustering
 171 Machine Learning Clustering What is Clustering? Organizing data into clusters such that there is high intra-cluster similarity low inter-cluster similarity Informally, finding natural groupings among
Vocabulary. 5-number summary Rule. Area principle. Bar chart. Boxplot. Categorical data condition. Categorical variable.
 5-number summary 68-95-99.7 Rule Area principle Bar chart Bimodal Boxplot Case Categorical data Categorical variable Center Changing center and spread Conditional distribution Context Contingency table
Clustering and Visualisation of Data
 Clustering and Visualisation of Data Hiroshi Shimodaira January-March 28 Cluster analysis aims to partition a data set into meaningful or useful groups, based on distances between data points. In some
Cluster Analysis. Mu-Chun Su. Department of Computer Science and Information Engineering National Central University 2003/3/11 1
 Cluster Analysis Mu-Chun Su Department of Computer Science and Information Engineering National Central University 2003/3/11 1 Introduction Cluster analysis is the formal study of algorithms and methods
Cluster Analysis. Ying Shen, SSE, Tongji University
 Cluster Analysis Ying Shen, SSE, Tongji University Cluster analysis Cluster analysis groups data objects based only on the attributes in the data. The main objective is that The objects within a group
Comparisons and validation of statistical clustering techniques for microarray gene expression data. Outline. Microarrays.
 Comparisons and validation of statistical clustering techniques for microarray gene expression data Susmita Datta and Somnath Datta Presented by: Jenni Dietrich Assisted by: Jeffrey Kidd and Kristin Wheeler
Automated Bioinformatics Analysis System on Chip ABASOC. version 1.1
 Automated Bioinformatics Analysis System on Chip ABASOC version 1.1 Phillip Winston Miller, Priyam Patel, Daniel L. Johnson, PhD. University of Tennessee Health Science Center Office of Research Molecular
ECLT 5810 Clustering
 ECLT 5810 Clustering What is Cluster Analysis? Cluster: a collection of data objects Similar to one another within the same cluster Dissimilar to the objects in other clusters Cluster analysis Grouping
Contents. ! Data sets. ! Distance and similarity metrics. ! K-means clustering. ! Hierarchical clustering. ! Evaluation of clustering results
 Statistical Analysis of Microarray Data Contents Data sets Distance and similarity metrics K-means clustering Hierarchical clustering Evaluation of clustering results Clustering Jacques van Helden Jacques.van.Helden@ulb.ac.be
ECLT 5810 Data Preprocessing. Prof. Wai Lam
 ECLT 5810 Data Preprocessing Prof. Wai Lam Why Data Preprocessing? Data in the real world is imperfect incomplete: lacking attribute values, lacking certain attributes of interest, or containing only aggregate
Clustering Jacques van Helden
 Statistical Analysis of Microarray Data Clustering Jacques van Helden Jacques.van.Helden@ulb.ac.be Contents Data sets Distance and similarity metrics K-means clustering Hierarchical clustering Evaluation
CHAPTER 2 DESCRIPTIVE STATISTICS
 CHAPTER 2 DESCRIPTIVE STATISTICS 1. Stem-and-Leaf Graphs, Line Graphs, and Bar Graphs The distribution of data is how the data is spread or distributed over the range of the data values. This is one of
Statistics 202: Data Mining. c Jonathan Taylor. Week 8 Based in part on slides from textbook, slides of Susan Holmes. December 2, / 1
 Week 8 Based in part on slides from textbook, slides of Susan Holmes December 2, 2012 1 / 1 Part I Clustering 2 / 1 Clustering Clustering Goal: Finding groups of objects such that the objects in a group
Acquisition Description Exploration Examination Understanding what data is collected. Characterizing properties of data.
 Summary Statistics Acquisition Description Exploration Examination what data is collected Characterizing properties of data. Exploring the data distribution(s). Identifying data quality problems. Selecting
DATA MINING LECTURE 7. Hierarchical Clustering, DBSCAN The EM Algorithm
 DATA MINING LECTURE 7 Hierarchical Clustering, DBSCAN The EM Algorithm CLUSTERING What is a Clustering? In general a grouping of objects such that the objects in a group (cluster) are similar (or related)
Clustering Techniques
 Clustering Techniques Bioinformatics: Issues and Algorithms CSE 308-408 Fall 2007 Lecture 16 Lopresti Fall 2007 Lecture 16-1 - Administrative notes Your final project / paper proposal is due on Friday,
MS data processing. Filtering and correcting data. W4M Core Team. 22/09/2015 v 1.0.0
 MS data processing Filtering and correcting data W4M Core Team 22/09/2015 v 1.0.0 Presentation map 1) Processing the data W4M table format for Galaxy 2) Filters for mass spectrometry extracted data a)
Data Processing and Analysis in Systems Medicine. Milena Kraus Data Management for Digital Health Summer 2017
 Milena Kraus Digital Health Summer Agenda Real-world Use Cases Oncology Nephrology Heart Insufficiency Additional Topics Data Management & Foundations Biology Recap Data Sources Data Formats Business Processes
Hierarchical Clustering
 What is clustering Partitioning of a data set into subsets. A cluster is a group of relatively homogeneous cases or observations Hierarchical Clustering Mikhail Dozmorov Fall 2016 2/61 What is clustering
10601 Machine Learning. Hierarchical clustering. Reading: Bishop: 9-9.2
 161 Machine Learning Hierarchical clustering Reading: Bishop: 9-9.2 Second half: Overview Clustering - Hierarchical, semi-supervised learning Graphical models - Bayesian networks, HMMs, Reasoning under
Descriptive Statistics, Standard Deviation and Standard Error
 AP Biology Calculations: Descriptive Statistics, Standard Deviation and Standard Error SBI4UP The Scientific Method & Experimental Design Scientific method is used to explore observations and answer questions.
MSA220 - Statistical Learning for Big Data
 MSA220 - Statistical Learning for Big Data Lecture 13 Rebecka Jörnsten Mathematical Sciences University of Gothenburg and Chalmers University of Technology Clustering Explorative analysis - finding groups
Tutorial 7: Automated Peak Picking in Skyline
 Tutorial 7: Automated Peak Picking in Skyline Skyline now supports the ability to create custom advanced peak picking and scoring models for both selected reaction monitoring (SRM) and data-independent
ECLT 5810 Clustering
 ECLT 5810 Clustering What is Cluster Analysis? Cluster: a collection of data objects Similar to one another within the same cluster Dissimilar to the objects in other clusters Cluster analysis Grouping
Double Self-Organizing Maps to Cluster Gene Expression Data
 Double Self-Organizing Maps to Cluster Gene Expression Data Dali Wang, Habtom Ressom, Mohamad Musavi, Cristian Domnisoru University of Maine, Department of Electrical & Computer Engineering, Intelligent
Supplementary Figure 1. Decoding results broken down for different ROIs
 Supplementary Figure 1 Decoding results broken down for different ROIs Decoding results for areas V1, V2, V3, and V1 V3 combined. (a) Decoded and presented orientations are strongly correlated in areas
Gene expression & Clustering (Chapter 10)
") Gene expression & Clustering (Chapter 10) Determining gene function Sequence comparison tells us if a gene is similar to another gene, e.g., in a new species Dynamic programming Approximate pattern matching
Gene expression & Clustering (Chapter 10) Determining gene function Sequence comparison tells us if a gene is similar to another gene, e.g., in a new species Dynamic programming Approximate pattern matching
Skyline High Resolution Metabolomics (Draft)
") Skyline High Resolution Metabolomics (Draft) The Skyline Targeted Proteomics Environment provides informative visual displays of the raw mass spectrometer data you import into your Skyline documents. Originally
Skyline High Resolution Metabolomics (Draft) The Skyline Targeted Proteomics Environment provides informative visual displays of the raw mass spectrometer data you import into your Skyline documents. Originally
Region-based Segmentation
 Region-based Segmentation Image Segmentation Group similar components (such as, pixels in an image, image frames in a video) to obtain a compact representation. Applications: Finding tumors, veins, etc.
Prepare a stem-and-leaf graph for the following data. In your final display, you should arrange the leaves for each stem in increasing order.
 Chapter 2 2.1 Descriptive Statistics A stem-and-leaf graph, also called a stemplot, allows for a nice overview of quantitative data without losing information on individual observations. It can be a good
EECS 730 Introduction to Bioinformatics Microarray. Luke Huan Electrical Engineering and Computer Science
 EECS 730 Introduction to Bioinformatics Microarray Luke Huan Electrical Engineering and Computer Science http://people.eecs.ku.edu/~jhuan/ GeneChip 2011/11/29 EECS 730 2 Hybridization to the Chip 2011/11/29
Incorporating Known Pathways into Gene Clustering Algorithms for Genetic Expression Data
 Incorporating Known Pathways into Gene Clustering Algorithms for Genetic Expression Data Ryan Atallah, John Ryan, David Aeschlimann December 14, 2013 Abstract In this project, we study the problem of classifying
Learner Expectations UNIT 1: GRAPICAL AND NUMERIC REPRESENTATIONS OF DATA. Sept. Fathom Lab: Distributions and Best Methods of Display
 CURRICULUM MAP TEMPLATE Priority Standards = Approximately 70% Supporting Standards = Approximately 20% Additional Standards = Approximately 10% HONORS PROBABILITY AND STATISTICS Essential Questions &
Introduction to GE Microarray data analysis Practical Course MolBio 2012
 Introduction to GE Microarray data analysis Practical Course MolBio 2012 Claudia Pommerenke Nov-2012 Transkriptomanalyselabor TAL Microarray and Deep Sequencing Core Facility Göttingen University Medical
Nature Methods: doi: /nmeth Supplementary Figure 1
 Supplementary Figure 1 Schematic representation of the Workflow window in Perseus All data matrices uploaded in the running session of Perseus and all processing steps are displayed in the order of execution.
GS Analysis of Microarray Data
 GS01 0163 Analysis of Microarray Data Keith Baggerly and Bradley Broom Department of Bioinformatics and Computational Biology UT MD Anderson Cancer Center kabagg@mdanderson.org bmbroom@mdanderson.org 19
Clustering analysis of gene expression data
 Clustering analysis of gene expression data Chapter 11 in Jonathan Pevsner, Bioinformatics and Functional Genomics, 3 rd edition (Chapter 9 in 2 nd edition) Human T cell expression data The matrix contains
Unsupervised: no target value to predict
 Clustering Unsupervised: no target value to predict Differences between models/algorithms: Exclusive vs. overlapping Deterministic vs. probabilistic Hierarchical vs. flat Incremental vs. batch learning
IBL and clustering. Relationship of IBL with CBR
 IBL and clustering Distance based methods IBL and knn Clustering Distance based and hierarchical Probability-based Expectation Maximization (EM) Relationship of IBL with CBR + uses previously processed
Motivation. Technical Background
 Handling Outliers through Agglomerative Clustering with Full Model Maximum Likelihood Estimation, with Application to Flow Cytometry Mark Gordon, Justin Li, Kevin Matzen, Bryce Wiedenbeck Motivation Clustering
Data processing. Filters and normalisation. Mélanie Pétéra W4M Core Team 31/05/2017 v 1.0.0
 Data processing Filters and normalisation Mélanie Pétéra W4M Core Team 31/05/2017 v 1.0.0 Presentation map 1) Processing the data W4M table format for Galaxy 2) A generic tool to filter in Galaxy a) Generic
Table of Contents (As covered from textbook)
") Table of Contents (As covered from textbook) Ch 1 Data and Decisions Ch 2 Displaying and Describing Categorical Data Ch 3 Displaying and Describing Quantitative Data Ch 4 Correlation and Linear Regression
Table of Contents (As covered from textbook) Ch 1 Data and Decisions Ch 2 Displaying and Describing Categorical Data Ch 3 Displaying and Describing Quantitative Data Ch 4 Correlation and Linear Regression
An Unsupervised Technique for Statistical Data Analysis Using Data Mining
 International Journal of Information Sciences and Application. ISSN 0974-2255 Volume 5, Number 1 (2013), pp. 11-20 International Research Publication House http://www.irphouse.com An Unsupervised Technique
Introduction to Bioinformatics AS Laboratory Assignment 2
 Introduction to Bioinformatics AS 250.265 Laboratory Assignment 2 Last week, we discussed several high-throughput methods for the analysis of gene expression in cells. Of those methods, microarray technologies
Outlier Detection and Removal Algorithm in K-Means and Hierarchical Clustering
 World Journal of Computer Application and Technology 5(2): 24-29, 2017 DOI: 10.13189/wjcat.2017.050202 http://www.hrpub.org Outlier Detection and Removal Algorithm in K-Means and Hierarchical Clustering
Histograms. h(r k ) = n k. p(r k )= n k /NM. Histogram: number of times intensity level rk appears in the image
 = n k. p(r k )= n k /NM. Histogram: number of times intensity level rk appears in the image") Histograms h(r k ) = n k Histogram: number of times intensity level rk appears in the image p(r k )= n k /NM normalized histogram also a probability of occurence 1 Histogram of Image Intensities Create
Histograms h(r k ) = n k Histogram: number of times intensity level rk appears in the image p(r k )= n k /NM normalized histogram also a probability of occurence 1 Histogram of Image Intensities Create
Cluster Analysis. Angela Montanari and Laura Anderlucci
 Cluster Analysis Angela Montanari and Laura Anderlucci 1 Introduction Clustering a set of n objects into k groups is usually moved by the aim of identifying internally homogenous groups according to a
SYDE Winter 2011 Introduction to Pattern Recognition. Clustering
 SYDE 372 - Winter 2011 Introduction to Pattern Recognition Clustering Alexander Wong Department of Systems Design Engineering University of Waterloo Outline 1 2 3 4 5 All the approaches we have learned
Customer Clustering using RFM analysis
 Customer Clustering using RFM analysis VASILIS AGGELIS WINBANK PIRAEUS BANK Athens GREECE AggelisV@winbank.gr DIMITRIS CHRISTODOULAKIS Computer Engineering and Informatics Department University of Patras
Small Libraries of Protein Fragments through Clustering
 Small Libraries of Protein Fragments through Clustering Varun Ganapathi Department of Computer Science Stanford University June 8, 2005 Abstract When trying to extract information from the information
BIOINF 4399B Computational Proteomics and Metabolomics
 BIOINF 4399B Computational Proteomics and Metabolomics Sven Nahnsen WS 13/14 6. Quantification Part II Overview Label-free quantification Definition of features Feature finding on centroided data Absolute
Supervised vs. Unsupervised Learning
 Clustering Supervised vs. Unsupervised Learning So far we have assumed that the training samples used to design the classifier were labeled by their class membership (supervised learning) We assume now
INF 4300 Classification III Anne Solberg The agenda today:
 INF 4300 Classification III Anne Solberg 28.10.15 The agenda today: More on estimating classifier accuracy Curse of dimensionality and simple feature selection knn-classification K-means clustering 28.10.15
K-means clustering Based in part on slides from textbook, slides of Susan Holmes. December 2, Statistics 202: Data Mining.
 K-means clustering Based in part on slides from textbook, slides of Susan Holmes December 2, 2012 1 / 1 K-means Outline K-means, K-medoids Choosing the number of clusters: Gap test, silhouette plot. Mixture
Using Statistical Techniques to Improve the QC Process of Swell Noise Filtering
 Using Statistical Techniques to Improve the QC Process of Swell Noise Filtering A. Spanos* (Petroleum Geo-Services) & M. Bekara (PGS - Petroleum Geo- Services) SUMMARY The current approach for the quality
How do microarrays work
 Lecture 3 (continued) Alvis Brazma European Bioinformatics Institute How do microarrays work condition mrna cdna hybridise to microarray condition Sample RNA extract labelled acid acid acid nucleic acid
Skyline irt Retention Time Prediction
 Skyline irt Retention Time Prediction Predicting peptide retention time has long been of interest in targeted proteomics. As early as version 0.2, Skyline integrated the SSRCalc hydrophobicity calculator
Giri Narasimhan. CAP 5510: Introduction to Bioinformatics. ECS 254; Phone: x3748
 CAP 5510: Introduction to Bioinformatics Giri Narasimhan ECS 254; Phone: x3748 giri@cis.fiu.edu www.cis.fiu.edu/~giri/teach/bioinfs07.html 3/3/08 CAP5510 1 Gene g Probe 1 Probe 2 Probe N 3/3/08 CAP5510
Visual Representations for Machine Learning
 Visual Representations for Machine Learning Spectral Clustering and Channel Representations Lecture 1 Spectral Clustering: introduction and confusion Michael Felsberg Klas Nordberg The Spectral Clustering
FMA901F: Machine Learning Lecture 3: Linear Models for Regression. Cristian Sminchisescu
 FMA901F: Machine Learning Lecture 3: Linear Models for Regression Cristian Sminchisescu Machine Learning: Frequentist vs. Bayesian In the frequentist setting, we seek a fixed parameter (vector), with value(s)
Superpixel Tracking. The detail of our motion model: The motion (or dynamical) model of our tracker is assumed to be Gaussian distributed:
 model of our tracker is assumed to be Gaussian distributed:") Superpixel Tracking Shu Wang 1, Huchuan Lu 1, Fan Yang 1 abnd Ming-Hsuan Yang 2 1 School of Information and Communication Engineering, University of Technology, China 2 Electrical Engineering and Computer
Superpixel Tracking Shu Wang 1, Huchuan Lu 1, Fan Yang 1 abnd Ming-Hsuan Yang 2 1 School of Information and Communication Engineering, University of Technology, China 2 Electrical Engineering and Computer
Optimal Clustering and Statistical Identification of Defective ICs using I DDQ Testing
 Optimal Clustering and Statistical Identification of Defective ICs using I DDQ Testing A. Rao +, A.P. Jayasumana * and Y.K. Malaiya* *Colorado State University, Fort Collins, CO 8523 + PalmChip Corporation,
Predict Outcomes and Reveal Relationships in Categorical Data
 PASW Categories 18 Specifications Predict Outcomes and Reveal Relationships in Categorical Data Unleash the full potential of your data through predictive analysis, statistical learning, perceptual mapping,
University of Florida CISE department Gator Engineering. Clustering Part 2
 Clustering Part 2 Dr. Sanjay Ranka Professor Computer and Information Science and Engineering University of Florida, Gainesville Partitional Clustering Original Points A Partitional Clustering Hierarchical
COLOCALISATION. Alexia Ferrand. Imaging Core Facility Biozentrum Basel
 COLOCALISATION Alexia Ferrand Imaging Core Facility Biozentrum Basel OUTLINE Introduction How to best prepare your samples for colocalisation How to acquire the images for colocalisation How to analyse
Mascot Insight is a new application designed to help you to organise and manage your Mascot search and quantitation results. Mascot Insight provides
 1 Mascot Insight is a new application designed to help you to organise and manage your Mascot search and quantitation results. Mascot Insight provides ways to flexibly merge your Mascot search and quantitation
Outline. Multivariate analysis: Least-squares linear regression Curve fitting
 DATA ANALYSIS Outline Multivariate analysis: principal component analysis (PCA) visualization of high-dimensional data clustering Least-squares linear regression Curve fitting e.g. for time-course data
Course on Microarray Gene Expression Analysis
 Course on Microarray Gene Expression Analysis ::: Normalization methods and data preprocessing Madrid, April 27th, 2011. Gonzalo Gómez ggomez@cnio.es Bioinformatics Unit CNIO ::: Introduction. The probe-level
CBioVikings. Richard Röttger. Copenhagen February 2 nd, Clustering of Biomedical Data
 CBioVikings Copenhagen February 2 nd, Richard Röttger 1 Who is talking? 2 Resources Go to http://imada.sdu.dk/~roettger/teaching/cbiovikings.php You will find The dataset These slides An overview paper
A Dendrogram. Bioinformatics (Lec 17)
") A Dendrogram 3/15/05 1 Hierarchical Clustering [Johnson, SC, 1967] Given n points in R d, compute the distance between every pair of points While (not done) Pick closest pair of points s i and s j and
A Dendrogram 3/15/05 1 Hierarchical Clustering [Johnson, SC, 1967] Given n points in R d, compute the distance between every pair of points While (not done) Pick closest pair of points s i and s j and
ELEC Dr Reji Mathew Electrical Engineering UNSW
 ELEC 4622 Dr Reji Mathew Electrical Engineering UNSW Review of Motion Modelling and Estimation Introduction to Motion Modelling & Estimation Forward Motion Backward Motion Block Motion Estimation Motion
GLM II. Basic Modeling Strategy CAS Ratemaking and Product Management Seminar by Paul Bailey. March 10, 2015
 GLM II Basic Modeling Strategy 2015 CAS Ratemaking and Product Management Seminar by Paul Bailey March 10, 2015 Building predictive models is a multi-step process Set project goals and review background
SD 372 Pattern Recognition
 SD 372 Pattern Recognition Lab 2: Model Estimation and Discriminant Functions 1 Purpose This lab examines the areas of statistical model estimation and classifier aggregation. Model estimation will be
Introduction to Pattern Recognition Part II. Selim Aksoy Bilkent University Department of Computer Engineering
 Introduction to Pattern Recognition Part II Selim Aksoy Bilkent University Department of Computer Engineering saksoy@cs.bilkent.edu.tr RETINA Pattern Recognition Tutorial, Summer 2005 Overview Statistical
Unsupervised Learning and Clustering
 Unsupervised Learning and Clustering Selim Aksoy Department of Computer Engineering Bilkent University saksoy@cs.bilkent.edu.tr CS 551, Spring 2009 CS 551, Spring 2009 c 2009, Selim Aksoy (Bilkent University)
CHAPTER 2: DESCRIPTIVE STATISTICS Lecture Notes for Introductory Statistics 1. Daphne Skipper, Augusta University (2016)
") CHAPTER 2: DESCRIPTIVE STATISTICS Lecture Notes for Introductory Statistics 1 Daphne Skipper, Augusta University (2016) 1. Stem-and-Leaf Graphs, Line Graphs, and Bar Graphs The distribution of data is
CHAPTER 2: DESCRIPTIVE STATISTICS Lecture Notes for Introductory Statistics 1 Daphne Skipper, Augusta University (2016) 1. Stem-and-Leaf Graphs, Line Graphs, and Bar Graphs The distribution of data is
Chapter 3 - Displaying and Summarizing Quantitative Data
 Chapter 3 - Displaying and Summarizing Quantitative Data 3.1 Graphs for Quantitative Data (LABEL GRAPHS) August 25, 2014 Histogram (p. 44) - Graph that uses bars to represent different frequencies or relative
Exploring Data. This guide describes the facilities in SPM to gain initial insights about a dataset by viewing and generating descriptive statistics.
 This guide describes the facilities in SPM to gain initial insights about a dataset by viewing and generating descriptive statistics. 2018 by Minitab Inc. All rights reserved. Minitab, SPM, SPM Salford
Methods for Intelligent Systems
 Methods for Intelligent Systems Lecture Notes on Clustering (II) Davide Eynard eynard@elet.polimi.it Department of Electronics and Information Politecnico di Milano Davide Eynard - Lecture Notes on Clustering
Clustering CS 550: Machine Learning
 Clustering CS 550: Machine Learning This slide set mainly uses the slides given in the following links: http://www-users.cs.umn.edu/~kumar/dmbook/ch8.pdf http://www-users.cs.umn.edu/~kumar/dmbook/dmslides/chap8_basic_cluster_analysis.pdf