6. Graphs and Networks visualizing relations
|
|
|
- Bernice Patterson
- 6 years ago
- Views:
Transcription
1 6. Graphs and Networks visualizing relations Vorlesung Informationsvisualisierung Prof. Dr. Andreas Butz, WS 2011/12 Konzept und Basis für n: Thorsten Büring 1
2 Outline Graph overview Terminology Networks and trees Data structures Graph drawing Comparison of graph layouts Graph visualization examples Social networks Copurchase network Music network Transportation network Case study: Telephone network visualizations Comparing node-link and matrix representations Interaction and animation 2
3 Graph Overview Graph definition: an abstract structure that is used to model information Can represent any information that can be modeled as objects and connections between those objects Objects represented by vertices Relations between objects represented by edges Commonly visualized as node-link diagrams Example domains World Wide Web Telephone networks Financial transactions Call graph in software engineering CVS repositories Social networks Transportation networks Co-citations Automatically generated airline database schema, Tamassia et al Graphs in InfoVis shall facilitate the understanding of complex patterns 3
4 Challenges in Graph Drawing Graph Visualization (layout and positioning) How to present a graph to convey the most information and to make it easy to read and interpret it Scale Performance of layout algorithms Limited real estate of display area Navigation and Interaction How to enable the user to move around the graph and inspect portions of the graph in detail 4
5 Graphs Terminology Graph consists of Nonempty set of vertices (points) Set of edges that link together the vertices Undirected graph Directed graph (usually indicted by arrows) Mixed graph contains both directed and undirected graphs Unweighted vs. weighted (nominal, ordinal quantitative) edges Degree of a vertex: the number of edges connected to it In-degree and out-degree for directed graphs Adjacency A B C 2 A Two edges sharing a common vertex Two vertices sharing a common edge B 5 12 C 5
6 Graphs Terminology Path: a traversal of consecutive vertices along a sequence of edges Length of the path: number of edges that are traversed along the path Simple path: no repeated vertices within the path Cycle: a path in which the initial vertex of the path is also the terminal vertex of the path Acyclic: a simple directed graph not containing any cycles B A C Directed Graph Cycle 6

7 Special Types of Graphs Network Directed Graph Usually weighted edges No topological restrictions Examples: social, economic, transportation networks Tree No cycles Usually directed edges Usually special designated root vertex Example: organizational chart Will be topic of next lecture! 7
8 Data Structures for Graphs Storing and processing a graph on a computer Adjacency List - usually used for graphs with small numbers of edges Adjacency Matrix - allows powerful matrix operations but is often more memory demanding Row: edges leaving the vertex Column: edges entering the vertex Example for directed graph v3 v1 v2 v4 v1 -> v2 -> v4 v2 -> v3 -> v2 -> v4 v4 -> v2 v1 v2 v3 v4 v v v v
9 Graph Drawing Many ways to draw a graph Vertices are usually represented by circles Edges are usually represented by open curves between vertices Node-link diagram Potential encoding attributes Color Size Form / Shape Labeling is often difficult due to clutter 9


 or curved")


10 Graph Drawing Layout algorithms can be categorized by the type of layout they generate Planar: edges do not intersect Straight, polyline (edge with bends) or curved lines Orthogonal: polyline drawing that maps each edge into a chain of horizontal and vertical segments Images taken from Cruz & Tamassia 10


11 Graph Drawing Grid-based: vertices (and bends of the edges) have integer coordinates implies minimum distance between vertices and nonincident edges Upward / downward drawing for directed acyclic graphs: make edges flow in the same direction, e.g. for visualizing hierarchies Images taken from Cruz & Tamassia 11
12 Layout Aesthetics Minimize crossing keep the number of times that lines cross to a minimum (hardly applicable in interactive systems) Minimize area keep the area that the graph takes up to a minimum by producing a compact graph Minimize the sum of the edge lengths Obtain a uniform edge length try to keep each of the edges at the same lengths Minimize bends keep the number of times there is a bend to a minimum Display symmetry of graph structure Maximize minimum angles between edges 12
13 Empirical Results Purchase 1997 Compare task performance on five pairs of graphs Graph pairs differed according to numbers of edge bends, edge crosses, maximizing the minimum angle, orthogonality and symmetry Result: Reducing crossings is by far most important Ware et al Experimental task: finding the shortest path in spring layout graphs Results indicate the following prioritization of metrics Geometric length of the path (implicit property of a graph) Continuity (keeping multi-edge paths as straight as possible) Number of edge-crossings 13
14 Spring Embedder Force-directed model for graph layout Eades 1984 Intuitive approach: apply physical model of forces Every vertex is considered a steel ring Every edge a spring Resulting layout represents a configuration of minimum energy (force exerted on each ring is 0 ) Can produce well-balanced, symmetrical graphs Problem: time consuming quality of the graph depends on the number of full iterations (visit all pairs of vertices to calculate the effect of the forces) - demo Overview of graph drawing algorithms: Pajntar 2006 ( Open Graph drawing Framework OGDF: Graph drawing tutorial: papers/gd-tutorial/gd-constraints.pdf Spring embedder Java applet + source code lehre/ss04/gd/demo.html 14

15 Various Examples of Graph Drawings 15

16 Social Network Exploring Enron: 16
17 Social Network They rule: 17

18 Social Network? Co-occurrences of names in the new testament: visualizations/89ade5ae1055f a9fb0ac03fd 18

19 Copurchase Network Touch graph: 19

20 Music + Movie Network Liveplasma: Mapping and data source unclear 20

21 Transportation Network 21
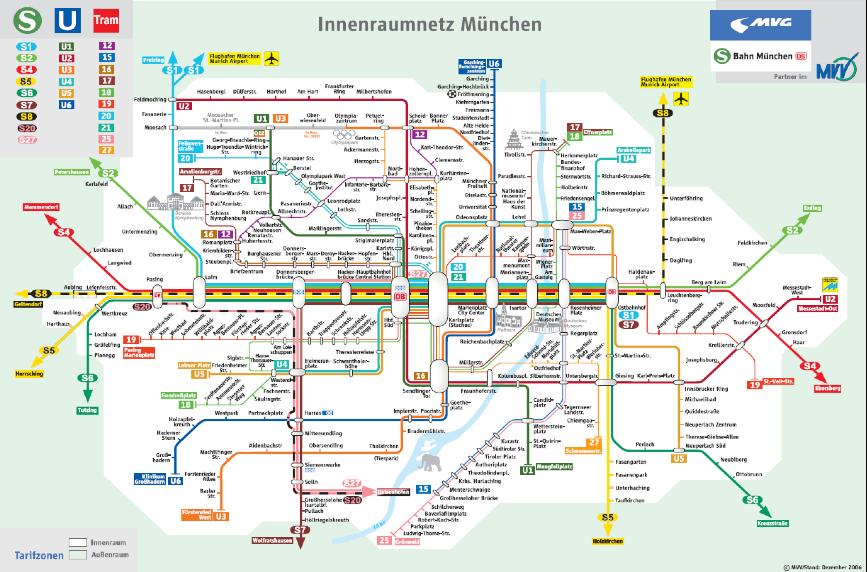
22 Transportation Network 22
 Heavily distorted")

23 Transportation Network Objectives Facilitate understanding of network connections Fit size and aspect ratio constraint (positioned above the doors in the underground ) Heavily distorted geographic positions, but still good readability for identifying shortest paths between stations Despite landmarks such as rivers, more graph than map 23
24 Telephone Network Becker et al AT&T data 110 switches (nearly) completely connected Each vertex has a geographic location Statistics for each vertex, new data every five minutes 12,000 links between switches October 17, 1989 earthquake in San Francisco Bay area Questions related to network capacity and traffic flows Where are the overloads? Which links are carrying the most traffic? Was there network damage? Are there any pockets for underutilized network capacity? Is the overload increasing or decreasing? Are calls into the affected area completing or are they being blocked elsewhere in the network? Different representations: linkmap, nodemap, matrix display 24
25 Linkmap Encoding Switches (vertices) are arranged according to their geographical position Two-tiled edges represent overload of in- and outgoing calls between switches Redundant coding to make the important edges more apparent: color and line-thickness both indicate amount of overload Reduce clutter by omitting edge segments where the overload value is zero 25

26 Linkmap - Oakland Switch 26
27 Linkmap - Oakland Switch Overload into one switch Into Oakland switch from every other node (most heavily from Seattle and Denver) Out of Oakland switch to many switches particularly on the east coast Island in the Atlantic Ocean is a blow-up of NY / New Jersey area (to reduce density of switches) Does work well because the edges hardly overlap What about showing total overload? 27
28 Linkmap - Total Overload Most important links are drawn last Still: display is ineffective because long edges from one coast to another obscure much of the country To reduce clutter: edge may be drawn only part way between the vertices they connect 28

29 Linkmap - Total Overload 29

30 Nodemap Glyph encoding Aggregate overload into and out of each switch Rectangle width: proportional to the square root of the number of incoming calls Rectangle height: proportional to the square root of the number of outgoing calls Area of rectangle proportional to total overload Interpretation: overload of outgoing calls from nodes to northern and southern California Problem with this kind of representation? No clutter, but detailed information about particular links between switches is lost 30
 One switch with outgoing overload to almost every other node (column) Very compact visualization")
31 Matrix Display Omits information about geography Each matrix element is allocated to a directed link (half-line) Each switch is assigned to one row (incoming calls) and one column (outgoing calls) Switches are arranged west-to-east Interpretation Five switches with major incoming overload (rows) One switch with outgoing overload to almost every other node (column) Very compact visualization without clutter Problems with this kind of representation? Inference of the visualization is influenced by the ordering of the rows and columns Intuitiveness and readability when compared to a node-link diagram? 31


32 Node-link versus Matrix Ghoniem et al On-demand highlighting of selected nodes and links 36 participants Tasks to test readability Estimation of number of vertices in the graph Estimation of number of edges Locating most connected node Locate node by label Find link between two specified nodes Finding a common neighbor between two specified nodes Finding a path between two nodes Random undirected graphs of three different sizes (number of vertices) and density (relative number of edges) 32

33 Node-link versus Matrix Independent variables Graph representation Number of vertices Relative number of edges Dependent variables Answer time (results not shown here) Number of correct answers All users were familiar with node-link diagrams, but not with matrices Node-link diagrams seem to be well suited for small graphs but their readability quickly deteriorates with a growing size of the graph and link density Matrix provides a superior readability for large or dense graphs Node-link diagram only clearly superior for find-path task 33

34 Graph Interaction Dynamic visualization & interaction is essential for exploring / navigating graphs Dragging and highlighting of vertices and edges Filtering Zooming & panning Focus+context distortion Animation can support exploration Focus+Context graph - Jankun- Kelly et al

35 interactive graph example: Vizster 35

36 Transitions in Radial Tree Layout Yee et al Radial tree layout: common technique in which the graph is arranged around a focus node Users can change the layout by selecting a different focus node Animated transitions of node translation Objective: keep the transitions easy to follow Animation mechanism Linear interpolation of polar coordinates of the nodes Follows ordering and orientation constraints 36
37 Transitions in Radial Tree Layout 37
38 Additional Sources and Literature recommended reading Nathalie Henry, Jean-Daniel Fekete, and Michael J. McGuffin: NodeTrix: A Hybrid Visualization of Social Networks, InfoVis, Tutorials for graph theory and graph drawing 38
6. Graphs and Networks visualizing relations
 6. Graphs and Networks visualizing relations Vorlesung Informationsvisualisierung Prof. Dr. Andreas Butz, WS 2009/10 Konzept und Basis für n: Thorsten Büring 1 Outline Graph overview Terminology Networks
6. Graphs & Networks. Visualizing relations. Dr. Thorsten Büring, 29. November 2007, Vorlesung Wintersemester 2007/08
 6. Graphs & Networks Visualizing relations Dr. Thorsten Büring, 29. November 2007, Vorlesung Wintersemester 2007/08 Slide 1 / 46 Outline Graph overview Terminology Networks and trees Data structures Graph
Graphs and Networks. CS Information Visualization March 2, 2004 John Stasko
 Graphs and Networks CS 7450 - Information Visualization March 2, 2004 John Stasko Connections Spence s chapter 8 is called Connectivity Connections throughout our lives and the world Circle of friends
Graph/Network Visualization
 Graph/Network Visualization Data model: graph structures (relations, knowledge) and networks. Applications: Telecommunication systems, Internet and WWW, Retailers distribution networks knowledge representation
3. Multidimensional Information Visualization II Concepts for visualizing univariate to hypervariate data
 3. Multidimensional Information Visualization II Concepts for visualizing univariate to hypervariate data Vorlesung Informationsvisualisierung Prof. Dr. Andreas Butz, WS 2009/10 Konzept und Basis für n:
Graphs and Networks 1
 Graphs and Networks 1 CS 4460 Intro. to Information Visualization November 6, 2017 John Stasko Learning Objectives Define network concepts vertex, edge, cycle, degree, direction Describe different node-link
Network Visualization
 Network Visualization Presented by Shahed Introduction Introduction Basic building blocks Node Links (relationship between nodes) Spatial information Network data 3 Introduction http://zeeb.library.cmu.edu:7850/joss/article.html
Network Visualization. Introduction. Introduction. Introduction. Paper List. Paper List. Shahed. Basic building blocks
 Network Visualization Presented by Shahed Basic building blocks Node Links (relationship between nodes) Spatial information Network data 3 http://zeeb.library.cmu.edu:7850/joss/article.html 4 Paper List
Large Scale Information Visualization. Jing Yang Fall Graph Visualization
 Large Scale Information Visualization Jing Yang Fall 2007 1 Graph Visualization 2 1 When? Ask the question: Is there an inherent relation among the data elements to be visualized? If yes -> data: nodes
Trees & Graphs. Nathalie Henry Riche, Microsoft Research
 Trees & Graphs Nathalie Henry Riche, Microsoft Research About Nathalie Henry Riche nath@microsoft.com Researcher @ Microsoft Research since 2009 Today: - Overview of techniques to visualize trees & graphs
Information Visualization. Jing Yang Spring Graph Visualization
 Information Visualization Jing Yang Spring 2007 1 Graph Visualization 2 1 When? Ask the question: Is there an inherent relation among the data elements to be visualized? If yes -> data: nodes relations:
Matrix Representation of Graphs
 Matrix Representation of Graphs Eva Rott Michael Glatzhofer Dominik Mocher Julian Wolf Institute of Interactive Systems and Data Science (ISDS), Graz University of Technology A-8010 Graz, Austria 18 May
Hierarchies and Trees 1 (Node-link) CS Information Visualization November 12, 2012 John Stasko
 CS Information Visualization November 12, 2012 John Stasko") Topic Notes Hierarchies and Trees 1 (Node-link) CS 7450 - Information Visualization November 12, 2012 John Stasko Hierarchies Definition Data repository in which cases are related to subcases Can be thought
Topic Notes Hierarchies and Trees 1 (Node-link) CS 7450 - Information Visualization November 12, 2012 John Stasko Hierarchies Definition Data repository in which cases are related to subcases Can be thought
Graphs and Networks 1
 Topic Notes Graphs and Networks 1 CS 7450 - Information Visualization March 8, 2011 John Stasko Connections Connections throughout our lives and the world Circle of friends Delta s flight plans Model connected
1.2 Graph Drawing Techniques
 1.2 Graph Drawing Techniques Graph drawing is the automated layout of graphs We shall overview a number of graph drawing techniques For general graphs: Force Directed Spring Embedder Barycentre based Multicriteria
Graphs and Networks. CS 4460/ Information Visualization March 24, 2009 John Stasko. Connections throughout our lives and the world
 Graphs and Networks CS 4460/7450 - Information Visualization March 24, 2009 John Stasko Connections Connections throughout our lives and the world Circle of friends Delta s flight plans Model connected
Graphs and Networks 2
 Topic Notes Graphs and Networks 2 CS 7450 - Information Visualization October 23, 2013 John Stasko Review Last time we looked at graph layout aesthetics and algorithms, as well as some example applications
Glyphs. Presentation Overview. What is a Glyph!? Cont. What is a Glyph!? Glyph Fundamentals. Goal of Paper. Presented by Bertrand Low
 Presentation Overview Glyphs Presented by Bertrand Low A Taxonomy of Glyph Placement Strategies for Multidimensional Data Visualization Matthew O. Ward, Information Visualization Journal, Palmgrave,, Volume
Graphs and Networks 1
 Topic Notes Graphs and Networks 1 CS 7450 - Information Visualization November 1, 2011 John Stasko Connections Connections throughout our lives and the world Circle of friends Delta s flight plans Model
Lecturer 2: Spatial Concepts and Data Models
 Lecturer 2: Spatial Concepts and Data Models 2.1 Introduction 2.2 Models of Spatial Information 2.3 Three-Step Database Design 2.4 Extending ER with Spatial Concepts 2.5 Summary Learning Objectives Learning
Interactive, Tree-Based Graph Visualization
 Interactive, Tree-Based Graph Visualization Andy Pavlo March 17, 2006 Abstract We introduce an interactive graph visualization scheme that allows users to explore graphs by viewing them as a sequence of
Hierarchies and Trees 1 (Node-link) CS 4460/ Information Visualization March 10, 2009 John Stasko
 CS 4460/ Information Visualization March 10, 2009 John Stasko") Hierarchies and Trees 1 (Node-link) CS 4460/7450 - Information Visualization March 10, 2009 John Stasko Hierarchies Definition Data repository in which cases are related to subcases Can be thought of as
Hierarchies and Trees 1 (Node-link) CS 4460/7450 - Information Visualization March 10, 2009 John Stasko Hierarchies Definition Data repository in which cases are related to subcases Can be thought of as
Visual Layout of Graph-Like Models
 Visual Layout of Graph-Like Models Tarek Sharbak MhdTarek.Sharbak@uantwerpen.be Abstract The modeling of complex software systems has been growing significantly in the last years, and it is proving to
8. Visual Analytics. Prof. Tulasi Prasad Sariki SCSE, VIT, Chennai
 8. Visual Analytics Prof. Tulasi Prasad Sariki SCSE, VIT, Chennai www.learnersdesk.weebly.com Graphs & Trees Graph Vertex/node with one or more edges connecting it to another node. Cyclic or acyclic Edge
Week 6: Networks, Stories, Vis in the Newsroom
 Week 6: Networks, Stories, Vis in the Newsroom Tamara Munzner Department of Computer Science University of British Columbia JRNL 520H, Special Topics in Contemporary Journalism: Data Visualization Week
Navigating Clustered Graphs
 Navigating Clustered Graphs by Wanchun Li Bachelor Engineering, 1992 A thesis submitted to The School of Information Technologies The University of Sydney for the degree of MASTER OF SCIENCE January, 2005
Übung zur Vorlesung Informationsvisualisierung. Emanuel von Zezschwitz Ludwig-Maximilians-Universität München Wintersemester 2012/2013
 Übung zur Vorlesung Informationsvisualisierung Emanuel von Zezschwitz Ludwig-Maximilians-Universität München Wintersemester 2012/2013 Graphs and Hierarchies Terminology A Graph is an abstract representation
Graph Clarity, Simplification, & Interaction
 Graph Clarity, Simplification, & Interaction http://i.imgur.com/cw19ibr.jpg https://www.reddit.com/r/cablemanagement/ Today Today s Reading: Lombardi Graphs Bezier Curves Today s Reading: Clustering/Hierarchical
11. Presentation Approaches II Dealing with the presentation problem
 11. Presentation Approaches II Dealing with the presentation problem Vorlesung Informationsvisualisierung Prof. Dr. Andreas Butz, WS 2011/12 Konzept und Basis für n: Thorsten Büring 1 Outline Introduction
3. Multidimensional Information Visualization I Concepts for visualizing univariate to hypervariate data
 3. Multidimensional Information Visualization I Concepts for visualizing univariate to hypervariate data Vorlesung Informationsvisualisierung Prof. Dr. Andreas Butz, WS 2011/12 Konzept und Basis für n:
Drawing Problem. Possible properties Minimum number of edge crossings Small area Straight or short edges Good representation of graph structure...
 Graph Drawing Embedding Embedding For a given graph G = (V, E), an embedding (into R 2 ) assigns each vertex a coordinate and each edge a (not necessarily straight) line connecting the corresponding coordinates.
4. Basic Mapping Techniques
 4. Basic Mapping Techniques Mapping from (filtered) data to renderable representation Most important part of visualization Possible visual representations: Position Size Orientation Shape Brightness Color
5. Interaction with Visualizations Dynamic linking, brushing and filtering in Information Visualization displays
 5. Interaction with Visualizations Dynamic linking, brushing and filtering in Information Visualization displays Vorlesung Informationsvisualisierung Prof. Dr. Andreas Butz, WS 20011/12 Konzept und Basis
Network visualization techniques and evaluation
 Network visualization techniques and evaluation The Charlotte Visualization Center University of North Carolina, Charlotte March 15th 2007 Outline 1 Definition and motivation of Infovis 2 3 4 Outline 1
Graphs. Tessema M. Mengistu Department of Computer Science Southern Illinois University Carbondale Room - Faner 3131
 Graphs Tessema M. Mengistu Department of Computer Science Southern Illinois University Carbondale tessema.mengistu@siu.edu Room - Faner 3131 1 Outline Introduction to Graphs Graph Traversals Finding a
Starting guide for using graph layout with JViews Diagrammer
 Starting guide for using graph layout with JViews Diagrammer Question Do you have a starting guide that list those layouts, and describe the main parameters to use them? Answer IBM ILOG JViews Diagrammer
1 Graph Visualization
 A Linear Algebraic Algorithm for Graph Drawing Eric Reckwerdt This paper will give a brief overview of the realm of graph drawing, followed by a linear algebraic approach, ending with an example of our
Data Visualization. Fall 2016
 Data Visualization Fall 2016 Information Visualization Upon now, we dealt with scientific visualization (scivis) Scivisincludes visualization of physical simulations, engineering, medical imaging, Earth
i-vis Information Visualization Research Group
 version 1.0 BILKENT UNIVERSITY i-vis Information Visualization Research Group Chisio User s Guide B I L K E N T I - V I S R E S E A R C H G R O U P Chisio User s Guide i-vis Research Group Computer Engineering
IAT 355 Intro to Visual Analytics Graphs, trees and networks 2. Lyn Bartram
 IAT 355 Intro to Visual Analytics Graphs, trees and networks 2 Lyn Bartram Graphs and Trees: Connected Data Graph Vertex/node with one or more edges connecting it to another node Cyclic or acyclic Edge
EnvSci360 Computer and Analytical Cartography
 EnvSci360 Computer and Analytical Cartography Lecture 5 Working with Type and Labels Key Points Labels are text that locate and identify features on a map Important for readability & communication EnvSci
HOLA: Human-like Orthogonal Network Layout
 HOLA: Human-like Orthogonal Network Layout S. Kieffer, T. Dwyer, K. Marriot, and M. Wybrow Emily Hindalong CPSC 547 Presentation Novermber 17, 2015 1 In a Nutshell... Let s analyze human-drawn networks
Drawing Semi-bipartite Graphs in Anchor+Matrix Style
 2011 15th International Conference on Information Visualisation Drawing Semi-bipartite Graphs in Anchor+Matrix Style Kazuo Misue and Qi Zhou Department of Computer Science, University of Tsukuba Tsukuba,
Project and Production Management Prof. Arun Kanda Department of Mechanical Engineering Indian Institute of Technology, Delhi
 Project and Production Management Prof. Arun Kanda Department of Mechanical Engineering Indian Institute of Technology, Delhi Lecture - 8 Consistency and Redundancy in Project networks In today s lecture
PowerPoint XP Advanced Techniques
 PowerPoint XP Advanced Techniques Tutorial will cover: 1. Statistical Chart (using PowerPoint with Excel) 2. Organization Chart 3. Table 4. Drawing 5. Clip Art 6. Custom Animation 7. Sound and movies 1.
Courtesy of Prof. Shixia University
 Courtesy of Prof. Shixia Liu @Tsinghua University Introduction Node-Link diagrams Space-Filling representation Hybrid methods Hierarchies often represented as trees Directed, acyclic graph Two main representation
2 E6885 Network Science Lecture 4: Network Visualization
 E 6885 Topics in Signal Processing -- Network Science E6885 Network Science Lecture 4: Network Visualization Ching-Yung Lin, Dept. of Electrical Engineering, Columbia University October 3rd, 2011 Course
Graph and Tree Layout
 CS8B :: Nov Graph and Tree Layout Topics Graph and Tree Visualization Tree Layout Graph Layout Jeffrey Heer Stanford University Goals Overview of layout approaches and their strengths and weaknesses Insight
Automatic Layout of State Diagrams
 Automatic Layout of State Diagrams Maxim Korotkov evelopers corp. mkorotkov@evelopers.com Abstract. Consider the problem of automatically generating layouts for state diagrams (statecharts). Such diagrams
Table of Contents (As covered from textbook)
") Table of Contents (As covered from textbook) Ch 1 Data and Decisions Ch 2 Displaying and Describing Categorical Data Ch 3 Displaying and Describing Quantitative Data Ch 4 Correlation and Linear Regression
Table of Contents (As covered from textbook) Ch 1 Data and Decisions Ch 2 Displaying and Describing Categorical Data Ch 3 Displaying and Describing Quantitative Data Ch 4 Correlation and Linear Regression
2D rendering takes a photo of the 2D scene with a virtual camera that selects an axis aligned rectangle from the scene. The photograph is placed into
 2D rendering takes a photo of the 2D scene with a virtual camera that selects an axis aligned rectangle from the scene. The photograph is placed into the viewport of the current application window. A pixel
Information Visualization - Introduction
 Information Visualization - Introduction Institute of Computer Graphics and Algorithms Information Visualization The use of computer-supported, interactive, visual representations of abstract data to amplify
Chapter 4 Determining Cell Size
 Chapter 4 Determining Cell Size Chapter 4 Determining Cell Size The third tutorial is designed to give you a demonstration in using the Cell Size Calculator to obtain the optimal cell size for your circuit
A GENERALIZATION OF THE
 A GENERALIZATION OF THE DIRECTED GRAPH LAYERING PROBLEM Ulf Rüegg, Thorsten Ehlers, Miro Spönemann, and Reinhard von Hanxleden Department of Computer Science Kiel University THE MOTIVATION 1 2 3 PROBLEM
ELGIN ACADEMY Mathematics Department Evaluation Booklet (Main) Name Reg
 Name Reg") ELGIN ACADEMY Mathematics Department Evaluation Booklet (Main) Name Reg CfEM You should be able to use this evaluation booklet to help chart your progress in the Maths department from August in S1 until
ELGIN ACADEMY Mathematics Department Evaluation Booklet (Main) Name Reg CfEM You should be able to use this evaluation booklet to help chart your progress in the Maths department from August in S1 until
Multidimensional Arrays & Graphs. CMSC 420: Lecture 3
 Multidimensional Arrays & Graphs CMSC 420: Lecture 3 Mini-Review Abstract Data Types: List Stack Queue Deque Dictionary Set Implementations: Linked Lists Circularly linked lists Doubly linked lists XOR
Location Intelligence Component
 Location Intelligence Component Version 1.0 for Business Objects XI 3.0 USER GUIDE Information in this document is subject to change without notice and does not represent a commitment on the part of the
Grade 6 Math Circles February 19th/20th. Tessellations
 Faculty of Mathematics Waterloo, Ontario N2L 3G1 Centre for Education in Mathematics and Computing Grade 6 Math Circles February 19th/20th Tessellations Introduction to Tessellations tessellation is a
Schematics in ArcMap Tutorial
 Schematics in ArcMap Tutorial Copyright 1995-2010 Esri All rights reserved. Table of Contents Introducing Schematics in ArcMap Tutorial........................ 3 Exercise 1: Getting familiar with Schematics
Evgeny Maksakov Advantages and disadvantages: Advantages and disadvantages: Advantages and disadvantages: Advantages and disadvantages:
 Today Problems with visualizing high dimensional data Problem Overview Direct Visualization Approaches High dimensionality Visual cluttering Clarity of representation Visualization is time consuming Dimensional
Graph Drawing Contest Report
 Graph Drawing Contest Report Christian A. Duncan 1, Carsten Gutwenger 2,LevNachmanson 3, and Georg Sander 4 1 Louisiana Tech University, Ruston, LA 71272, USA duncan@latech.edu 2 University of Dortmund,
Smarter Balanced Vocabulary (from the SBAC test/item specifications)
") Example: Smarter Balanced Vocabulary (from the SBAC test/item specifications) Notes: Most terms area used in multiple grade levels. You should look at your grade level and all of the previous grade levels.
Example: Smarter Balanced Vocabulary (from the SBAC test/item specifications) Notes: Most terms area used in multiple grade levels. You should look at your grade level and all of the previous grade levels.
ANIMATION FOR EDUCATORS. Professional Development Salary Point Class Presented by Jonathan Mazur, NBCT
 ANIMATION FOR EDUCATORS Professional Development Salary Point Class Presented by Jonathan Mazur, NBCT jonathan.mazur@lausd.net PLANNING YOUR ANIMATION PROJECT Identifying Learning Goals Defining Assessment
Lecture 7 Digitizing. Dr. Zhang Spring, 2017
 Lecture 7 Digitizing Dr. Zhang Spring, 2017 Model of the course Using and making maps Navigating GIS maps Map design Working with spatial data Geoprocessing Spatial data infrastructure Digitizing File
How to draw and create shapes
 Adobe Flash Professional Guide How to draw and create shapes You can add artwork to your Adobe Flash Professional documents in two ways: You can import images or draw original artwork in Flash by using
Frequency Distributions
 Displaying Data Frequency Distributions After collecting data, the first task for a researcher is to organize and summarize the data so that it is possible to get a general overview of the results. Remember,
CIE L*a*b* color model
 CIE L*a*b* color model To further strengthen the correlation between the color model and human perception, we apply the following non-linear transformation: with where (X n,y n,z n ) are the tristimulus
Adobe PageMaker Tutorial
 Tutorial Introduction This tutorial is designed to give you a basic understanding of Adobe PageMaker. The handout is designed for first-time users and will cover a few important basics. PageMaker is a
CS Information Visualization Sep. 2, 2015 John Stasko
 Multivariate Visual Representations 2 CS 7450 - Information Visualization Sep. 2, 2015 John Stasko Recap We examined a number of techniques for projecting >2 variables (modest number of dimensions) down
Calypso Construction Features. Construction Features 1
 Calypso 1 The Construction dropdown menu contains several useful construction features that can be used to compare two other features or perform special calculations. Construction features will show up
Applying the weighted barycentre method to interactive graph visualization
 Applying the weighted barycentre method to interactive graph visualization Peter Eades University of Sydney Thanks for some software: Hooman Reisi Dekhordi Patrick Eades Graphs and Graph Drawings What
Grade 6 Math Circles February 19th/20th
 Faculty of Mathematics Waterloo, Ontario N2L 3G1 Centre for Education in Mathematics and Computing Grade 6 Math Circles February 19th/20th Tessellations Warm-Up What is the sum of all the angles inside
Week 4: Facet. Tamara Munzner Department of Computer Science University of British Columbia
 Week 4: Facet Tamara Munzner Department of Computer Science University of British Columbia JRNL 520M, Special Topics in Contemporary Journalism: Visualization for Journalists Week 4: 6 October 2015 http://www.cs.ubc.ca/~tmm/courses/journ15
Information Visualization. Jing Yang Spring Hierarchy and Tree Visualization
 Information Visualization Jing Yang Spring 2008 1 Hierarchy and Tree Visualization 2 1 Hierarchies Definition An ordering of groups in which larger groups encompass sets of smaller groups. Data repository
This group is dedicated to Modeler tools for Layout s FiberFX hair and fur system. For the Layout interface and controls see FiberFX
 Fiber FX Click here to expand Table of Contents... FiberFX Strand Modeler Global Controls Fiber Tab Guides Tab Random Tab Gravity Tab Tools1 Tab Tools2 Tab Options Tab Strand Tool Strand Maker This group
Graph and Digraph Glossary
 1 of 15 31.1.2004 14:45 Graph and Digraph Glossary A B C D E F G H I-J K L M N O P-Q R S T U V W-Z Acyclic Graph A graph is acyclic if it contains no cycles. Adjacency Matrix A 0-1 square matrix whose
Upward Planar Drawings and Switch-regularity Heuristics
 Journal of Graph Algorithms and Applications http://jgaa.info/ vol. 1, no. 2, pp. 259 285 (26) Upward Planar Drawings and Switch-regularity Heuristics Walter Didimo Dipartimento di Ingegneria Elettronica
7 Fractions. Number Sense and Numeration Measurement Geometry and Spatial Sense Patterning and Algebra Data Management and Probability
 7 Fractions GRADE 7 FRACTIONS continue to develop proficiency by using fractions in mental strategies and in selecting and justifying use; develop proficiency in adding and subtracting simple fractions;
Homework # 2 Due: October 6. Programming Multiprocessors: Parallelism, Communication, and Synchronization
 ECE669: Parallel Computer Architecture Fall 2 Handout #2 Homework # 2 Due: October 6 Programming Multiprocessors: Parallelism, Communication, and Synchronization 1 Introduction When developing multiprocessor
Mapping Common Core State Standard Clusters and. Ohio Grade Level Indicator. Grade 5 Mathematics
 Mapping Common Core State Clusters and Ohio s Grade Level Indicators: Grade 5 Mathematics Operations and Algebraic Thinking: Write and interpret numerical expressions. Operations and Algebraic Thinking:
2. MODELING A MIXING ELBOW (2-D)
") MODELING A MIXING ELBOW (2-D) 2. MODELING A MIXING ELBOW (2-D) In this tutorial, you will use GAMBIT to create the geometry for a mixing elbow and then generate a mesh. The mixing elbow configuration is
MODELING A MIXING ELBOW (2-D) 2. MODELING A MIXING ELBOW (2-D) In this tutorial, you will use GAMBIT to create the geometry for a mixing elbow and then generate a mesh. The mixing elbow configuration is
RINGS : A Technique for Visualizing Large Hierarchies
 RINGS : A Technique for Visualizing Large Hierarchies Soon Tee Teoh and Kwan-Liu Ma Computer Science Department, University of California, Davis {teoh, ma}@cs.ucdavis.edu Abstract. We present RINGS, a
M. Andrea Rodríguez-Tastets. I Semester 2008
 M. -Tastets Universidad de Concepción,Chile andrea@udec.cl I Semester 2008 Outline refers to data with a location on the Earth s surface. Examples Census data Administrative boundaries of a country, state
Data+Dataset Types/Semantics Tasks
 Data+Dataset Types/Semantics Tasks Visualization Michael Sedlmair Reading Munzner, Visualization Analysis and Design : Chapter 2+3 (Why+What+How) Shneiderman, The Eyes Have It: A Task by Data Type Taxonomy
Piping Design. Site Map Preface Getting Started Basic Tasks Advanced Tasks Customizing Workbench Description Index
 Piping Design Site Map Preface Getting Started Basic Tasks Advanced Tasks Customizing Workbench Description Index Dassault Systèmes 1994-2001. All rights reserved. Site Map Piping Design member member
SmartArt Office 2007
 SmartArt Office 2007 This is not an official training handout of the, Davis School District SmartArt... 2 Inserting SmartArt... 2 Entering the Text... 2 Adding a Shape... 2 Deleting a Shape... 2 Adding
Filling Space with Random Line Segments
 Filling Space with Random Line Segments John Shier Abstract. The use of a nonintersecting random search algorithm with objects having zero width ("measure zero") is explored. The line length in the units
4. If you are prompted to enable hardware acceleration to improve performance, click
 Exercise 1a: Creating new points ArcGIS 10 Complexity: Beginner Data Requirement: ArcGIS Tutorial Data Setup About creating new points In this exercise, you will use an aerial photograph to create a new
Finite Element Course ANSYS Mechanical Tutorial Tutorial 4 Plate With a Hole
 Problem Specification Finite Element Course ANSYS Mechanical Tutorial Tutorial 4 Plate With a Hole Consider the classic example of a circular hole in a rectangular plate of constant thickness. The plate
How to create shapes. Drawing basic shapes. Adobe Photoshop Elements 8 guide
 How to create shapes With the shape tools in Adobe Photoshop Elements, you can draw perfect geometric shapes, regardless of your artistic ability or illustration experience. The first step to drawing shapes
MapInfo Location Intelligence Component
 MapInfo Location Intelligence Component version 1.1 for MicroStrategy USER GUIDE Information in this document is subject to change without notice and does not represent a commitment on the part of the
Lecture 7: Depth/Occlusion
 Lecture 7: Depth/Occlusion Information Visualization CPSC 533C, Fall 2006 Tamara Munzner UBC Computer Science 3 October 2006 Readings Covered Ware, Chapter 8: Space Perception and the Display of Data in
1. Start ArcMap by going to the Start menu > All Programs > ArcGIS > ArcMap.
 Learning ArcGIS: Introduction to ArcMap 10.1 The Map Document Feature Manipulation Navigating ArcMap Map Documents, Layers, and Features Shapes, Location, and Attribute Data Symbology Zoom, Pan and Map
Geometric Techniques. Part 1. Example: Scatter Plot. Basic Idea: Scatterplots. Basic Idea. House data: Price and Number of bedrooms
 Part 1 Geometric Techniques Scatterplots, Parallel Coordinates,... Geometric Techniques Basic Idea Visualization of Geometric Transformations and Projections of the Data Scatterplots [Cleveland 1993] Parallel
Radial Coordinate Assignment for Level Graphs
 Radial Coordinate Assignment for Level Graphs Christian Bachmaier, Florian Fischer, and Michael Forster University of Konstanz, 787 Konstanz, Germany christian.bachmaier@uni-konstanz.de Projective Software
Picket Patterns. Overview
 Ornamental Pro 2010 Rail Section and Picket Pattern Drawing Manual Table of Contents Picket Patterns... 1 Overview... 1 Creating a Picket Pattern... 2 Example 1... 2 Vertical Bar Behavior... 2 Example
Subdivision Surfaces. Course Syllabus. Course Syllabus. Modeling. Equivalence of Representations. 3D Object Representations
 Subdivision Surfaces Adam Finkelstein Princeton University COS 426, Spring 2003 Course Syllabus I. Image processing II. Rendering III. Modeling IV. Animation Image Processing (Rusty Coleman, CS426, Fall99)
STUDY AND IMPLEMENTATION OF SOME TREE DRAWING ALGORITHMS A THESIS SUBMITTED TO THE GRADUATE SCHOOL IN PARTIAL FULFILLMENT OF THE REQUIREMENTS
 STUDY AND IMPLEMENTATION OF SOME TREE DRAWING ALGORITHMS A THESIS SUBMITTED TO THE GRADUATE SCHOOL IN PARTIAL FULFILLMENT OF THE REQUIREMENTS FOR THE DEGREE MASTERS OF SCIENCE BY IMAN HUSSEIN DR. JAY BAGGA-
Automatic Drawing for Tokyo Metro Map
 Automatic Drawing for Tokyo Metro Map Masahiro Onda 1, Masaki Moriguchi 2, and Keiko Imai 3 1 Graduate School of Science and Engineering, Chuo University monda@imai-lab.ise.chuo-u.ac.jp 2 Meiji Institute
Sample Chapters. To learn more about this book, visit the detail page at: go.microsoft.com/fwlink/?linkid=192147
 Sample Chapters Copyright 2010 by Online Training Solutions, Inc. All rights reserved. To learn more about this book, visit the detail page at: go.microsoft.com/fwlink/?linkid=192147 Chapter at a Glance