Dedication. This project is dedicated to my family.
|
|
|
- Lesley Armstrong
- 5 years ago
- Views:
Transcription
1 INTERACTIVE SYSTEM DESIGN: AN APPROACH TO DIGITAL ARTS THROUGH KINECT SENSOR PROGRAMMING Ramírez Gómez, Gómez Argenis Curs Director: JESÚS IBÁÑEZ MARTÍNEZ GRAU EN ENGINYERIA DE SISTEMES AUDIOVISUALS Tr e ball d e F i d e G rau
2
3 Dedication This project is dedicated to my family. All this years have turn into an interesting journey of hard work and self-overcoming; you have been the perfect travel mates. Thank you for filling my luggage with love and support, and devote your best wishes to make me find happiness. iii
4
5 Acknowledgements First of all, I would like to express my gratitude to all the Jury members for serving as a evaluators for this dissertation. I would like to thank my supervisor Jesús Ibáñez Martínez for encouraging me in all the bad moments, inspiring me with his enthusiasm and giving me all his attention considering that I was abroad. Thanks to Dr. van de Wetering and his Computer Science colleagues from Technische Universiteit Eindhoven for their useful feedback about my projects ideas in a first testing process. I also want to thank my friend Antonio Lansaque who helped me with his support and suggestions. Special thanks goes to my colleagues Francois Riberi and Alba Magallón who help me during the system testing while developing it. Thanks also to Verónica Moreno for helping me to organize my ideas and making me believe in myself with her advice. I also want to thank all my friends with a special remark to Roger Fonollà and Desiré Sobouti, who I knew no matter the distance, always have and always will be for me. Thanks to Victoria Rey for being always by my side during last four years. This project was developed with the effort of my family and friends, and to them I am especially grateful. I feel so lucky to find encouragement, support and patience from my parents Laura Gómez and Manuel Ramírez, who had to deal with my nerves and stress. Special thanks to my sister, Laura Ramírez, for always being with me, for her help in this project, support and strength. Thanks for being my role model during all this years. Thank to all of them for being by my side during all this years, and make me who I am today. v
6
7 Abstract Emerging interactive experiences have become really demanded by users that need to be part of new applications where experts from different fields work together in order to create a creative system based on Human-Technology Interaction and Digital Arts. Exploring Interaction and creative Visualizations, the need to change the 'programmed' experience into a more improvising one was the system design starting point. From here, the aim of this project was to design and develop an interactive system, which introducing audiovisual processing, interaction and creative graphics has turned into a new user based system. By tracking users position in a certain space and translating this data into flocking systems of particles based on users themselves, this interactive multi-user system wanted to use different technical disciplines in order to develop something new, efficient and with a low cost. The exploration of the application without knowing beforehand what could be done with that, has been the success of this new system, where users could interact with each other and feel that they are absolutely in control of the system by being mapped on it. As a result, not only a new interactive experience has been developed; the system has contributed to introduce new ways to integrate technology in design and fields such as Technologies for the Stage or Digital Arts. Keywords. - Human-Technology Interaction, Visualization, Audiovisual Processing, User Tracking, Flocking, Kinect Sensor, Processing, Interactive System Design, Technologies for the Stage and Digital Arts. vii
8 Resumen La demanda de nuevas experiencias interactivas ha crecido considerablemente por parte de usuarios que necesitan ser parte de nuevas aplicaciones donde expertos de diferentes disciplinas trabajan juntos para crear sistemas creativos basados en Interacción Persona- Maquina y Artes Digitales. Explorando la interacción y la visualización creativa, la necesidad de convertir las experiencias 'programadas' en unas más improvisadas ha sido el puntos de partida del diseño de este sistema. A partir de aquí, el objetivo de este proyecto ha sido la creación de un sistema interactivo que introduciendo procesamiento audiovisual, interacción y el uso de gráficos creativos se ha convertido en un sistema basado en los usuarios. Mediante el seguimiento de la posición de los usuarios en un determinado espacio, y trasladando estos datos a la creación de un sistema de partículas basado en los mismos usuarios, este sistema interactivo multiusuario se ha basado en el uso de diferentes disciplinas técnicas para desarrollar algo nuevo, eficiente y a un bajo coste. La exploración de la aplicación sin saber que esperar de ella de antemano ha sido el gran éxito del sistema, en el cual los usuarios han podido interactuar entre ellos y sentirse con el control del sistema siendo reflejados en el. Finalmente, no sólo se ha creado una nueva aplicación interactiva, el sistema ha contribuido en la introducción de nuevas formas de integrar tecnología en diseño y áreas como las Tecnologías de Escena o las Artes Digitales. Palabras clave.- Interacción Persona-Maquina, Visualización, Procesamiento Audiovisual, Seguimiento de usuarios, Flocking, sensor Kinect, Processing, Diseño Sistema Interactivo, Tecnologías para la Escena y Artes Digitales. viii
9 Preface During all my bachelor's degree many different topics have been studied but I had the feeling that none of them could be used in real life neither be used together. We learned a lot of things but we did not knew how to use them in our career. The need of using everything I have learnt and turn it in a new single application was the starting point of this project idea. I wanted to mix all the gained knowledge in order to demonstrate myself that I know a lot of thing, and all this years have not being a waste of time. I have always had the feeling that all that my bachelor's offers me was not enough, I need more creativity on it, but at the end I needed all the technological skills. At the end, during my last year, thanks to my Erasmus experience, I could follow lots of courses that integrated technology and engineering with creativity, so my inspiration was turned on, and all the years without knowing my place in this field had finally an answer. By developing a self-project idea I ensured my motivation and encourage myself to reach all my goals; this way I could organize all my developments as I wish and integrate all my favorite studied fields in one unique system. It has been hard, but I have enjoyed every single part of this project. ix
10
11 Summary Abstract Preface List of figures Page vii ix xiii 1. DESIGNING AN INTERACTIVE SYSTEM BASED ON USER POSITION Designing a new system User Oriented System The social experiment Goals and Objectives Planning Technical Approach and requirements 4 2. THE KINECT SENSOR Performance Data Acquisition User Detection and User Tracking Position Determination 8 a) Depth 9 b) Width Advanced Data Acquisition 11 a) Onset Detection TRANSLATING DATA TO VISUALIZATION Data from Kinect Position coordinates and Particles position Interactive zone Generating Particles from USER THE PARTICLES AND THE USER Creating particles from users Color Data Subtracting Colors Mapping Colors VISUALIZATION: THE PARTICLES DESIGN Creating particles Shapes and Color Behavior Translating simplicity and complexity into organic system 23 xi
12 6. THE PARTICLE SYSTEM DESIGN Particle System Flocking Particles: Particle System as a group of agents Flocking rules, simulation by Craig Reynolds Adapting Flocking INTERACTION DESIGN System interaction System Interactivity System-Users events Single-User events Multi-User events FROM DESIGN TO IMPLEMENTATION System development User Detection and Tracking Particles (Boid and Flock class) Focusing on User Interaction Audiovisual Display FROM LITERATURE TO A NEW SYSTEM EVALUATION Results and limitations Applications CONCLUSIONS Further Work 47 References 49 ANNEXES 51 I. Project Charter 51 II. Project Plan 55 III. Sensor Overview 59 IV. UML class diagram 61 xii
13 List of figures Figure 1. Page System placed in a room (screen + sensor). When the user pops up, the system reacts 2 Figure 2. System is turned on after user detection, and generates a visualization on the screen in the form of a particles system, that is located in the screen at a position corresponding to the user's position in the room. When the user moves, the particles move and change its features. 2 Figure 3. Kinect structure. Source: Microsoft Kinect for Developers website. 5 Figure 4. Video Data Kinect is able to get using its components through the specific library. The combination of most of the sensors inside Kinect camera provides an efficient user detection and tracking. 5 Figure 5. Figure 6. Figure 7. Figure 8. Kinect outputs from Depth (left) and IR sensors (right). 3D point cloud image obtained through the Kinect sensor library from depth image and IR information processing. 6 User detection through scene analysis. Source: PrimeSense website reference 7 User detection through scene analysis using stereo Algorithm and Segmentation. 7 6 Figure 9. Figure 10. Figure 11. Figure 12. Figure 13. Correspondence between two parallel images scheme (left), depth calculation from disparity scheme (centre) and stereo system with point matches scheme (right). Source: University of Illinois lecture "How the Kinect works". PSI pose, user calibration pose (left) in order to detect all joint from user body in user detection and tracking. Skeleton detection (right). Source: "Making things see" Center of mass detection. Depth image (up left), used to determine the depth distance of the user by evaluating one of the user pixels (up right) in the raw depth data array (down). Depth image perspective depending depth distance xiii
14 Figure 14. New coordinates from the center of the frame with real world distance values, as shown in formulas above. 11 Figure 15. Onset detection. Figure 16. Data Input from Kinect Processing to Particle system creation and updating. 13 Figure 17. Interactive zone determination through Kinect vision limits. Figure 18. Trigonometric manipulation expression to calculate the minimum distance between camera and interactive zone Figure 19. Color segmentation. Source: Reference [8]. Figure 20. Scene image from Kinect. Figure 21. RGB image from Kinect sensor. Figure 22. RGB component processing for color subtracting. Figure 23. General subtraction. Figure 24. Comparison between color subtracting methods. General subtraction (left column) versus Local subtraction (right column) Figure 25. Local subtraction. Figure 26. Previous conception of particles used in the system. Figure 27. Previous visualization. Figure 28. Final conception of particles used in the system with color mapping (left) from user RGB image (right) 22 Figure 29. Agent dynamics. Figure 30. Final conception of particles used in the system with size beating, normal state(left) and beating event (right). 22 Figure 31. Flocking rules: Separation (Up), Alignment (center) and Cohesion (Down) Figure 32. Agent and its neighbors. Figure 33. Separation. Figure 34. Alignment Figure 35. Cohesion xiv
15 Figure 36. Direct Interaction: User position determination controls system data manipulation and Visualization. 29 Figure 37. Creation Event. Particles are born in the corners of the screen and moves towards target position. 30 Figure 38. Going out Event. By user getting closer to any of the edges of the interactive zone, particles cross the edges and travel to user position again as they have been transported. 31 Figure 39. Multi-user system Figure 40. 'LINES' Multi-User interaction examples Figure 41. 'STICKINESS' Multi-User interaction examples. Figure 42. 'ATTRACTION' Multi-User interaction examples. Figure 43. Evolution from 'ATTRACTION' to 'EXPLOSION' Multi-User interactions. Order: top-left, top-right, low-left, low-right Figure 44. Stage platform. 44 xv
16
17 1. DESIGNING AN INTERACTIVE SYSTEM BASED ON USER POSITION 1.1 Designing a new system The faster technology improves, the more difficult it is to surprise users: they usually think that they have already seen every technological improvement that can ever be made. Here new creative applications and emerging experiences using new technologies have an important role by designing and developing new systems. As a result, technologies for the Stage and Digital Arts field are becoming more popular nowadays in society, as well as user-experience systems with user-interactive designs are demanded a lot by people hungry for new technology developments; the aim of this project is to use all these fields in order to explore what kind of applications I can achieve using multimedia processing, Interaction and Data visualization. Whether the user is comfortable with the designed system or not is the starting point where the design of the system starts. One of the main points in the structured design of this project is that it is not necessary for the user to know what he is going to do with the system, this way ensures preconceived expectations and keep us away to bother users with instructions. The main point of this system is to be autonomous, without calibration, only using the dimensions of the interactive area that we want to use (room) as input. To make it more simple, this system only uses the user location, so users are expected to have the most comfortable interaction that can be made, they only have to move. On the other hand, it is very important to consider which will be the project scope, this is why using the cheapest technology possible have been considered, but always maintaining the correct efficiency, good performance and results that we want to get. Nevertheless, User position is not the only kind of interaction that can be used, we can add some complexity to the system analyzing other ways the user can interact. 1.2 User Oriented System As soon as the system is finished, it is important to figure out which is the intended experience that the user is supposed to have, this is why the design of the user experience has to be very accurate in order to achieve all the goals on its development. The system is intended to be placed in a room, where the user has a specific area where he can move. The data visualization system is shown on the wall while the user is interacting with the system. It is not necessary to display the data visualization on the wall as long as it can be also placed on the ground. 1
18 For better understanding of the system, the user interaction with the system is explained in the Figures 1 and 2. Figure 1.- System placed in a room (screen + sensor). When the user pops up, the system reacts As you can see, the system is placed in a room, then when de user gets in, the system detects him and starts the data processing in order to generate a proper visualization, and begins to transform and translate user interaction. Therefore, the system is supposed to detect the user and calculate certain parameters that will determine how the visualization system works, in fact, how a particle system is created and changes by updating it. The most important data that the user gives the system is his position in the room, so calculating his distance from the sensor, we are able to locate him in the system and determine how the amount of particles will be. Therefore, when the user moves around the room, the particles do the same, maintaining the correspondences between user position in the room and their position in the visualization screen. Figure 2.- System is turned on after user detection, and generates a visualization on the screen in the form of a particles system, that is located in the screen at a position corresponding to the user's position in the room. When the user moves, the particles move and change its features. 1.3 The social experiment The main goal of this system developments is experimenting interaction between the system and users, but what if the experiment is extended to interaction between users too? The social experiment, hence, consists on letting users to interact with each other so as to increase interest in the system. At the beginning multi-user configuration was not intended to be implemented in the system, however plenty interactivity is strongly desired, and social behavior between different users cannot be avoided. 2
19 Humans are social by nature, will then interact with each other if they had the possibility in this system? Let's find out. 1.4 Goals and Objectives By interpreting human interaction in a certain zone, the purpose of this project is to process the information gained by a sensor of the user location in order to display an attractive visualization of the data it gets, mixing different fields in technology and engineering. Choosing the best sensor for data acquisition is the first step that must be considered depending on which kind of data we need or what are the processes that will be applied to it in order to fulfill the main goal, in that case, user position determination while moving. For instance, concerning image processing, user detection and tracking are very useful for this system so as to guarantee a correct approximation of the exact position in the room. Therefore, the most important data we have to process is a reliable user detection and user tracking in order to make the system work efficiently, but without a big scope; so choosing the correct sensor is not only a matter of a good performance, it is also important to consider how can we take profit of the sensor. Audiovisual processing has to be well performed in order to guarantee good data acquisition and different visualization events creation, whether they are interactive or not. Designing a good interactive experience will also be an important issue to be discussed during the whole project development. Establishing the final user we can also design which kind of interaction we want to program. In that project, for example, designing a system for Digital Arts will be the main goal. Furthermore, if we want to make this system attractive, data visualization will help to guarantee the artistic and creative part of the project, and an appealing experience to the user. Then, the creation of an attractive system is very important to achieve the main goal; from now on, creating a particle system that will behave in a certain way depending on users position and interaction with other users, that is really attractive to them, and can be validated as a project involved in Digital Arts and Human Technology Interaction. Interaction should be simple and attractive. If several interactive events are placed in the system, transition between them have to be smooth enough to maintain balance across all visualization events. 3
20 1.5 Planning Goals and Objectives will be what determines the completion of our work but in every project development process, a certain planning has to be done while designing it in order to guarantee that all milestones and deadlines are reached. Sometimes goals and milestones change while you are working, this is why a good planning is always required beforehand. The document that contains all the information regarding objectives, planning and further is the Project Charter (see ANNEX I), where all the information concerning the development of this project was reflected before starting planning it. Nevertheless, a few changes on original project idea have been done during planning and execution, so new ideas and parts of the project can be modified in order to control and trace that all results reached were planned and would help to achieve main goals and objectives. You can read Project Plan in ANNEX II to get a deeper insight of current project planning. 1.6 Technical Approach and requirements Translating the user interaction and the data acquisition from the sensor seems easy if we do not take into account the multiple image processing steps that have to be taken, for instance, user detection and tracking. Nonetheless, if we do not relate this image processing to a visualization system and user interaction, the system won't succeed in the fields it is determined for; in other words, all approaches through all these fields are necessary in the development of a design like the one this project is trying to achieve. However, we are missing one of the most important parts, how do we get all the information? Data acquisition is the starting point once the design of a system is done; then having made the decision to develop a certain application, the kind of information desired to get is already clear and the only decision that is left behind is the choice about which sensor we are going to use. During planning, several different acquisition systems have been considered, but only one was feasible to make a good performance. As long as the aim of this project is developing a system able to detect and track a user easily in order to transform this data into a certain visualization, in the planning process, different sensors were studied (see ANNEX III), but only Kinect sensor was able to simply perform those task and provide further information about the scene. 4

21 2. THE KINECT SENSOR 2.1 Performance Kinect is a motion sensing device developed by Microsoft for the Xbox 360 video game console, though it is also recently developed for apps development for Windows. The device contain a wide range of sensors that are useful as input in image processing processes, such as an Infrared emitter or IR camera, a color sensor or RGB camera and the IR Depth Sensor or Depth camera. It also has a Tilt Motor, an Accelerometer and 4 microphones, as you can see in Figure 3. Figure 3.- Kinect structure. Source: Microsoft Kinect for Developers website. Due to the current release of Kinect drivers for developers, different kind of Kinect sensor have been coming out, each one with different features. This project has been developed with Kinect for Xbox sensor, which can capture frames of 640 per 480 pixels with a frame rate of 30 fps. Moreover, its depth range is between 0.8 meters up to 7.5 meters; and the vision angle is 57º for width and 43º for height. Additionally, its tilt motor can be placed between an angle of ±27º. Furthermore, devices with varying performance exist, working with different results in human detection and tracking processes. More information about resulting limitations will be discussed later. See Figure 4 to get a better understanding of the data that the Kinect sensor actually gets, and the processes that can be performed with it and are more interesting for this design. [1] Figure 4.- Video Data Kinect is able to get using its components through the specific library. The combination of most of the sensors inside Kinect camera provides an efficient user detection and tracking. 5

. Figure 5.- Kinect outputs from Depth (left) and IR sensors (right).")

22 2.2 Data Acquisition In terms of Image Processing, Kinect sensor is a high level tool that provides us with many useful information to be used in the system design. Once we know how we want to use the sensor, it is time to check whether the output information that it give is useful or not for our system inputs. For instance, a depth image and an IR image. By using the information that it gets from the different sensors (as seen in Figure 4) we can easily have access to a Depth image and an IR image as well as the RGB image that will be helpful to enable user detection and tracking (see Figure 5). Figure 5.- Kinect outputs from Depth (left) and IR sensors (right). Both images may be used with the Kinect library in order to obtain not only the user position in the frame, also it can give us a 3D point cloud image (Figure 6), or even get the user pixels in each frame. Such information is what the library used to perform user detection and user tracking. [2] In fact, are those image processing processes what we want to use in this system in order to determine our visualization system. Figure 6.- 3D point cloud image obtained through the Kinect sensor library from depth image and IR information processing. 2.3 User Detection and User Tracking Kinect sensor drivers are provided by PrimeSense whether the access to the information that the sensor give the computer is obtained by using the Kinect's library for Processing (our programming environment), Simple-OpenNI. [3] 6
, is processed to obtain the depth image (see Figure 7).")

23 Once all the data is ready to be processed, Simple-OpenNI is able to analyze the scene so as to identify the user and differentiate him from the background. This scene is projected by invisible IR light, and all together with the data captured by the RGB camera (CMOS sensor), is processed to obtain the depth image (see Figure 7). Nonetheless, there are strong computer vision calculations during the processes that allow the system to locate the different user correspondences and perform the user tracking. Figure 7.- User detection through scene analysis. Source: PrimeSense website reference By reading the data from the sensor, depth image is obtained by calculating correspondences between the different images the Kinect gets through its cameras. After segmentation, different depth values are set apart in distinct depth levels in order to differentiate the user from the background (see Figure 8), then tracking can be done. Figure 8.- User detection through scene analysis using stereo Algorithm and Segmentation. The strong Image Processing and Computer Vision processes happen while calculating the results from Figure 8; it consists on the calculation of the matches between points from both images in order to calculate the depth from disparity (See Figure 9). Figure 9.- Correspondence between two parallel images scheme (left), depth calculation from disparity scheme (centre) and stereo system with point matches scheme (right). Source: University of Illinois lecture "How the Kinect works". [further information about those processes can be found following the references in this report] 7

 in order to detect all joint from user body in user detection and tracking.")

24 Further information about calculating the correspondences between the matches from the different input images in the system has been discussed in the literature used as a reference to develop this project. [4] In terms of user tracking, Kinect library offers different options depending whether we want to use the skeleton information or not. Calibrating the system turns into a must if we want to perform skeleton tracking, this way we will obtain information about all skeleton joint position of the user body, but we will need to ask the intended user to make the known as PSI pose, see Figure 10. Figure 10.- PSI pose, user calibration pose (left) in order to detect all joint from user body in user detection and tracking. Skeleton detection (right). Source: "Making things see" - by O'Reilly. [5] [Further information about calibration can be found in reference] If our intention is only to track the user, as it does in this project configuration, we do not want to bother the user by calibrating the pose detection and we want to detect him as soon as he appears into the interactive area in the room where we have placed the system; then, we can use the centre of mass detection. Centre of Mass detection is quicker than skeleton one but is equally efficient, so there is not a huge difference in user tracking performance, only in detection. As you can see in Figure 11, user is detected with an unique joint of his body corresponding to the centre of gravity of himself. This kind of detection also accepts to use a hand tracking method, so we are able to track two different joints from users bodies. Figure 11.- Centre of Mass detection. Having detected the user, then we can start to get user position as one of the first milestones proposed. 2.4 Position Determination The main application is also the origin of the system, being able to determine user coordinates in the scene to know the exact distance in real units where the user is; for that reason, using coordinates in the frame that the Kinect library provide to the system is the starting point. By knowing main Kinect sensor features as its calibration and configuration, we can calculate users position in the room where the visualization display have been placed. 8

25 a) Depth Knowing how far is the user from the sensor is simple as long as Kinect provide us with the scene raw depth data; so by taking into consideration the depth image, and evaluating one of the user pixels inside the depth map we can obtain the exact distance. Depth image is an stereo image calculated by the given data from both Kinect depth sensors, then we have to be sure which pixel we do want to evaluate. As you can see in the following figure, for all the agents in the picture there are double contours caused by the stereo calculation; those black pixels have infinite value. Then, we could find that the pixel that we are evaluating that eventually is really close, we get that is in the infinite. Nevertheless, Kinect sensor library can work with the raw depth data obtained directly from the sensor, but it is place in a one-dimensional array (see Figure 12), then, we have to consider this fact when we implement the final system. Figure 12.- Depth image (up left), used to determine the depth distance of the user by evaluating one of the user pixels (up right) in the raw depth data array (down). To access the data inside raw depth array, is necessary to know which pixel we are evaluating from the user, for instance U x as X user coordinate in the frame, and U y as Y coordinate; then, is simple to know the exact distance, as long as the data we get is in millimeters, and we only have to access to the values from raw depth data. Considering the evaluating pixel as the joint given by the center of mass user detection, let depthmap[ ] be the raw depth array of size (640x480) x 1, then x1 values, due to each row is placed after the previous one. Then we access the corresponding position to get the depth value: 9
26 b) Width The case of width is more complex, we do not previously have a data structure containing the values that we want, but we can calculate it, and to do so we have to convert our user position values into real world distances. It is true that distances are not the same as the user comes closer to the camera, due to the camera view (see Figure 13), this is why for every depth value that the user is on we calculate a different correspondence with width real distances values. Figure 13.- Depth image perspective depending depth distance. In Computer Vision literature can be found [6] [7] that real distances can be calculated from camera configuration values as it follows: where [x, y, z] are the new unit coordinates for [X, Y, Z], F x and F y are Kinect focus distance value, and C x and C y are the centre coordinates of the frame. Considering we know from Computer Vision library references [7] that by default Kinect focus is 525 units and is the same in both axis (F x = F y ), C x is half of the x axis frame size (320), C y is half of y axis frame size (240) and our coordinates while tracking are [x, y, z]; we can calculate the new coordinates [X, Y, Z] such as: where Z is the depth value of the evaluated coordinate, then, our new coordinate system in real world distances is: 10

27 At the end all distances found, are distances from the center of the frame to the evaluated pixel (see Figure 14), so it is constrained by the camera view range to the scene. Figure 14.- New coordinates from the center of the frame with real world distance values, as shown in formulas above. Notwithstanding, is image processing data the only that is interesting in this system? Once we have localize the user that is interacting with it, it is time to start designing interaction, ad this is why, new interaction has to be introduced. 2.5 Advanced Data Acquisition Until this moment only video sensors from Kinect have been used, and is true that the tilt motor can be used to determine the position of the camera depending on the final system configuration, but the audio features of the sensors can be used to add further data to this interactive system. The used Kinect library do not include functions to work with the microphone array, this is why by using drivers from Microsoft Windows Kinect developers for Audio and existing libraries for our programming environment, we can use the power of audio processing to our system. As long as from video the interesting data was where the user was going, in audio it is followed a similar principle, Kinect sensor only hears what is happening, then on noisy events it will get the environment audio information. a) Onset Detection An onset refers to an audio event when the amplitude rises from a low level (valued as zero) to a really higher one (see Figure 15). Then by establishing a threshold you can get information whether the audio peak detected is an onset or not. By scanning ambient sound we can process all the data acquired by the microphones in order to get an onset detector modified as a peak detector that will analyze users sounds while interacting. Figure 15.- Onset detection. 11
28
29 3. TRANSLATING DATA TO VISUALIZATION 3.1 Data from Kinect From previous calculations with Kinect library we have got several inputs to our Visualization system. We are talking about User position, user center of mass, RGB image and a special new feature regarding audio processing to make an onset/beating detection in order to modulate shape sizes. Figure 16.- Data Input from Kinect Processing to Particle system creation and updating. Then, starting with this data, see Figure 16, our Particle systems will be created, and updated in terms of position, color, and distinct behaviors, such as the beating property. 3.2 Position coordinates and Particles position Where are going to be located the particles is the first issue that we are going to discuss. As it has been explained before, the particle system is supposed to move like the user, then we will consider the window of the application in which the particle system can move as a mapping of the floor of the room where the user is moving. Then, here you have why we wanted to calculate the exact position of the user in the room. The particle system position will be the same position of the user in the room, as you can remember from Figure 1 and 2. To translate all the particles to that point we only have to change the coordinates to the current scale, from real distances in the interactive zone in the room to the active window of the application while it is running. In order to perform the transformation of position coordinates the following formula has been used, where P is the value we want to transform from interval [MIN, MAX] to [min, max] one. 13

30 3.3 Interactive zone Only having the user position is not enough to make the system work; it is necessary to determine an area, the interactive zone, where if the user gets in, the system starts to work, and if not, all users detection are ignored. Using this method, we can prevent of Kinect limited detections problems. As you can see in Figure 17, it is important that all the limits of the area fits inside the camera vision, then we have to calculate the minimum distance from the Kinect sensor where our interactive zone fits. To do that we are using simple trigonometric formulas, see Figure 18. Figure 17.- Interactive zone determination through Kinect vision limits. Figure 18.- Trigonometric manipulation expression to calculate the minimum distance between camera and interactive zone. Considering Figure 18, we can determine that the distance we want to discover is b, then: If we want, for instance, an Interactive zone of 2x2 meters, and we know that the angle of Kinect vision is 57º, then we can determine that: Using this results, only when the user is detected inside the interactive zone the visualization system will react. 14

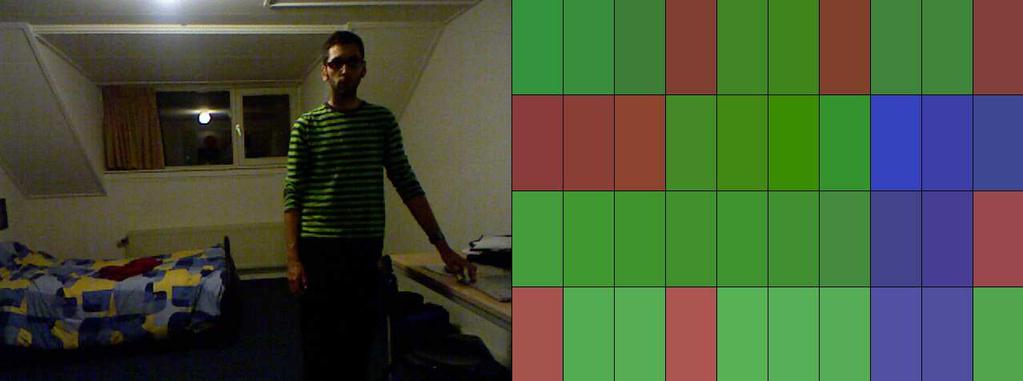
31 3.4 Generating Particles from USER We want to determine with user position the particle system position, but it is not the only thing that this user interaction can modify. We also can say that users who are interacting with any system have a color set; not only because they are wearing clothes of certain colors, it can be also their skin or the reflections of the environment. Then, interesting data such as the called in this project as user colors, is a way of subtracting colors as if a kind of color segmentation is being used. For instance, imagine that we have the following image and its segmentation (Figure 19), by analyzing the segmentation we can say that the picture is blue and green. Figure 19.- Color segmentation. Source: Reference [8]. Then, same kind of subtraction of colors is intended to be done with users for the system visualization. The last feature that the user controls about particle system is the beating effect. While interacting with the system, users make noise, but is when a really noisy event is registered by the sensor and is part of an onset detection that will bump the size of every shape. With this kind of audio processing we are not only using all Kinect features, we are adding a little bit more of interaction to our designed system. 15
32

 into agents colors.")
33 4. THE PARTICLES AND THE USER 4.1 Creating particles from users Interacting is then what users will do with the system, but how is this interaction visualized? The creation of a particle system based on users who are using the system is the triggering interactive event of it. The particle system are a bunch of agents in a form of a ball with certain dynamic (explained in following chapters) that take the color components from the image obtained by Kinect sensor where user appear in order to map user colors (colors that user have in their clothes) into agents colors. With this kind of visualization users are not able to recognize themselves in the particle system, so it cannot be considered as an avatar, is an identity by itself and is the main element in the visualization part of the system. However, before creating the particle system, data acquisition have to be considered. 4.2 Color Data How color from the user is obtained, filtered and selected is the main point to solve before creating the particles. This is why several strategies have been considered. The main problem is recognizing which are the colors from the users and which ones are from the background. Kinect sensor by using segmentation for its human detection and tracking is able to provide us with the scene image, a video string where user is extracted from depth image and submitted into a new frame where the user shape is colored and the background is black (see Figure 20). From the scene image and using the correspondences between all images in the Kinect sensor output, we will be able to know which pixels are intended to store user color pixels. Figure 20.- Scene image from Kinect. Subtracting colors from the RGB image obtained through the sensor camera then is only a matter of correspondences at first, but is color from a video camera totally the same that we perceived? Obviously not, in all frames we can find reflections, diffuse components and saturations, so all data that we access will not have the same value as we perceived; then, this color data need to be processed to get real values, as discussed in references [9]. Figure 21.- RGB image from Kinect sensor. 17


34 For instance, in Figure 21, the walls are kind of white; but, if we check the value of one of those white pixels, we will get that the wall is actually yellow, or some cases with a high red component. This is due to lightning. Although real colors cannot be read, RGB image pixel values can be processed by increasing their brightness to get a more vivid and real color. By calculating the brightness of each pixel and the value of each color component of the pixel in the RGB channel, a weighting factor modifies each pixel value. Being [r, g, b] the color components of a pixel p, and brightness the brightness value of p: where, r' = r fac g' = g fac b' = b fac fac = Being this factor fac the ratio between the maximum brightness and the current one. This way, colors from the image can be improved as we can see in Figure 22, getting bright and more vivid for this project application. 4.3 Subtracting Colors Figure 22.- RGB component processing for color subtracting. Now that colors can be identified, we have to be able to read user colors, then 2 methods have been used for this purpose; general subtraction and local subtraction. It is called subtraction to the process of taking colors from the evaluated image and store them in a data structure in order to be used in a later context. [1] General subtraction : By comparing scene image and RGB image, for every pixel without a black value, the position of this pixel is stored and translated into the RGB image in order to take the RGB correspondence. This way, first subtracted colors are taken from the head, and most of them are skin colors, that processed with the previous method are considered as red colors. Furthermore, lots of reflections are being analyzed as good colors to represent the user, which give us results that are not true, and are not part of the user colors, only the background reflection on him, then this results are not good enough to take them as final results, as you can see in Figure 23. This is why Local subtraction have been considered. Figure 23.- General subtraction. 18


35 Figure 24.- Comparison between color subtracting methods. General subtraction (left column) versus Local subtraction (right column). 19
![[2] Local subtraction : This method also compares scene image with RGB image, in order to ensure that the pixel taken are from the user, but in this case it is used the center of mass user detection.](/docs-images/83/88379713/images/36-1.jpg "Then, by taking the pixel coordinates from the joint tracked, we can translate this coordinate into the RGB image and take the pixel values from the pixels that are around this reference position")
36 [2] Local subtraction : This method also compares scene image with RGB image, in order to ensure that the pixel taken are from the user, but in this case it is used the center of mass user detection. Then, by taking the pixel coordinates from the joint tracked, we can translate this coordinate into the RGB image and take the pixel values from the pixels that are around this reference position (see Figure 25). As seen in the comparison from Figure 24, Local subtraction is exactly the method needed. By taking concrete colors around users clothes, we ensure that the subtracted color will represent Figure 25.- Local subtraction. users colors, and the margin of error is lower than in General subtraction method; even though sometimes the value of an obtained pixel is extremely bright, but this adds to the final visualization system a more vivid and wide range of colors to be used. We can see in the comparison figure how red shirt and green one are perfectly analyzed obtaining really good results, whereas in white t-shirt, as long as it has a plenty wide range of colors in the centre of it, the subtracted colors are quite different, but at least more successfully chosen than in general subtraction. Finally, all the colors stored in the data structures have to be mapped into the shapes that would represent the user presence in the system. 4.4 Mapping Colors Mapping the colors into the visualization system can be considered as a texturing method for the shapes, but as long as all colors have been processed in order to make them more vivid, but always representing the user, it is not necessary to add rendering to the system, and color will only be considered as a shape object attribute. And this shapes are the particles that are part of the visualization particles system. 20


37 5. VISUALIZATION: THE PARTICLES DESIGN 5.1 Creating particles All data acquisition of the system has been done and has been stored in distinct data structures in order to be used in the particles creation. From the user, the system gets users position in the interactive zone, users colors and ambient noise, now it is time for the particles to use this information in order to give values to particles position, shape, color or even behavior. Particles are created as soon as a user is detected in the system, and a different groups of particles are created per each user. By placing a group of shapes in the visualization screen user will be able to see how graphics are created because of him. One of the main reasons for this attribution of ownership is due to the particles position translation from the user position in the room. It is obvious that users have a 3 dimensional coordinates in the space, then, by standing inside the system it takes his coordinates (only x and y) as explained before and uses the real distances between user position and camera view to give the particles a position in the visualization display. Particles will use user position in the screen as if particles were just in the same position of the user in the interactive zone. In other words, screen is the room coordinate mapping, or a visualization of the room activity. Then if there are two users in the room, interacting with the system, two particles system will be in the visualization display. 5.2 Shapes and Color Particles were intended to consist on a bunch of different shapes interacting with each other with a certain behavior, it was intended to be as simple as attractive to the user, as long as it does not represent any avatar, so the user will not be expecting anything from it and there is no risk for the user to be upset. Main conception of the visualization system was to use this kind of variety of shapes to be really appealing to users (see Figure 26 and 27), by using diversity of geometrics with distinct features. Finally, using a random function to create different kind of shapes in 2D and geometrics in 3D was changed to the use of simple circles, but all particles conceptions had a common feature, color. Figure 26.- Previous conception of particles used in the system. Figure 27.- Previous visualization. 21
. 5.3 Behavior Figure 28.")


38 Colors are subtracted from the user as it was explained in previous chapters, then by giving shapes the attribute to be in the stored colors the particles group look in the same colors as the user who is interacting with the system (see Figure 28). 5.3 Behavior Figure 28.- Final conception of particles used in the system with color mapping (left) from user RGB image (right) Once colors have been specified, particles behavior is the most important thing to be considered next. Every shape in the particles group have kinetic or dynamic features that will allow them to move around independently one from the others. By giving each agent a position that is being updated by a velocity vector (see Figure 29), all particles move through the visualization system. In order to keep all the shapes inside the same group orbits and limits were established, but as you will see in following sections this was changed by adding more complex behavior to the system. Figure 29.- Agent dynamics. Moreover, all shapes are created with a random size, but this is subjected to a certain beating modification. By reading the values from Kinect microphones, a peak detection has been used to add an instant change of size when the system hears a strong noise. This new feature add the particles live, by reacting with the environment noise (see Figure 30). Figure 30.- Final conception of particles used in the system with size beating, normal state(left) and beating event (right). 22
39 5.4 Translating simplicity and complexity into organic system Object oriented programming help us to generalize the particle agent by using an Object class that will help to create a group of agents easily as long as all have similar attributes. That procedure during the programming process not only generalized the particle system it also let us use multiple particle systems at the same time, so it was a matter of time that the designed system turns from a simple single user system into a multi-user system, that guaranteed more complex visualization and interactive experience. Nevertheless, after the first conception of the particles, while testing the visualization responses, particles shapes were defined as really straight forms with non smooth movement; then, the system was not really attractive and some fixations were added. In order to give all the agents more organic form an behavior a single geometric is used for all particles. Symmetries from circles give the system an organic semblance and make the movement smoother, but it was the introduction to a flocking particles system which gave elegance and appealing creativity to the visualization system. 23
40

41 6. THE PARTICLE SYSTEM DESIGN 6.1 Particle System All the particles have been told to remain in 'groups', that will be determined by each user who is interacting with the system; so, per user, a bunch of particles is created. From now on, each bunch or group of particles will be called Particles System, that is part of the response the system will give the users as they are interacting with it. A Particles System is created by a group of agents or boids, as seen in literature [10] [11], and will have a particular behavior not only with the user interaction, also with the other agents in the group, allowing us to define them as a flock. 6.2 Flocking Particles: Particle System as a group of agents By using flocking, all particles of this particle System are subjected to a group behavior, they move as a flock with a common direction, similar speed, and without leaving the rest of boids in the group apart. Comparing this Particle System with a common flock (in a real environment), for instance a birds flock, three rules have been determined (Reynolds [12] ), which determine for every agent in the group a preservation of the following three concepts (Figure 31): [1] Separation: Avoidance of collision steering the agent further from the other agents. A separation value based on the distance between each other that will guarantee that none of them collide with the others. [2] Alignment: All agents travel with a similar speed, based on an average speed in the group, that will maintain position inside the group to move as a flock and its direction. [3] Cohesion: Steer to move towards the average position of closest agents, it consists on not being apart from the center of the group, this will guarantee that all agents in a flock follow the same direction as a group, in particular if the target destination changes. Figure 31.- Flocking rules: Separation (Up), Alignment (center) and Cohesion (Down). Defining those three behaviors, mostly seen in nature, Craig Reynolds, defined three rules to meet the standards in a computer simulation of flocking. 25
42 6.3 Flocking rules, simulation by Craig Reynolds In fact Reynolds declared that Flocking was a group behavior of a number of agents with a common objective, so they move together in large numbers towards the same point. The three rules that he introduced are: [1] "Flock Centering": Agents attempt to stay close to the other agents in the group that are close inside a flock neighborhood, so they are 'flockmates', in order to be together as a group. [2] "Obstacle Avoidance": Agents avoid collisions with nearby flockmates and environment obstacles. [3] "Velocity Matching": Agents attempt to match their velocity with the closest mates in order to move with same speed and direction. All those statements establish three different behaviors that each agent will take into account while interacting with other agents in the same group; here we have another definition to understand the concepts of separation, alignment and cohesion, explained before. Using this configuration of behaviors, all flocks are settled as a net; this is why controlling all this features and different characteristics of a flocking system have been studied as lattices and solving them with graph algorithms [10]. Then a group of agents can be considered as a graph G = (V, Ε) where V are a set of vertexes and Ε the edges between the vertexes. Every agent have its dynamics such as: = p = u where, q i is the position of the agent i, p i is its velocity and u i the control input (acceleration). Then a number of spatial neighbors for each agent can be settled by using: Ni = { j є V: qj - qi < r} Figure 32.- Agent and its neighbors. being the interaction range r > 0. Will be this neighborhood where all the flockmates of a single agent are, and where each agent will interact with the others by satisfying flocking rules. Every agent have a position and a velocity that will determine the movement and the dynamics, but it is the acceleration which decides the dynamics behavior and position update. 26
.")
43 Then, acceleration is the control unit of the movement, and following the three flocking rules, can be defined as: where, u = fg + fd + f fg : gradient-based term, position variation. fd : velocity consensus term or damping force. f : navigational feedback due to group objective (migration towards destination). We can consider all those components from the control unit equation as forces that modify agents velocity and position; then they turn acceleration into a steering force. Even though flocking algorithm is quite clear, a few modification have been made to adapts the three rules to the current designed system. 6.4 Adapting Flocking All Flocking rules Reynolds settled for Flocking simulation are quite necessary to maintain the order between all agents, but sometimes a little modification has to be introduced in order to get the desired result. This is why all flocking statements are preserved on their own concept, but the meaning has changed: [1] Separation as 'Excitement' statement : All agents try to maintain the separation between the others in the same flock, avoiding collision, but by introducing the minimum distance as short as the agents size, the system would allow superposition and would create a bouncing effect between all the agents, enhancing the movement softly as an excitement behavior. Then: only if qj - qi < minimum distance, and: Figure 33.-Separation Therefore, all separation force per each agent is based on the addition of the distance between the other flockmates that are closer than the minimum distance, this is why the resultant force is divided by the total of flockmates that are breaking separation rule. [2] Alignment as 'Move alone but stay together' statement : All agents have their own velocity chosen randomly, but this would be changed in order to stay together in the flock. Then by keeping a similar velocity for all agents would be guaranteed that they don't go further than the maximum distance in the flock, hence flockmates always stay together. 27

![[3] Cohesion as 'Follow the common target' statement : it seems that the main point of this flocking system is staying together, but what makes the system relate the user to the particles is that the](/docs-images/83/88379713/images/44-1.jpg "flock moves exactly towards user position. Then by using the translated position of the user as a target direction, all agents will move as a group towards this exact position.")
44 Then: Only if the agents are inside the flock and being: Figure 34.-Alignment Alignment force is hence the average sum of velocities from the other agents which are interacting inside the flock with the evaluated agent. [3] Cohesion as 'Follow the common target' statement : it seems that the main point of this flocking system is staying together, but what makes the system relate the user to the particles is that the flock moves exactly towards user position. Then by using the translated position of the user as a target direction, all agents will move as a group towards this exact position. Then: where tq is the target position, and only if agents are inside the flock and being: Figure 35.-Cohesion That is why cohesion force is the vector force that takes the agents position and leads it to the target position. Furthermore, so as to calculate the resultant force, all the forces are weighted to gain different behaviors between the agents of the flock, then: u = (α fg) + (β fd) + (ω f ) where α, β and ω are the weighting factors per each force; settled in the main configuration of the system as α = 20, β = 1 and ω = 20. Taking Separation and Cohesion as the strongest forces in our system for preserving the excitement of the agents in the flock and the correct tracking of the target position. The steering resultant force then, is calculated from the addition of all three rules; this is the control unit, deduced for every agent in the flock to be added to their own velocity, but it has also to be constrained to a maximum force value and a maximum speed, preventing reaching really high velocities that are out of control. However, all this parameters can be changed just to obtain distinct behaviors for the system. From here, different interactive events have been designed. 28

45 7. INTERACTION DESIGN 7.1. System interaction Interaction is maybe the most important part in this system, this is why different kind of interactive event have been declared. Until now, only general interaction has been declared. Direct interaction (Figure 36) was deduced by determining user position in the system actuator zone, then the basic interaction of moving around for the user was the trigger for the designed system. Data from the user is received and manipulated according to this interaction dependence, and so does the visualization system creation. Figure 36.-Direct Interaction: User position determination controls system data manipulation and Visualization. Although this designed product interaction or system interaction event is the main part of this project, in order to develop a more enjoyable and beautiful interactive experience an indirect interaction has been also design. We will refer to this kind of interaction as the System Interactivity. 7.2 System Interactivity Interaction is what make this system attractive for users. As it has been established in the main purpose for developing this design, all users want to be surprised by the interactive experience, so you have to consider what are they possibly going to do with it, and try to map this behavior into a curious, beautiful and surprising interactive reaction in visualization. Analyzing the system scope, it was clear what users would do with it in a preconceived configuration. They would: [1] Go inside the system actuation interactive zone. [2] Move around to interact with the system on the perceived response of the system on their apparition. [3] Leave the system actuation interactive zone. Then, by being other users using the system at the same time, 29
46 [4] Try to use all the system responses on users apparition to join visualizations. And of course, they will: [5] Try to trick the system. With this analysis, three different interaction events have been considered; System-Users events, Single-User events and Multi-User events. 7.3 System-Users events System-User events are those interactive events designed only by considering the presence of users in the system and their moving activity; so it only refers to interaction 2 in the list above, but can be divided in three different interactive visualizations that have been explained in previous chapters: [1] On apparition : When users start to use the system, the particle system, base on themselves is created. [2] While moving : By changing their position, users update the target position of particles, then this is the dynamics event actuator, and the particle system follows smoothly the target point. [3] Noise : Using Kinect microphones, ambient sound is evaluated; when users voices, background noise or other sounds, reach a peak, the size of articles is changed for an instant. By using this onset detection, the system wants to induce the feeling of particles excitement by using sound. 7.4 Single-User events Single-User events are the interactive events that take place while users are interacting with the system, then it refers to all the interactions that they can do by their own. Events can be divided in two different activities: [1] On creation : (Figure 37) When the particle system is created, it does not appear in the user position mapping instantly, all particles are placed in the corners on the screen and due to their flocking features move towards the target position. This configuration makes the system more organic, letting users think that they are who control the particles system, and not inducing them to feel that they 'ARE' the particle system. Figure 37.-Creation Event. Particles are born in the corners of the screen and moves towards target position. 30

47 All particles are elements by themselves and have an identity, their main feature is following, behave and be like the user, but not being them. By creating this 'being born' event, we can be sure that the system will not create an avatar for user which they can be uncomfortable with. [2] On going out attempt : (Figure 38) When users think that the interactive experience have offered them everything possible for the system, their response for this thought is ending the activity by leaving the interactive zone. This behavior means whether the system have satisfied their expectations or they do not found it interesting nor attractive anymore. Preventing their first attempt to leave the experience, by getting closer to the edges of the interactive zone, particles will be able to transfer their position through the limits to the other side of the screen, and then approaching their position again to users target position. Figure 38.- Going out Event. By user getting closer to any of the edges of the interactive zone, particles cross the edges and travel to user position again as they have been transported. By letting particles break the limits of the visualization, the system wants to catch the user attention again and prevent their departure. The movement of particles thanks to their flocking features is really soft, so the programmed sensation is really attractive. 7.5 Multi-User events Multi-User events take place when more than one user is interacting with the system (Figure 39). Basing this kind of interaction on the distances between users, designed interaction have been divided in four different modules, with nice visualizations that will also try to prevent some activities the user might use to trick the system. Figure 39.- Multi-user system. 31
 Users start to be close enough to start the interaction.")


48 Distances activate all those new events when users are less than 1.5 meters far from each other. Social interaction is the origin of the following events: [1] 'LINES' : (Figure 40) Users start to be close enough to start the interaction. In this first attempt of social interaction lines from one system particle to the other are drawn in order to suggest the user that something happen when you get closer to other user. Figure 40.- 'LINES' Multi-User interaction examples. Every agent position in one system will be one of the endings of the line that goes until the other system agent position in the correspondingly order of agents in the system. For instance, being qi A the position of agent i in system A, and qj B the position of agent j in system B, lines will be drawn between qi A and qj B for i,j only if i = j. Choosing the concept of lines was due to the simplicity of this form as the origin of every shape; any geometric shape is a mixture of lines, then using the simile of line as the beginning of something, for us will be the beginning of the Multi-User interaction. [2] 'STICKINESS' : (Figure 41) Users keep going closer than in the previous mode, then all lines turn into curves using the same position points between agents from both particle systems. Plane surfaces with curved shape are drawn in this visualization. Figure 41.- 'STICKINESS' Multi-User interaction examples. All the particles movement and velocity mixed with the curves generates a perception of stickiness between both particle systems; this fact suggest the user, after experimenting the soft change between 'LINES' and 'STICKINESS' that there are many more things to explore in this social interaction, more visual responses can happen, and users know that if they continue getting closer one to the other. 32
49 Stickiness suggest attraction and curiosity to keep on experimenting with this interactive system. [3] 'ATTRACTION' : (Figure 42) This new visualization comes when users try to be even closer, as in real life and depending on your culture, being really close to a person means intimacy, so if you don't feel comfortable with the other person, tension might increase. That is the starting point of 'ATTRACTION', where separation, alignment and cohesion weights from the flocking features of each particle system are increased in order to steer all the particles into the user position mapping point; and curves are still drawn. Figure 42.- 'ATTRACTION' Multi-User interaction examples. Particles velocity and dynamic properties makes that both systems start to shake a little bit, then you can have the feeling that tension is increasing due to the attraction between both systems and the tentative to get closer is served. However, what if users get too close that Kinect sensor is not able to discriminate one user that the other, then only a single user will be mapped. By reaching this level, user is enjoying the system and wants to see more. This possible problem in interaction is what next step tries to solve. [4] 'EXPLOSION' : The last social interaction module tries to amaze users, they need to forget about being closer and get immersed into the system visualization. Then by doing the last step towards the other user particles get together and suddenly feel an 'explosion' (Figure 43). Figure 43.- Evolution from 'ATTRACTION' to 'EXPLOSION' Multi-User interactions. Order: top-left, top-right, low-left, low-right 33
50 This visualization can prevent Kinect sensor default confusion in joining two different users as a single one by both being too close to each other. Using this unexpected visualization, consisting on increasing velocity and separation in particles system flocking features, the system creates an state of movement grazing chaos but preserving the system elegance. This way, and coming from an evolution of visualization every step more tens and with a small scope, user is left with nothing else but admiration of what is happening. Mixing all those feeling that we can extract from the distinct visualization, is true that the user orientation of the system has been achieved successfully, and there is nothing more than translating the whole design into the final visualization. 34
51 8. FROM DESIGN TO IMPLEMENTATION 8.1 System development Data acquisition and the system design are already done, then only programming the different methods will be the final step in this new system development. The whole system has been programmed using Processing as programming environment, with the use of open Frameworks and the Kinect library Simple-OpenNI, as we have already mentioned. Nevertheless, other libraries, such as Minim library for audio processing in Processing has also been used. Object oriented programming has been used as well in order to guarantee a multiuser system implementation. By creating classes for every single element in the system we simplify all task in the design. A complete UML class diagram of the implemented system is provided in ANNEX IV. The main function of the system is where Kinect sensor develops all its processes in order to get the data acquisition; then it involves the user position determination, Flock initialization and updating of the graphics in the visualization system. All data is sent to the other classes that form the different object in the system, such as User, Boid, Flock, Colors or InteractionFlock. However, how are all the methods implemented? 8.2 User Detection and Tracking In terms of user detection and tracking two method has been discussed, but at the end centre of mass detection was used for the implementation of the designed system. Using this kind of detection we have achieved the goal of detecting the user as soon as he comes into the interactive zone; this way the system is really efficient and fulfill the assigned task. Nonetheless, this kind of tracking also only let us work with the centre of mass, not giving information about all the other user skeleton joints. All detection and tracking in image processing method has been performed by the already given library Simple-OpenNI, so our task was only to get familiar with the data the system give us, and knowing how to control tracking method in order to get the correct user position. Fortunately there are lots of books and online references where we can learn how to use the library [2] [3] [5] [13]. 35
52 With user information a User class has been created to store all the values per each user interacting with the system. Important data is user position and user index reference, which will determine which user is the 'owner' of which particle system. User class is the one that translates user position in Kinect frames to real world distances and then visualization units. 8.3 Particles (Boid and Flock class) We refer to any Agent as a Boid in the Flock or particle system, this way we can preserve notations given in literature [10] [12]. This is then the graphical part, or visualization system of this project. Processing is a useful graphical programming tool, then most of the graphics have been programmed with the graphical functions that this environment provides us with. In terms of data storage, agents have been stored in a java ArrayList object in order to get all the data more dynamically. Then Particles system or Flocks have been stored in a simple array of class Flock. Then we can determine a Flock class object, that will be created every time a user gets into the interactive zone. By giving the Flock objects a concrete number of boids that this flock will have, Flocks are in charge of creating all agents of class Boid and determine which colors from users will be used as boids attributes. For that reason a Colors class have been created in order to store all colors from user in a java ArrayList and maintaining a correlation between shapes and colors. Boid class then is the lower class in the graphical part of the system, but also the one that controls the visualization. Boids have a position and a color, but also a velocity and a force that is determined during flocking, and perform changes in visualization while interacting with other flocks. In fact, is in Boid class where Flocking algorithm is programmed. Per each boid separation, alignment and cohesion are checked towards the rest of boids in the Flock. Is because of this property that all agents have flocking attributes as Boid attributes. It was easy to use this environment for the creation of the Particles system in order to control in a more visual way all the parameters and features that the different shapes have relating them to the user data, this is why complexity in the creation of the shapes has been added; and beautiful results have been achieved. A wide range of books and online reference about processing have been used to get an insight into this environment programming [14] [15] [16] [17] [18]. Values, like the number of agents created or interactive zone size, have been given as static values. 36
53 The system creates particle systems of 40 agents and the interactive system is narrowed in a 2x2 meters zone. Moreover, only a system for two users have been programmed. 8.4 Focusing on User Interaction By adding all the connections between user interaction in the interactive zone and the creation of the particles this system is focusing a little bit on User interaction and social experience. Interaction between user and the system while determining the position of the user and mapping it into the visualization system is determined in Data acquisition and visualization part, whereas interaction between users have an effect in every agent of a particle system, and is programmed inside a InteractionFlock class. InteractionFlock is formed from two different flocks that are interacting in the system and contains all the methods to determine the distance between the center of both flocks and whether there have to be a change in visualization due to the current interaction or not. Then, all modules in multi-user interactive events are placed in this class, but modifications on each flock are done by changing parameters per each boid. Interaction design is a really very documented topic that has been referred in many books and other resources [14] [17] [19]. Last but not least, by making loud noises we are applying a onset or peak detection with sound processing. By using a special driver to get audio data and learning how to use Processing Minim Library [20], audio processing task have been done. This way, different kind of interaction and methods have been programmed inside the system implementation. 8.5 Audiovisual Display Where we are going to display the system takes an important part in the visualization, this is why this designed system can be placed in whichever wall you want, but it is true that user will be part of different experiences depending on the surface it is displayed. The system has been designed to be displayed in the wall, then users will be able to move around the room and only will have to look at the wall they have in front of them (only if they are walking toward the wall where the system is displayed). Nevertheless, a second implementation has been considered. Imagine displaying the visualization in the ground, then users position would be the exact position as particle system, and the interactive experience can be totally different and really enjoyable. 37
54 Of course the final application of the system has to be considered. If we want to use it in an art gallery, as an art project or interactive activity both configuration can be chosen. On the other hand, if the system is being used as a Technologies for the Stage application, is better to use it in the back wall, where audience can see the results of artist movements, for instance dancing steps, clearly. ** Application source code can be found in: *** Either videos about the system or Demos can be found in the following links: [1] [2] [3] 38
55 9. FROM LITERATURE TO A NEW SYSTEM Despite of using several libraries, this system was developed without using a lot of already implemented code. All libraries were only used to get the data, and then the manipulation was implemented while programming all the methods. We can say that the system has been programmed from scratch even though several functions where obtained from certain libraries. By learning through tutorials, books and some online references, programming with libraries, designing the methods and devising some algorithms made the creation of the system feasible. About Simple-OpenNI library for Kinect and Processing, you can find a lot of information on the Internet, this is why this was the chosen programming environment. There is a huge community behind open application development with Kinect sensors and many online references as well as really good books. You can learn through many literature how to use and control data from the library, so it is easy to start from scratch if you want to. O'Reilly book 'Making things see' [5] is a good example if you want to start learning how to program with Kinect; from this book firsts steps with the system code were done. About Minim library, it was interesting to learn how easy onset and beat detections are calculated, even though the library is a little bit bad documented, you have access to official online resources [14] [21] that are very helpful by teaching with some examples. On the other hand you can also find examples related to this libraries in other books [17][18]. Audio processing, and in fact onset detection was something I have worked with in the past, but in this interactive system implementation was only an extra part in order to add some more functionality, so no further documentation has been mentioned. Indeed, audio processing part has been the part with the less time spent. To perform all the methods with Kinect special drivers has been installed. As long as PrimeSense and OpenNI have not developed drivers for Kinect Audio and Processing environment. This driver is provided by the official Kinect developer, Microsoft [21], that recently has given all drivers for free, with a really good documentation. Other libraries have been tried but as long as they did not fulfill the expectations are not mentioned in this report. What image processing is concern, many methods have been used, such as color subtraction or user real position determination. Many references about Computer Vision [6] [7] have been used to figure out how to solve the need of those problems, but in the case of color subtracting it was testing with the frames manipulation what gave a real useful answer. Understanding calibration and applying correspondences between images is not an easy task, but after attending to a 3D vision course, most of the topics were not hard to comprehend; this is why only a few reference about using those methods have been mentioned in this report. 39
56 Furthermore, the programming environment Processing was a tool which I have worked with before, but many books [14][16][17][18] and courses have helped to develop more sophisticated code, as well as the use of non trivial data structures and object-oriented programming configuration of the whole system. Flocking algorithm is one of the most programmed methods that you can find on the Internet, but by studying reports about it [10] and checking official references [12], the algorithm has been programmed also from scratch, but always with some reference code. That way of working with the algorithm has helped to understand widely all the rules in order to be used inside the system. Finally, interaction, user experiences and possible applications in digital arts and many more fields concepts that have been used in the project, are based not only in referenced literature [17] and online resources; also personal creativity, learning activities in creative programming and inspiring creative blogs [19] consultation, are the reason of the interactive system development. Working with the implementation of a new system has involved a exhaustive search of resources, literature and reference about many topics, as long as the project involved many fields of engineering, in order to design all processes before starting to program them. 40
57 10. EVALUATION 10.1 Results and limitations Testing the system helped to find bugs in programmed code, as well as improve some commands and methods that increases product feasibility. Even though many more things can be done, that would improve the system, this final version is reacting quite well and have reached all the milestones settled in planning. By analyzing all parts of the system, I want to analyze which are the results obtained by developing this interactive system, as well as the limitations that I have encountered while designing and implementing it. Many goals were settled and trying to mix several fields in a same project was quite risky, by final results show that it was possible to involve many topics in the same system design. Considering Kinect sensor used for development is second hand and first generation, it was not ignored that many limitations would be found. Comparing to new releases from Microsoft, tracking methods give a good result, but could be better by using a more updated device. It is known that up to four users can be detected, but only two were able to be tracked, this is why the system has been developed only for two users. Moreover, new devices have a wider vision range, feature that our sensor have limited interaction zones, but it has not difficult the system performance. Designing the system while data was acquired made the initial project milestone to be slightly changed several times. At the beginning of the system development, not much information about all topics was clear, then by getting more used to work with all the data, new features were designed. User detection and tracking is a really long issue to discuss; as long as in this system centre of mass user detection has been used we have resigned to the possibility to use user skeleton joints, then wider and interesting ways of interaction have been totally dismissed. Interaction was really limited and further development have been done to add more complexity to the system. Nevertheless we win in efficiency while detecting user, only needing them to go inside the interactive zone and being detected as soon as they appear in it. This instantly detection of the user was one of the system requirement, then the possibility to use calibration to get all the joint was not an option. Center of mass detection also allows us to track a user hand, but after testing this functionality, confusion between both users can be found while using the multi-users mode; then this new feature was dismissed, only using user position to control the interactive system. Position determination algorithm is quite accurate, giving really exact results and measures in real world, but it was not accurate for the preliminary system design, that wanted to calculate distances inside the room. 41
58 The problem was really simple, and so was the solution. We wanted to calculate real distances comparing users position to the room, but at the same time we wanted to generalize those calculations to any room. Then not knowing room dimensions and having a clearly limitation of camera vision range, it was impossible to get the wanted data. Then the Interactive zone was designed. The system is programmed to a certain interactive zone in order to generalize it and make it more feasible to use, it is adapted to camera vision range and can be compared with the real distances measurements obtained; after generalizing also room dimensions, any interactive zone can be used, but always considering sensor limitations; for instance, a really big room might not fit inside Kinect vision. Adding sound to the system was a last minute addition, that was not considered at the beginning the system development, but at the end as long as it was not really difficult to use, and examples found in references were really useful, it was programmed giving the final version of the system new features with good results. While translating data to the visualization system, as soon as we got the user position coordinates thanks to the translation function to map real world distances to visualization screen distances, no problems were found; nor for establishing the interactive zone, where the system would be placed. Nevertheless, working with user colors and achieving good results was really difficult, but testing with some self-created algorithms for pixel treatment the problem was solved with good results at the end, even though it might give some bad results, but dependence in lighting, noise and other influences are quite difficult to skip. Particle system dynamics are quite good. By adding flocking to the particles behavior we have solved previous problems with fluency in particles movement and needs to control frame rate parameters. Then by using this smooth algorithm, visualization system has gained more elegance with more fluent visualization and a better performance. By adapting flocking to the system needs, better results with visualization system kinetics have been obtained. One of the best improvements was changing the particle different shapes configuration into more organic use of circles; new configuration of visualization was perfectly joined with flocking algorithm, color mapping and beating behavior. All agents in the system gained the property of belonging, and correlation between all circles involved all agents as a flock. While using the multi-user system, we can see that it works really well for two users interacting at the same time, and a third and a fourth users can be added, but not more. Nevertheless, when more than two users are using the system, whether because the interactive zone (used for testing) is really small or possible sensor limitations, the designed system does not work properly and one of the user might disappear for a while. 42
59 As long as in the first conception of this project was not plan to detect more than one user, the obtained results are better than expected, and in fact really good. Whether the system is implemented in a bigger scale with more users, more sensors might be necessary to use, and that would add unexpected costs to the project. Due to the use of a single sensor which implements really strong processing methods, comparing to more professional sensors, final application has been developed with huge, well documented and very satisfying results with a very cheap technology, so the development of an interesting powerful system has been implemented with minimum resources. Finally, interaction is really effective. First, correspondences between users and particle systems are well performed letting the user experience with the system to be really fluent. Thinking in user experience by setting the system into a user oriented one, is what raises the project to another level. Already implemented interaction between users is really fluent, intended to surprise and with smooth transitions. By testing it we can see amazing results very inspiring, creative and with certain beauty. All this designed interactive system, hence has turn into a really good user experience to be tested with real great scale users in further work. By organizing the system in object-oriented programming, the system can be easily adapted into several different applications Applications The aim of every project is to be useful in an oriented application. By focusing the system design as a Digital Arts approach, it is reasonable that the main application is intended to be used in this field. Digital arts have turned creative programming into a real showcase of projects where technology and design are mixed together to create beautiful applications. Nowadays many blogs [15][19] and communities rises to share new creative applications used in artistic workshops. By introducing human-computer interaction to the system we are giving functionality to the final result, letting the system having a meaning for users who interact with it, making them feel this artistic and creative application; therefore we have created a Digital Arts application. Installing the system in a gallery, or any room where public have access, we can test the system in a real environment as a Digital Arts exhibition. Nevertheless, a more sophisticated system final display should be considered for a better user experience. 43

60 Placing the system in a high stage platform, like in Figure 44, visualization system display might be done through a projection in the ground and sensor should be place in a metallic structure in order to analyze the whole scene. Figure 44.- Stage platform. Notwithstanding, projections have to come from below the stage, in order to prevent projecting the visualization on users; then, the stage material have to be strong to resist users walking on it, and translucent enough to display the system visualization. By being the visualization in the same surface where the user is moving, system performance and the whole interactive experience, can let users enjoy the application in a really special way, provoking emotions and letting them play with the system in different ways from the normal configuration in a wall. On the other hand, not only Digital Arts can be an application for the system. As it was mentioned before, we also can use it involved in a Technologies for the Stage project. Technologies for the Stage is the field where Digital Arts are used with a concrete context. This new field wants to integrate technology with design to create an application that used by an artist, for instance an actor or a dancer, in order to use it as atrezzo that will include more versatility to their job. If our system is introduced in a dancing performance, using it as atrezzo, placing the display system in the stage back wall, the results can be very different. The system can be used to add creativity and originality to the show, let improvisation be in the same context as the rest of the rehearsed show or even telling a story. And are those kind of application which are changing artistic expressions, by letting technology be involved in artistic projects. 44
61 11. CONCLUSIONS By evaluating the work done, all the milestones that were settled has been achieved, and different results has been reached. Users location have been used to develop this new system. Only coming into the interactive zone where the system is placed, it starts detecting them and displaying the visualization response to the interaction. Avoiding the preconception of telling users what they had to do with the system in order not to create false expectation was good in terms of surprising the user when the system is activated, but most of the time they did not know what they had to do with the system, even the interaction was declared as the more simple possible (moving). Then, so as to solve this problem in future uses of the system with new users, a little bit of context should be provided. The system has been developed with a wide scope conception, but with lowers resources possible. Choosing Kinect sensor over other options, let the project be developed with a reduced inversion, then a bass cost in execution and good results with its performance. Only using one sensor to develop a complex system with powerful cheap technology let us implement the system successfully. User position is not only the only and final data for interaction that the system uses; also sound and other possible behavior consideration were used so as to implementing new usability in the system. Several fields of technology and engineering were used during the development of the system to give the user-oriented experience a good and attractive visualization, that has been achieved. In a more technical and deeper approach, thanks to Kinect sensor library, most of the Image processing needed, such as user detection and tracking, was reliable and effective, letting data acquisition process to be accurate. Moreover, used Kinect handicaps were not any issue that affect the final version of the system. Nevertheless, in a pre-conceived version of the project, 3D point cloud was intended to be used; but having a lot of interesting data to be processed through other information source, missing this part was not any problem. Centre of mass user detection and tracking works extremely well letting the system recognize users presence as soon as they get into the interactive zone, reaching this way one of the goals of the project. Position determination is really accurate, even though width calculations are considered from the centre of camera vision instead of considering the room, but as long as the system can only work with a determined interactive area, all measurements are good and valid. 45
62 It is true that the system does not use camera calibration issues. However, some parameter related to that topic were used to get user position. We can see how not working with this computer vision process does not invalidate working with calibration data. Onset detection in audio processing provide the system more versatility and richness referring to interaction. In the visualization system, peaks are barely noticed but they give the geometrics more vivid behavior. Position mapping from real scene to visualization display is well translated, but sometimes, depending on where the audiovisual display is settled, it might be kind of awkward to use. For example, while testing the system, as long as a huge projection was not accessible to use, a laptop screen was used, so the effect was not seen in its whole configuration. Interactive zone works well, although a really little area was used while testing. Notwithstanding, position mapping and interactive condition subjected to the zone worked well. By generating particles from users, we gave the particles a mark-up. The main goal was to develop a kind of visualization that with correspondences with users was able to represent them but not turn into an avatar. Avatars usually upset users as long as their expectations or self consideration; then, having an avatar that do not reflect what they are might make them angry. Moreover, the particle system has been created with extraordinary results. Taking users colors to give them identity, and dynamic behavior to set their activity in order to give them self-sufficiency, with a proper matter for existence. These results made users who tested the system feel that particle systems exist on their own while they tend to follow users position. Flocking behavior has been really useful in terms of achieving an organic visualization. The algorithm let the particle system react smoothly to all interactive impulses, and mixed with symmetric shapes (circle) used, the dynamical feeling was really soft, hence, excellent. Mixing own features with interactive events, all visualization systems were completed with new behaviors. By using multi-user interaction, all visualization and their sudden and fluent beautiful conception, new kind of visualization were achieved. Users who tested the system express that the visualization was surprising, elegant and really beautiful. All interaction events were considered as strong points in interaction, and the effect that all visualization did was absolutely terrific. Furthermore, working with object-oriented programming and different kind of data structures was really thorough. Everything had to be really well connected in order to make the system work properly. Organizing all features and components in the system in classes helped to summarize the system and settle a strong structure. 46
63 Referred literature helped a lot during the development of the system, helping to learn how to use every single element in this design. However, all the system is a self-created original idea and has been developed from scratch. Having then good results, give the feeling that all goals have been achieved, and that a new interactive system has been created using different knowledge acquired during all my engineering training. Nevertheless, new features, and improvements can be done in order to enhance the system in a future Several further work tasks have been also proposed Further Work Adding interaction to the system will be other further work that can be considered to be done. First of all, as long as in centre of mass detection we cannot access to any additional skeleton joint, it would be interesting to be able to track several users hands and interact with their position. Also more users should be detected in the system and new ways of interaction can be implemented. The designed system was intended to be used in a Digital Arts context. I would like to implement the same system by using user calibration in order to obtain the skeleton information for a programmed visualization in the field of Technologies for the Stage, for instance in a dancing performance with two dancers, then a wide range of interaction between both particle system can be implemented introducing improvisation and giving the chance to tell a story. In terms of Audio Processing not everything has been done, I would like to try to modulate the shape of the particles with the audio wave obtained by the Kinect microphones, then, all particles would look like more alive than they do now. At this moment only size of the shape is changed with sound interaction; in a further implementation, shape size is not the only that changes, also the shape itself. In a more advanced implementation, adding complex Image Processing features such as smile detection, mood detection and similar methods will also be nice in order to control the visualization processes, only in the Digital Arts application. All in all, I am glad to say that all the goals and objectives that were established for this first conception of the project has been achieved. Not only the system has been implemented, further features like multi user and audio processing has been included. The performance of the system is good and as soon as more implementations are done, it would be tested with real users in order to determine the usability of the system, including it in Digital Arts and Technologies for the Stage fields; so to as give a useful application to the system. 47
64
65 References [1] Hoiem, Derek. University of Illinois. "How the Kinect Works" Lecture slides available from : %20How%20the%20Kinect%20Works%20-%20CP%20Fall% pdf [Accessed March 2013] [2] Kinect library reference SimpleOpenNI, online resources by learning Codasign. Available in: OpenNI_and_the_Kinect [3] Kinect library source, Simple-openni. Available in: [4] Lu Xiam, Chia-Chih Chen and J.K Aggarwal. Univeristy of Texas. "Human Detection Using Depth Information by Kinect". Available from: [Accessed March 2013] [5] Borenstein, Greg. "Making things see: 3D vision with Kinect, processing, Arduino and MakerBot" (O'Reilly, st Edition) [6] OpenCV documentation (vers ). "Camera calibration With OpenCV". Webpage link: ml [7] Robot Operating Systems {ROS.org} (Webpage). "Kinect calibration". Webpage link: [8] Chen, Junqing; Pappas Thrasyvoulos. "Adaptive perceptual color-texture image segmentation". Available in : [9] Lin, I-Chen. "Computer Vision 3: Color". Lecture available in: [10] Olfati-Saber, Reza; IEEE. "Flocking for Multi-Agent Dynamic Systems: Algorithms and Theory". [11] Olfati-Saber, Reza. "A Unified Analytical Look at Reynolds Flocking Rules". [12] Reynolds, Craig. Online resources. Available in: [13] Codasign Learning (Webpage). "Using the Kinect with Processing". Webpage link: 49
66 [14] Shiffman, Daniel. "Learning Processing: A Beginner's Guide to Programming Images, Animations and Interaction". Online resources: [15] OpenProcessing network. [16] Reas, Casey; Fry, Ben. "Getting Started with Processing: A Hands-on introduction to making interactive Graphics" (O'Reilly, st Edition) [17] Noble, Joshua J. "Programming interactivity: a designer's guide to processing, Arduino and openframeworks" (O'Reilly, nd Edition) [18] Vantomme, Jan. "Processing 2: Creative Programmming Cookbook" (PACKT publishing, open source*, 2012) [19] Creative Applications Website: [20] Minim Library source. Available at: [21] Microsoft (Webpage). Microsoft Developers Network. "Kinect for Windows". Webpage link: 50
 in order to map the captured data (location) as an output of the system to use it over audiovisual system")
67 ANNEX I : PROJECT CHARTER PROJECT CHARTER INTERACTIVE SYSTEM DESIGN FOR AUDIOVISUAL CONTROL USING POSITION DETERMINATION Bachelor's degree in Audiovisual Systems Engineering Argenis Ramírez Gómez 1. IDEA / BACKGROUNDS / PROBLEM: Human Position determination in a determined zone (floor) in order to map the captured data (location) as an output of the system to use it over audiovisual system control. It is important to notice that the position determination system is supposed to be able to track the target location at any time. Currently there are many sensor systems that can help to determine the location of a person in a room, such as microphones/loudspeaker combination, special Cameras, piezoelectric pressure sensors, ultrasonic, lasers, etc. Those systems don t guarantee the 2D location in a certain zone, only have been used to create similar systems or more basic ones, or even have been used to develop a helpful tool to this project. The main problem is the decision on which tool will be useful in usability and cost terms, so taking into consideration which kind of features each sensor or system gives to the system, each option will be an important thing to study. 2. PURPOSE. DESCRIPTION: By interpreting human interaction with floor in a certain zone, the purpose of this project is to validate itself by introducing different results depending on distinct behaviors and programmed modes. The idea not only want to introduce another way to visualize interactively certain kind of information, for instance visual content, I would also like to link it up as a project in the Technologies for the Stage field, that can be performed on a dancing show, or on the other hand validated in Gamming field or Digital Arts field too. Figure 1.- Audiovisual display of the designed system. 51
68 3. GOALS: Validation of the position determination system on different interactive system designs in distinct fields, such as Technologies for the Stage, Gamming, Digital Arts, etc. 4. RESULTS: Creation of an interactive system using the 2D position determination that can be interesting to be used in the fields explained above. Position determination system development supposed to track the target s location in a certain zone. 5. SCOPE: Hardware -- Chosen sensors and display equipment. Software Position Determination programmed method and validation/application software where the method will be used. 6. STAKEHOLDERS: Director: Jesús Ibáñez Martínez 7. CALENDAR: STEP1: Structure organization of the project, Sensor decision, report of the decisions made. DATE: Before 2013 starts STEP2: Chosen Sensor Programming + Position Determination Method Documentation DATE: Mid-January 2013 STEP3: Position Determination Method Programming DATE: March 2013 STEP4: Testing and validation DATE: March 2013 STEP5: Writing report based on results DATE: April Beginning
69 STEP6: Applications (theoretical) Design DATE: April 2013 STEP7: Writing Introduction and background report based on applications DATE: May 2013 STEP8: Applications Programming DATE: May 2013 STEP9: Testing + Report about Results on Application tests DATE: May-June 2013 STEP10: Report Revision DATE: June 8. RISKS: Inability to overtake the position determination method which wouldn't rely on the project main objective to be done, an interactive system development. Wrong choice of the sensor to be used, would delay the whole process. Not finding any useful application or without valor to users and audience would consider the project a failure. 9. COSTS: Sensor hardware costs and applications hardware costs if they are applied. The resultant cost has to be the less possible. 10. BENEFITS: Development of a useful method for position determination to be applied in an interactive design that would enhance certain technologies in distinct fields of investigation. 53
70
71 ANNEX II : PROJECT PLAN PROJECT PLAN INTERACTIVE SYSTEM DESIGN: AN APROACH TO DIGITAL ARTS THROUGH KINECT SENSOR PROGRAMMING Bachelor's degree in Audiovisual Systems Engineering Argenis Ramírez Gómez 1. IDEA: Designing an Interactive System based on User Position in a determined interactive zone placed in a room or free space. Position data and other features extracted from users would be the input of a visualization system oriented to human-technology Interaction systems design. 2. PURPOSE: Processing users position data in order to control an interactive system based on a creative visualization. By interpreting human interaction in a certain zone, the purpose of this project is to create an interactive system by introducing different fields of knowledge in technology and engineering. The main application of the system will be a visualization system based on a particle system that would translate users data into the display screen. Then, users by moving around the interactive zone would be able to make the particle system follow them through the screen. Translating real distances to screen display distances, all measurements of position will be translated from real world to visualization units. Using different audiovisual processing methods and interaction events, the system will be oriented to a Digital Arts application in order to validate all results. 3. SCOPE: Validation of the user position determination by controlling interactive visualization. Creation of a visualization system oriented to user interactive experience. Programming audiovisual processing methods in order to get all data needed for the development of the system. 55
72 Design a new interactive system from scratch and validate it in Digital Arts application field. 4. REQUIREMENTS: Investigation in audiovisual processing and position detection in order to get all the needed data acquisition for developing the visualization system. Find the correct sensor, acquire it and learn how to use it, considering costs. Design an interactive system based in human position determination with an interesting visualization system related to user interactive experience in Digital Arts field. Create a feasible new system that works properly in the application field and achieve all the project goals. Program the system and test it to validate its correct functioning. Control all tasks and communicate advances to coordinator in order to ensure a good development of the project. 5. SCHEDULE: Several milestones have been settled: - Designing the interactive experience application of the system. - Identifying needed data. - Plan the tasks. - Acquire sensor and read literature to learn how to use it. - Data acquisition structure planning. - Position determination design. - Position determination implementation. - Position determination testing. - Visualization design. - Visualization documentation. - Particle system design. 56
73 - Particle system implementation: - Flocking algorithm documentation and development - Color extraction - Particle system creation - Interaction design. - Interaction development. - Further implementations design - Programming the system - System testing - Information gathering - Report design - Report development - Report revision - Project closure 6. COSTS: Sensor costs and other hardware needs should be considered as low as possible so as to design and develop a new feasible and cheap system. 7. QUALITY: All system features should work perfectly, letting at least two users to be part of the system interaction. Position determination will be as accurate as possible. Visualization system will be attractive to users and interactive events have to be designed thinking in what users would do in the system. 8. RESOURCES: Kinect sensor camera will be use to acquire most off the data. While Processing programming environment will be the developing tool of the system. 57
74 9. RISKS: Inability to overtake the position determination method which would not rely on the project main objective to be done, then none of the following planned work can be implemented. Wrong choice of the sensor to be used, would delay the whole process. Not finding any useful application or not without valor to users and audience would consider the project a failure; then a good visualization system have to be programmed taking into consideration project goals. 10. COMMUNICATIONS: All results should be sent to the project coordinator. 58
75 ANNEX III : SENSOR OVERVIEW - Microphone/Loudspeaker combination system: Distance calculation from a high frequency sound sent through a loudspeaker and received by a microphone the user wears. Triangulation of the sound received. It entails a dependency on wearing a microphone, then the system cannot be extended to a usable system without bothering the user. - Ultrasonic: Distance calculation by using ultrasonic sensors. The main problem is resolution, there are 'non-visible' zones that have to be solved with the emplacement and installation of many sensors in order to make the user location determination more accurate, therefore, the more sensors you need the higher the final price is. - Piezoelectric pressure sensors: Pressure sensors located on the floor can help to calculate where the target is on the surface, but as in an ultrasonic system we need to use many sensors for a high resolution. - Lasers: User presence detection by interfering on laser rays. This system design encounter the same problem as the systems explained before. As long as the resolution needed is the maximal that is possible, it will not be feasible. - Camera: Possibility to translate pixel distances to real distances and human detection and tracking methods. It may require strong image processing components, but is a technology cheap enough to solve with a good performance of the whole system. Therefore cameras are the best option to work with, although what we are going to use is more than a camera after all. Thanks to the already programmed libraries of the Kinect sensor from Xbox by Microsoft, we are going to be able to access all its camera sensors to achieve our already established objectives and goals. 59
76

77 ANNEX IV : UML class diagram 61
Exam in DD2426 Robotics and Autonomous Systems
 Exam in DD2426 Robotics and Autonomous Systems Lecturer: Patric Jensfelt KTH, March 16, 2010, 9-12 No aids are allowed on the exam, i.e. no notes, no books, no calculators, etc. You need a minimum of 20
Caustics - Mental Ray
 Caustics - Mental Ray (Working with real caustic generation) In this tutorial we are going to go over some advanced lighting techniques for creating realistic caustic effects. Caustics are the bent reflections
Copyright 2017 by Kevin de Wit
 Copyright 2017 by Kevin de Wit All rights reserved. No part of this publication may be reproduced, distributed, or transmitted in any form or by any means, including photocopying, recording, or other electronic
C O M P U T E R S C I E N C E S U P P O R T G U I D E F O U R T H G R A D E T H I R D T E R M
 C O M P U T E R S C I E N C E S U P P O R T G U I D E F O U R T H G R A D E T H I R D T E R M 2 0 1 8 PLANEACION TERCER PERIODO UNIDAD TEMATICA: DISEÑOS EN 3D Aprendizaje: Diseñar objetos 3D de una manera
Construction Progress Management and Interior Work Analysis Using Kinect 3D Image Sensors
 33 rd International Symposium on Automation and Robotics in Construction (ISARC 2016) Construction Progress Management and Interior Work Analysis Using Kinect 3D Image Sensors Kosei Ishida 1 1 School of
Lecture 19: Depth Cameras. Visual Computing Systems CMU , Fall 2013
 Lecture 19: Depth Cameras Visual Computing Systems Continuing theme: computational photography Cameras capture light, then extensive processing produces the desired image Today: - Capturing scene depth
A Developer s Guide to the Semantic Web
 A Developer s Guide to the Semantic Web von Liyang Yu 1. Auflage Springer 2011 Verlag C.H. Beck im Internet: www.beck.de ISBN 978 3 642 15969 5 schnell und portofrei erhältlich bei beck-shop.de DIE FACHBUCHHANDLUNG
6.001 Notes: Section 17.5
 6.001 Notes: Section 17.5 Slide 17.5.1 Now, let's look at one example in which changing the evaluation model allows us to explore a very different kind of computational problem. Our goal is to show how
CS 378: Computer Game Technology
 CS 378: Computer Game Technology Dynamic Path Planning, Flocking Spring 2012 University of Texas at Austin CS 378 Game Technology Don Fussell Dynamic Path Planning! What happens when the environment changes
Range Imaging Through Triangulation. Range Imaging Through Triangulation. Range Imaging Through Triangulation. Range Imaging Through Triangulation
 Obviously, this is a very slow process and not suitable for dynamic scenes. To speed things up, we can use a laser that projects a vertical line of light onto the scene. This laser rotates around its vertical
Rigid ICP registration with Kinect
 Rigid ICP registration with Kinect Students: Yoni Choukroun, Elie Semmel Advisor: Yonathan Aflalo 1 Overview.p.3 Development of the project..p.3 Papers p.4 Project algorithm..p.6 Result of the whole body.p.7
Data-driven Approaches to Simulation (Motion Capture)
") 1 Data-driven Approaches to Simulation (Motion Capture) Ting-Chun Sun tingchun.sun@usc.edu Preface The lecture slides [1] are made by Jessica Hodgins [2], who is a professor in Computer Science Department
1 Data-driven Approaches to Simulation (Motion Capture) Ting-Chun Sun tingchun.sun@usc.edu Preface The lecture slides [1] are made by Jessica Hodgins [2], who is a professor in Computer Science Department
Canny Edge Based Self-localization of a RoboCup Middle-sized League Robot
 Canny Edge Based Self-localization of a RoboCup Middle-sized League Robot Yoichi Nakaguro Sirindhorn International Institute of Technology, Thammasat University P.O. Box 22, Thammasat-Rangsit Post Office,
Multimedia Technology CHAPTER 4. Video and Animation
 CHAPTER 4 Video and Animation - Both video and animation give us a sense of motion. They exploit some properties of human eye s ability of viewing pictures. - Motion video is the element of multimedia
Last update: May 4, Vision. CMSC 421: Chapter 24. CMSC 421: Chapter 24 1
 Last update: May 4, 200 Vision CMSC 42: Chapter 24 CMSC 42: Chapter 24 Outline Perception generally Image formation Early vision 2D D Object recognition CMSC 42: Chapter 24 2 Perception generally Stimulus
VIRTUAL TRAIL ROOM. South Asian Journal of Engineering and Technology Vol.3, No.5 (2017) 87 96
 87 96") VIRTUAL TRAIL ROOM 1 Vipin Paul, 2 Sanju Abel J., 3 Sudharsan S., 4 Praveen M. 1 Vipinpaul95@gmail.com 3 shansudharsan002@gmail.com 2 sanjuabel@gmail.com 4 praveen.pravin6@gmail.com Department of computer
VIRTUAL TRAIL ROOM 1 Vipin Paul, 2 Sanju Abel J., 3 Sudharsan S., 4 Praveen M. 1 Vipinpaul95@gmail.com 3 shansudharsan002@gmail.com 2 sanjuabel@gmail.com 4 praveen.pravin6@gmail.com Department of computer
Case Study: The Pixar Story. By Connor Molde Comptuer Games & Interactive Media Year 1
 Case Study: The Pixar Story By Connor Molde Comptuer Games & Interactive Media Year 1 Contents Section One: Introduction Page 1 Section Two: About Pixar Page 2 Section Three: Drawing Page 3 Section Four:
Gesture based PTZ camera control
 Gesture based PTZ camera control Report submitted in May 2014 to the department of Computer Science and Engineering of National Institute of Technology Rourkela in partial fulfillment of the requirements
Accurate 3D Face and Body Modeling from a Single Fixed Kinect
 Accurate 3D Face and Body Modeling from a Single Fixed Kinect Ruizhe Wang*, Matthias Hernandez*, Jongmoo Choi, Gérard Medioni Computer Vision Lab, IRIS University of Southern California Abstract In this
Using Intel RealSense Depth Data for Hand Tracking in Unreal Engine 4. A Senior Project. presented to
 Using Intel RealSense Depth Data for Hand Tracking in Unreal Engine 4 A Senior Project presented to the Faculty of the Liberal Arts and Engineering Studies Department California Polytechnic State University,
Artificial Intelligence Prof. Deepak Khemani Department of Computer Science and Engineering Indian Institute of Technology, Madras
 Artificial Intelligence Prof. Deepak Khemani Department of Computer Science and Engineering Indian Institute of Technology, Madras (Refer Slide Time: 00:17) Lecture No - 10 Hill Climbing So, we were looking
Introduction to 3D Concepts
 PART I Introduction to 3D Concepts Chapter 1 Scene... 3 Chapter 2 Rendering: OpenGL (OGL) and Adobe Ray Tracer (ART)...19 1 CHAPTER 1 Scene s0010 1.1. The 3D Scene p0010 A typical 3D scene has several
Kinect Cursor Control EEE178 Dr. Fethi Belkhouche Christopher Harris Danny Nguyen I. INTRODUCTION
 Kinect Cursor Control EEE178 Dr. Fethi Belkhouche Christopher Harris Danny Nguyen Abstract: An XBOX 360 Kinect is used to develop two applications to control the desktop cursor of a Windows computer. Application
Lines of Symmetry. Grade 3. Amy Hahn. Education 334: MW 8 9:20 a.m.
 Lines of Symmetry Grade 3 Amy Hahn Education 334: MW 8 9:20 a.m. GRADE 3 V. SPATIAL SENSE, GEOMETRY AND MEASUREMENT A. Spatial Sense Understand the concept of reflection symmetry as applied to geometric
Grade 6 Math Circles. Spatial and Visual Thinking
 Faculty of Mathematics Waterloo, Ontario N2L 3G1 Introduction Grade 6 Math Circles October 31/November 1, 2017 Spatial and Visual Thinking Centre for Education in Mathematics and Computing One very important
Automated Measurement of Viscosity with Ubbelohde Viscometers, Camera Unit and Image Processing Software
 Santiago de Querétaro, México, Automated Measurement of Viscosity with Ubbelohde Viscometers, Camera Unit and Image Processing Software Will, J.C., Hernández, I., Trujillo, S. km 4,5 Carretera a Los Cués,
Chapter 19- Object Physics
 Chapter 19- Object Physics Flowing water, fabric, things falling, and even a bouncing ball can be difficult to animate realistically using techniques we have already discussed. This is where Blender's
A Real Time Virtual Dressing Room Application using Opencv
 ISSN 2395-1621 A Real Time Virtual Room Application using Opencv #1 Ms. Rshami S. Shinkar, #2 Prof. Nagaraju Bogiri 1 rashmi.sinkar91@gmail.com 2 mail2nagaraju@gmail.com #12 Department of Computer Engineering
MITOCW MIT6_172_F10_lec18_300k-mp4
 MITOCW MIT6_172_F10_lec18_300k-mp4 The following content is provided under a Creative Commons license. Your support will help MIT OpenCourseWare continue to offer high quality educational resources for
Introduction to Homogeneous coordinates
 Last class we considered smooth translations and rotations of the camera coordinate system and the resulting motions of points in the image projection plane. These two transformations were expressed mathematically
Porsche 91 1GT D m o d e ling tutorial - by Nim
 orsche 911GT 3D modeling tutorial - by Nimish In this tutorial you will learn to model a car using Spline modeling method. This method is not very much famous as it requires considerable amount of skill
BCC Comet Generator Source XY Source Z Destination XY Destination Z Completion Time
 BCC Comet Generator Comet creates an auto-animated comet that streaks across the screen. The comet is compromised of particles whose sizes, shapes, and colors can be adjusted. You can also set the length
An actor-critic reinforcement learning controller for a 2-DOF ball-balancer
 An actor-critic reinforcement learning controller for a 2-DOF ball-balancer Andreas Stückl Michael Meyer Sebastian Schelle Projektpraktikum: Computational Neuro Engineering 2 Empty side for praktikums
There we are; that's got the 3D screen and mouse sorted out.
 Introduction to 3D To all intents and purposes, the world we live in is three dimensional. Therefore, if we want to construct a realistic computer model of it, the model should be three dimensional as
AS AUTOMAATIO- JA SYSTEEMITEKNIIKAN PROJEKTITYÖT CEILBOT FINAL REPORT
 AS-0.3200 AUTOMAATIO- JA SYSTEEMITEKNIIKAN PROJEKTITYÖT CEILBOT FINAL REPORT Jaakko Hirvelä GENERAL The goal of the Ceilbot-project is to design a fully autonomous service robot moving in a roof instead
There are many kinds of surface shaders, from those that affect basic surface color, to ones that apply bitmap textures and displacement.
 mental ray Overview Mental ray is a powerful renderer which is based on a scene description language. You can use it as a standalone renderer, or even better, integrated with 3D applications. In 3D applications,
Ambient Occlusion Pass
 Ambient Occlusion Pass (Soft Shadows in the Nooks and Crannies to Replicate Photorealistic Lighting) In this tutorial we are going to go over some advanced lighting techniques for an Ambient Occlusion
How to Use Passive Infrared Sensor Cameras
 ACTi Knowledge Base Category: Application Note Sub-category: Hardware, Application Model: ACM-4201, ACM-4001, TCM-4201, TCM-4001 Firmware: N/A Software: N/A Author: Ando Meritee Published: 2010/08/23 Reviewed:
Art, Nature, and Patterns Introduction
 Art, Nature, and Patterns Introduction to LOGO Describing patterns with symbols This tutorial is designed to introduce you to some basic LOGO commands as well as two fundamental and powerful principles
(Refer Slide Time 00:17) Welcome to the course on Digital Image Processing. (Refer Slide Time 00:22)
 Welcome to the course on Digital Image Processing. (Refer Slide Time 00:22)") Digital Image Processing Prof. P. K. Biswas Department of Electronics and Electrical Communications Engineering Indian Institute of Technology, Kharagpur Module Number 01 Lecture Number 02 Application
Digital Image Processing Prof. P. K. Biswas Department of Electronics and Electrical Communications Engineering Indian Institute of Technology, Kharagpur Module Number 01 Lecture Number 02 Application
THE preceding chapters were all devoted to the analysis of images and signals which
 Chapter 5 Segmentation of Color, Texture, and Orientation Images THE preceding chapters were all devoted to the analysis of images and signals which take values in IR. It is often necessary, however, to
Final Exam Study Guide
 Final Exam Study Guide Exam Window: 28th April, 12:00am EST to 30th April, 11:59pm EST Description As indicated in class the goal of the exam is to encourage you to review the material from the course.
Creating joints for the NovodeX MAX exporter
 Creating joints for the NovodeX MAX exporter (a step-by-step tutorial by Pierre Terdiman) p.terdiman@wanadoo.fr Version 0.3 I) Creating a hinge Here we'll see how to create a hinge joint compatible with
A Simple Interface for Mobile Robot Equipped with Single Camera using Motion Stereo Vision
 A Simple Interface for Mobile Robot Equipped with Single Camera using Motion Stereo Vision Stephen Karungaru, Atsushi Ishitani, Takuya Shiraishi, and Minoru Fukumi Abstract Recently, robot technology has
Final Review CMSC 733 Fall 2014
 Final Review CMSC 733 Fall 2014 We have covered a lot of material in this course. One way to organize this material is around a set of key equations and algorithms. You should be familiar with all of these,
Coarse-to-fine image registration
 Today we will look at a few important topics in scale space in computer vision, in particular, coarseto-fine approaches, and the SIFT feature descriptor. I will present only the main ideas here to give
Topic 4 - Introduction to Metering on a DSLR
 Getting more from your Camera Topic 4 - Introduction to Metering on a DSLR Learning Outcomes In this lesson, we will look at another important feature on a DSLR camera called Metering Mode. By the end
Lab 1- Introduction to Motion
 Partner : Purpose Partner 2: Lab - Section: The purpose of this lab is to learn via a motion detector the relationship between position and velocity. Remember that this device measures the position of
Other approaches to obtaining 3D structure
 Other approaches to obtaining 3D structure Active stereo with structured light Project structured light patterns onto the object simplifies the correspondence problem Allows us to use only one camera camera
Carmen Alonso Montes 23rd-27th November 2015
 Practical Computer Vision: Theory & Applications 23rd-27th November 2015 Wrap up Today, we are here 2 Learned concepts Hough Transform Distance mapping Watershed Active contours 3 Contents Wrap up Object
Animation. Itinerary. What is Animation? What is Animation? Animation Methods. Modeling vs. Animation Computer Graphics Lecture 22
 15-462 Computer Graphics Lecture 22 Animation April 22, 2003 M. Ian Graham Carnegie Mellon University What is Animation? Making things move What is Animation? Consider a model with n parameters Polygon
12/19/2016. Types of Education Media. Print Media. Projected & non-projected media. Audio, Visual & Audiovisual. Media
 Types of Education Media Education Media There are different ways to classify media Print media, non-print media and electronic media Print Media They include: books, journals, magazines, newspapers, workbook,
Measurements using three-dimensional product imaging
 ARCHIVES of FOUNDRY ENGINEERING Published quarterly as the organ of the Foundry Commission of the Polish Academy of Sciences ISSN (1897-3310) Volume 10 Special Issue 3/2010 41 46 7/3 Measurements using
Caustics - Mental Ray
 Caustics - Mental Ray In this tutorial we are going to go over some advanced lighting techniques for creating realistic caustic effects. Caustics are the focused patterns of light which form after light
GAP CLOSING. Grade 9. Facilitator s Guide
 GAP CLOSING Grade 9 Facilitator s Guide Topic 3 Integers Diagnostic...5 Administer the diagnostic...5 Using diagnostic results to personalize interventions solutions... 5 Using Intervention Materials...8
Your Name: Section: INTRODUCTION TO STATISTICAL REASONING Computer Lab #4 Scatterplots and Regression
 Your Name: Section: 36-201 INTRODUCTION TO STATISTICAL REASONING Computer Lab #4 Scatterplots and Regression Objectives: 1. To learn how to interpret scatterplots. Specifically you will investigate, using
Mouse Simulation Using Two Coloured Tapes
 Mouse Simulation Using Two Coloured Tapes Kamran Niyazi 1, Vikram Kumar 2, Swapnil Mahe 3 and Swapnil Vyawahare 4 Department of Computer Engineering, AISSMS COE, University of Pune, India kamran.niyazi@gmail.com
Animation. Itinerary Computer Graphics Lecture 22
 15-462 Computer Graphics Lecture 22 Animation April 22, 2003 M. Ian Graham Carnegie Mellon University Itinerary Review Basic Animation Keyed Animation Motion Capture Physically-Based Animation Behavioral
Contents NUMBER. Resource Overview xv. Counting Forward and Backward; Counting. Principles; Count On and Count Back. How Many? 3 58.
 Contents Resource Overview xv Application Item Title Pre-assessment Analysis Chart NUMBER Place Value and Representing Place Value and Representing Rote Forward and Backward; Principles; Count On and Count
Unbelievable Visualization Techniques: Letting Your Imagination Soar!
 11/29/2005-5:00 pm - 6:30 pm Room:N. Hemispheres (Salon A4) (Dolphin) Walt Disney World Swan and Dolphin Resort Orlando, Florida Unbelievable Visualization Techniques: Letting Your Imagination Soar! Chris
8. Automatic Content Analysis
 8. Automatic Content Analysis 8.1 Statistics for Multimedia Content Analysis 8.2 Basic Parameters for Video Analysis 8.3 Deriving Video Semantics 8.4 Basic Parameters for Audio Analysis 8.5 Deriving Audio
Overview. Animation is a big topic We will concentrate on character animation as is used in many games today. humans, animals, monsters, robots, etc.
 ANIMATION Overview Animation is a big topic We will concentrate on character animation as is used in many games today humans, animals, monsters, robots, etc. Character Representation A character is represented
Nearest Neighbor Classifiers
 Nearest Neighbor Classifiers CSE 6363 Machine Learning Vassilis Athitsos Computer Science and Engineering Department University of Texas at Arlington 1 The Nearest Neighbor Classifier Let X be the space
Introducing Robotics Vision System to a Manufacturing Robotics Course
 Paper ID #16241 Introducing Robotics Vision System to a Manufacturing Robotics Course Dr. Yuqiu You, Ohio University c American Society for Engineering Education, 2016 Introducing Robotics Vision System
Document downloaded from: The final publication is available at: Copyright.
 Document downloaded from: http://hdl.handle.net/1459.1/62843 The final publication is available at: https://doi.org/1.17/978-3-319-563-8_4 Copyright Springer International Publishing Switzerland, 213 Evaluation
lecture 10 - depth from blur, binocular stereo
 This lecture carries forward some of the topics from early in the course, namely defocus blur and binocular disparity. The main emphasis here will be on the information these cues carry about depth, rather
Data Term. Michael Bleyer LVA Stereo Vision
 Data Term Michael Bleyer LVA Stereo Vision What happened last time? We have looked at our energy function: E ( D) = m( p, dp) + p I < p, q > N s( p, q) We have learned about an optimization algorithm that
Lecture 14: Computer Vision
 CS/b: Artificial Intelligence II Prof. Olga Veksler Lecture : Computer Vision D shape from Images Stereo Reconstruction Many Slides are from Steve Seitz (UW), S. Narasimhan Outline Cues for D shape perception
GAP CLOSING. Integers. Intermediate / Senior Facilitator s Guide
 GAP CLOSING Integers Intermediate / Senior Facilitator s Guide Topic 3 Integers Diagnostic...5 Administer the diagnostic...5 Using diagnostic results to personalize interventions solutions...5 Using Intervention
Sphero Lightning Lab Cheat Sheet
 Actions Tool Description Variables Ranges Roll Combines heading, speed and time variables to make the robot roll. Duration Speed Heading (0 to 999999 seconds) (degrees 0-359) Set Speed Sets the speed of
Worksheet Answer Key: Scanning and Mapping Projects > Mine Mapping > Investigation 2
 Worksheet Answer Key: Scanning and Mapping Projects > Mine Mapping > Investigation 2 Ruler Graph: Analyze your graph 1. Examine the shape formed by the connected dots. i. Does the connected graph create
LECTURE 16: SWARM INTELLIGENCE 2 / PARTICLE SWARM OPTIMIZATION 2
 15-382 COLLECTIVE INTELLIGENCE - S18 LECTURE 16: SWARM INTELLIGENCE 2 / PARTICLE SWARM OPTIMIZATION 2 INSTRUCTOR: GIANNI A. DI CARO BACKGROUND: REYNOLDS BOIDS Reynolds created a model of coordinated animal
Visual Design. Simplicity, Gestalt Principles, Organization/Structure
 Visual Design Simplicity, Gestalt Principles, Organization/Structure Many examples are from Universal Principles of Design, Lidwell, Holden, and Butler Why discuss visual design? You need to present the
Why study Computer Vision?
 Why study Computer Vision? Images and movies are everywhere Fast-growing collection of useful applications building representations of the 3D world from pictures automated surveillance (who s doing what)
MAKING OF BY BRUNO HAMZAGIC SOFTWARE USED: MAYA AND ZBRUSH
 MAKING OF BY BRUNO HAMZAGIC SOFTWARE USED: MAYA AND ZBRUSH This month s Making of shows us the creation of this amazing image that gave Bruno Hamzagic the opportunity to mix two of his passions 3D artwork
Industrial Safety Engineering Prof. Jhareswar Maiti Department of Industrial and Systems Engineering Indian Institute of Technology, Kharagpur
 Industrial Safety Engineering Prof. Jhareswar Maiti Department of Industrial and Systems Engineering Indian Institute of Technology, Kharagpur Lecture - 59 VR roadmap So, welcome to this lecture of Industrial
If Statements, For Loops, Functions
 Fundamentals of Programming If Statements, For Loops, Functions Table of Contents Hello World Types of Variables Integers and Floats String Boolean Relational Operators Lists Conditionals If and Else Statements
Direct Variations DIRECT AND INVERSE VARIATIONS 19. Name
 DIRECT AND INVERSE VARIATIONS 19 Direct Variations Name Of the many relationships that two variables can have, one category is called a direct variation. Use the description and example of direct variation
Resumen. Una sola cámara Robot móvil Visión computacional Resultados experimentales
 Resumen Este artículo describe un método para adquirir la forma 3D de un objeto y estimar la posición de robot por medio de observar un objeto desconocido. Una sola cámara Robot móvil Visión computacional
Plus 10: Descending the Design Funnel THE 10 PLUS 10 METHOD. developing 10 different ideas and refinements of selected ideas
 10 Plus 10: Descending the Design Funnel developing 10 different ideas and refinements of selected ideas 1.4 The design funnel describes a process that you, as an interaction designer, need to habitually
Iain Carson. design. code. make. Creative Coder Portfolio Project Samples 2017
 design code Portfolio Project Samples 2017 make I m studying towards an MSc in Computer Science at the University of St Andrews. and I also love photography design Pantheon Tableau 3 Designs grow through
Azon Master Class. By Ryan Stevenson Guidebook #10 Google and YouTube Marketing
 Azon Master Class By Ryan Stevenson https://ryanstevensonplugins.com/ Guidebook #10 Google and YouTube Marketing Table of Contents 1. Google Analytics 2. Google Webmaster Tools 3. Google Plus 4. YouTube
So we have been talking about 3D viewing, the transformations pertaining to 3D viewing. Today we will continue on it. (Refer Slide Time: 1:15)
") Introduction to Computer Graphics Dr. Prem Kalra Department of Computer Science and Engineering Indian Institute of Technology, Delhi Lecture - 8 3D Viewing So we have been talking about 3D viewing, the
Introduction to Computer Graphics Dr. Prem Kalra Department of Computer Science and Engineering Indian Institute of Technology, Delhi Lecture - 8 3D Viewing So we have been talking about 3D viewing, the
A Supporting System for Beginners of Billiards Based on Predicting the Path of the Balls by Detecting the Cue Stick
 A Supporting System for Beginners of Billiards Based on Predicting the Path of the Balls by Detecting the Cue Stick Akira SUGANUMA Department of Electronics and Information Engineering, National Institute
Point based global illumination is now a standard tool for film quality renderers. Since it started out as a real time technique it is only natural
 1 Point based global illumination is now a standard tool for film quality renderers. Since it started out as a real time technique it is only natural to consider using it in video games too. 2 I hope that
Miniaturized Camera Systems for Microfactories
 Miniaturized Camera Systems for Microfactories Timo Prusi, Petri Rokka, and Reijo Tuokko Tampere University of Technology, Department of Production Engineering, Korkeakoulunkatu 6, 33720 Tampere, Finland
Software Design. Introduction. Software Design (Introduction) SERG
 SERG") Software Design Introduction Software Design How to implement the what. Requirements Document (RD) is starting point. Software design is a highly-creative activity. Good designers are worth their weight
Software Design Introduction Software Design How to implement the what. Requirements Document (RD) is starting point. Software design is a highly-creative activity. Good designers are worth their weight
MITOCW ocw f99-lec07_300k
 MITOCW ocw-18.06-f99-lec07_300k OK, here's linear algebra lecture seven. I've been talking about vector spaces and specially the null space of a matrix and the column space of a matrix. What's in those
The first thing we ll need is some numbers. I m going to use the set of times and drug concentration levels in a patient s bloodstream given below.
 Graphing in Excel featuring Excel 2007 1 A spreadsheet can be a powerful tool for analyzing and graphing data, but it works completely differently from the graphing calculator that you re used to. If you
COMP Preliminaries Jan. 6, 2015
 Lecture 1 Computer graphics, broadly defined, is a set of methods for using computers to create and manipulate images. There are many applications of computer graphics including entertainment (games, cinema,
True Advancements for Longitudinal Weld Pipe Inspection in PA
 NDT in Canada 2016 & 6th International CANDU In-Service Inspection Workshop, Nov 15-17, 2016, Burlington, ON (Canada) www.ndt.net/app.ndtcanada2016 True Advancements for Longitudinal Weld Pipe Inspection
Final Report. EEL 5666 Intelligent Machines Design Laboratory
 Final Report EEL 5666 Intelligent Machines Design Laboratory TAs: Mike Pridgen & Thomas Vermeer Instructors: Dr. A. Antonio Arroyo & Dr. Eric M. Schwartz Hao (Hardy) He Dec 08 th, 2009 Table of Contents
Tangents. In this tutorial we are going to take a look at how tangents can affect an animation.
 Tangents In this tutorial we are going to take a look at how tangents can affect an animation. One of the 12 Principles of Animation is called Slow In and Slow Out. This refers to the spacing of the in
Real Time Motion Detection Using Background Subtraction Method and Frame Difference
 Real Time Motion Detection Using Background Subtraction Method and Frame Difference Lavanya M P PG Scholar, Department of ECE, Channabasaveshwara Institute of Technology, Gubbi, Tumkur Abstract: In today
Dr. Enrique Cabello Pardos July
 Dr. Enrique Cabello Pardos July 20 2011 Dr. Enrique Cabello Pardos July 20 2011 ONCE UPON A TIME, AT THE LABORATORY Research Center Contract Make it possible. (as fast as possible) Use the best equipment.
Mastering Truspace 7
 How to move your Truespace models in Dark Basic Pro by Vickie Eagle Welcome Dark Basic Users to the Vickie Eagle Truspace Tutorials, In this first tutorial we are going to build some basic landscape models
Pong in Unity a basic Intro
 This tutorial recreates the classic game Pong, for those unfamiliar with the game, shame on you what have you been doing, living under a rock?! Go google it. Go on. For those that now know the game, this
Cityscape Generator.. And additional tools
 Cityscape Generator.. And additional tools V3Digitimes - December 2016 1 This product comes with 3 scripts : 1. one to generate a cityscape, 2. the other one allowing to add human beings in front of a
Multi-Robot Navigation and Coordination
 Multi-Robot Navigation and Coordination Daniel Casner and Ben Willard Kurt Krebsbach, Advisor Department of Computer Science, Lawrence University, Appleton, Wisconsin 54912 daniel.t.casner@ieee.org, benjamin.h.willard@lawrence.edu
Figure 2.1: High level diagram of system.
 Basile and Choudhury 6.111 Final Project: La PC-na Project Proposal 1 Introduction The luxury of purchasing separate pool tables, foosball tables, and air hockey tables is beyond the budget of many, particularly