Visualization with ParaView
|
|
|
- Evangeline Underwood
- 5 years ago
- Views:
Transcription
1 Visualization with
2 Before we begin Make sure you have installed so you can follow along in the lab section
3 Background Open-source, multi-platform parallel data analysis and visualization application Mature, feature-rich interface Good for general-purpose, rapid visualization Built upon the Visualization ToolKit (VTK) library Primary contributors: Kitware, Inc. Sandia National Laboratory Los Alamos National Laboratory Army Research Laboratory
4 Data Types Supports a wide variety of data types Structured grids uniform rectilinear, non-uniform rectilinear, and curvilinear Unstructured grids Polygonal data Images Multi-block AMR Time series support
5 Visualization Algorithms Supports a wide variety of visualization algorithms Isosurfaces Cutting planes Streamlines Glyphs Volume rendering Clipping Height maps
6 Special Features Supports derived variables New scalar / vector variables that are functions of existing variables in your data set Scriptable via Python Saves animations Can run in parallel / distributed mode for large data visualization
7 Data Formats Supports a wide variety of data formats VTK ( EnSight Plot3D Various polygonal formats Users can write data readers to extend support to other formats Conversion to the VTK format is straightforward
8 Data Formats VTK Simple Legacy Format ASCII or binary Supports all VTK grid types Easiest for data conversion Note: use VTK XML format for parallel I/O VTK simple legacy format (

9 Data Formatting Example Data set: 4x4x4 rectilinear grid with one scalar variable
10 Visualization Pipeline All processing operations (filters) produce data sets Can further process the result of every operation to build complex visualizations e.g. can extract a cutting plane, and apply glyphs (i.e. vector arrows) to the result Gives a plane of glyphs through your 3D volume
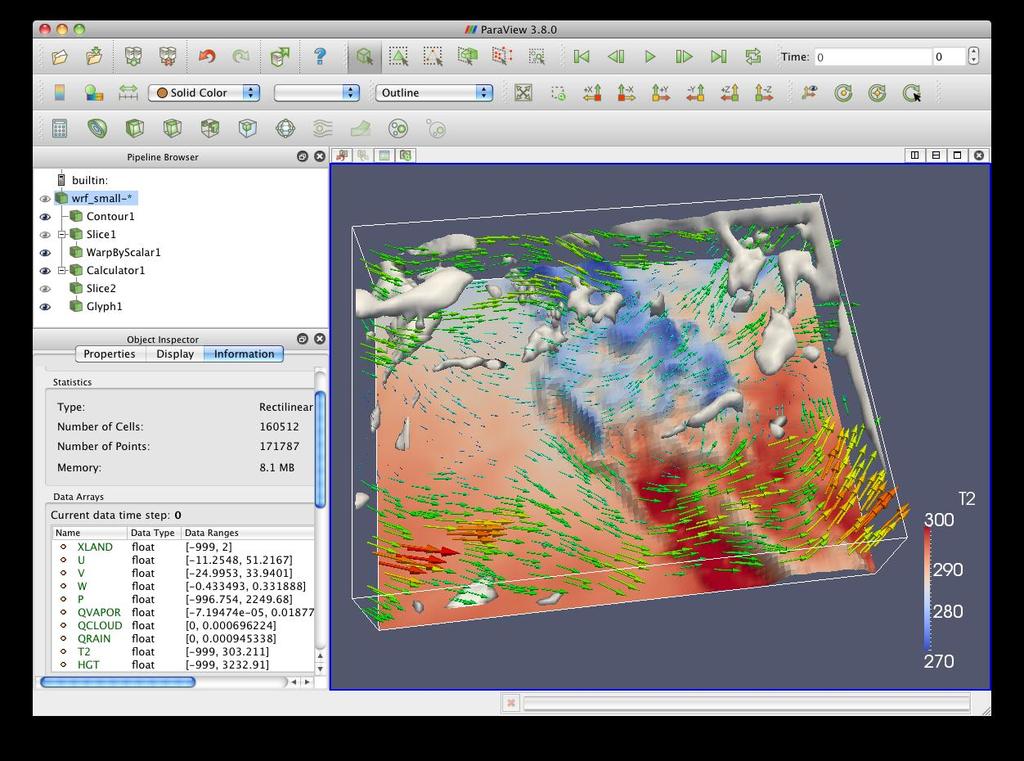
11 Demonstration WRF weather forecast data set Rectilinear grid Multiple scalar and vector variables Time series Can show: Clouds Wind Temperature
12
13 Test-Drive
14 Getting Started Download example data file RectGrid2.vtk Right-click, Save link as Open
15 Today we will: Create isosurfaces for a scalar variable Clip and slice the isosurfaces Use glyphs to display a vector field Use streamlines to show flow through a vector field Edit color maps Add slices to show variable values over a plane Adjust opacities of filters Add color legends Create volume rendering

16 Open the file RectGrid2.vtk Click File -> Open Select RectGrid2.vtk Click OK Box outline of dataset extent displayed
17 Open the file RectGrid2.vtk Click File -> Open Select RectGrid2.vtk Click OK Box outline of dataset extent displayed
18 Open the file RectGrid2.vtk Click File -> Open Select RectGrid2.vtk Click OK Box outline of dataset extent displayed
19 Create isosurfaces Common -> Contour In Isosurfaces box, click Delete All Click New Range Keep defaults, click OK Click Display tab In Color by box, select vectors
20 Create isosurfaces Common -> Contour In Isosurfaces box, click Delete All Click New Range Keep defaults, click OK Click Display tab In Color by box, select vectors
21 Create isosurfaces Common -> Contour In Isosurfaces box, click Delete All Click New Range Keep defaults, click OK Click Display tab In Color by box, select vectors
22 Create isosurfaces Common -> Contour In Isosurfaces box, click Delete All Click New Range Keep defaults, click OK Click Display tab In Color by box, select vectors
23 Create isosurfaces Common -> Contour In Isosurfaces box, click Delete All Click New Range Keep defaults, click OK Click Display tab In Color by box, select vectors
24 Create isosurfaces Common -> Contour In Isosurfaces box, click Delete All Click New Range Keep defaults, click OK Click Display tab In Color by box, select vectors
25 Create isosurfaces Common -> Contour In Isosurfaces box, click Delete All Click New Range Keep defaults, click OK Click Display tab In Color by box, select vectors
26 Clip isosurfaces Click +Y view button Common -> Clip Drag arrow point around to front of surface (arrow turns red when selected) Click Inside Out checkbox Click Show Center button to remove crosshairs
27 Clip isosurfaces Click +Y view button Common -> Clip Drag arrow point around to front of surface (arrow turns red when selected) Click Inside Out checkbox Click Show Center button to remove crosshairs
28 Clip isosurfaces Click +Y view button Common -> Clip Drag arrow point around to front of surface (arrow turns red when selected) Click Inside Out checkbox Click Show Center button to remove crosshairs
29 Clip isosurfaces Click +Y view button Common -> Clip Drag arrow point around to front of surface (arrow turns red when selected) Click Inside Out checkbox Click Show Center button to remove crosshairs
30 Clip isosurfaces Click +Y view button Common -> Clip Drag arrow point around to front of surface (arrow turns red when selected) Click Inside Out checkbox Click Show Center button to remove crosshairs
31 Slice isosurfaces Click eye next to Clip1 to hide clip plot Click Contour1 in Pipeline Browser Common -> Slice Drag arrow point around to front of surface (arrow turns red when selected)
32 Slice isosurfaces Click eye next to Clip1 to hide clip plot Click Contour1 in Pipeline Browser Common -> Slice Drag arrow point around to front of surface (arrow turns red when selected)
33 Slice isosurfaces Click eye next to Clip1 to hide clip plot Click Contour1 in Pipeline Browser Common -> Slice Drag arrow point around to front of surface (arrow turns red when selected)
34 Slice isosurfaces Click eye next to Clip1 to hide clip plot Click Contour1 in Pipeline Browser Common -> Slice Drag arrow point around to front of surface (arrow turns red when selected)
35 Slice isosurfaces Click eye next to Clip1 to hide clip plot Click Contour1 in Pipeline Browser Common -> Slice Drag arrow point around to front of surface (arrow turns red when selected)
36 Slice isosurfaces Click eye next to Clip1 to hide clip plot Click Contour1 in Pipeline Browser Common -> Slice Drag arrow point around to front of surface (arrow turns red when selected)
37 Create Glyph of Vector Field Click RectGrid2.vtk in Pipeline Browser Common -> Glyph
38 Create Glyph of Vector Field Click RectGrid2.vtk in Pipeline Browser Common -> Glyph
39 Create Glyph of Vector Field Click RectGrid2.vtk in Pipeline Browser Common -> Glyph
40 Create Glyph of Vector Field Click RectGrid2.vtk in Pipeline Browser Common -> Glyph
41 Create Streamlines Click eye next to Glyph1 to hide glyph plot Click RectGrid2.vtk in Pipeline Browser Common -> Stream Tracer Under Display tab, in the Color by box, select Vorticity
42 Create Streamlines Click eye next to Glyph1 to hide glyph plot Click RectGrid2.vtk in Pipeline Browser Common -> Stream Tracer Under Display tab, in the Color by box, select Vorticity
43 Create Streamlines Click eye next to Glyph1 to hide glyph plot Click RectGrid2.vtk in Pipeline Browser Common -> Stream Tracer Under Display tab, in the Color by box, select Vorticity
44 Create Streamlines Click eye next to Glyph1 to hide glyph plot Click RectGrid2.vtk in Pipeline Browser Common -> Stream Tracer Under Display tab, in the Color by box, select Vorticity
45 Create Streamlines Click eye next to Glyph1 to hide glyph plot Click RectGrid2.vtk in Pipeline Browser Common -> Stream Tracer Under Display tab, in the Color by box, select Vorticity
46 Create Streamlines Click eye next to Glyph1 to hide glyph plot Click RectGrid2.vtk in Pipeline Browser Common -> Stream Tracer Under Display tab, in the Color by box, select Vorticity
47 Create Streamlines Click eye next to Glyph1 to hide glyph plot Click RectGrid2.vtk in Pipeline Browser Common -> Stream Tracer Under Display tab, in the Color by box, select Vorticity
48 Create Tubes Click StreamTracer1 in Pipeline Browser Alphabetical -> Tube

49 Create Tubes Click StreamTracer1 in Pipeline Browser Alphabetical -> Tube
50 Create Tubes Click StreamTracer1 in Pipeline Browser Alphabetical -> Tube
51 Create Tubes Click StreamTracer1 in Pipeline Browser Alphabetical -> Tube
52 Edit Color Map Click Edit Color Map Click Choose Preset Select BLUE...HSV Click blue OK Click blue Close

53 Edit Color Map Click Edit Color Map Click Choose Preset Select BLUE...HSV Click blue OK Click blue Close

54 Edit Color Map Click Edit Color Map Click Choose Preset Select BLUE...HSV Click blue OK Click blue Close
55 Edit Color Map Click Edit Color Map Click Choose Preset Select BLUE...HSV Click blue OK Click blue Close

56 Edit Color Map Click Edit Color Map Click Choose Preset Select BLUE...HSV Click blue OK Click blue Close
57 Edit Color Map Click Edit Color Map Click Choose Preset Select BLUE...HSV Click blue OK Click blue Close
58 Create Slice Click RectGrid2.vtk in Pipeline Browser Common -> Slice Drag arrow point around to front of surface (arrow turns red when selected) Or click Y Normal Click Show Plane

59 Create Slice Click RectGrid2.vtk in Pipeline Browser Common -> Slice Drag arrow point around to front of surface (arrow turns red when selected) Or click Y Normal Click Show Plane
60 Create Slice Click RectGrid2.vtk in Pipeline Browser Common -> Slice Drag arrow point around to front of surface (arrow turns red when selected) Or click Y Normal Click Show Plane
61 Create Slice Click RectGrid2.vtk in Pipeline Browser Common -> Slice Drag arrow point around to front of surface (arrow turns red when selected) Or click Y Normal Click Show Plane
62 Create Slice Click RectGrid2.vtk in Pipeline Browser Common -> Slice Drag arrow point around to front of surface (arrow turns red when selected) Or click Y Normal Click Show Plane
63 Background Color Click the button above the 3D view Click Choose Color Drag box to black Click blue Ok Click blue Ok

64 Background Color Click the button above the 3D view Click Choose Color Drag box to black Click blue Ok Click blue Ok
65 Background Color Click the button above the 3D view Click Choose Color Drag box to black Click blue Ok Click blue Ok

66 Background Color Click the button above the 3D view Click Choose Color Drag box to black Click blue Ok Click blue Ok
67 Background Color Click the button above the 3D view Click Choose Color Drag box to black Click blue Ok Click blue Ok
68 Object Opacity Click Slice2 in Pipeline Browser Click Display Change Opacity to > Enter Click Color by vectors Click eye next to RectGrid2.vtk to hide box outline
69 Object Opacity Click Slice2 in Pipeline Browser Click Display Change Opacity to > Enter Click Color by vectors Click eye next to RectGrid2.vtk to hide box outline
70 Object Opacity Click Slice2 in Pipeline Browser Click Display Change Opacity to > Enter Click Color by vectors Click eye next to RectGrid2.vtk to hide box outline
71 Object Opacity Click Slice2 in Pipeline Browser Click Display Change Opacity to > Enter Click Color by vectors Click eye next to RectGrid2.vtk to hide box outline
72 Object Opacity Click Slice2 in Pipeline Browser Click Display Change Opacity to > Enter Click Color by vectors Click eye next to RectGrid2.vtk to hide box outline
73 Enable Color Legend Click Display Click Edit Color Map Click Color Legend Click Show Color Legend Click -> Blue Close Select Color Legend (notice white rectangle) and move to top of 3D viewer
 and move to top of 3D")
74 Enable Color Legend Click Display Click Edit Color Map Click Color Legend Click Show Color Legend Click -> Blue Close Select Color Legend (notice white rectangle) and move to top of 3D viewer
75 Enable Color Legend Click Display Click Edit Color Map Click Color Legend Click Show Color Legend Click -> Blue Close Select Color Legend (notice white rectangle) and move to top of 3D viewer
76 Enable Color Legend Click Display Click Edit Color Map Click Color Legend Click Show Color Legend Click -> Blue Close Select Color Legend (notice white rectangle) and move to top of 3D viewer
77 Enable Color Legend Click Display Click Edit Color Map Click Color Legend Click Show Color Legend Click -> Blue Close Select Color Legend (notice white rectangle) and move to top of 3D viewer

78 Create Volume Rendering Click RectGrid2.vtk in Pipeline Browser Alphabetical -> Tetrahedralize Click -> Apply Click Display Click Representation Select Volume Click -> Edit Color Map (To edit transfer function)
79 Create Volume Rendering Click RectGrid2.vtk in Pipeline Browser Alphabetical -> Tetrahedralize Click -> Apply Click Display Click Representation Select Volume Click -> Edit Color Map (To edit transfer function)
80 Create Volume Rendering Click RectGrid2.vtk in Pipeline Browser Alphabetical -> Tetrahedralize Click -> Apply Click Display Click Representation Select Volume Click -> Edit Color Map (To edit transfer function)
81 Create Volume Rendering Click RectGrid2.vtk in Pipeline Browser Alphabetical -> Tetrahedralize Click -> Apply Click Display Click Representation Select Volume Click -> Edit Color Map (To edit transfer function)

82 Create Volume Rendering Click RectGrid2.vtk in Pipeline Browser Alphabetical -> Tetrahedralize Click -> Apply Click Display Click Representation Select Volume Click -> Edit Color Map (to edit transfer function)
83
84 Questions? More tutorials available: Tutorial
Insight VisREU Site. Agenda. Introduction to Scientific Visualization Using 6/16/2015. The purpose of visualization is insight, not pictures.
 2015 VisREU Site Introduction to Scientific Visualization Using Vetria L. Byrd, Director Advanced Visualization VisREU Site Coordinator REU Site Sponsored by NSF ACI Award 1359223 Introduction to SciVis(High
Data analysis with ParaView CSMP Workshop 2009 Gillian Gruen
 Data analysis with ParaView 3.4.0 CSMP Workshop 2009 Gillian Gruen How to...... display a data set ( Contour, Glyph, Clip, Slice) be efficient in displaying similar data sets ( work with Lookmarks )...
Scientific Visualization An Introduction
 Scientific Visualization An Introduction Featuring Vetria L. Byrd, PhD Assistant Professor Research and Technology Development Conference Missouri S&T September 13, 2016 RTD 2016 Thank You! Missouri S&T
Introduction to Visualization on Stampede
 Introduction to Visualization on Stampede Aaron Birkland Cornell CAC With contributions from TACC visualization training materials Parallel Computing on Stampede June 11, 2013 From data to Insight Data
Introduction to Visualization: ParaView. Dan Mazur, McGill HPC Aug 20, 2013
 Introduction to Visualization: ParaView Dan Mazur, McGill HPC daniel.mazur@mcgill.ca Aug 20, 2013 1 Outline What is scientific visualization? ParaView and visualization pipelines data import 1D, 2D, 3D
Large Scale Visualization with ParaView 3
 Abstract Large Scale Visualization with ParaView 3 Kenneth Moreland 1 and John Greenfield 2 Sandia National Laboratories ParaView is a powerful open-source turnkey application for analyzing and visualizing
Visualization in the Sciences Hands-On Workshop
 Visualization in the Sciences, Hands-On Workshop Part 1: Implement various techniques in Paraview Each of these will start by loading a data set that you are going to display. Copy the McNeil_CNTs.vtk
Introduction to scientific visualization with ParaView
 Introduction to scientific visualization with ParaView Paul Melis SURFsara Visualization group paul.melis@surfsara.nl (some slides courtesy of Robert Belleman, UvA) Outline Introduction, pipeline and data
Introduction to scientific visualization with ParaView
 Introduction to scientific visualization with ParaView Tijs de Kler SURFsara Visualization group Tijs.dekler@surfsara.nl (some slides courtesy of Robert Belleman, UvA) Outline Pipeline and data model (10
EnSight 10 Basic Training Exercises
 Exercise 1: Color the Comanche helicopter EnSight 10 Basic Training Exercises 1. Start EnSight 10 and press the Cancel button on the Welcome screen 2. Click on File -> Open and select the Simple Interface
Introduction to Scientific Visualization
 Introduction to Scientific Visualization Aaron Birkland Cornell Center for Advanced Computing Data Analysis on Ranger January 2012 A lab-intensive workshop Start off with basic concepts Data, transformations,
Paraview: A (novice) user perspective
 user perspective") PARAVIEW Copenhagen 2008-1 Paraview: A (novice) user perspective Rony Keppens Centre for Plasma-Astrophysics, K.U.Leuven (Belgium) & FOM-Institute for Plasma Physics Rijnhuizen & Astronomical Institute,
PARAVIEW Copenhagen 2008-1 Paraview: A (novice) user perspective Rony Keppens Centre for Plasma-Astrophysics, K.U.Leuven (Belgium) & FOM-Institute for Plasma Physics Rijnhuizen & Astronomical Institute,
Scalable and Distributed Visualization using ParaView
 Scalable and Distributed Visualization using ParaView Eric A. Wernert, Ph.D. Senior Manager & Scientist, Advanced Visualization Lab Pervasive Technology Institute, Indiana University Big Data for Science
Visualization Of A Deterministic Radiation Transport Model Using Standard Visualization Tools
 Visualization Of A Deterministic Radiation Transport Model Using Standard Visualization Tools James A. Galbraith and L. Eric Greenwade, Idaho National Engineering and Environmental Laboratory ABSTRACT:
VisIt. Hank Childs October 10, IEEE Visualization Tutorial
 VisIt IEEE Visualization Tutorial Hank Childs October 10, 2004 The VisIt Team: Eric Brugger (project leader), Kathleen Bonnell, Hank Childs, Jeremy Meredith, Mark Miller, and Brad Gas bubble subjected
Post-processing in parafoam. Håkan Nilsson, Chalmers / Applied Mechanics / Fluid Dynamics 57
 Post-processing in parafoam Håkan Nilsson, Chalmers / Applied Mechanics / Fluid Dynamics 57 Post-processing in parafoam parafoam is the main post-processor distributed with OpenFOAM. As previously mentioned,
VIEWZ 1.3 USER MANUAL
 VIEWZ 1.3 USER MANUAL 2007-08 Zeus Numerix ViewZ 1.3.0 User Manual Revision: 200806061429 The latest copy of this PDF may be downloaded from the website. An online (HTML) version is also available. Zeus
Lecture overview. Visualisatie BMT. Fundamental algorithms. Visualization pipeline. Structural classification - 1. Structural classification - 2
 Visualisatie BMT Fundamental algorithms Arjan Kok a.j.f.kok@tue.nl Lecture overview Classification of algorithms Scalar algorithms Vector algorithms Tensor algorithms Modeling algorithms 1 2 Visualization
McIDAS-V Tutorial Displaying Gridded Data updated June 2015 (software version 1.5)
") McIDAS-V Tutorial Displaying Gridded Data updated June 2015 (software version 1.5) McIDAS-V is a free, open source, visualization and data analysis software package that is the next generation in SSEC's
McIDAS-V Tutorial Displaying Gridded Data updated June 2015 (software version 1.5) McIDAS-V is a free, open source, visualization and data analysis software package that is the next generation in SSEC's
3D Data visualization with Mayavi and TVTK
 3D Data visualization with Mayavi and TVTK Prabhu Ramachandran Department of Aerospace Engineering IIT Bombay Advanced tutorials at SciPy09 Caltech, Pasadena Aug. 18, 2009 Prabhu Ramachandran (IIT Bombay)
Post-processing in parafoam (ParaView-5.0.1)
") Post-processing in parafoam (ParaView-5.0.1) The 2018 installation instructions are for ParaView-5.4.1, and for the native/built-in reader. Differences will be pointed out. Note that in some cases there
Post-processing in parafoam (ParaView-5.0.1) The 2018 installation instructions are for ParaView-5.4.1, and for the native/built-in reader. Differences will be pointed out. Note that in some cases there
McIDAS-V Tutorial Displaying Gridded Data updated January 2016 (software version 1.5)
") McIDAS-V Tutorial Displaying Gridded Data updated January 2016 (software version 1.5) McIDAS-V is a free, open source, visualization and data analysis software package that is the next generation in SSEC's
McIDAS-V Tutorial Displaying Gridded Data updated January 2016 (software version 1.5) McIDAS-V is a free, open source, visualization and data analysis software package that is the next generation in SSEC's
RhinoCFD Tutorial. Flow Past a Sphere
 RhinoCFD Tutorial Flow Past a Sphere RhinoCFD Ocial document produced by CHAM September 26, 2017 Introduction Flow Past a Sphere This tutorial will describe a simple calculation of ow around a sphere and
In-Situ Data Analysis and Visualization: ParaView, Calalyst and VTK-m
 In-Situ Data Analysis and Visualization: ParaView, Calalyst and VTK-m GTC, San Jose, CA March, 2015 Robert Maynard Marcus D. Hanwell 1 Agenda Introduction to ParaView Catalyst Run example Catalyst Script
itools Tutorial Three
 itools Tutorial Three A 3D Multiplanar Viewer Creating a 3D Multiplaner Viewer This tutorial assumes the user has a basic understanding of itools. If you are a beginning itools user, it is recommended
Visualisation of uncertainty. Kai-Mikael Jää-Aro
 Visualisation of uncertainty Kai-Mikael Jää-Aro Why is this important? Visualising uncertainty Means and Methods Scalar data Vector data Volume data Generic methods Let us talk about the weather A weather
The Preparing for Success Online Mapping Tool
 The Preparing for Success Online Mapping Tool Baker Polito Administration The Executive Office of Housing and Economic Development and MassGIS Questions & Comments? Please contact MassWorks@state.ma.us
Introduction to Scientific Visualization
 CS53000 - Spring 2018 Introduction to Scientific Visualization Introduction to January 11, 2018 The Visualization Toolkit Open source library for Visualization Computer Graphics Imaging Written in C++
Elmer. Alternative Pre-processing tools. ElmerTeam CSC IT Center for Science
 Elmer Alternative Pre-processing tools ElmerTeam CSC IT Center for Science Mesh generation capabilities of Elmer suite ElmerGrid native generation of simple structured meshes ElmerGUI plugins for tetgen,
Post-processing utilities in Elmer
 Post-processing utilities in Elmer Peter Råback ElmerTeam CSC IT Center for Science PATC course on parallel workflows Stockholm, 4-6.12.2013 Alternative postprocessors for Elmer Open source ElmerPost Postprocessor
Scalar Visualization
 Scalar Visualization Visualizing scalar data Popular scalar visualization techniques Color mapping Contouring Height plots outline Recap of Chap 4: Visualization Pipeline 1. Data Importing 2. Data Filtering
ANSYS AIM Tutorial Thermal Stresses in a Bar
 ANSYS AIM Tutorial Thermal Stresses in a Bar Author(s): Sebastian Vecchi, ANSYS Created using ANSYS AIM 18.1 Problem Specification Pre-Analysis & Start Up Pre-Analysis Start-Up Geometry Draw Geometry Create
ImageVis3D "Hands On"-Session
 ImageVis3D "Hands On"-Session Center for Integrative Biomedical Computing 2009 Workshop, Northeastern University 1 1. The current state of ImageVis3D Remember : 1. If you find any problems in ImageVis3D,
Introduction to Python and VTK
 Introduction to Python and VTK Scientific Visualization, HT 2013 Lecture 2 Johan Nysjö Centre for Image analysis Swedish University of Agricultural Sciences Uppsala University 2 About me PhD student in
Data Representation in Visualisation
 Data Representation in Visualisation Visualisation Lecture 4 Taku Komura Institute for Perception, Action & Behaviour School of Informatics Taku Komura Data Representation 1 Data Representation We have
v UGrid Clipping GMS 10.3 Tutorial Using Clipping display option to visualize UGrid data Prerequisite Tutorials Getting Started
 v. 10.3 GMS 10.3 Tutorial Using Clipping display option to visualize UGrid data Objectives This tutorial describes the UGrid clipping tool. The UGrid clipping tool can be used to cut away a portion of
What is visualization? Why is it important?
 What is visualization? Why is it important? What does visualization do? What is the difference between scientific data and information data Visualization Pipeline Visualization Pipeline Overview Data acquisition
11/1/13. Visualization. Scientific Visualization. Types of Data. Height Field. Contour Curves. Meshes
 CSCI 420 Computer Graphics Lecture 26 Visualization Height Fields and Contours Scalar Fields Volume Rendering Vector Fields [Angel Ch. 2.11] Jernej Barbic University of Southern California Scientific Visualization
Visualization. CSCI 420 Computer Graphics Lecture 26
 CSCI 420 Computer Graphics Lecture 26 Visualization Height Fields and Contours Scalar Fields Volume Rendering Vector Fields [Angel Ch. 11] Jernej Barbic University of Southern California 1 Scientific Visualization
Visualization Plugin for ParaView
 Alexey I. Baranov Visualization Plugin for ParaView version 2.0 Springer Contents 1 Visualization with ParaView..................................... 5 1.1 ParaView plugin installation.................................
Saturn User Manual. Rubén Cárdenes. 29th January 2010 Image Processing Laboratory, University of Valladolid. Abstract
 Saturn User Manual Rubén Cárdenes 29th January 2010 Image Processing Laboratory, University of Valladolid Abstract Saturn is a software package for DTI processing and visualization, provided with a graphic
GiD v12 news. GiD Developer Team: Miguel Pasenau, Enrique Escolano, Jorge Suit Pérez, Abel Coll, Adrià Melendo and Anna Monros
 GiD v12 news GiD Developer Team: Miguel Pasenau, Enrique Escolano, Jorge Suit Pérez, Abel Coll, Adrià Melendo and Anna Monros New preferences window New preferences window: Tree to organize the different
Copyright GeoSLAM Viewer User Guide 2017 GeoSLAM Ltd. All rights reserved. Version GeoSLAM Ltd 1 GeoSLAM Viewer User Guide v1.0.
 Copyright GeoSLAM Viewer User Guide 2017 GeoSLAM Ltd. All rights reserved. Version 1.0.0 2017 GeoSLAM Ltd 1 GeoSLAM Viewer User Guide v1.0.0 2017 GeoSLAM Ltd 2 GeoSLAM Viewer User Guide v1.0.0 CONTENTS
VRX: Virtual Reality explorer Toolkit v A brief system specification -
 VRX: Virtual Reality explorer Toolkit v. 2.0 - A brief system specification - Michal Koutek, Email: M.Koutek@ewi.tudelft.nl VR and Visualization Group, Faculty of Electrical Engineering, Mathematics and
methods of computational science visualization day ii - bottlenecks/parallel-viz santiago v lombeyda center for advanced computing research caltech
 methods of computational science visualization day ii - bottlenecks/parallel-viz santiago v lombeyda center for advanced computing research caltech quick review: THE VISUALIZATION PROCESS usual visualization
GLview Inova Software Suite
 GLview Inova Software Suite The GLview Visualization Concept The GLview Software Suite consists of software components for visualization of engineering data that can satisfy the most demanding requirements
7/27/10. CScADS : Scientific Data and Analytics for Petascale Computing Workshop. Outline. About ParaView. Short Tutorial Current Work in Progress
 About ParaView CScADS : Scientific Data and Analytics for Petascale Computing Workshop Outline About ParaView Short Tutorial Current Work in Progress 1 History (http://www.paraview.org/wiki/paraview_release_notes
VisIVO Extracting Galaxies
 VO Day Usecase 4 VisIVO Extracting Galaxies The result of a Cosmological N Body SPH simulation is a set of millions (sometimes billions) of particles. From this complex distribution, we show how we can
Advanced Visualization Techniques
 Advanced Visualization Techniques Kelly Gaither Texas Advanced Computing Center UT/Portugal Summer Institute Coimbra, Portugal July 17, 2008 Topics Covered Remote and Collaborative Visualization EnVision
Visualization Computer Graphics I Lecture 20
 15-462 Computer Graphics I Lecture 20 Visualization Height Fields and Contours Scalar Fields Volume Rendering Vector Fields [Angel Ch. 12] November 20, 2003 Doug James Carnegie Mellon University http://www.cs.cmu.edu/~djames/15-462/fall03
Lecture Topic Projects
 Lecture Topic Projects 1 Intro, schedule, and logistics 2 Applications of visual analytics, data types 3 Data sources and preparation Project 1 out 4 Data reduction, similarity & distance, data augmentation
HPC Visualization with EnSight
 HPC Visualization with EnSight Beijing 2010.10.27 Aric Meyer Marketing Director, Asia & Pacific CEI Computational Engineering International, Inc. Founded in 1994 out of Cray Research Headquarters in Raleigh,
Visualization Toolkit (VTK) An Introduction
 An Introduction") Visualization Toolkit (VTK) An Introduction An open source, freely available software system for 3D computer graphics, image processing, and visualization Implemented as a C++ class library, with interpreted
Visualization Toolkit (VTK) An Introduction An open source, freely available software system for 3D computer graphics, image processing, and visualization Implemented as a C++ class library, with interpreted
Introductory OpenFOAM Course From 17th to 21st February, Matteo Bargiacchi
 Introductory OpenFOAM Course From 17th to 21st February, 2014 Matteo Bargiacchi bargiacchi@wolfdynamics.com This offering is not approved or endorsed by OpenCFD Limited, the producer of the OpenFOAM software
Development Authority of the North Country (DANC) Internet Mapping Application Instructions Public Viewer 1. Purpose. 2. Logging-in. 3.
 Internet Mapping Application Instructions Public Viewer 1. Purpose. 2. Logging-in. 3.") Development Authority of the North Country (DANC) Internet Mapping Application Instructions Public Viewer 1. Purpose The purpose of this document is to outline basic functionality of the DANC Internet
Development Authority of the North Country (DANC) Internet Mapping Application Instructions Public Viewer 1. Purpose The purpose of this document is to outline basic functionality of the DANC Internet
CIS 467/602-01: Data Visualization
 CIS 467/602-01: Data Visualization Vector Field Visualization Dr. David Koop Fields Tables Networks & Trees Fields Geometry Clusters, Sets, Lists Items Items (nodes) Grids Items Items Attributes Links
Visualization. Images are used to aid in understanding of data. Height Fields and Contours Scalar Fields Volume Rendering Vector Fields [chapter 26]
![Visualization. Images are used to aid in understanding of data. Height Fields and Contours Scalar Fields Volume Rendering Vector Fields [chapter 26]](/thumbs/74/70771954.jpg "Visualization. Images are used to aid in understanding of data. Height Fields and Contours Scalar Fields Volume Rendering Vector Fields [chapter 26]") Visualization Images are used to aid in understanding of data Height Fields and Contours Scalar Fields Volume Rendering Vector Fields [chapter 26] Tumor SCI, Utah Scientific Visualization Visualize large
Visualization Images are used to aid in understanding of data Height Fields and Contours Scalar Fields Volume Rendering Vector Fields [chapter 26] Tumor SCI, Utah Scientific Visualization Visualize large
VisIt: Visualization and Analysis using Python. VisIt developers from Brad Whitlock NNSA/ASC, Office of Science/SciDAC, Cyrus Harrison
 VisIt: Visualization and Analysis using Python Hank Childs VisIt developers from Brad Whitlock NNSA/ASC, Office of Science/SciDAC, Cyrus Harrison Office of Nuclear Energy/AFCI Presented at: SIAM CSE09
Office 2007/2010 Conversion
 Instructor Resources C H A P T E R 4 Perspective, Scene Design, and Basic Animation Office 2007/2010 Conversion In general, the existing directions related to Microsoft Office products contain specific
Volume Illumination & Vector Field Visualisation
 Volume Illumination & Vector Field Visualisation Visualisation Lecture 11 Institute for Perception, Action & Behaviour School of Informatics Volume Illumination & Vector Vis. 1 Previously : Volume Rendering
A Broad Overview of Scientific Visualization with a Focus on Geophysical Turbulence Simulation Data (SciVis
 A Broad Overview of Scientific Visualization with a Focus on Geophysical Turbulence Simulation Data (SciVis 101 for Turbulence Researchers) John Clyne clyne@ucar.edu Examples: Medicine Examples: Biology
WWW home page:
 alexander.pletzer@noaa.gov, WWW home page: http://ncvtk.sf.net/ 1 Ncvtk: A program for visualizing planetary data Alexander Pletzer 1,4, Remik Ziemlinski 2,4, and Jared Cohen 3,4 1 RS Information Systems
House Build Tutorial NAME: GRADE: ARTD 240 3D Modeling & Animation Deborah Ciccarelli, Assistant Professor
 ARTD 240 3D Modeling & Animation Deborah Ciccarelli, Assistant Professor NAME: GRADE: House Build Tutorial Goal: Create a model of a house by referencing drafts of a front and side elevation. Follow the
Vector Visualization
 Vector Visualization Vector Visulization Divergence and Vorticity Vector Glyphs Vector Color Coding Displacement Plots Stream Objects Texture-Based Vector Visualization Simplified Representation of Vector
CIS 467/602-01: Data Visualization
 CIS 467/60-01: Data Visualization Isosurfacing and Volume Rendering Dr. David Koop Fields and Grids Fields: values come from a continuous domain, infinitely many values - Sampled at certain positions to
Chapter 24. Creating Surfaces for Displaying and Reporting Data
 Chapter 24. Creating Surfaces for Displaying and Reporting Data FLUENT allows you to select portions of the domain to be used for visualizing the flow field. The domain portions are called surfaces, and
Visualization Computer Graphics I Lecture 20
 15-462 Computer Graphics I Lecture 20 Visualization Height Fields and Contours Scalar Fields Volume Rendering Vector Fields [Angel Ch. 12] April 15, 2003 Frank Pfenning Carnegie Mellon University http://www.cs.cmu.edu/~fp/courses/graphics/
Height Fields and Contours Scalar Fields Volume Rendering Vector Fields [Angel Ch. 12] April 23, 2002 Frank Pfenning Carnegie Mellon University
![Height Fields and Contours Scalar Fields Volume Rendering Vector Fields [Angel Ch. 12] April 23, 2002 Frank Pfenning Carnegie Mellon University](/thumbs/90/102611276.jpg "Height Fields and Contours Scalar Fields Volume Rendering Vector Fields [Angel Ch. 12] April 23, 2002 Frank Pfenning Carnegie Mellon University") 15-462 Computer Graphics I Lecture 21 Visualization Height Fields and Contours Scalar Fields Volume Rendering Vector Fields [Angel Ch. 12] April 23, 2002 Frank Pfenning Carnegie Mellon University http://www.cs.cmu.edu/~fp/courses/graphics/
15-462 Computer Graphics I Lecture 21 Visualization Height Fields and Contours Scalar Fields Volume Rendering Vector Fields [Angel Ch. 12] April 23, 2002 Frank Pfenning Carnegie Mellon University http://www.cs.cmu.edu/~fp/courses/graphics/
Getting Started with DADiSP
 Section 1: Welcome to DADiSP Getting Started with DADiSP This guide is designed to introduce you to the DADiSP environment. It gives you the opportunity to build and manipulate your own sample Worksheets
Step by Step GIS. Section 1
 Step by Step GIS Section 1 Contact the web page given below for the data required to do the exercises (http://www.pasda.psu.edu/default.asp) Before beginning the tutorials please visit the Preparation
Scientific visualization concepts
 Scientific visualization concepts Luigi Calori Slides material from: Alex Telea, Groningen University: www.cs.rug.nl/svcg Kitware: www.kitware.com Sandia National Laboratories Argonne National Laboratory
vdview the VisionX image display tool Vdview Basic Overview
 the VisionX image display tool VDV 1 VDV 2 VDV 4 : is the main VisionXi image display program that provides for precise image inspection and visualization.. Pm=2 VDV lg Vdview Basic Overview This document
Exercise One: Creating a Title 3D Effect
 1 Tutorials 2 Exercise One: Creating a Title 3D Effect The exercises in this section are designed to give you a hands-on introduction to the Boris Title Generators. You will need a project with some captured
Voxler. Getting Started Guide. 3D Data Visualization
 Voxler Getting Started Guide 3D Data Visualization Golden Software, Inc. 809 14 th Street, Golden, Colorado 80401-1866, U.S.A. Phone: 303-279-1021 Fax: 303-279-0909 www.goldensoftware.com COPYRIGHT NOTICE
Lecture Topic Projects 1 Intro, schedule, and logistics 2 Applications of visual analytics, basic tasks, data types 3 Introduction to D3, basic vis
 Lecture Topic Projects 1 Intro, schedule, and logistics 2 Applications of visual analytics, basic tasks, data types 3 Introduction to D3, basic vis techniques for non-spatial data Project #1 out 4 Data
SCIENTIFIC VISUALIZATION ON GPU CLUSTERS PETER MESSMER, NVIDIA
 SCIENTIFIC VISUALIZATION ON GPU CLUSTERS PETER MESSMER, NVIDIA Visualization Rendering Visualization Isosurfaces, Isovolumes Field Operators (Gradient, Curl,.. ) Coordinate transformations Feature extraction
Contouring and Isosurfaces. Ronald Peikert SciVis Contouring 2-1
 Contouring and Isosurfaces Ronald Peikert SciVis 2007 - Contouring 2-1 What are contours? Set of points where the scalar field s has a given value c: Examples in 2D: height contours on maps isobars on
Tutorial 1: Standard usage
 Introduction This tutorial details the following steps: importing an existing data set, editing the data, saving the project, running and monitoring simulation, viewing results vectors, and creating reports.
Tutorial 6. Pumping Well and River
 Tutorial 6 Pumping Well and River Table of Contents Objective. 1 Step-by-Step Procedure... 2 Section 1 Data Input. 2 Step 1: Open Adaptive Groundwater Input (.agw) File. 2 Step 2: Pumping Well Design Database
Search Results Tabs. List Tab Options
 Search Results Tabs The Search Results screen is sectioned by tabs. These tabs contain information and tools that are vital in how you configure listing information to package and sell to your clients.
Tutorial 2: Modifying the Data Displayed in ArcGIS
 Tutorial 2: Modifying the Data Displayed in ArcGIS For this tutorial, download the facilities listed in the Toxic Release Inventory from TOXMAP and the New Jersey county boundaries from the New Jersey
Utilisation de VTK/ParaView pour la visualization de gros volumes de donnees
 Outline Some strategies to deal with large data Utilisation de VTK/ParaView pour la visualization de gros volumes de donnees Jean M. Favre Responsable du groupe de visualisation How do VTK and ParaView
Visualization ToolKit (VTK) Part I
 Part I") Visualization ToolKit (VTK) Part I Weiguang Guan RHPCS, ABB 131-G Email: guanw@mcmaster.ca Phone: 905-525-9140 x 22540 Outline Overview Installation Typical structure of a VTK application Visualization
Visualization ToolKit (VTK) Part I Weiguang Guan RHPCS, ABB 131-G Email: guanw@mcmaster.ca Phone: 905-525-9140 x 22540 Outline Overview Installation Typical structure of a VTK application Visualization
BD CellQuest Pro Analysis Tutorial
 BD CellQuest Pro Analysis Tutorial Introduction This tutorial guides you through a CellQuest Pro Analysis run like the one demonstrated in the CellQuest Pro Analysis Movie on the BD FACStation Software
Visualisation : Lecture 1. So what is visualisation? Visualisation
 So what is visualisation? UG4 / M.Sc. Course 2006 toby.breckon@ed.ac.uk Computer Vision Lab. Institute for Perception, Action & Behaviour Introducing 1 Application of interactive 3D computer graphics to
Overview and Introduction to Scientific Visualization. Texas Advanced Computing Center The University of Texas at Austin
 Overview and Introduction to Scientific Visualization Texas Advanced Computing Center The University of Texas at Austin Scientific Visualization The purpose of computing is insight not numbers. -- R. W.
Lecture overview. Visualisatie BMT. Vector algorithms. Vector algorithms. Time animation. Time animation
 Visualisatie BMT Lecture overview Vector algorithms Tensor algorithms Modeling algorithms Algorithms - 2 Arjan Kok a.j.f.kok@tue.nl 1 2 Vector algorithms Vector 2 or 3 dimensional representation of direction
VisIt Overview. VACET: Chief SW Engineer ASC: V&V Shape Char. Lead. Hank Childs. Supercomputing 2006 Tampa, Florida November 13, 2006
 VisIt Overview Hank Childs VACET: Chief SW Engineer ASC: V&V Shape Char. Lead Supercomputing 2006 Tampa, Florida November 13, 2006 27B element Rayleigh-Taylor Instability (MIRANDA, BG/L) This is UCRL-PRES-226373
Introduction to Scientific Visualization Past, Present and Future
 Introduction to Scientific Visualization Past, Present and Future Tobias Schiebeck Open to Europe Intensive Programme TRABHCI 29 th March - 9 th April 2011 Universidad Politécnica de Valencia Overview
Volume Visualization. Volume Data. Volume Data. Tutorials Applied Visualizaton Summer Term 2009 Part VII - 3D Scalar Fields
 Tutorials Applied Visualizaton Summer Term 2009 Part VII - 3D Scalar Fields 3D Scalar Fields Essential information in the interior Can not be described by geometric representation Fire, clouds, gaseous
Please be aware, the online demonstration conversion tool gives a forecast of potential
 Demonstration Conversion Tool Instructions Please be aware, the online demonstration conversion tool gives a forecast of potential conversion results based on a snapshot in time. Claim locations or claim
2 Solutions Chapter 3. Chapter 3: Practice Example 1
 1 Solutions This section includes the step by step solutions for the practice exercise for the following chapters and sections: Chapter 3 Chapter 4 Chapter 5 Chapter 11: Rainbow Springs sample test Final
Display Layers in Geosoft 3D View
 Use the New 2D/3D Workflow features in Target for ArcGIS In Target for ArcGIS version 3.5, there are three new interconnected features that make integrating 2D and 3D data in plan and section maps easier.
Scalar Data. Visualization Torsten Möller. Weiskopf/Machiraju/Möller
 Scalar Data Visualization Torsten Möller Weiskopf/Machiraju/Möller Overview Basic strategies Function plots and height fields Isolines Color coding Volume visualization (overview) Classification Segmentation
Full Search Map Tab. This map is the result of selecting the Map tab within Full Search.
 Full Search Map Tab This map is the result of selecting the Map tab within Full Search. This map can be used when defining your parameters starting from a Full Search. Once you have entered your desired
Flow Visualisation - Background. CITS4241 Visualisation Lectures 20 and 21
 CITS4241 Visualisation Lectures 20 and 21 Flow Visualisation Flow visualisation is important in both science and engineering From a "theoretical" study of o turbulence or o a fusion reactor plasma, to
Chris Sewell Li-Ta Lo James Ahrens Los Alamos National Laboratory
 Portability and Performance for Visualization and Analysis Operators Using the Data-Parallel PISTON Framework Chris Sewell Li-Ta Lo James Ahrens Los Alamos National Laboratory Outline! Motivation Portability
Step 3 Step 4. Step 8. Step 9
 This is an excerpt from Exercise 10, Scaled Output and the Layout Window, of the course manual provided for the McElhanney course MapInfo Professional and Encom Discover Mineral Exploration Module 1. Scaled
1.1: Introduction to Fusion 360
 .: Introduction to Fusion 360 Fusion 360 is a cloud- based CAD/CAM tool for collaborative product development. The tools in Fusion enable exploration and iteration on product ideas and collaboration within
Advanced Graphics: NOMAD Summer. Interactive analysis and visualization of complex datasets
 NOMAD Summer A hands-on course on tools for novel-materials discovery September 25-29, 2017, Berlin Advanced Graphics: Interactive analysis and visualization of complex datasets Michele Compostella Markus