Sentinel-1 Toolbox. Interferometry Tutorial Issued March 2015 Updated August Luis Veci
|
|
|
- Tyrone Collins
- 6 years ago
- Views:
Transcription


1 Sentinel-1 Toolbox Interferometry Tutorial Issued March 2015 Updated August 2016 Luis Veci Copyright 2015 Array Systems Computing Inc.

2 Interferometry Tutorial The goal of this tutorial is to provide novice and experienced remote sensing users with step-bystep instructions on interferometric processing with SAR products. In this tutorial you will process a pair of Stripmap Sentinel-1 products using interferometry. What is Interferometry? Interferometric synthetic aperture radar (InSAR) exploits the phase difference between two complex radar SAR observations taken from slightly different sensor positions and extracts information about the earth s surface. A SAR signal contains amplitude and phase information. The amplitude is the strength of the radar response and the phase is the fraction of one complete sine wave cycle (a single SAR wavelength). The phase of the SAR image is determined primarily by the distance between the satellite antenna and the ground targets. By combining the phase of these two images after coregistration, an interferogram can be generated whose phase is highly correlated to the terrain topography. For an introduction to interferometric concepts, please see ESA s InSAR Principles: Guidelines for SAR Interferometry Processing and Interpretation (ESA TM-19). Napa Valley Earthquake The 2014 South Napa earthquake occurred in and around the city of Napa, California on August 24 at 3:20 a.m. local time, measuring at 6.0 on the moment magnitude scale. This is the first earthquake for which the surface deformation has been measured by ESA's Sentinel-1 satellite. Two Stripmap SLC data products are available at the links below. One product is acquired on 7 August and another captured on 31 August. 1SSV_ T _ T142411_001835_001BC1_05AA.SAFE.zip 1SSV_ T _ T142403_002185_002356_C2E5.SAFE.zip 2

3 Opening a Pair of SLC Products In order to perform interferometric processing, the input products should be two or more Single Look Complex (SLC) products over the same area acquired from slightly different satellite positions. The toolbox can support SLC products for InSAR from: SENTINEL-1 RADARSAT-2 TerraSAR-X ENVISAT ASAR ERS 1&2 Cosmo-Skymed ALOS 1&2 Step 1 - Open the products: Use the for the location of the products. Open Product button in the top toolbar and browse Select the manifest.xml file from each Sentinel-1 product folder and press Open Product. If the products are zipped, you may also select the zip files. Opening a Product Step 2 - View the product: In the Products View you will see the opened products. Within the product bands, you will find two bands containing the real (i) and imaginary (q) parts of the complex data. The i and q bands are the bands that are actually in the product. 3


4 Products View The virtual Intensity band is there to assist you in working with complex data. Virtual bands are the result of creating a band using the Band Maths feature. If you hover the mouse over top of the Intensity virtual band, you will see the expression that it consists of. In this case, the Intensity is i x i + q x q. Intensity Band Tool-tip Step 3 - View a band: To view the data, double-click on the Intensity_HH band. Zoom in using the mouse wheel and pan by clicking and dragging the left mouse button. 4

5 Intensity Band Pan and zoom to the hilly area in the middle of the scene. Creating a Subset To reduce the amount of processing needed, you may create a subset around the particular area in which you are interested. Step 4 - Create a subset from the view: Once you have zoomed and panned to your area of interest, right click and select Spatial Subset from View in the context menu. 5

6 Select Spatial Subset from View 6
.")
7 The subset dialog will automatically select the area you were viewing. Specifying a Product Subset By default all bands will be included in the subset. Press OK to create the subset. For InSAR processing, you generally only need one polarization. If you have multiple polarizations in your input product, you may use the subset operator to select only co-polarized bands (HH or VV). Likewise, you could use the BandSelect operator to select all bands for a particular polarization. When the new subset product appears in the products view, press the save button the product. to save 7


8 Coregistering the Data For interferometric processing, two or more images must be coregistered into a stack. One image is selected as the master and the other images are the slaves. The pixels in slave images will be moved to align with the master image to sub-pixel accuracy. Coregistration ensures that each ground target contributes to the same (range, azimuth) pixel in both the master and the slave image. Step 5 - Coregister the images into a stack: Select Coregistration in the Coregistration menu. Select Coregistration Drag and drop the products from the Products View to the table in the Coregistration dialog. Drag and drop first the subset product. This will be your master image. Then drag and drop the other product. This will be your slave image. 8

9 Add Products into the Coregistration Dialog You could also press the Add Opened button to add all products currently open in the Products View. In the Create Stack tab, the bands for the master image and the slave images should already be selected for you based on the order of the products given in the previous table. 9

10 Create Stack For InSAR processing, it is best not to resample the images at this step. Select Resampling Type: NONE and Output Extents of the Master. If you have several products to coregister, you may press Find Optimal Master to search for the best image to use as the master image based on perpendicular and temporal baselines. In the Cross-Correlation tab, specify the number of Ground Control Points (GCPs) to use. The GCPs will be used as the center of a cross correlation window which will find the corresponding position from the slave image to the master image. Trouble shooting: If after processing you receive an error such as "not enough GCPs survived", this means that the software failed to find a good correlation with the current parameters. Try increasing the number of GCPs to possibly If the offset between master and slave images is large, you will need to increase the coarse registration window dimensions to possibly 256 or

11 Define the Correlation Windows In the Warp tab, specify the significance level for outlier removal (RMS threshold) to a pixel accuracy of 0.01 and select the interpolation method. The lower you can get the RMS threshold while having enough GCPs surviving, the better the coregistration result will be. Coregistration accuracy plays a critical role in achieve good interferometric results. The warp polynomial order applies a linear translation for order 1. Higher order warps should only be used when the images have been greatly distorted. 11
12 Specify the Significance Level via the RMS Threshold 12


13 In the Write tab, specify the output folder and the target product name. Specify the output name, format and folder Press Process to begin processing the coregistration. The resulting coregistered stack product will appear in the Products View. Coregistered Stack Product 13


14 To view the results of the coregistration in a colour view, right-click on the product name and select Open RGB Image View. Open RGB Image View In the RGB channel selection dialog, the Intensity bands for both images will automatically be selected. Select the master image in red and slave image in green then press OK. Select master in red and slave in green 14

15 The RGB View can be useful for amplitude change detection. In this image, you will see things that have changed in red or green and things that have not changed in yellow. It is also a visual indication that the coregistration has properly aligned both images. The resulting RGB view should look mostly yellow. Poor registrations will have badly lined up terrain. RGB View What Interferometric Tools are Available? Once the images have been accurately coregistered, you can use the interferometric tools available in the Toolbox including: Range and Azimuth Spectral Filtering Coherence Estimation Interferogram Formation Topographic Phase Removal Phase Filtering Phase Unwrapping Unwrapped Phase to Height Conversion Spectral Filtering Spectral filtering improves the signal-to-noise ratio (SNR) in the interferogram. This noise reduction results from filtering out non overlapping parts of the spectrum. This spectral non overlap in range between master and slave is caused by a slightly different viewing angle of both sensors. The longer the perpendicular baseline is, the smaller the overlapping part. The Range Filter operator filters the spectras of a stack of SLC images in the range direction. This Azimuth Filter operator filters the spectras of stack of SLC images in the azimuth direction. Spectral filtering is optional and may sometimes not affect the data very much. 15


16 Interferogram Formation and Coherence Estimation The interferogram is formed by cross multiplying the master image with the complex conjugate of the slave. The amplitude of both images is multiplied while the phase represents the phase difference between the two images. The interferometric phase of each SAR image pixel would depend only on the difference in the travel paths from each of the two SARs to the considered resolution cell. The interferometric phase variation Δϕ is then proportional to ΔR divided by the transmitted wavelength λ. Step 6 - Form the Interferogram: Select the stack and select Interferogram Formation from the InSAR Products menu. Select Interferogram Formation The phase difference can have contributions from five different sources: Δϕflat is called flat Earth phase which is the phase contribution due to the earth curvature. Δϕelevation is the topographic contribution to the interferometric phase. Δϕdisplacement is the surface deformation contribution to the interferometric phase. 16

17 Δϕatmosphere is the atmospheric contribution to the interferometric phase. It is introduced due to the atmospheric humidity, temperature and pressure change between the two acquisitions. Δϕnoise is the phase noise introduced by temporal change of the scatterers, different look angle, and volume scattering. Contributors to SAR Interferometric Phase Through the interferometric processing, we shall try to eliminate other sources of error to be left with only the contributor of interest which is typically the elevation or the displacement. In the interferogram formation step we shall remove the flat-earth phase. The flat-earth phase is the phase present in the interferometric signal due to the curvature of the reference surface. The flat-earth phase is estimated using the orbital and metadata information and subtracted from the complex interferogram. 17


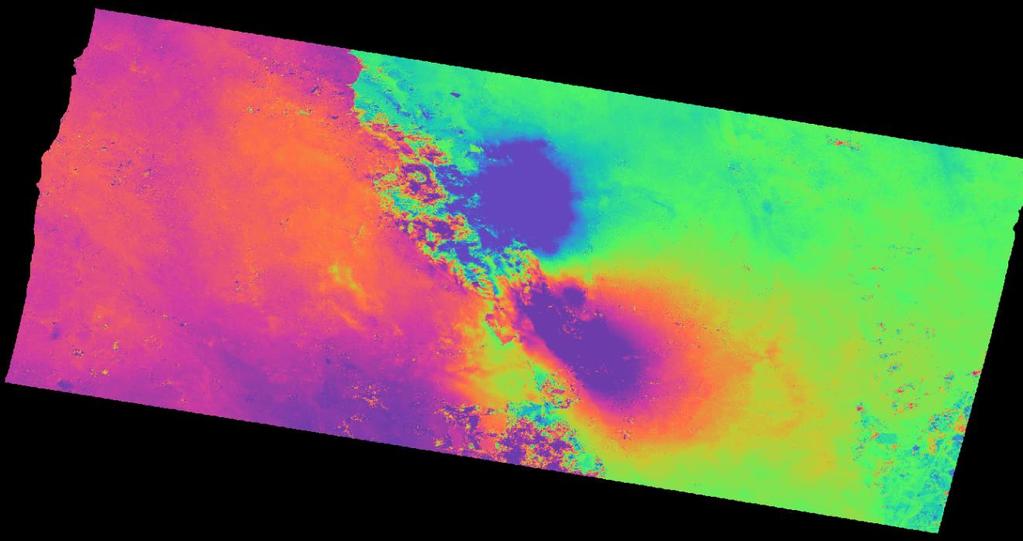
18 Interferogram Dialog The interferogram product produced will contain a band for the interferometric phase. Interferometric Phase Band 18

19 Interferometric Phase Band Interferometric fringes represent a full 2π cycle. Fringes appear on an interferogram as cycles of arbitrary colours, with each cycle representing half the sensor s wavelength. Relative ground movement between two points can be calculated by counting the fringes and multiplying by half of the wavelength. The closer the fringes are together, the greater the strain on the ground. Flat terrain should produce a series of regularly spaced, parallel fringes. Any deviation from a parallel fringe pattern can be interpreted as topographic variation. With the same operator, you may also generate the coherence estimation in the same processing step as the interferogram. The coherence between master and slave images can show you if the images have strong similarities and are therefore good candidates for generating a DEM. Loss of coherence can produce poor interferometric results. 19

20 Loss of coherence could be caused by temporal (time between acquisitions), geometric (orbit errors), volumetric (vegetation) or processing. Coherence Contribution The coherence band shows how similar each pixel is between the slave and master images in a scale from 0 to 1. Areas of high coherence will appear bright. Areas with poor coherence will be dark. In the image, vegetation is shown as having poor coherence and buildings have very high coherence. Coherence Band 20


21 Topographic Phase Removal The Interferogram can then be flattened by removing the topographic phase. The operator will simulate an interferogram based on a reference DEM and subtract it from the processed interferogram. Step 7 - Remove Topographic Phase: Select the Interferogram product and go to the Interferometric Products menu. Select Topographic Phase Removal. Select Topographic Phase Removal 21


22 Topographic Phase Removal Dialog The resulting product will have an interferogram with topographic phase removed and a band for the topographic phase. Topographic Phase 22


23 Topographic Phase Band 23

24 Phase Filtering Topographic Phase Removed Interferometric phase can be corrupted by noise from: Temporal decorrelation Geometric decorrelation Volume scattering Processing error Where there is loss of coherence, the interference pattern is lost. To be able to properly unwrap the phase, the signal-to-noise ratio needs to be increased by filtering the phase. 24


25 Step 8 - Phase Filtering: Select the Interferogram product and go to the InSAR Tools menu. Select Goldstein Phase Filtering. Select Phase Filtering 25

26 Phase Filtering Dialog 26

27 Phase Unwrapping Filtered Phase Band In the interferogram, the interferometric phase is ambiguous and only known within 2π. In order to be able to relate the interferometric phase to the topographic height, the phase must first be unwrapped. The altitude of ambiguity ha is defined as the altitude difference that generates an interferometric phase change of 2π after interferogram flattening. Phase unwrapping solves this ambiguity by integrating phase difference between neighbouring pixels. After deleting any integer number of altitudes of ambiguity (equivalent to an integer number of 2π phase cycles), the phase variation between two points on the flattened interferogram provides a measurement of the actual altitude variation. 27


28 Wrapped Phase and Unwrapped Phase For optimal unwrapping results it is recommended to multi-look (i.e., square) and phase-filter (i.e., increase signal-to-noise and smooth) the interferogram. The quality and reliability of unwrapped results very much depends on the input coherence. Reliable results can only be expected in areas with high coherence. Unwrapped results should be interpreted as a relative height/displacement between two pixels. To obtain absolute estimates, a tie point can be used in the unwrapped phase to height operation. Step 8 Export to Snaphu: Export the filtered flattened interferogram to SNAPHU. Select TOPO mode for DEM generation. Select DEFO for deformation mapping. Export to Snaphu 28

29 Unwrapping with SNAPHU SNAPHU Export SNAPHU is a statistical-cost network-flow algorithm for phase unwrapping developed at Stanford University by Curtis Chen and Howard Zebker. Snaphu is available for Linux only. Linux users simply need to install the software package by apt-get install snaphu Windows users can download a Linux VMWare virtual machine and use it to unwrap the phase. The free VMWare Workstation Player can be downloaded from Open the VMware player and browse for the virtual machine. Edit the virtual machine settings to increase the memory and setup a shared folder between Linux and Windows. 29

30 Edit Virtual Machine Settings Increase the memory to suit your computer. Depending on the size of your images, you may need at least 8GB. 30

31 Increase Memory Under the options tabs, add a shared folder. Select Always Enable. 31

32 Enable a Shared Folder Save the wrapped phase output into the shared folder After starting the Linux virtual machine, open a command terminal and you should see the data in /mnt/hgfs/ Start the virtual machine and login with: Login: sar Password: sar01 Go to the data folder in /mnt/hgfs/ and open the snaphu.conf file. cd /mnt/hgfs/vmshare/data/target_snaphu/ gedit snaphu.conf & 32


33 Copy the snaphu command and paste it into the command terminal and then run it. snaphu -f snaphu.conf Phase_ifg_srd_07Aug2014_31Aug2014.snaphu.img SNAPHU uses an iterative optimization procedure; its execution time depends on the difficulty of the interferogram. Unwrapping can use a lot of memory. If the unwrapping fails due to there being not enough memory, you could create a subset of your area of interest and try with SNAPHU again. SNAPHU Output 33

34 Step 10 Import Snaphu Unwrapped Phase: Open the Unwrapped phase hdr file The opened unwrapped phase will not have any metadata or geocodings. We must apply the Snaphu import to join the wrapped phase product with the unwrap phase product. 34


35 Select Snaphu Import from the interferometric menu. Snaphu Import Select the wrapped phase in the read phase tab. Select the unwrapped phase product in the read unwrapped phase tab. 35
36 Snaphu Import Dialog Process and display the output unwrapped phase. 36

37 Unwrapped Phase 37


38 Step 11 Geocode the product: Apply Terrain Correction to the phase band to geocode the product. Apply Range Doppler Terrain Correction 38

39 Select the wrapped and unwrapped phase bands. Select Phase Bands 39


40 Geocoded Interferogram Geocoded Unwrapped Phase 40


41 For more tutorials visit the Sentinel Toolboxes website Send comments to the SNAP Forum 41
Interferometry Tutorial with RADARSAT-2 Issued March 2014 Last Update November 2017
 Sentinel-1 Toolbox with RADARSAT-2 Issued March 2014 Last Update November 2017 Luis Veci Copyright 2015 Array Systems Computing Inc. http://www.array.ca/ http://step.esa.int with RADARSAT-2 The goal of
Sentinel-1 Toolbox. TOPS Interferometry Tutorial Issued May 2014
 Sentinel-1 Toolbox TOPS Interferometry Tutorial Issued May 2014 Copyright 2015 Array Systems Computing Inc. http://www.array.ca/ https://sentinel.esa.int/web/sentinel/toolboxes Interferometry Tutorial
Sentinel-1 Toolbox. Offset Tracking Tutorial Issued August Jun Lu Luis Veci
 Sentinel-1 Toolbox Offset Tracking Tutorial Issued August 2016 Jun Lu Luis Veci Copyright 2016 Array Systems Computing Inc. http://www.array.ca/ http://step.esa.int Offset Tracking Tutorial The goal of
In addition, the image registration and geocoding functionality is also available as a separate GEO package.
 GAMMA Software information: GAMMA Software supports the entire processing from SAR raw data to products such as digital elevation models, displacement maps and landuse maps. The software is grouped into
Interferometric processing. Rüdiger Gens
 Rüdiger Gens Why InSAR processing? extracting three-dimensional information out of a radar image pair covering the same area digital elevation model change detection 2 Processing chain 3 Processing chain
ALOS PALSAR. Orthorectification Tutorial Issued March 2015 Updated August Luis Veci
 ALOS PALSAR Orthorectification Tutorial Issued March 2015 Updated August 2016 Luis Veci Copyright 2015 Array Systems Computing Inc. http://www.array.ca/ http://step.esa.int ALOS PALSAR Orthorectification
Sentinel-1 InSAR Phase Unwrapping using S1TBX and SNAPHU
 Making remote-sensing data accessible since 1991 Sentinel-1 InSAR Phase Unwrapping using S1TBX and SNAPHU Adapted from the European Space Agency s STEP community platform In this document you will find:
The 2017 InSAR package also provides support for the generation of interferograms for: PALSAR-2, TanDEM-X
 Technical Specifications InSAR The Interferometric SAR (InSAR) package can be used to generate topographic products to characterize digital surface models (DSMs) or deformation products which identify
InSAR Operational and Processing Steps for DEM Generation
 InSAR Operational and Processing Steps for DEM Generation By F. I. Okeke Department of Geoinformatics and Surveying, University of Nigeria, Enugu Campus Tel: 2-80-5627286 Email:francisokeke@yahoo.com Promoting
SAR Interferometry. Dr. Rudi Gens. Alaska SAR Facility
 SAR Interferometry Dr. Rudi Gens Alaska SAR Facility 2 Outline! Relevant terms! Geometry! What does InSAR do?! Why does InSAR work?! Processing chain " Data sets " Coregistration " Interferogram generation
Repeat-pass SAR Interferometry Experiments with Gaofen-3: A Case Study of Ningbo Area
 Repeat-pass SAR Interferometry Experiments with Gaofen-3: A Case Study of Ningbo Area Tao Zhang, Xiaolei Lv, Bing Han, Bin Lei and Jun Hong Key Laboratory of Technology in Geo-spatial Information Processing
Interferometry Module for Digital Elevation Model Generation
 Interferometry Module for Digital Elevation Model Generation In order to fully exploit processes of the Interferometry Module for Digital Elevation Model generation, the European Space Agency (ESA) has
LAND SUBSIDENCE WITH SENTINEL-1 using SNAP
 _p TRAINING KIT HAZA03 LAND SUBSIDENCE WITH SENTINEL-1 using SNAP Table of Contents 1 Introduction... 2 2 Training... 2 2.1 Data used... 2 2.2 Software in RUS environment... 2 3 Step by step... 3 3.1 Data
Generate Glacier Velocity Maps with the Sentinel-1 Toolbox
 Making remote-sensing data accessible since 1991 Generate Glacier Velocity Maps with the Sentinel-1 Toolbox Adapted from the European Space Agency s STEP community platform In this document you will find:
DINSAR: Differential SAR Interferometry
 DINSAR: Differential SAR Interferometry Fabio Rocca 1 SAR interferometric phase: ground motion contribution If a scatterer on the ground slightly changes its relative position in the time interval between
A Correlation Test: What were the interferometric observation conditions?
 A Correlation Test: What were the interferometric observation conditions? Correlation in Practical Systems For Single-Pass Two-Aperture Interferometer Systems System noise and baseline/volumetric decorrelation
Lateral Ground Movement Estimation from Space borne Radar by Differential Interferometry.
 Lateral Ground Movement Estimation from Space borne Radar by Differential Interferometry. Abstract S.Sircar 1, 2, C.Randell 1, D.Power 1, J.Youden 1, E.Gill 2 and P.Han 1 Remote Sensing Group C-CORE 1
InSAR Processing. Sentinel 1 data Case study of subsidence in Mexico city. Marie-Pierre Doin, Cécile Lasserre, Raphaël Grandin, Erwan Pathier
 1 InSAR Processing Sentinel 1 data Case study of subsidence in Mexico city Marie-Pierre Doin, Cécile Lasserre, Raphaël Grandin, Erwan Pathier NSBAS processing chain (based on ROI_PAC): ROI-PAC: Rosen et
Operational process interferometric for the generation of a digital model of ground Applied to the couple of images ERS-1 ERS-2 to the area of Algiers
 Operational process interferometric for the generation of a digital model of ground Applied to the couple of images ERS-1 ERS-2 to the area of Algiers F. Hocine, M.Ouarzeddine, A. elhadj-aissa,, M. elhadj-aissa,,
Individual Interferograms to Stacks!
 Individual Interferograms to Stacks! Piyush Agram! Jet Propulsion Laboratory!! Jun 29, 2015! @UNAVCO! Thanks to my colleagues from JPL, Caltech, Stanford University and from all over the world for providing
Scene Matching on Imagery
 Scene Matching on Imagery There are a plethora of algorithms in existence for automatic scene matching, each with particular strengths and weaknesses SAR scenic matching for interferometry applications
Individual Interferograms to Stacks
 Individual Interferograms to Stacks Piyush Agram Jet Propulsion Laboratory Aug 1, 2016 @UNAVCO Thanks to my colleagues from JPL, Caltech, Stanford University and from all over the world for providing images
GAMMA Interferometric Point Target Analysis Software (IPTA): Users Guide
: Users Guide") GAMMA Interferometric Point Target Analysis Software (IPTA): Users Guide Contents User Handbook Introduction IPTA overview Input data Point list generation SLC point data Differential interferogram point
GAMMA Interferometric Point Target Analysis Software (IPTA): Users Guide Contents User Handbook Introduction IPTA overview Input data Point list generation SLC point data Differential interferogram point
SENTINEL-1 Toolbox. SAR Basics Tutorial Issued March 2015 Updated August Luis Veci
 SENTINEL-1 Toolbox SAR Basics Tutorial Issued March 2015 Updated August 2016 Luis Veci Copyright 2015 Array Systems Computing Inc. http://www.array.ca/ http://step.esa.int SAR Basics Tutorial The goal
Practical work on SAR Interferometry Data Processing using DORIS Software Y.S. Rao CSRE, IIT Bombay
 Practical work on SAR Interferometry Data Processing using DORIS Software Y.S. Rao CSRE, IIT Bombay ysrao@csre.iitb.ac.in Tools : DORIS (Delft Object-Oriented Radar Interferometric Software) is freely
Ice surface velocities using SAR
 Ice surface velocities using SAR Thomas Schellenberger, PhD ESA Cryosphere Remote Sensing Training Course 2018 UNIS Longyearbyen, Svalbard 12 th June 2018 thomas.schellenberger@geo.uio.no Outline Data
PSI Precision, accuracy and validation aspects
 PSI Precision, accuracy and validation aspects Urs Wegmüller Charles Werner Gamma Remote Sensing AG, Gümligen, Switzerland, wegmuller@gamma-rs.ch Contents Aim is to obtain a deeper understanding of what
InSAR DEM; why it is better?
 InSAR DEM; why it is better? What is a DEM? Digital Elevation Model (DEM) refers to the process of demonstrating terrain elevation characteristics in 3-D space, but very often it specifically means the
Ground Subsidence Monitored by L-band Satellite Radar. Interferometry
 Ground Subsidence Monitored by L-band Satellite Radar Interferometry Hsing-Chung Chang, Ming-han Chen, Lijiong Qin, Linlin Ge and Chris Rizos Satellite Navigation And Positioning Group School of Surveying
Interferometric SAR Processing
 Documentation - Theory Interferometric SAR Processing Version 1.0 November 2007 GAMMA Remote Sensing AG, Worbstrasse 225, CH-3073 Gümligen, Switzerland tel: +41-31-951 70 05, fax: +41-31-951 70 08, email:
URBAN FOOTPRINT MAPPING WITH SENTINEL-1 DATA
 URBAN FOOTPRINT MAPPING WITH SENTINEL-1 DATA Data: Sentinel-1A IW SLC 1SSV: S1A_IW_SLC 1SSV_20160102T005143_20160102T005208_009308_00D72A_849D S1A_IW_SLC 1SSV_20160126T005142_20160126T005207_009658_00E14A_49C0
Terrain correction. Backward geocoding. Terrain correction and ortho-rectification. Why geometric terrain correction? Rüdiger Gens
 Terrain correction and ortho-rectification Terrain correction Rüdiger Gens Why geometric terrain correction? Backward geocoding remove effects of side looking geometry of SAR images necessary step to allow
RADARGRAMMETRY AND INTERFEROMETRY SAR FOR DEM GENERATION
 RADARGRAMMETRY AND INTERFEROMETRY SAR FOR DEM GENERATION Jung Hum Yu 1, Xiaojing Li, Linlin Ge, and Hsing-Chung Chang School of Surveying and Spatial Information Systems University of New South Wales,
PolSARpro v4.03 Forest Applications
 PolSARpro v4.03 Forest Applications Laurent Ferro-Famil Lecture on polarimetric SAR Theory and applications to agriculture & vegetation Thursday 19 April, morning Pol-InSAR Tutorial Forest Application
A STATISTICAL-COST APPROACH TO UNWRAPPING THE PHASE OF INSAR TIME SERIES
 A STATISTICAL-COST APPROACH TO UNWRAPPING THE PHASE OF INSAR TIME SERIES Andrew Hooper Delft Institute of Earth Observation and Space Systems, Delft University of Technology, Delft, Netherlands, Email:
Synthetic Aperture Radar Interferometry (InSAR)
") CEE 6100 / CSS 6600 Remote Sensing Fundamentals 1 Synthetic Aperture Radar Interferometry (InSAR) Adapted from and the ESA Interferometric SAR overview by Rocca et al. http://earth.esa.int/workshops/ers97/program-details/speeches/rocca-et-al/
CEE 6100 / CSS 6600 Remote Sensing Fundamentals 1 Synthetic Aperture Radar Interferometry (InSAR) Adapted from and the ESA Interferometric SAR overview by Rocca et al. http://earth.esa.int/workshops/ers97/program-details/speeches/rocca-et-al/
Interferometric Synthetic-Aperture Radar (InSAR) Basics
 Basics") Interferometric Synthetic-Aperture Radar (InSAR) Basics 1 Outline SAR limitations Interferometry SAR interferometry (InSAR) Single-pass InSAR Multipass InSAR InSAR geometry InSAR processing steps Phase
Interferometric Synthetic-Aperture Radar (InSAR) Basics 1 Outline SAR limitations Interferometry SAR interferometry (InSAR) Single-pass InSAR Multipass InSAR InSAR geometry InSAR processing steps Phase
Coherence Based Polarimetric SAR Tomography
 I J C T A, 9(3), 2016, pp. 133-141 International Science Press Coherence Based Polarimetric SAR Tomography P. Saranya*, and K. Vani** Abstract: Synthetic Aperture Radar (SAR) three dimensional image provides
Sentinel-1 processing with GAMMA software
 Documentation User s Guide Sentinel-1 processing with GAMMA software Including an example of Sentinel-1 SLC co-registration and differential interferometry Version 1.1 May 2015 GAMMA Remote Sensing AG,
NEST 4C-1.1: an ESA toolbox for scientific exploitation of SAR data
 NEST 4C-1.1: an ESA toolbox for scientific exploitation of SAR data Andrea Minchella RSAC c/o European Space Agency ESRIN EO Science, Applications and New Technologies Department Exploitation & Services
INTERFEROMETRIC MULTI-CHROMATIC ANALYSIS OF HIGH RESOLUTION X-BAND DATA
 INTERFEROMETRIC MULTI-CHROMATIC ANALYSIS OF HIGH RESOLUTION X-BAND DATA F. Bovenga (1), V. M. Giacovazzo (1), A. Refice (1), D.O. Nitti (2), N. Veneziani (1) (1) CNR-ISSIA, via Amendola 122 D, 70126 Bari,
Sentinel-1 InSAR AP workshop
 Sentinel-1 InSAR AP workshop Sentinel-1 InSAR progress and experience at GAMMA U. Wegmüller, C. Werner, A. Wiesmann, T. Strozzi Gamma Remote Sensing AG - Progress made since S1A Expert Users meeting at
DETECTION AND QUANTIFICATION OF ROCK GLACIER. DEFORMATION USING ERS D-InSAR DATA
 DETECTION AND QUANTIFICATION OF ROCK GLACIER DEFORMATION USING ERS D-InSAR DATA Lado W. Kenyi 1 and Viktor Kaufmann 2 1 Institute of Digital Image Processing, Joanneum Research Wastiangasse 6, A-8010 Graz,
Do It Yourself 8. Polarization Coherence Tomography (P.C.T) Training Course
 Training Course") Do It Yourself 8 Polarization Coherence Tomography (P.C.T) Training Course 1 Objectives To provide a self taught introduction to Polarization Coherence Tomography (PCT) processing techniques to enable
Do It Yourself 8 Polarization Coherence Tomography (P.C.T) Training Course 1 Objectives To provide a self taught introduction to Polarization Coherence Tomography (PCT) processing techniques to enable
Playa del Rey, California InSAR Ground Deformation Monitoring
 Document Title Playa del Rey, California InSAR Ground Deformation Monitoring Prepared By: (signature / date) Ref.: RV-14524 Project Manager: xxxxxx July 13, 2009 SUBMITTED TO: ATTN: Mr. Rick Gailing Southern
Radar Coherent Backscatter!
 Radar Coherent Backscatter! Pixels in a radar image are a complex phasor representation of the coherent backscatter from the resolution element on the ground and the propagation phase delay! Interferometric
Concept and methodology of SAR Interferometry technique
 Concept and methodology of SAR Interferometry technique March 2016 Differen;al SAR Interferometry Young s double slit experiment - Construc;ve interference (bright) - Destruc;ve interference (dark) http://media-2.web.britannica.com/eb-media/96/96596-004-1d8e9f0f.jpg
AMBIGUOUS PSI MEASUREMENTS
 AMBIGUOUS PSI MEASUREMENTS J. Duro (1), N. Miranda (1), G. Cooksley (1), E. Biescas (1), A. Arnaud (1) (1). Altamira Information, C/ Còrcega 381 387, 2n 3a, E 8037 Barcelona, Spain, Email: javier.duro@altamira
RESOLUTION enhancement is achieved by combining two
 IEEE GEOSCIENCE AND REMOTE SENSING LETTERS, VOL. 3, NO. 1, JANUARY 2006 135 Range Resolution Improvement of Airborne SAR Images Stéphane Guillaso, Member, IEEE, Andreas Reigber, Member, IEEE, Laurent Ferro-Famil,
Playa del Rey, California InSAR Ground Deformation Monitoring
 Playa del Rey, California InSAR Ground Deformation Monitoring Master Document Ref.: RV-14524 July 13, 2009 SUBMITTED TO: ATTN: Mr. Rick Gailing Southern California Gas Company 555 W. Fifth Street (Mail
SNAP-Sentinel-1 in a Nutshell
 SNAP-Sentinel-1 in a Nutshell Dr. Andrea Minchella 1 st ESA Advanced Training Course on Remote Sensing of the Cryosphere 13 September 2016, University of Leeds, Leeds, UK What is SNAP? Credit: SNAP The
MULTI-TEMPORAL INTERFEROMETRIC POINT TARGET ANALYSIS
 MULTI-TEMPORAL INTERFEROMETRIC POINT TARGET ANALYSIS U. WEGMÜLLER, C. WERNER, T. STROZZI, AND A. WIESMANN Gamma Remote Sensing AG. Thunstrasse 130, CH-3074 Muri (BE), Switzerland wegmuller@gamma-rs.ch,
INSAR DEMS; ACHIEVEMENTS AND BENEFITS
 INSAR DEMS; ACHIEVEMENTS AND BENEFITS Parviz TARIKHI, Iran Key words: remote sensing, InSAR, DEM, deformation measurement, Iran SUMMARY InSAR is a radar technique for combining synthetic aperture radar
IMPROVING DEMS USING SAR INTERFEROMETRY. University of British Columbia. ABSTRACT
 IMPROVING DEMS USING SAR INTERFEROMETRY Michael Seymour and Ian Cumming University of British Columbia 2356 Main Mall, Vancouver, B.C.,Canada V6T 1Z4 ph: +1-604-822-4988 fax: +1-604-822-5949 mseymour@mda.ca,
SNAP-Sentinel-1 in a Nutshell
 SNAP-Sentinel-1 in a Nutshell Dr. Andrea Minchella 21-22/01/2016 ESA SNAP-Sentinel-1 Training Course Satellite Applications Catapult - Electron Building, Harwell, Oxfordshire What is SNAP? Credit: SNAP
Interferometric Evaluation of Sentinel-1A TOPS data
 Interferometric Evaluation of Sentinel-1A TOPS data N. Yague-Martinez, F. Rodriguez Gonzalez, R. Brcic, R. Shau Remote Sensing Technology Institute. DLR, Germany ESTEC/Contract No. 4000111074/14/NL/MP/lf
DIGITAL ELEVATION MODEL GENERATION FROM INTERFEROMETRIC SYNTHETIC APERTURE RADAR USING MULTI-SCALE METHOD
 DIGITAL ELEVATION MODEL GENERATION FROM INTERFEROMETRIC SYNTHETIC APERTURE RADAR USING MULTI-SCALE METHOD Jung Hum Yu 1, Linlin Ge, Chris Rizos School of Surveying and Spatial Information Systems University
Multi Baseline Interferometric Techniques and
 Pagina 1 di 11 FRINGE 96 Multi Baseline Interferometric Techniques and Applications A.Ferretti, A. Monti Guarnieri, C.Prati and F.Rocca Dipartimento di Elettronica e Informazione (DEI) Politecnico di Milano
2-PASS DIFFERENTIAL INTERFEROMETRY IN THE AREA OF THE SLATINICE ABOVE- LEVEL DUMP. Milan BOŘÍK 1
 2-PASS DIFFERENTIAL INTERFEROMETRY IN THE AREA OF THE SLATINICE ABOVE- LEVEL DUMP Milan BOŘÍK 1 1 Department of Mathematics, Faculty of Civil Engineering, Czech Technical University in Prague, Thákurova
Filtering, unwrapping, and geocoding R. Mellors
 Filtering, unwrapping, and geocoding R. Mellors or what to do when your interferogram looks like this correlation Haiti ALOS L-band (23 cm) ascend T447, F249 3/9/09-1/25/10 azimuth phase Bperp = 780 (gmtsar)
Airborne Differential SAR Interferometry: First Results at L-Band
 1516 IEEE TRANSACTIONS ON GEOSCIENCE AND REMOTE SENSING, VOL. 41, NO. 6, JUNE 2003 Airborne Differential SAR Interferometry: First Results at L-Band Andreas Reigber, Member, IEEE, and Rolf Scheiber Abstract
SAR Interferogram Phase Filtering Using Wavelet Transform
 Formatted: Font: 16 pt, Nazanin, 16 pt, (Complex) Farsi, 12 pt SAR Interferogram Phase Filtering Using Wavelet Transform V. Akbari, M. Motagh and M. A. Rajabi 1 Dept. o Surveying Eng., University College
DEFORMATION MONITORING USING INSAR AND ARTIFICIAL REFLECTORS
 DEFORMATION MONITORING USING INSAR AND ARTIFICIAL REFLECTORS Ivana, HLAVÁČOVÁ 1, Lena, HALOUNOVÁ 1, Květoslava, SVOBODOVÁ 1 1 Department of Mapping and Cartography, Faculty of Civil Engineering, Czech
Ice surface velocities using SAR
 Ice surface velocities using SAR Thomas Schellenberger, PhD ESA Cryosphere Remote Sensing Training Course 2018 UNIS Longyearbyen, Svalbard 12 th June 2018 thomas.schellenberger@geo.uio.no Outline Synthetic
SAOCOM 1A INTERFEROMETRIC ERROR MODEL AND ANALYSIS
 SAOCOM A INTERFEROMETRIC ERROR MODEL AND ANALYSIS Pablo Andrés Euillades (), Leonardo Daniel Euillades (), Mario Azcueta (), Gustavo Sosa () () Instituto CEDIAC FI UNCuyo & CONICET, Centro Universitario,
Differential Interferometry and Geocoding Software DIFF&GEO
 Documentation User s Guide Differential Interferometry and Geocoding Software DIFF&GEO Geocoding and Image Registration Version 1.6 May 2011 GAMMA Remote Sensing AG, Worbstrasse 225, CH-3073 Gümligen,
Interferometric SAR Processor - ISP
 Documentation User s Guide Interferometric SAR Processor - ISP Version 1.4 November 2009 GAMMA Remote Sensing AG, Worbstrasse 225, CH-3073 Gümligen, Switzerland tel: +41-31-951 70 05, fax: +41-31-951 70
First TOPSAR image and interferometry results with TerraSAR-X
 First TOPSAR image and interferometry results with TerraSAR-X A. Meta, P. Prats, U. Steinbrecher, R. Scheiber, J. Mittermayer DLR Folie 1 A. Meta - 29.11.2007 Introduction Outline TOPSAR acquisition mode
COMPARISON OF DEMS DERIVED FROM INSAR AND OPTICAL STEREO TECHNIQUES
 COMPARISON OF DEMS DERIVED FROM INSAR AND OPTICAL STEREO TECHNIQUES ABSTRACT Y.S. Rao and K.S. Rao Centre of Studies in Resources Engineering Indian Institute of Technology, Bombay Powai, Mumbai-400 076
URBAN CLASSIFICATION WITH SENTINEL-1 Case Study: Germany, 2018
 _p TRAINING KIT LAND06 URBAN CLASSIFICATION WITH SENTINEL-1 Case Study: Germany, 2018 Research and User Support for Sentinel Core Products The RUS Service is funded by the European Commission, managed
Precise orbits and accurate timing simplifies software and enables seamless mosaicing. Geometric validation of ERS, Envisat, and ALOS.
 Geometric Calibration of GMTSAR Processing Software Using Corner Reflectors at Pinon Flat David Sandwell, UCSD/SIO CEOS Cal/Val Workshop, November 8, 2011 What is GMTSAR? Precise orbits and accurate timing
Three-dimensional digital elevation model of Mt. Vesuvius from NASA/JPL TOPSAR
 Cover Three-dimensional digital elevation model of Mt. Vesuvius from NASA/JPL TOPSAR G.ALBERTI, S. ESPOSITO CO.RI.S.T.A., Piazzale V. Tecchio, 80, I-80125 Napoli, Italy and S. PONTE Department of Aerospace
SENTINEL-1 SUPPORT IN THE GAMMA SOFTWARE
 SENTINEL-1 SUPPORT IN THE GAMMA SOFTWARE Urs Wegmüller, Charles Werner, Tazio Strozzi, Andreas Wiesmann, Othmar Frey, and Maurizio Santoro Gamma Remote Sensing, Worbstrasse 225, 3073 Gümligen BE, Switzerland
APPLICATION OF SAR INTERFEROMETRIC TECHNIQUES FOR SURFACE DEFORMATION MONITORING
 APPLICATION OF SAR INTERFEROMETRIC TECHNIQUES FOR SURFACE DEFORMATION MONITORING Urs Wegmüller, Charles Werner, Tazio Strozzi, and Andreas Wiesmann Gamma Remote Sensing, Worbstrasse 225, 3073 Gümligen,
SentiNel Application Platform as InSAR processor for PSI processing with StaMPS
 SentiNel Application Platform as InSAR processor for PSI processing with StaMPS Authors: José Manuel Delgado Blasco Michael Foumelis Date: June 2018 1 Contents 1 Introduction... 3 1.1 Installation... 3
Signal Processing Laboratory
 C.S.L Liege Science Park Avenue du Pré-Aily B-4031 ANGLEUR Belgium Tel: +32.4.382.46.00 Fax: +32.4.367.56.13 Signal Processing Laboratory Anne Orban VITO June 16, 2011 C. Barbier : the team Remote Sensing
LONG-TERM SUBSIDENCE MONITORING OF CITY AREAS AT NORDIC LATITUDES USING ERS SAR DATA
 LONG-TERM SUBSIDENCE MONITORING OF CITY AREAS AT NORDIC LATITUDES USING ERS SAR DATA Tom R. Lauknes (1,2), Geir Engen (1), Kjell A. Høgda (1), Inge Lauknes (1), Torbjørn Eltoft (2), Dan J. Weydahl (3)
The STUN algorithm for Persistent Scatterer Interferometry
 [1/27] The STUN algorithm for Persistent Scatterer Interferometry Bert Kampes, Nico Adam 1. Theory 2. PSIC4 Processing 3. Conclusions [2/27] STUN Algorithm Spatio-Temporal Unwrapping Network (STUN) 4 1D
DEFORMATION MEASUREMENT USING INTERFEROMETRIC SAR DATA
 DEFORMATION MEASUREMENT USING INTERFEROMETRIC SAR DATA M. Crosetto Institute of Geomatics, Campus de Castelldefels, 08860 Castelldefels (Barcelona), Spain - michele.crosetto@ideg.es Commission II, WG II/2
Precise coregistration of Sentinel-1A TOPS data. Heresh Fattahi, Piyush Agram, Mark Simons
 Precise coregistration of Sentinel-1A TOPS data Heresh Fattahi, Piyush Agram, Mark Simons Sentinel-1A TOPS Burst N Burst 3 Burst 2 Burst 1 [Prats-Iraola et al, 212] Swath1 Swath2 Swath3 [Sakar et al, 215]
LANDSLIDE PHENOMENA IN SEVAN NATIONAL PARK - ARMENIA
 LANDSLIDE PHENOMENA IN SEVAN NATIONAL PARK - ARMENIA Andon Dimitrov Lazarov (1), Dimitar Minchev (2), Gurgen Aleksanyan (3), (1) Bourgas Free University, 62 San Stefano Str., 8000 Bourgas, Bulgaria,Email:
Letter. Wide Band SAR Sub-Band Splitting and Inter-Band Coherence Measurements
 International Journal of Remote Sensing Vol. 00, No. 00, DD Month 200x, 1 8 Letter Wide Band SAR Sub-Band Splitting and Inter-Band Coherence Measurements D. DERAUW, A. ORBAN and Ch. BARBIER Centre Spatial
Pixel-Offset SBAS analysis: a tool for the investigation of deformation time-series with large dynamics
 Pixel-Offset SBAS analysis: a tool for the investigation of deformation time-series with large dynamics F. Casu, A. Manconi, A. Pepe, M. Manzo, R. Lanari IREA-CNR Napoli, Italy casu.f@irea.cnr.it Summary
GMES TERRAFIRMA. Validation of existing processing chains in Terrafirma stage 2 LIST OF OSP DELIVERABLES EXTENDED
 GMES TERRAFIRMA ESRIN/Contract no. 19366/05/I-E Validation of existing processing chains in Terrafirma stage 2 LIST OF OSP DELIVERABLES EXTENDED 5 th July 2007 Final version - ERS M. Crosetto, M. Agudo
Progress In Electromagnetics Research M, Vol. 14, 15 32, 2010 RECONSTRUCTING HIGH-ACCURACY DEM WITH PRECISE ORBIT DATA AND EXTERNAL DEM
 Progress In Electromagnetics Research M, Vol. 14, 15 32, 2010 RECONSTRUCTING HIGH-ACCURACY DEM WITH PRECISE ORBIT DATA AND EXTERNAL DEM A. Bin School of Marine Sciences Sun Yat-sen University Guangzhou
Automating a Radiometric Terrain Correction Process Chain Using a Sentinel-1 Toolbox Graph
 Making remote-sensing data accessible since 1991 Automating a Radiometric Terrain Correction Process Chain Using a Sentinel-1 Toolbox Graph Source: ASF Staff In this document you will find: A. Background
SEA SURFACE SPEED FROM TERRASAR-X ATI DATA
 SEA SURFACE SPEED FROM TERRASAR-X ATI DATA Matteo Soccorsi (1) and Susanne Lehner (1) (1) German Aerospace Center, Remote Sensing Technology Institute, 82234 Weßling, Germany, Email: matteo.soccorsi@dlr.de
GAMMA Software. Introduction:
 v1.1, 1-Dec-2017 page 1 GAMMA Software Introduction: GAMMA Software supports the entire processing chain from SAR raw data to products such as digital elevation models, displacement maps and landuse maps.
2003 IEEE. Personal use of this material is permitted. However, permission to reprint/republish this material for advertising or promotional purposes
 2003 IEEE. Personal use of this material is permitted. However, permission to reprint/republish this material for advertising or promotional purposes or for creating new collective works for resale or
ALOS PALSAR SCANSAR INTERFEROMETRY AND ITS APPLICATION IN WENCHUAN EARTHQUAKE
 ALOS PALSAR SCANSAR INTERFEROMETRY AND ITS APPLICATION IN WENCHUAN EARTHQUAKE Cunren Liang (1) (2), Qiming Zeng (1) (2), Jianying Jia (1) (2), Jian Jiao (1) (2), Xiai Cui (1) (2) (1) (2), Xiao Zhou (1)
I-PAF SRTM X-SAR Processing Chain: Algorithms and Analysis of First Results
 I-PAF SRTM X-SAR Processing Chain: Algorithms and Analysis of First Results P. AMMENDOLA(*), E. LOPINTO(**),C. MARZO (***), G. MILILLO (***), G. RICCOBONO (***), G. R. VERDONE (**), R. VIGGIANO (**) (*)ASI
Radar Data Processing, Quality Analysis and Level-1b Product Generation for AGRISAR and EAGLE campaigns
 Radar Data Processing, Quality Analysis and Level-1b Product Generation for AGRISAR and EAGLE campaigns German Aerospace Center (DLR) R. Scheiber, M. Keller, J. Fischer, R. Horn, I. Hajnsek Outline E-SAR
ICE VELOCITY measurements are fundamentally important
 102 IEEE GEOSCIENCE AND REMOTE SENSING LETTERS, VOL. 4, NO. 1, JANUARY 2007 Synergistic Fusion of Interferometric and Speckle-Tracking Methods for Deriving Surface Velocity From Interferometric SAR Data
November Msc thesis in geomatics IDENTIFICATION AND ANALYSIS OF POINT SCATTERERS IN TIME SERIES INSAR. Piers Titus van der Torren
 November 2011 Msc thesis in geomatics IDENTIFICATION AND ANALYSIS OF POINT SCATTERERS IN TIME SERIES INSAR Piers Titus van der Torren Piers Titus van der Torren: Identification and analysis of point scatterers
FAST SOLUTION OF PHASE UNWRAPPING PARTIAL DIFFERENTIAL EQUATION USING WAVELETS
 Tenth MSU Conference on Differential Equations and Computational Simulations. Electronic Journal of Differential Equations, Conference 23 (2016), pp. 119 129. ISSN: 1072-6691. URL: http://ejde.math.txstate.edu
IMAGINE OrthoRadar. Accuracy Evaluation. age 1 of 9
 IMAGINE OrthoRadar Accuracy Evaluation age 1 of 9 IMAGINE OrthoRadar Product Description IMAGINE OrthoRadar is part of the IMAGINE Radar Mapping Suite and performs precision geocoding and orthorectification
Tree Height Estimation Methodology With Xband and P-band InSAR Data. Lijun Lu Guoman Huang Qiwei Li CASM
 Tree Height Estimation Methodology With Xband and P-band InSAR Data Lijun Lu Guoman Huang Qiwei Li CASM Outline CASMSAR dataset and test area Height Estimation with RVoG method Height Estimation with dual-band
ERS AND ENVISAT DIFFERENTIAL SAR INTERFEROMETRY FOR SUBSIDENCE MONITORING
 ERS AND ENVISAT DIFFERENTIAL SAR INTERFEROMETRY FOR SUBSIDENCE MONITORING Urs Wegmüller 1, Tazio Strozzi 1, and Luigi Tosi 2 1 Gamma Remote Sensing, Thunstrasse 130, CH-3074 Muri b. Bern, Switzerland Tel:
WIDE BASELINE INTERFEROMETRY WITH VERY LOW RESOLUTION SAR SYSTEMS
 1 of 25 26/03/2008 22.35 ne previo WIDE BASELINE INTERFEROMETRY WITH VERY LOW RESOLUTION SAR SYSTEMS Abstract: A. Monti Guarnieri, C. Prati, F. Rocca and Y-L. Desnos (*) Dipartimento di Elettronica e Informazione
FIRST RESULTS OF THE ALOS PALSAR VERIFICATION PROCESSOR
 FIRST RESULTS OF THE ALOS PALSAR VERIFICATION PROCESSOR P. Pasquali (1), A. Monti Guarnieri (2), D. D Aria (3), L. Costa (3), D. Small (4), M. Jehle (4) and B. Rosich (5) (1) sarmap s.a., Cascine di Barico,