Scalar Data. Visualization Torsten Möller. Weiskopf/Machiraju/Möller
|
|
|
- Domenic Beasley
- 5 years ago
- Views:
Transcription
1 Scalar Data Visualization Torsten Möller Weiskopf/Machiraju/Möller
2 Overview Basic strategies Function plots and height fields Isolines Color coding Volume visualization (overview) Classification Segmentation Volumetric illumination Scalar Data in High-D Weiskopf/Machiraju/Möller 2
3 Readings The Visualization Handbook: Chapter 1 (Overview of Visualization) Chapter 9 (Multidimensional Transfer Functions for Volume Rendering) Marc Levoy: Display of Surfaces from Volume Data, IEEE Computer Graphics and Applications, Vol. 8, No. 3, May, 1988, pp K. Engel, M. Hadwiger, J. M. Kniss, C. Rezk- Salama, D. Weiskopf: Real-time Volume Graphics, AK Peters, 2006 Chapter 4 (Transfer Functions) Chapter 10 (Transfer Functions Reloaded) Chapter 5 (Local Volume Illumination) Weiskopf/Machiraju/Möller 3
4 Basic Strategies Visualization of 1D, 2D, or 3D scalar fields 1D scalar field: 2D scalar field: R R 2 R 3 3D scalar field: Volume visualization! R R R Weiskopf/Machiraju/Möller 4
5 Basic Strategies Mapping to geometry Function plots Height fields Isolines and isosurfaces Color coding Specific techniques for 3D data Indirect volume visualization Direct volume visualization Slicing Visualization method depend heavily on dimensionality of domain Weiskopf/Machiraju/Möller 5
6 Function Plots and Height Fields Function plot for a 1D scalar field Points 1D manifold: line Error bars possible {(s, f(s)) s R} Gnuplot example Weiskopf/Machiraju/Möller 6
7 Function Plots and Height Fields Function plot for a 2D scalar field {(s, t, f(s, t)) (s, t) R 2 } Points 2D manifold: surface Surface representations Wireframe Hidden lines Shaded surface Weiskopf/Machiraju/Möller 7

 f(x, y) =c}")
8 Isolines Visualization of 2D scalar fields Given a scalar function f : and a scalar value c R Isoline consists of points If f() is differentiable and grad(f) 0, then isolines are curves Contour lines R {(x, y) f(x, y) =c} Weiskopf/Machiraju/Möller 8

9 Colorpleth / Isopleth Weiskopf/Machiraju/Möller 9
10 Isolines Pixel by pixel contouring Straightforward approach: scanning all pixels for equivalence with isovalue Input f : (1,...,x max ) x (1,...,y max )! R Isovalues I 1,..., I n and isocolors c 1,...,c n Algorithm for all (x,y) (1,...,x max ) x (1,...,y max ) do for all k { 1,...,n } do if f(x,y)-i k < ε then draw(x,y,c k ) Problem: Isoline can be missed if the gradient of f() is too large (despite range ε) Weiskopf/Machiraju/Möller 10


11 Weiskopf/Machiraju/Möller 11


12 Weiskopf/Machiraju/Möller 12
13 Marching Squares Representation of the scalar function on a rectilinear grid Scalar values are given at each vertex Take into account the interpolation within cells Isolines cannot be missed Divide and conquer: consider cells independently of each other Weiskopf/Machiraju/Möller 13
14 Marching Squares 4 different cases (classes) of combinations of signs Symmetries: rotation, reflection, change + - Compute intersections between isoline and cell edge, based on linear interpolation along the cell edges ? - +? + - Weiskopf/Machiraju/Möller
15 Overview Basic strategies Function plots and height fields Isolines Color coding Volume visualization (overview) Classification Segmentation Volumetric illumination Scalar Data in High-D Weiskopf/Machiraju/Möller 15


16 Color Coding Easy to apply to 1D and 2D scalar fields Map color to each pixel on 1D or 2D image Weiskopf/Machiraju/Möller 16


17 Color Coding Example Special color table to visualize the brain tissue Special color table to visualize the bone structure Original Brain Tissue Weiskopf/Machiraju/Möller 17


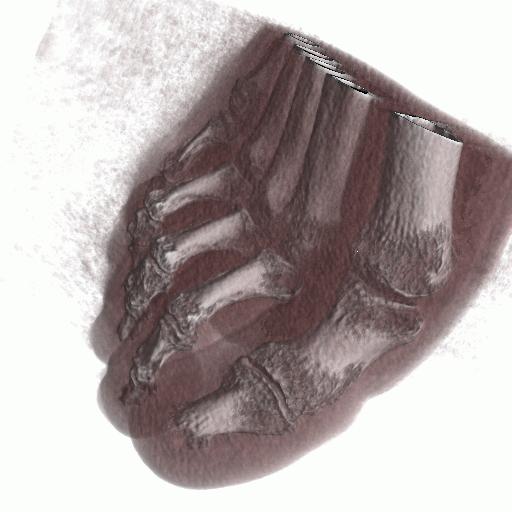
18 Volume Visualization R 3 R Scalar volume data Medical Applications: CT, MRI, confocal micros- copy, ultrasound, etc. Weiskopf/Machiraju/Möller 18


19 Volume Visualization Weiskopf/Machiraju/Möller 19


20 Volume Visualization Weiskopf/Machiraju/Möller 20

21 Volume Visualization Representation of scalar 3D data set R 3 R Analogy: pixel (picture element) Voxel (volume element), with two interpretations: Values between grid points are resampled by interpolation Collection of voxels Uniform grid Weiskopf/Machiraju/Möller 21
22 Volume Visualization Challenges Essential information in the interior Occlusion? Often data sets cannot be described by geometric representation (fire, clouds, gaseous phenomena) Weiskopf/Machiraju/Möller 22

23 Volume Visualization Slicing: Display the volume data, mapped to colors, on a slice plane Isosurfacing: Generate opaque/semiopaque surfaces Transparency effects: Volume material attenuates reflected or emitted light Semi-transparent material Isosurface Slice Weiskopf/Machiraju/Möller 23
 Direct 3D visualization (direct volume rendering DVR)")
24 Volume Visualization 2D visualization slice images (or multi-planar reformating MPR) Indirect 3D visualization isosurfaces (or surface-shaded display SSD) Direct 3D visualization (direct volume rendering DVR) Weiskopf/Machiraju/Möller 24


25 Volume Visualization 2D approach: Orthogonal slicing Interactively resample the data on slices perpendicular to the x-,y-,z-axis Use visualization techniques for 2D scalar fields Color coding Isolines Height fields Slice CT data set Weiskopf/Machiraju/Möller 25
 Exploit 3D texture mapping functionality Store volume in 3D texture Compute sectional polygon (clip plane with volume bounding box) Render textured polygon")
26 Volume Visualization Alternative: Oblique slicing (MPR multiplanar reformating) Resample the data on arbitrarily oriented slices Resampling on CPU or on graphics hardware (trilinear interpolation) Exploit 3D texture mapping functionality Store volume in 3D texture Compute sectional polygon (clip plane with volume bounding box) Render textured polygon Weiskopf/Machiraju/Möller 26
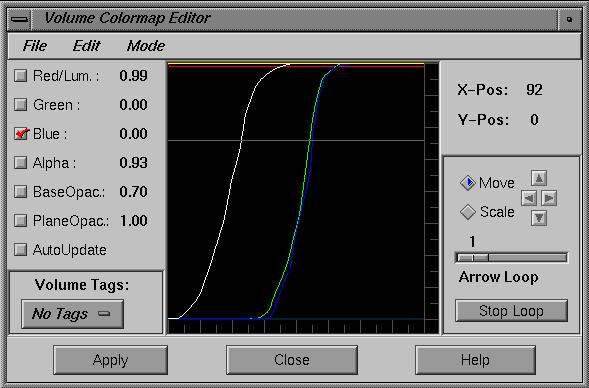
27 Classification Goals and issues: Empowers user to select structures Extract important features of the data set Classification is non trivial Histogram can be a useful hint Often interactive manipulation of transfer functions needed Usually needed for volume visualization Standard approach: Transfer function Color table for volume visualization Maps raw voxel value into presentable entities: color, intensity, opacity, etc. Weiskopf/Machiraju/Möller 27


28 Classification Examples of different transfer functions Weiskopf/Machiraju/Möller 28
29 Classification Most widely used approach for transfer functions: Assign each scalar value a different color value Assignment via transfer function T T : scalarvalue colorvalue Common choice for color representation: RGBA Alpha value is very important, describes opacity Code color values into a color lookup table On-the-fly update of color LUT R i G i B i A i Scalar (0,1) 0 (0,1) (0,N-1) Weiskopf/Machiraju/Möller
30 Classification Weiskopf/Machiraju/Möller 30


31 Classification Weiskopf/Machiraju/Möller 31
32 Classification Heuristic approach, based on measurements of many data sets constituents distributions histogram air fat tissue bone CT number % material assignment air fat tissue bone CT Weiskopf/Machiraju/Möller 32
33 Classification Usually not only interested in a particular isosurface but also in regions of change Feature extraction - High value of opacity in regions of change Homogeneous regions less interesting - transparent Surface strength depends on gradient Gradient of the scalar field is taken into account Weiskopf/Machiraju/Möller 33
34 Classification Multidimensional transfer functions [Kindlmann & Durkin 98, Kniss, Kindlmann, Hansen 01] Problem: How to identify boundary regions/ surfaces Approach: 2D/3D transfer functions, depending on Scalar value, magnitude of the gradient Second derivative along the gradient direction Weiskopf/Machiraju/Möller 34
35 Weiskopf/Machiraju/Möller 35


36 Classification Multidimensional transfer functions Weiskopf/Machiraju/Möller 36


37 Classification Multidimensional transfer functions Histogram second derivative emphasis gradient magnitude scalar value boundary surface Weiskopf/Machiraju/Möller 37

38 Classification Multidimensional transfer functions Extraction of two boundaries Triangle function in histogram Weiskopf/Machiraju/Möller 38
39 Segmentation Different features with same value Example CT: different organs have similar X-ray absorption Classification cannot be distinguished Label voxels indicating a type Segmentation = pre-processing Semi-automatic process Air Fat Tissue Bone Weiskopf/Machiraju/Möller 39

40 Segmentation Anatomic atlas Weiskopf/Machiraju/Möller 40
41 Volumetric Illumination Illumination: Simulate reflection of light Simulate effect on color We want to make use of the human visual system s ability to efficiently deal with illuminated objects Weiskopf/Machiraju/Möller 41
42 Volumetric Illumination Review of the Phong illumination model Ambient light + diffuse light + specular light Ambient light: C = k a C a O d k a is ambient contribution C a is color of ambient light O d is diffuse color of object Diffuse light: C = k d C p O d cos(θ) k d is diffuse contribution C p is color of point light O d is diffuse color of object cos(θ) is angle of incoming light Specular light: C = k s C p O s cos n (σ) k s is specular contribution C p is color of point light cos(σ) is angle of reflected light and eye n is the specular exponent Ambient Diffuse Specular Weiskopf/Machiraju/Möller 42
43 Volumetric Illumination cos(θ) = N L cos(θ 1 ) = N H (Blinn-Phong) L N H E R H = L + E L + E Weiskopf/Machiraju/Möller 43
44 Volumetric Illumination Ambient Diffuse Specular k a = 0.1 k d = 0.5 k s = 0.4 Phong model Weiskopf/Machiraju/Möller 44


45 Volumetric Illumination Ambient Diffuse Diffuse Specular k a = 0.1 k d = 0.5 k s = 0.4 Phong model Weiskopf/Machiraju/Möller 45
46 Volumetric Illumination What is the normal vector in a scalar field? Use the gradient! Gradient is perpendicular to isosurface (direction of largest change) Numerical computation of the gradient: Central difference Intermediate difference (forward/backward difference) Sobel operator (3 3 kernel for each partial derivative) Weiskopf/Machiraju/Möller 46

47 Volumetric Illumination Central differences Intermediate differences Weiskopf/Machiraju/Möller 47


48 Volumetric Illumination Intermediate differences Central differences Sobel operator Weiskopf/Machiraju/Möller 48
Scalar Data. CMPT 467/767 Visualization Torsten Möller. Weiskopf/Machiraju/Möller
 Scalar Data CMPT 467/767 Visualization Torsten Möller Weiskopf/Machiraju/Möller Overview Basic strategies Function plots and height fields Isolines Color coding Volume visualization (overview) Classification
5. Volume Visualization
 5. Volume Visualization Scalar volume data Medical Applications: CT, MRI, confocal microscopy, ultrasound, etc. 1 5. Volume Visualization 2 5. Volume Visualization 3 5. Volume Visualization Some possible
Scalar Data. Alark Joshi
 Scalar Data Alark Joshi Announcements Pick two papers to present Email me your top 3/4 choices. FIFO allotment Contact your clients Blog summaries: http://cs.boisestate.edu/~alark/cs564/participants.html
Data Visualization (DSC 530/CIS )
") Data Visualization (DSC 530/CIS 60-0) Isosurfaces & Volume Rendering Dr. David Koop Fields & Grids Fields: - Values come from a continuous domain, infinitely many values - Sampled at certain positions
Data Visualization (DSC 530/CIS 60-0) Isosurfaces & Volume Rendering Dr. David Koop Fields & Grids Fields: - Values come from a continuous domain, infinitely many values - Sampled at certain positions
CIS 467/602-01: Data Visualization
 CIS 467/60-01: Data Visualization Isosurfacing and Volume Rendering Dr. David Koop Fields and Grids Fields: values come from a continuous domain, infinitely many values - Sampled at certain positions to
Data Visualization (CIS/DSC 468)
") Data Visualization (CIS/DSC 46) Volume Rendering Dr. David Koop Visualizing Volume (3D) Data 2D visualization slice images (or multi-planar reformating MPR) Indirect 3D visualization isosurfaces (or surface-shaded
Data Visualization (CIS/DSC 46) Volume Rendering Dr. David Koop Visualizing Volume (3D) Data 2D visualization slice images (or multi-planar reformating MPR) Indirect 3D visualization isosurfaces (or surface-shaded
Data Visualization (DSC 530/CIS )
") Data Visualization (DSC 530/CIS 60-01) Scalar Visualization Dr. David Koop Online JavaScript Resources http://learnjsdata.com/ Good coverage of data wrangling using JavaScript Fields in Visualization Scalar
Data Visualization (DSC 530/CIS 60-01) Scalar Visualization Dr. David Koop Online JavaScript Resources http://learnjsdata.com/ Good coverage of data wrangling using JavaScript Fields in Visualization Scalar
Volume Rendering - Introduction. Markus Hadwiger Visual Computing Center King Abdullah University of Science and Technology
 Volume Rendering - Introduction Markus Hadwiger Visual Computing Center King Abdullah University of Science and Technology Volume Visualization 2D visualization: slice images (or multi-planar reformation:
4. Basic Mapping Techniques
 4. Basic Mapping Techniques Mapping from (filtered) data to renderable representation Most important part of visualization Possible visual representations: Position Size Orientation Shape Brightness Color
Volume Visualization. Part 1 (out of 3) Volume Data. Where do the data come from? 3D Data Space How are volume data organized?
 Volume Data. Where do the data come from? 3D Data Space How are volume data organized?") Volume Data Volume Visualization Part 1 (out of 3) Where do the data come from? Medical Application Computed Tomographie (CT) Magnetic Resonance Imaging (MR) Materials testing Industrial-CT Simulation
Volume Data Volume Visualization Part 1 (out of 3) Where do the data come from? Medical Application Computed Tomographie (CT) Magnetic Resonance Imaging (MR) Materials testing Industrial-CT Simulation
Volume Rendering. Lecture 21
 Volume Rendering Lecture 21 Acknowledgements These slides are collected from many sources. A particularly valuable source is the IEEE Visualization conference tutorials. Sources from: Roger Crawfis, Klaus
Volume Visualization
 Volume Visualization Part 1 (out of 3) Overview: Volume Visualization Introduction to volume visualization On volume data Surface vs. volume rendering Overview: Techniques Simple methods Slicing, cuberille
Visualization. Images are used to aid in understanding of data. Height Fields and Contours Scalar Fields Volume Rendering Vector Fields [chapter 26]
![Visualization. Images are used to aid in understanding of data. Height Fields and Contours Scalar Fields Volume Rendering Vector Fields [chapter 26]](/thumbs/74/70771954.jpg "Visualization. Images are used to aid in understanding of data. Height Fields and Contours Scalar Fields Volume Rendering Vector Fields [chapter 26]") Visualization Images are used to aid in understanding of data Height Fields and Contours Scalar Fields Volume Rendering Vector Fields [chapter 26] Tumor SCI, Utah Scientific Visualization Visualize large
Visualization Images are used to aid in understanding of data Height Fields and Contours Scalar Fields Volume Rendering Vector Fields [chapter 26] Tumor SCI, Utah Scientific Visualization Visualize large
Volume visualization. Volume visualization. Volume visualization methods. Sources of volume visualization. Sources of volume visualization
 Volume visualization Volume visualization Volumes are special cases of scalar data: regular 3D grids of scalars, typically interpreted as density values. Each data value is assumed to describe a cubic
11/1/13. Visualization. Scientific Visualization. Types of Data. Height Field. Contour Curves. Meshes
 CSCI 420 Computer Graphics Lecture 26 Visualization Height Fields and Contours Scalar Fields Volume Rendering Vector Fields [Angel Ch. 2.11] Jernej Barbic University of Southern California Scientific Visualization
Visualization. CSCI 420 Computer Graphics Lecture 26
 CSCI 420 Computer Graphics Lecture 26 Visualization Height Fields and Contours Scalar Fields Volume Rendering Vector Fields [Angel Ch. 11] Jernej Barbic University of Southern California 1 Scientific Visualization
Visualization Computer Graphics I Lecture 20
 15-462 Computer Graphics I Lecture 20 Visualization Height Fields and Contours Scalar Fields Volume Rendering Vector Fields [Angel Ch. 12] April 15, 2003 Frank Pfenning Carnegie Mellon University http://www.cs.cmu.edu/~fp/courses/graphics/
Height Fields and Contours Scalar Fields Volume Rendering Vector Fields [Angel Ch. 12] April 23, 2002 Frank Pfenning Carnegie Mellon University
![Height Fields and Contours Scalar Fields Volume Rendering Vector Fields [Angel Ch. 12] April 23, 2002 Frank Pfenning Carnegie Mellon University](/thumbs/90/102611276.jpg "Height Fields and Contours Scalar Fields Volume Rendering Vector Fields [Angel Ch. 12] April 23, 2002 Frank Pfenning Carnegie Mellon University") 15-462 Computer Graphics I Lecture 21 Visualization Height Fields and Contours Scalar Fields Volume Rendering Vector Fields [Angel Ch. 12] April 23, 2002 Frank Pfenning Carnegie Mellon University http://www.cs.cmu.edu/~fp/courses/graphics/
15-462 Computer Graphics I Lecture 21 Visualization Height Fields and Contours Scalar Fields Volume Rendering Vector Fields [Angel Ch. 12] April 23, 2002 Frank Pfenning Carnegie Mellon University http://www.cs.cmu.edu/~fp/courses/graphics/
Direct Volume Rendering
 Direct Volume Rendering Visualization Torsten Möller Weiskopf/Machiraju/Möller Overview 2D visualization slice images (or multi-planar reformating MPR) Indirect 3D visualization isosurfaces (or surface-shaded
GPU-based Volume Rendering. Michal Červeňanský
 GPU-based Volume Rendering Michal Červeňanský Outline Volume Data Volume Rendering GPU rendering Classification Speed-up techniques Other techniques 2 Volume Data Describe interior structures Liquids,
CIS 4930/ SCIENTIFICVISUALIZATION
 CIS 4930/6930-902 SCIENTIFICVISUALIZATION ISOSURFACING Paul Rosen Assistant Professor University of South Florida slides credits Tricoche and Meyer ADMINISTRATIVE Read (or watch video): Kieffer et al,
cs6630 November TRANSFER FUNCTIONS Alex Bigelow University of Utah
 cs6630 November 14 2014 TRANSFER FUNCTIONS Alex Bigelow University of Utah 1 cs6630 November 13 2014 TRANSFER FUNCTIONS Alex Bigelow University of Utah slide acknowledgements: Miriah Meyer, University
Direct Volume Rendering
 Direct Volume Rendering CMPT 467/767 Visualization Torsten Möller Weiskopf/Machiraju/Möller Overview Volume rendering equation Compositing schemes Ray casting Acceleration techniques for ray casting Texture-based
Visualization Computer Graphics I Lecture 20
 15-462 Computer Graphics I Lecture 20 Visualization Height Fields and Contours Scalar Fields Volume Rendering Vector Fields [Angel Ch. 12] November 20, 2003 Doug James Carnegie Mellon University http://www.cs.cmu.edu/~djames/15-462/fall03
Volume Rendering. Computer Animation and Visualisation Lecture 9. Taku Komura. Institute for Perception, Action & Behaviour School of Informatics
 Volume Rendering Computer Animation and Visualisation Lecture 9 Taku Komura Institute for Perception, Action & Behaviour School of Informatics Volume Rendering 1 Volume Data Usually, a data uniformly distributed
Data Visualization (CIS/DSC 468)
") Data Visualization (CIS/DSC 468) Vector Visualization Dr. David Koop Visualizing Volume (3D) Data 2D visualization slice images (or multi-planar reformating MPR) Indirect 3D visualization isosurfaces (or
Data Visualization (CIS/DSC 468) Vector Visualization Dr. David Koop Visualizing Volume (3D) Data 2D visualization slice images (or multi-planar reformating MPR) Indirect 3D visualization isosurfaces (or
Indirect Volume Rendering
 Indirect Volume Rendering Visualization Torsten Möller Weiskopf/Machiraju/Möller Overview Contour tracing Marching cubes Marching tetrahedra Optimization octree-based range query Weiskopf/Machiraju/Möller
Lecture overview. Visualisatie BMT. Fundamental algorithms. Visualization pipeline. Structural classification - 1. Structural classification - 2
 Visualisatie BMT Fundamental algorithms Arjan Kok a.j.f.kok@tue.nl Lecture overview Classification of algorithms Scalar algorithms Vector algorithms Tensor algorithms Modeling algorithms 1 2 Visualization
Interactive Boundary Detection for Automatic Definition of 2D Opacity Transfer Function
 Interactive Boundary Detection for Automatic Definition of 2D Opacity Transfer Function Martin Rauberger, Heinrich Martin Overhoff Medical Engineering Laboratory, University of Applied Sciences Gelsenkirchen,
Lecture overview. Visualisatie BMT. Transparency. Transparency. Transparency. Transparency. Transparency Volume rendering Assignment
 Visualisatie BMT Lecture overview Assignment Arjan Kok a.j.f.kok@tue.nl 1 Makes it possible to see inside or behind objects Complement of transparency is opacity Opacity defined by alpha value with range
lecture 21 volume rendering - blending N layers - OpenGL fog (not on final exam) - transfer functions - rendering level surfaces
 - transfer functions - rendering level surfaces") lecture 21 volume rendering - blending N layers - OpenGL fog (not on final exam) - transfer functions - rendering level surfaces - 3D objects Clouds, fire, smoke, fog, and dust are difficult to model with
lecture 21 volume rendering - blending N layers - OpenGL fog (not on final exam) - transfer functions - rendering level surfaces - 3D objects Clouds, fire, smoke, fog, and dust are difficult to model with
Introduction to Scientific Visualization
 Visualization Definition Introduction to Scientific Visualization Stefan Bruckner visualization: to form a mental vision, image, or picture of (something not visible or present to the sight, or of an abstraction);
Volume Illumination. Visualisation Lecture 11. Taku Komura. Institute for Perception, Action & Behaviour School of Informatics
 Volume Illumination Visualisation Lecture 11 Taku Komura Institute for Perception, Action & Behaviour School of Informatics Taku Komura Volume Illumination & Vector Vis. 1 Previously : Volume Rendering
Scalar Visualization
 Scalar Visualization Visualizing scalar data Popular scalar visualization techniques Color mapping Contouring Height plots outline Recap of Chap 4: Visualization Pipeline 1. Data Importing 2. Data Filtering
Isosurface Rendering. CSC 7443: Scientific Information Visualization
 Isosurface Rendering What is Isosurfacing? An isosurface is the 3D surface representing the locations of a constant scalar value within a volume A surface with the same scalar field value Isosurfaces form
Multidimensional Transfer Functions in Volume Rendering of Medical Datasets. Master thesis. Tor Øyvind Fluør
 UNIVERSITY OF OSLO Department of Informatics Multidimensional Transfer Functions in Volume Rendering of Medical Datasets Master thesis Tor Øyvind Fluør February 2006 Abstract In volume rendering, transfer
Clipping. CSC 7443: Scientific Information Visualization
 Clipping Clipping to See Inside Obscuring critical information contained in a volume data Contour displays show only exterior visible surfaces Isosurfaces can hide other isosurfaces Other displays can
CS 5630/6630 Scientific Visualization. Volume Rendering I: Overview
 CS 5630/6630 Scientific Visualization Volume Rendering I: Overview Motivation Isosurfacing is limited It is binary A hard, distinct boundary is not always appropriate Slice Isosurface Volume Rendering
CS5620 Intro to Computer Graphics
 So Far wireframe hidden surfaces Next step 1 2 Light! Need to understand: How lighting works Types of lights Types of surfaces How shading works Shading algorithms What s Missing? Lighting vs. Shading
Raycasting. Ronald Peikert SciVis Raycasting 3-1
 Raycasting Ronald Peikert SciVis 2007 - Raycasting 3-1 Direct volume rendering Volume rendering (sometimes called direct volume rendering) stands for methods that generate images directly from 3D scalar
Emissive Clip Planes for Volume Rendering Supplement.
 Emissive Clip Planes for Volume Rendering Supplement. More material than fit on the one page version for the SIGGRAPH 2003 Sketch by Jan Hardenbergh & Yin Wu of TeraRecon, Inc. Left Image: The clipped
Volume Graphics Introduction
 High-Quality Volume Graphics on Consumer PC Hardware Volume Graphics Introduction Joe Kniss Gordon Kindlmann Markus Hadwiger Christof Rezk-Salama Rüdiger Westermann Motivation (1) Motivation (2) Scientific
Hardware Accelerated Volume Visualization. Leonid I. Dimitrov & Milos Sramek GMI Austrian Academy of Sciences
 Hardware Accelerated Volume Visualization Leonid I. Dimitrov & Milos Sramek GMI Austrian Academy of Sciences A Real-Time VR System Real-Time: 25-30 frames per second 4D visualization: real time input of
Volume Illumination, Contouring
 Volume Illumination, Contouring Computer Animation and Visualisation Lecture 0 tkomura@inf.ed.ac.uk Institute for Perception, Action & Behaviour School of Informatics Contouring Scaler Data Overview -
CSC Computer Graphics
 // CSC. Computer Graphics Lecture Kasun@dscs.sjp.ac.lk Department of Computer Science University of Sri Jayewardanepura Polygon Filling Scan-Line Polygon Fill Algorithm Span Flood-Fill Algorithm Inside-outside
Mirrored LH Histograms for the Visualization of Material Boundaries
 Mirrored LH Histograms for the Visualization of Material Boundaries Petr Šereda 1, Anna Vilanova 1 and Frans A. Gerritsen 1,2 1 Department of Biomedical Engineering, Technische Universiteit Eindhoven,
Previously... contour or image rendering in 2D
 Volume Rendering Visualisation Lecture 10 Taku Komura Institute for Perception, Action & Behaviour School of Informatics Volume Rendering 1 Previously... contour or image rendering in 2D 2D Contour line
First Steps in Hardware Two-Level Volume Rendering
 First Steps in Hardware Two-Level Volume Rendering Markus Hadwiger, Helwig Hauser Abstract We describe first steps toward implementing two-level volume rendering (abbreviated as 2lVR) on consumer PC graphics
Visualisatie BMT. Rendering. Arjan Kok
 Visualisatie BMT Rendering Arjan Kok a.j.f.kok@tue.nl 1 Lecture overview Color Rendering Illumination 2 Visualization pipeline Raw Data Data Enrichment/Enhancement Derived Data Visualization Mapping Abstract
Volume Illumination and Segmentation
 Volume Illumination and Segmentation Computer Animation and Visualisation Lecture 13 Institute for Perception, Action & Behaviour School of Informatics Overview Volume illumination Segmentation Volume
CS 130 Final. Fall 2015
 CS 130 Final Fall 2015 Name Student ID Signature You may not ask any questions during the test. If you believe that there is something wrong with a question, write down what you think the question is trying
Volume Illumination & Vector Field Visualisation
 Volume Illumination & Vector Field Visualisation Visualisation Lecture 11 Institute for Perception, Action & Behaviour School of Informatics Volume Illumination & Vector Vis. 1 Previously : Volume Rendering
Computer Graphics. - Volume Rendering - Philipp Slusallek
 Computer Graphics - Volume Rendering - Philipp Slusallek Overview Motivation Volume Representation Indirect Volume Rendering Volume Classification Direct Volume Rendering Applications: Bioinformatics Image
Data Representation in Visualisation
 Data Representation in Visualisation Visualisation Lecture 4 Taku Komura Institute for Perception, Action & Behaviour School of Informatics Taku Komura Data Representation 1 Data Representation We have
SEOUL NATIONAL UNIVERSITY
 Fashion Technology 5. 3D Garment CAD-1 Sungmin Kim SEOUL NATIONAL UNIVERSITY Overview Design Process Concept Design Scalable vector graphics Feature-based design Pattern Design 2D Parametric design 3D
Interactive Methods in Scientific Visualization
 Interactive Methods in Scientific Visualization GPU Volume Raycasting Christof Rezk-Salama University of Siegen, Germany Volume Rendering in a Nutshell Image Plane Eye Data Set Back-to-front iteration
3/29/2016. Applications: Geology. Appliations: Medicine. Applications: Archeology. Applications: Klaus Engel Markus Hadwiger Christof Rezk Salama
 Tutorial 7 Real-Time Volume Graphics Real-Time Volume Graphics [01] Introduction and Theory Klaus Engel Markus Hadwiger Christof Rezk Salama Appliations: Medicine Applications: Geology Deformed Plasticine
Visualization Toolkit(VTK) Atul Kumar MD MMST PhD IRCAD-Taiwan
 Atul Kumar MD MMST PhD IRCAD-Taiwan") Visualization Toolkit(VTK) Atul Kumar MD MMST PhD IRCAD-Taiwan Visualization What is visualization?: Informally, it is the transformation of data or information into pictures.(scientific, Data, Information)
Visualization Toolkit(VTK) Atul Kumar MD MMST PhD IRCAD-Taiwan Visualization What is visualization?: Informally, it is the transformation of data or information into pictures.(scientific, Data, Information)
Scientific Visualization. CSC 7443: Scientific Information Visualization
 Scientific Visualization Scientific Datasets Gaining insight into scientific data by representing the data by computer graphics Scientific data sources Computation Real material simulation/modeling (e.g.,
Volume Ray Casting Neslisah Torosdagli
 Volume Ray Casting Neslisah Torosdagli Overview Light Transfer Optical Models Math behind Direct Volume Ray Casting Demonstration Transfer Functions Details of our Application References What is Volume
Scalar Visualization
 Scalar Visualization 5-1 Motivation Visualizing scalar data is frequently encountered in science, engineering, and medicine, but also in daily life. Recalling from earlier, scalar datasets, or scalar fields,
Introduction to Visualization and Computer Graphics
 Introduction to Visualization and Computer Graphics DH2320, Fall 2015 Prof. Dr. Tino Weinkauf Introduction to Visualization and Computer Graphics Visibility Shading 3D Rendering Geometric Model Color Perspective
Scalar Algorithms: Contouring
 Scalar Algorithms: Contouring Computer Animation and Visualisation Lecture tkomura@inf.ed.ac.uk Institute for Perception, Action & Behaviour School of Informatics Contouring Scaler Data Last Lecture...
Illumination Models & Shading
 Illumination Models & Shading Lighting vs. Shading Lighting Interaction between materials and light sources Physics Shading Determining the color of a pixel Computer Graphics ZBuffer(Scene) PutColor(x,y,Col(P));
Display. Introduction page 67 2D Images page 68. All Orientations page 69 Single Image page 70 3D Images page 71
 Display Introduction page 67 2D Images page 68 All Orientations page 69 Single Image page 70 3D Images page 71 Intersecting Sections page 71 Cube Sections page 72 Render page 73 1. Tissue Maps page 77
Visualization of the Marked Cells of Model Organism
 Visualization of the Marked Cells of Model Organism Radek Kubíček Department of Computer Graphics and Multimedia Brno University of Technology Brno / Czech Republic Abstract We will present the current
Medical Image Processing: Image Reconstruction and 3D Renderings
 Medical Image Processing: Image Reconstruction and 3D Renderings 김보형 서울대학교컴퓨터공학부 Computer Graphics and Image Processing Lab. 2011. 3. 23 1 Computer Graphics & Image Processing Computer Graphics : Create,
Computer Graphics I Lecture 11
 15-462 Computer Graphics I Lecture 11 Midterm Review Assignment 3 Movie Midterm Review Midterm Preview February 26, 2002 Frank Pfenning Carnegie Mellon University http://www.cs.cmu.edu/~fp/courses/graphics/
Direct Volume Rendering
 Direct Volume Rendering Balázs Csébfalvi Department of Control Engineering and Information Technology Budapest University of Technology and Economics Classification of Visualization Algorithms Indirect
GPU-Accelerated Deep Shadow Maps for Direct Volume Rendering
 Graphics Hardware (2006) M. Olano, P. Slusallek (Editors) GPU-Accelerated Deep Shadow Maps for Direct Volume Rendering Markus Hadwiger Andrea Kratz Christian Sigg Katja Bühler VRVis Research Center ETH
Medical Image Processing using MATLAB
 Medical Image Processing using MATLAB Emilia Dana SELEŢCHI University of Bucharest, Romania ABSTRACT 2. 3. 2. IMAGE PROCESSING TOOLBOX MATLAB and the Image Processing Toolbox provide a wide range of advanced
Multipass GPU Surface Rendering in 4D Ultrasound
 2012 Cairo International Biomedical Engineering Conference (CIBEC) Cairo, Egypt, December 20-21, 2012 Multipass GPU Surface Rendering in 4D Ultrasound Ahmed F. Elnokrashy 1,2, Marwan Hassan 1, Tamer Hosny
CIS 467/602-01: Data Visualization
 CIS 467/602-01: Data Visualization Vector Field Visualization Dr. David Koop Fields Tables Networks & Trees Fields Geometry Clusters, Sets, Lists Items Items (nodes) Grids Items Items Attributes Links
9. Three Dimensional Object Representations
 9. Three Dimensional Object Representations Methods: Polygon and Quadric surfaces: For simple Euclidean objects Spline surfaces and construction: For curved surfaces Procedural methods: Eg. Fractals, Particle
L1 - Introduction. Contents. Introduction of CAD/CAM system Components of CAD/CAM systems Basic concepts of graphics programming
 L1 - Introduction Contents Introduction of CAD/CAM system Components of CAD/CAM systems Basic concepts of graphics programming 1 Definitions Computer-Aided Design (CAD) The technology concerned with the
Visualizer An implicit surface rendering application
 June 01, 2004 Visualizer An implicit surface rendering application Derek Gerstmann - C1405511 MSc Computer Animation NCCA Bournemouth University OVERVIEW OF APPLICATION Visualizer is an interactive application
AMCS / CS 247 Scientific Visualization Lecture 10: (GPU) Texture Mapping. Markus Hadwiger, KAUST
 Texture Mapping. Markus Hadwiger, KAUST") AMCS / CS 247 Scientific Visualization Lecture 10: (GPU) Texture Mapping Markus Hadwiger, KAUST Reading Assignment #5 (until Oct. 8) Read (required): Real-Time Volume Graphics, Chapter 2 (GPU Programming)
AMCS / CS 247 Scientific Visualization Lecture 10: (GPU) Texture Mapping Markus Hadwiger, KAUST Reading Assignment #5 (until Oct. 8) Read (required): Real-Time Volume Graphics, Chapter 2 (GPU Programming)
ECS 175 COMPUTER GRAPHICS. Ken Joy.! Winter 2014
 ECS 175 COMPUTER GRAPHICS Ken Joy Winter 2014 Shading To be able to model shading, we simplify Uniform Media no scattering of light Opaque Objects No Interreflection Point Light Sources RGB Color (eliminating
Fast Interactive Region of Interest Selection for Volume Visualization
 Fast Interactive Region of Interest Selection for Volume Visualization Dominik Sibbing and Leif Kobbelt Lehrstuhl für Informatik 8, RWTH Aachen, 20 Aachen Email: {sibbing,kobbelt}@informatik.rwth-aachen.de
Homework #2. Shading, Ray Tracing, and Texture Mapping
 Computer Graphics Prof. Brian Curless CSE 457 Spring 2000 Homework #2 Shading, Ray Tracing, and Texture Mapping Prepared by: Doug Johnson, Maya Widyasari, and Brian Curless Assigned: Monday, May 8, 2000
Scientific Visualization Example exam questions with commented answers
 Scientific Visualization Example exam questions with commented answers The theoretical part of this course is evaluated by means of a multiple- choice exam. The questions cover the material mentioned during
CHAPTER 1 Graphics Systems and Models 3
 ?????? 1 CHAPTER 1 Graphics Systems and Models 3 1.1 Applications of Computer Graphics 4 1.1.1 Display of Information............. 4 1.1.2 Design.................... 5 1.1.3 Simulation and Animation...........
8. Tensor Field Visualization
 8. Tensor Field Visualization Tensor: extension of concept of scalar and vector Tensor data for a tensor of level k is given by t i1,i2,,ik (x 1,,x n ) Second-order tensor often represented by matrix Examples:
Computational Medical Imaging Analysis Chapter 4: Image Visualization
 Computational Medical Imaging Analysis Chapter 4: Image Visualization Jun Zhang Laboratory for Computational Medical Imaging & Data Analysis Department of Computer Science University of Kentucky Lexington,
Deferred Rendering Due: Wednesday November 15 at 10pm
 CMSC 23700 Autumn 2017 Introduction to Computer Graphics Project 4 November 2, 2017 Deferred Rendering Due: Wednesday November 15 at 10pm 1 Summary This assignment uses the same application architecture
Complex Shading Algorithms
 Complex Shading Algorithms CPSC 414 Overview So far Rendering Pipeline including recent developments Today Shading algorithms based on the Rendering Pipeline Arbitrary reflection models (BRDFs) Bump mapping
Illumination and Shading
 Illumination and Shading Illumination (Lighting)! Model the interaction of light with surface points to determine their final color and brightness! The illumination can be computed either at vertices or
Introduction to 3D Graphics
 Graphics Without Polygons Volume Rendering May 11, 2010 So Far Volumetric Rendering Techniques Misc. So Far Extended the Fixed Function Pipeline with a Programmable Pipeline Programming the pipeline is
Rendering Light Reflection Models
 Rendering Light Reflection Models Visual Imaging in the Electronic Age Donald P. Greenberg October 3, 2017 Lecture #13 Program of Computer Graphics, Cornell University General Electric - 167 Cornell in
Direct Volume Rendering. Overview
 Direct Volume Rendering Department of Computer Science University of New Hampshire Durham, NH 03824 Based on: Brodlie and Wood, Recent Advances in Visualization of Volumetric Data, Eurographics 2000 State
Overview. Direct Volume Rendering. Volume Rendering Integral. Volume Rendering Integral Approximation
 Overview Direct Volume Rendering Department of Computer Science University of New Hampshire Durham, NH 03824 Based on: Brodlie and Wood, Recent Advances in Visualization of Volumetric Data, Eurographics
CSE 167: Lecture #17: Volume Rendering. Jürgen P. Schulze, Ph.D. University of California, San Diego Fall Quarter 2012
 CSE 167: Introduction to Computer Graphics Lecture #17: Volume Rendering Jürgen P. Schulze, Ph.D. University of California, San Diego Fall Quarter 2012 Announcements Thursday, Dec 13: Final project presentations
Topic 9: Lighting & Reflection models 9/10/2016. Spot the differences. Terminology. Two Components of Illumination. Ambient Light Source
 Topic 9: Lighting & Reflection models Lighting & reflection The Phong reflection model diffuse component ambient component specular component Spot the differences Terminology Illumination The transport
CPSC / Texture Mapping
 CPSC 599.64 / 601.64 Introduction and Motivation so far: detail through polygons & materials example: brick wall problem: many polygons & materials needed for detailed structures inefficient for memory
Topic 9: Lighting & Reflection models. Lighting & reflection The Phong reflection model diffuse component ambient component specular component
 Topic 9: Lighting & Reflection models Lighting & reflection The Phong reflection model diffuse component ambient component specular component Spot the differences Terminology Illumination The transport
Complex Features on a Surface. CITS4241 Visualisation Lectures 22 & 23. Texture mapping techniques. Texture mapping techniques
 Complex Features on a Surface CITS4241 Visualisation Lectures 22 & 23 Texture Mapping Rendering all surfaces as blocks of colour Not very realistic result! Even with shading Many objects have detailed
Global Illumination. CMPT 361 Introduction to Computer Graphics Torsten Möller. Machiraju/Zhang/Möller
 Global Illumination CMPT 361 Introduction to Computer Graphics Torsten Möller Reading Foley, van Dam (better): Chapter 16.7-13 Angel: Chapter 5.11, 11.1-11.5 2 Limitation of local illumination A concrete
Module Contact: Dr Stephen Laycock, CMP Copyright of the University of East Anglia Version 1
 UNIVERSITY OF EAST ANGLIA School of Computing Sciences Main Series PG Examination 2013-14 COMPUTER GAMES DEVELOPMENT CMPSME27 Time allowed: 2 hours Answer any THREE questions. (40 marks each) Notes are
A Survey of Volumetric Visualization Techniques for Medical Images
 International Journal of Research Studies in Computer Science and Engineering (IJRSCSE) Volume 2, Issue 4, April 2015, PP 34-39 ISSN 2349-4840 (Print) & ISSN 2349-4859 (Online) www.arcjournals.org A Survey
Scalar Field Visualization. Some slices used by Prof. Mike Bailey
 Scalar Field Visualization Some slices used by Prof. Mike Bailey Scalar Fields The approximation of certain scalar function in space f(x,y,z). Most of time, they come in as some scalar values defined on