Introduction to debugging. Martin Čuma Center for High Performance Computing University of Utah
|
|
|
- Hugo Garrison
- 5 years ago
- Views:
Transcription


1 Introduction to debugging Martin Čuma Center for High Performance Computing University of Utah
2 Overview Program errors Simple debugging Graphical debugging DDT and Totalview Intel tools Please fill survey 11/8/ Slide 2
3 Program errors crashes segmentation faults (bad memory access) often writes core file snapshot of memory at the time of the crash wrong I/O (missing files) hardware failures incorrect results reasonable but incorrect results NaNs not a numbers division by 0, 11/8/ Slide 3

4 write/printf write variables of interest into the stdout or file simplest but cumbersome need to recompile and rerun need to browse through potentially large output 11/8/ Slide 4

5 Terminal debuggers text only, e.g. gdb, idb need to remember commands or their abbreviations need to know lines in the code (or have it opened in other window) useful for quick code checking on compute nodes and core dump analysis 11/8/ Slide 5
6 GUI debuggers have graphical user interface freeware or commercial Eclipse CDT - free PGI s pdbg part of PGI compiler suite Intel development tools Rogue Wave Totalview - commercial Allinea DDT - commercial 11/8/ Slide 6
7 Totalview and DDT The only real alternative for parallel or accelerator debugging Cost a lot of money (thousands of $), but, worth it We had Totalview license (for historical reasons), 32 tokens enough for our needs (renewal ~$1500/yr) In 2017 we switched to DDT which gave us competitive upgrade XSEDE systems have DDT 11/8/ Slide 7
8 How to use Totalview/DDT 1. Compile binary with debugging information flag, -g gcc g test.f o test 2. Load module and run Totalview or DDT module load totalview ; module load ddt TV/DDT + executable totalview executable ; ddt executable TV/DDT + core file totalview executable core_file ; ddt executable corefile Run TV/DDT and choose what to debug in a startup dialog totalview ; ddt 11/8/2018 Slide 8


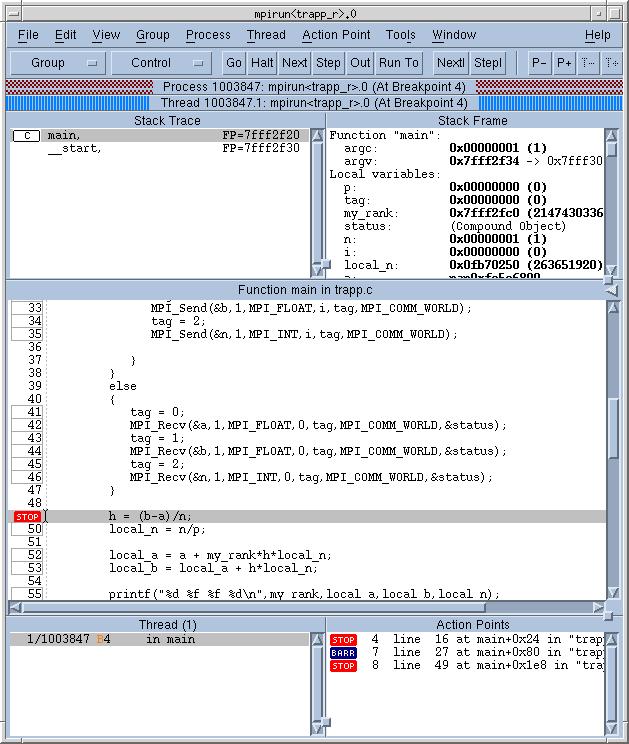
9 Totalview windows 11/8/2018 Slide 9

10 DDT screenshot 11/8/2018 Slide 10
11 Debugger basic operations Data examination view data in the variable windows change the values of variables modify display of the variables visualize data Action points breakpoints and barriers (static or conditional) watchpoints evaluation of expressions 11/8/ Slide 11
12 Multiprocess debugging Automatic attachment to MPI tasks and threads Create process and thread groups Share breakpoints among processes/threads Process/thread barrier breakpoints Process/thread group single-stepping View variables across procs/threads Display MPI message queue state CUDA/OpenACC support 11/8/ Slide 12
13 How to use DDT 1. Compile binary with debugging information flag -g gcc g test.f o test 2. Load module and run DDT module load ddt DDT + executable ddt./executable DDT + core file ddt executable core_file 11/8/ Slide 13

14 How to use DDT run DDT and attach the executable - start DDT - fill in information in the Run dialog - click Run button to start the program run DDT and attach running program - start DDT - click Attach to an already running program - choose process and click Attach to button 3. DDT operation left mouse button - select right mouse button context sensitive menu 11/8/ Slide 14


15 DDT windows Array viewer window Main window Cross-process comparison window Process window 11/8/ Slide 15
16 DDT basic operations Data examination view data in the variable windows change the values of variables modify display of the variables visualize data Action points breakpoints and barriers (static or conditional) watchpoints and tracepoints evaluation of expressions 11/8/ Slide 16
17 Multiprocess debugging Automatic attachment of child processes Create process groups Share breakpoints among processes Process barrier breakpoints Process group single-stepping View variables across procs/threads Display MPI message queue state 11/8/ Slide 17
18 Basic operation example Load up an existing program DDT windows step through the code place breakpoints examine variables Load a core file examine the crash point 11/8/ Slide 18
19 Process view window Stack trace procedure hierarchy - left Stack frame variables display - right Source code code + process navigation - center Threads list in case of multithreaded application - top Action points list of breakpoints, barriers, - bottom 11/8/ Slide 19
20 Action points Breakpoints and barriers toggle location with left mouse (shift for barrier) right-click Properties for options option conditional breakpoints Watchpoints watch for change in a memory location Tracepoints write screen output whenever line is executed 11/8/ Slide 20
21 Data examination Scalars in variable view on the right of the main window Arrays in Array viewer right click on a variable, choose Array viewer adjust array dimensions, hit evaluate filter array values, e.g. $value > 0 variable visualization, statistics, 11/8/ Slide 21

22 Parallel debugging Process/thread groups Cross-process/thread data comparison Message queue state graph and display 11/8/ Slide 22
23 Memory debugging Enable in the initial Run dialog Memory usage Memory leak detection Exceeding array bounds Dangling pointers 11/8/ Slide 23
24 Accelerator debugging We license the GPU add-on to DDT Works well with CUDA With OpenACC, the debugger sees what the compiler generates so stepping through code may not correspond to actual source lines Use breakpoints and examine data at the breakpoints 11/8/ Slide 24
25 DDT webpage Some useful resources Setting up DDT Clusters: module load ddt Some group desktops: inquire at CHPC Documentation /8/ Slide 25
26 Code checkers compilers check for syntax errors some compiler flags help too (-C) memory checking tools - many errors are due to bad memory management valgrind easy to use purify harder to use 11/8/ Slide 26
27 Intel software development products We have a 2 concurrent user license Tools for all stages of development Compilers and libraries Verification tools Profilers More info 11/8/ Slide 27
28 Intel Inspector Thread checking Data races and deadlocks Memory checker Like leaks or corruption Good alternative to Totalview MemoryScape or DDT Standalone or GUI integration More info 11/8/ Slide 28
29 Intel Inspector Source the environment module load inspectorxe Compile with tcheck -g ifort -openmp -tcheck -g trap.f Run tcheck inspxe-gui graphical user interface inspxe-cl command line Tutorial 11/8/ Slide 29
30 Intel Trace Analyzer and Collector MPI profiler and correctness checker Detects violations of MPI standard and errors in execution environment To use correctness checker module load intel impi itac setenv VT_CHECK_TRACING 0 mpirun check-mpi n 4./myApp ITAC documentation 11/8/ Slide 30
31 Interpreted languages debugging Matlab Debugger built in the editor Python R gdb like debugging built in (pdb module) Many different third party IDEs PyCharm is nice but beware of larger memory/cpu use if debugging big data gdb like debugging built in (traceback(), browse(), debug()) Rstudio allows debugging 11/8/ Slide 31
32 Conclusions Terminal debuggers Compiler vendor debuggers Totalview for graphical debugging Code checkers and memory checkers InspectorXE for thread and memory debugging ITAC MPI checker Interpreted languages debugging Please fill survey: Slide 32
Debugging, benchmarking, tuning i.e. software development tools. Martin Čuma Center for High Performance Computing University of Utah
 Debugging, benchmarking, tuning i.e. software development tools Martin Čuma Center for High Performance Computing University of Utah m.cuma@utah.edu SW development tools Development environments Compilers
Debugging with Totalview. Martin Čuma Center for High Performance Computing University of Utah
 Debugging with Totalview Martin Čuma Center for High Performance Computing University of Utah mcuma@chpc.utah.edu Overview Totalview introduction. Basic operation. Serial debugging. Parallel debugging.
Welcome. HRSK Practical on Debugging, Zellescher Weg 12 Willers-Bau A106 Tel
 Center for Information Services and High Performance Computing (ZIH) Welcome HRSK Practical on Debugging, 03.04.2009 Zellescher Weg 12 Willers-Bau A106 Tel. +49 351-463 - 31945 Matthias Lieber (matthias.lieber@tu-dresden.de)
TotalView. Debugging Tool Presentation. Josip Jakić
 TotalView Debugging Tool Presentation Josip Jakić josipjakic@ipb.ac.rs Agenda Introduction Getting started with TotalView Primary windows Basic functions Further functions Debugging parallel programs Topics
Debugging with GDB and DDT
 Debugging with GDB and DDT Ramses van Zon SciNet HPC Consortium University of Toronto June 28, 2012 1/41 Ontario HPC Summerschool 2012 Central Edition: Toronto Outline Debugging Basics Debugging with the
Debugging with GDB and DDT
 Debugging with GDB and DDT Ramses van Zon SciNet HPC Consortium University of Toronto June 13, 2014 1/41 Ontario HPC Summerschool 2014 Central Edition: Toronto Outline Debugging Basics Debugging with the
GPU Debugging Made Easy. David Lecomber CTO, Allinea Software
 GPU Debugging Made Easy David Lecomber CTO, Allinea Software david@allinea.com Allinea Software HPC development tools company Leading in HPC software tools market Wide customer base Blue-chip engineering,
Debugging with TotalView
 Debugging with TotalView Le Yan HPC Consultant User Services Goals Learn how to start TotalView on Linux clusters Get familiar with TotalView graphic user interface Learn basic debugging functions of TotalView
SGI Altix Getting Correct Code Reiner Vogelsang SGI GmbH
 SGI Altix Getting Correct Code Reiner Vogelsang SGI GmbH reiner@sgi.com Module Objectives After completing the module, you will able to Find caveats and hidden errors in application codes Handle debuggers
Parallel Debugging with TotalView BSC-CNS
 Parallel Debugging with TotalView BSC-CNS AGENDA What debugging means? Debugging Tools in the RES Allinea DDT as alternative (RogueWave Software) What is TotalView Compiling Your Program Starting totalview
Eliminate Threading Errors to Improve Program Stability
 Introduction This guide will illustrate how the thread checking capabilities in Intel Parallel Studio XE can be used to find crucial threading defects early in the development cycle. It provides detailed
Introduction to Parallel Programming. Martin Čuma Center for High Performance Computing University of Utah
 Introduction to Parallel Programming Martin Čuma Center for High Performance Computing University of Utah m.cuma@utah.edu Overview Types of parallel computers. Parallel programming options. How to write
GPU Technology Conference Three Ways to Debug Parallel CUDA Applications: Interactive, Batch, and Corefile
 GPU Technology Conference 2015 Three Ways to Debug Parallel CUDA Applications: Interactive, Batch, and Corefile Three Ways to Debug Parallel CUDA Applications: Interactive, Batch, and Corefile What do
Eliminate Memory Errors to Improve Program Stability
 Introduction INTEL PARALLEL STUDIO XE EVALUATION GUIDE This guide will illustrate how Intel Parallel Studio XE memory checking capabilities can find crucial memory defects early in the development cycle.
Eliminate Threading Errors to Improve Program Stability
 Eliminate Threading Errors to Improve Program Stability This guide will illustrate how the thread checking capabilities in Parallel Studio can be used to find crucial threading defects early in the development
Debugging HPC Applications. David Lecomber CTO, Allinea Software
 Debugging HPC Applications David Lecomber CTO, Allinea Software david@allinea.com Agenda Bugs and Debugging Debugging parallel applications Debugging OpenACC and other hybrid codes Debugging for Petascale
Jackson Marusarz Software Technical Consulting Engineer
 Jackson Marusarz Software Technical Consulting Engineer What Will Be Covered Overview Memory/Thread analysis New Features Deep dive into debugger integrations Demo Call to action 2 Analysis Tools for Diagnosis
Guillimin HPC Users Meeting July 14, 2016
 Guillimin HPC Users Meeting July 14, 2016 guillimin@calculquebec.ca McGill University / Calcul Québec / Compute Canada Montréal, QC Canada Outline Compute Canada News System Status Software Updates Training
Addressing the Increasing Challenges of Debugging on Accelerated HPC Systems. Ed Hinkel Senior Sales Engineer
 Addressing the Increasing Challenges of Debugging on Accelerated HPC Systems Ed Hinkel Senior Sales Engineer Agenda Overview - Rogue Wave & TotalView GPU Debugging with TotalView Nvdia CUDA Intel Phi 2
Eliminate Memory Errors to Improve Program Stability
 Eliminate Memory Errors to Improve Program Stability This guide will illustrate how Parallel Studio memory checking capabilities can find crucial memory defects early in the development cycle. It provides
Memory & Thread Debugger
 Memory & Thread Debugger Here is What Will Be Covered Overview Memory/Thread analysis New Features Deep dive into debugger integrations Demo Call to action Intel Confidential 2 Analysis Tools for Diagnosis
This guide will show you how to use Intel Inspector XE to identify and fix resource leak errors in your programs before they start causing problems.
 Introduction A resource leak refers to a type of resource consumption in which the program cannot release resources it has acquired. Typically the result of a bug, common resource issues, such as memory
Hands-on Workshop on How To Debug Codes at the Institute
 Hands-on Workshop on How To Debug Codes at the Institute H. Birali Runesha, Shuxia Zhang and Ben Lynch (612) 626 0802 (help) help@msi.umn.edu October 13, 2005 Outline Debuggers at the Institute Totalview
Le Yan Louisiana Optical Network Initiative. 8/3/2009 Scaling to Petascale Virtual Summer School
 Parallel Debugging Techniques Le Yan Louisiana Optical Network Initiative 8/3/2009 Scaling to Petascale Virtual Summer School Outline Overview of parallel debugging Challenges Tools Strategies Gtf Get
Improving the Productivity of Scalable Application Development with TotalView May 18th, 2010
 Improving the Productivity of Scalable Application Development with TotalView May 18th, 2010 Chris Gottbrath Principal Product Manager Rogue Wave Major Product Offerings 2 TotalView Technologies Family
Debugging for the hybrid-multicore age (A HPC Perspective) David Lecomber CTO, Allinea Software
 David Lecomber CTO, Allinea Software") Debugging for the hybrid-multicore age (A HPC Perspective) David Lecomber CTO, Allinea Software david@allinea.com Agenda What is HPC? How is scale affecting HPC? Achieving tool scalability Scale in practice
Debugging for the hybrid-multicore age (A HPC Perspective) David Lecomber CTO, Allinea Software david@allinea.com Agenda What is HPC? How is scale affecting HPC? Achieving tool scalability Scale in practice
Using Intel VTune Amplifier XE for High Performance Computing
 Using Intel VTune Amplifier XE for High Performance Computing Vladimir Tsymbal Performance, Analysis and Threading Lab 1 The Majority of all HPC-Systems are Clusters Interconnect I/O I/O... I/O I/O Message
Introduction to Parallel Programming. Martin Čuma Center for High Performance Computing University of Utah
 Introduction to Parallel Programming Martin Čuma Center for High Performance Computing University of Utah mcuma@chpc.utah.edu Overview Types of parallel computers. Parallel programming options. How to
Developing, Debugging, and Optimizing GPU Codes for High Performance Computing with Allinea Forge
 Developing, Debugging, and Optimizing GPU Codes for High Performance Computing with Allinea Forge Ryan Hulguin Applications Engineer ryan.hulguin@arm.com Agenda Introduction Overview of Allinea Products
Debugging at Scale Lindon Locks
 Debugging at Scale Lindon Locks llocks@allinea.com Debugging at Scale At scale debugging - from 100 cores to 250,000 Problems faced by developers on real systems Alternative approaches to debugging and
Intro to Segmentation Fault Handling in Linux. By Khanh Ngo-Duy
 Intro to Segmentation Fault Handling in Linux By Khanh Ngo-Duy Khanhnd@elarion.com Seminar What is Segmentation Fault (Segfault) Examples and Screenshots Tips to get Segfault information What is Segmentation
Debugging Your CUDA Applications With CUDA-GDB
 Debugging Your CUDA Applications With CUDA-GDB Outline Introduction Installation & Usage Program Execution Control Thread Focus Program State Inspection Run-Time Error Detection Tips & Miscellaneous Notes
DDT: A visual, parallel debugger on Ra
 DDT: A visual, parallel debugger on Ra David M. Larue dlarue@mines.edu High Performance & Research Computing Campus Computing, Communications, and Information Technologies Colorado School of Mines March,
Debugging. John Lockman Texas Advanced Computing Center
 Debugging John Lockman Texas Advanced Computing Center Debugging Outline GDB Basic use Attaching to a running job DDT Identify MPI problems using Message Queues Catch memory errors PTP For the extremely
ECMWF Workshop on High Performance Computing in Meteorology. 3 rd November Dean Stewart
 ECMWF Workshop on High Performance Computing in Meteorology 3 rd November 2010 Dean Stewart Agenda Company Overview Rogue Wave Product Overview IMSL Fortran TotalView Debugger Acumem ThreadSpotter 1 Copyright
Programming LRZ. Dr. Volker Weinberg, RRZE, 2018
 Programming Environment @ LRZ Dr. Volker Weinberg, weinberg@lrz.de RRZE, 2018 Development tools Activity Tools Linux versions Source code development Editors vi, emacs, etc. Executable creation Compilers
Coding Tools. (Lectures on High-performance Computing for Economists VI) Jesús Fernández-Villaverde 1 and Pablo Guerrón 2 March 25, 2018
 Jesús Fernández-Villaverde 1 and Pablo Guerrón 2 March 25, 2018") Coding Tools (Lectures on High-performance Computing for Economists VI) Jesús Fernández-Villaverde 1 and Pablo Guerrón 2 March 25, 2018 1 University of Pennsylvania 2 Boston College Compilers Compilers
Coding Tools (Lectures on High-performance Computing for Economists VI) Jesús Fernández-Villaverde 1 and Pablo Guerrón 2 March 25, 2018 1 University of Pennsylvania 2 Boston College Compilers Compilers
Debugging. Marcelo Ponce SciNet HPC Consortium University of Toronto. July 15, /41 Ontario HPC Summerschool 2016 Central Edition: Toronto
 Debugging Marcelo Ponce SciNet HPC Consortium University of Toronto July 15, 2016 1/41 Ontario HPC Summerschool 2016 Central Edition: Toronto Outline Debugging Basics Debugging with the command line: GDB
The Eclipse Parallel Tools Platform
 May 1, 2012 Toward an Integrated Development Environment for Improved Software Engineering on Crays Agenda 1. What is the Eclipse Parallel Tools Platform (PTP) 2. Tour of features available in Eclipse/PTP
HPCC - Hrothgar. Getting Started User Guide TotalView. High Performance Computing Center Texas Tech University
 HPCC - Hrothgar Getting Started User Guide TotalView High Performance Computing Center Texas Tech University HPCC - Hrothgar 2 Table of Contents *This user guide is under development... 3 1. Introduction...
Intel Parallel Studio XE 2015
 2015 Create faster code faster with this comprehensive parallel software development suite. Faster code: Boost applications performance that scales on today s and next-gen processors Create code faster:
DDT Debugging Techniques
 DDT Debugging Techniques Carlos Rosales carlos@tacc.utexas.edu Scaling to Petascale 2010 July 7, 2010 Debugging Parallel Programs Usual problems Memory access issues Special cases not accounted for in
CS354 gdb Tutorial Written by Chris Feilbach
 CS354 gdb Tutorial Written by Chris Feilbach Purpose This tutorial aims to show you the basics of using gdb to debug C programs. gdb is the GNU debugger, and is provided on systems that
Tools and Methodology for Ensuring HPC Programs Correctness and Performance. Beau Paisley
 Tools and Methodology for Ensuring HPC Programs Correctness and Performance Beau Paisley bpaisley@allinea.com About Allinea Over 15 years of business focused on parallel programming development tools Strong
TotalView Release Notes
 Platform Changes The following new platforms are now supported by TotalView: NVIDIA CUDA 5.0 and 5.5 Mac OS X Mavericks (10.9) Ubuntu 12.04, 12.10 and 13.04 Fedora 19 The following platforms are no longer
Intro to MS Visual C++ Debugging
 Intro to MS Visual C++ Debugging 1 Debugger Definition A program used to control the execution of another program for diagnostic purposes. Debugger Features / Operations Single-Stepping 100011101010101010
ECE/ME/EMA/CS 759 High Performance Computing for Engineering Applications
 ECE/ME/EMA/CS 759 High Performance Computing for Engineering Applications Elements of Program Debugging Dan Negrut, 2017 ECE/ME/EMA/CS 759 UW-Madison Debugging on Euler [with gdb] Slides on gdb include
Welcomes PRACE/LinkSCEEM 2011 Winter School Jacques Philouze Vice President Sales & Marketing
 Welcomes PRACE/LinkSCEEM 2011 Winter School Jacques Philouze jacques@allinea.com Vice President Sales & Marketing Content Company Background Products in more depth Allinea OPT (Optimization and Profiling
Intel Parallel Studio XE 2017 Composer Edition BETA C++ - Debug Solutions Release Notes
 Developer Zone Intel Parallel Studio XE 2017 Composer Edition BETA C++ - Debug Solutions Release Notes Submitted by Georg Z. (Intel) on August 5, 2016 This page provides the current Release Notes for the
TotalView Training. Developing parallel, data-intensive applications is hard. We make it easier. Copyright 2012 Rogue Wave Software, Inc.
 TotalView Training Developing parallel, data-intensive applications is hard. We make it easier. 1 Agenda Introduction Startup Remote Display Debugging UI Navigation and Process Control Action Points Data
ECE QNX Real-time Lab
 Department of Electrical & Computer Engineering Concordia University ECE QNX Real-time Lab User Guide Dan Li 9/12/2011 User Guide of ECE Real-time QNX Lab Contents 1. About Real-time QNX Lab... 2 Contacts...
Debugging. P.Dagna, M.Cremonesi. May 2015
 Debugging P.Dagna, M.Cremonesi May 2015 Introduction Oneofthemostwidelyusedmethodstofindoutthereasonofa strange behavior in a program is the insertion of printf or write statements in the supposed critical
Allinea Unified Environment
 Allinea Unified Environment Allinea s unified tools for debugging and profiling HPC Codes Beau Paisley Allinea Software bpaisley@allinea.com 720.583.0380 Today s Challenge Q: What is the impact of current
Introduction to Parallel Programming. Martin Čuma Center for High Performance Computing University of Utah
 Introduction to Parallel Programming Martin Čuma Center for High Performance Computing University of Utah mcuma@chpc.utah.edu Overview Types of parallel computers. Parallel programming options. How to
Getting Started Tutorial: Analyzing Threading Errors
 Getting Started Tutorial: Analyzing Threading Errors Intel Inspector XE 2011 for Linux* OS Fortran Sample Application Code Document Number: 326600-001 World Wide Web: http://developer.intel.com Legal Information
IBM PSSC Montpellier Customer Center. Content
 Content IBM PSSC Montpellier Customer Center Standard Tools Compiler Options GDB IBM System Blue Gene/P Specifics Core Files + addr2line Coreprocessor Supported Commercial Software TotalView Debugger Allinea
Getting Started Tutorial: Analyzing Memory Errors
 Getting Started Tutorial: Analyzing Memory Errors Intel Inspector XE 2011 for Linux* OS Fortran Sample Application Code Document Number: 326596-001 World Wide Web: http://developer.intel.com Legal Information
Integrated Software Environment. Part 2
 Integrated Software Environment Part 2 Operating Systems An operating system is the most important software that runs on a computer. It manages the computer's memory, processes, and all of its software
Debugging process. The debugging process can be divided into four main steps: 1. Start your program, specifying anything that might affect its
 Debugging Introduction One of the most widely used methods to find out the reason of a strange behavior in a program is the insertion of printf or write statements in the supposed critical area. However
Debugging CUDA Applications with Allinea DDT. Ian Lumb Sr. Systems Engineer, Allinea Software Inc.
 Debugging CUDA Applications with Allinea DDT Ian Lumb Sr. Systems Engineer, Allinea Software Inc. ilumb@allinea.com GTC 2013, San Jose, March 20, 2013 Embracing GPUs GPUs a rival to traditional processors
GDB Tutorial. A Walkthrough with Examples. CMSC Spring Last modified March 22, GDB Tutorial
 A Walkthrough with Examples CMSC 212 - Spring 2009 Last modified March 22, 2009 What is gdb? GNU Debugger A debugger for several languages, including C and C++ It allows you to inspect what the program
Debugging with TotalView
 Debugging with TotalView Dieter an Mey Center for Computing and Communication Aachen University of Technology anmey@rz.rwth-aachen.de 1 TotalView, Dieter an Mey, SunHPC 2006 Debugging on Sun dbx line mode
Facing the challenges of. New Approaches To Debugging Complex Codes! Ed Hinkel, Sales Engineer Rogue Wave Software
 Facing the challenges of or New Approaches To Debugging Complex Codes! Ed Hinkel, Sales Engineer Rogue Wave Software Agenda Introduction Rogue Wave! TotalView! Approaching the Debugging Challenge! 1 TVScript
For Distributed Performance
 For Distributed Performance Intel Parallel Studio XE 2017 development suite Empowering Faster Code Faster Delivering HPC Development Solutions Over 20 years Industry Collaboration on Standards PARALLELISM
DEBUGGING ON FERMI PREPARING A DEBUGGABLE APPLICATION GDB. GDB on front-end nodes
 DEBUGGING ON FERMI Debugging your application on a system based on a BG/Q architecture like FERMI could be an hard task due to the following problems: the core files generated by a crashing job on FERMI
STARTING THE DDT DEBUGGER ON MIO, AUN, & MC2. (Mouse over to the left to see thumbnails of all of the slides)
") STARTING THE DDT DEBUGGER ON MIO, AUN, & MC2 (Mouse over to the left to see thumbnails of all of the slides) ALLINEA DDT Allinea DDT is a powerful, easy-to-use graphical debugger capable of debugging a
STARTING THE DDT DEBUGGER ON MIO, AUN, & MC2 (Mouse over to the left to see thumbnails of all of the slides) ALLINEA DDT Allinea DDT is a powerful, easy-to-use graphical debugger capable of debugging a
Understanding Dynamic Parallelism
 Understanding Dynamic Parallelism Know your code and know yourself Presenter: Mark O Connor, VP Product Management Agenda Introduction and Background Fixing a Dynamic Parallelism Bug Understanding Dynamic
Intel Parallel Inspector 2011 Getting Started Tutorials
 Intel Parallel Inspector 2011 Getting Started Tutorials Document Number: 323355-001US World Wide Web: http://developer.intel.com Legal Information Legal Information INFORMATION IN THIS DOCUMENT IS PROVIDED
Parallel Debugging. ª Objective. ª Contents. ª Learn the basics of debugging parallel programs
 ª Objective ª Learn the basics of debugging parallel programs ª Contents ª Launching a debug session ª The Parallel Debug Perspective ª Controlling sets of processes ª Controlling individual processes
18-600: Recitation #3
 18-600: Recitation #3 Bomb Lab & GDB Overview September 12th, 2017 1 Today X86-64 Overview Bomb Lab Introduction GDB Tutorial 2 3 x86-64: Register Conventions Arguments passed in registers: %rdi, %rsi,
ELP. Effektive Laufzeitunterstützung für zukünftige Programmierstandards. Speaker: Tim Cramer, RWTH Aachen University
 ELP Effektive Laufzeitunterstützung für zukünftige Programmierstandards Agenda ELP Project Goals ELP Achievements Remaining Steps ELP Project Goals Goals of ELP: Improve programmer productivity By influencing
CSE 374 Programming Concepts & Tools. Brandon Myers Winter 2015 Lecture 11 gdb and Debugging (Thanks to Hal Perkins)
") CSE 374 Programming Concepts & Tools Brandon Myers Winter 2015 Lecture 11 gdb and Debugging (Thanks to Hal Perkins) Hacker tool of the week (tags) Problem: I want to find the definition of a function or
CSE 374 Programming Concepts & Tools Brandon Myers Winter 2015 Lecture 11 gdb and Debugging (Thanks to Hal Perkins) Hacker tool of the week (tags) Problem: I want to find the definition of a function or
Development tools to enable Multicore
 Development tools to enable Multicore From the desktop to the extreme A perspective on multicore looking in from HPC David Lecomber CTO, Allinea Software david@allinea.com Introduction The Multicore Challenge
Blue Gene/Q User Workshop. Debugging
 Blue Gene/Q User Workshop Debugging Topics GDB Core Files Coreprocessor 2 GNU Debugger (GDB) The GNU Debugger (GDB) The Blue Gene/Q system includes support for running GDB with applications that run on
Short Introduction to Debugging Tools on the Cray XC40
 Short Introduction to Debugging Tools on the Cray XC40 Overview Debugging Get your code up and running correctly. Profiling Locate performance bottlenecks. Light weight At most relinking. Get a first picture
Debugging and Optimizing Programs Accelerated with Intel Xeon Phi Coprocessors
 Debugging and Optimizing Programs Accelerated with Intel Xeon Phi Coprocessors Chris Gottbrath Rogue Wave Software Boulder, CO Chris.Gottbrath@roguewave.com Abstract Intel Xeon Phi coprocessors present
TotalView. Users Guide. August 2001 Version 5.0
 TotalView Users Guide August 2001 Version 5.0 Copyright 1999 2001 by Etnus LLC. All rights reserved. Copyright 1998 1999 by Etnus Inc. All rights reserved. Copyright 1996 1998 by Dolphin Interconnect Solutions,
Programming for the Intel Many Integrated Core Architecture By James Reinders. The Architecture for Discovery. PowerPoint Title
 Programming for the Intel Many Integrated Core Architecture By James Reinders The Architecture for Discovery PowerPoint Title Intel Xeon Phi coprocessor 1. Designed for Highly Parallel workloads 2. and
Intel MPI Cluster Edition on Graham A First Look! Doug Roberts
 Intel MPI Cluster Edition on Graham A First Look! Doug Roberts SHARCNET / COMPUTE CANADA Intel Parallel Studio XE 2016 Update 4 Cluster Edition for Linux 1. Intel(R) MPI Library 5.1 Update 3 Cluster Ed
Debugging with gdb and valgrind
 Debugging with gdb and valgrind Dr. Axel Kohlmeyer Associate Dean for Scientific Computing, CST Associate Director, Institute for Computational Science Assistant Vice President for High-Performance Computing
Introduction to Parallel Programming. Martin Čuma Center for High Performance Computing University of Utah
 Introduction to Parallel Programming Martin Čuma Center for High Performance Computing University of Utah mcuma@chpc.utah.edu Overview Types of parallel computers. Parallel programming options. How to
Eliminate Memory Errors and Improve Program Stability
 Eliminate Memory Errors and Improve Program Stability 1 Can running one simple tool make a difference? Yes, in many cases. You can find errors that cause complex, intermittent bugs and improve your confidence
What's New in CDT 7.0? dominique dot toupin at ericsson dot com
 What's New in CDT 7.0? dominique dot toupin at ericsson dot com 23 committers Project Status Representing IDE vendors, consultants, and users Downloads continue to grow Galileo SR-1: 530,000! CDT / Linux
Debugging Programs Accelerated with Intel Xeon Phi Coprocessors
 Debugging Programs Accelerated with Intel Xeon Phi Coprocessors A White Paper by Rogue Wave Software. Rogue Wave Software 5500 Flatiron Parkway, Suite 200 Boulder, CO 80301, USA www.roguewave.com Debugging
NightStar. NightView Source Level Debugger. Real-Time Linux Debugging and Analysis Tools BROCHURE
 NightStar Real-Time Linux Debugging and Analysis Tools Concurrent s NightStar is a powerful, integrated tool set for debugging and analyzing time-critical Linux applications. NightStar tools run with minimal
Debugging and Profiling
 Debugging and Profiling Dr. Axel Kohlmeyer Senior Scientific Computing Expert Information and Telecommunication Section The Abdus Salam International Centre for Theoretical Physics http://sites.google.com/site/akohlmey/
The Cray Programming Environment. An Introduction
 The Cray Programming Environment An Introduction Vision Cray systems are designed to be High Productivity as well as High Performance Computers The Cray Programming Environment (PE) provides a simple consistent
Allinea DDT Debugger. Dan Mazur, McGill HPC March 5,
 Allinea DDT Debugger Dan Mazur, McGill HPC daniel.mazur@mcgill.ca guillimin@calculquebec.ca March 5, 2015 1 Outline Introduction and motivation Guillimin login and DDT configuration Compiling for a debugger
CS2141 Software Development using C/C++ Debugging
 CS2141 Software Development using C/C++ Debugging Debugging Tips Examine the most recent change Error likely in, or exposed by, code most recently added Developing code incrementally and testing along
12. Debugging. Overview. COMP1917: Computing 1. Developing Programs. The Programming Cycle. Programming cycle. Do-it-yourself debugging
 COMP1917 12s2 Debugging 1 COMP1917: Computing 1 12. Debugging Overview Programming cycle Do-it-yourself debugging Debugging withgdb Nastier bugs Memory leaks COMP1917 12s2 Debugging 2 Developing Programs
TotalView Release Notes
 These release notes contain a summary of new features and enhancements, late-breaking product issues, migration from earlier releases, and bug fixes. PLEASE NOTE: The version of this document in the product
Debugging on Intel Platforms
 White Paper Robert Mueller-Albrecht Developer Products Division Intel Corporation Debugging on Intel Platforms Introduction...3 Overview...3 Servers and Workstations...4 Support for Linux*, Mac OS X*,
Data and File Structures Laboratory
 Tools: GDB, Valgrind Assistant Professor Machine Intelligence Unit Indian Statistical Institute, Kolkata August, 2018 1 GDB 2 Valgrind A programmer s experience Case I int x = 10, y = 25; x = x++ + y++;
Parallel Programming and Debugging with CUDA C. Geoff Gerfin Sr. System Software Engineer
 Parallel Programming and Debugging with CUDA C Geoff Gerfin Sr. System Software Engineer CUDA - NVIDIA s Architecture for GPU Computing Broad Adoption Over 250M installed CUDA-enabled GPUs GPU Computing
Exercise Session 6 Computer Architecture and Systems Programming
 Systems Group Department of Computer Science ETH Zürich Exercise Session 6 Computer Architecture and Systems Programming Herbstsemester 2016 Agenda GDB Outlook on assignment 6 GDB The GNU Debugger 3 Debugging..
Getting Started Tutorial: Analyzing Threading Errors
 Getting Started Tutorial: Analyzing Threading Errors Intel Inspector XE 2011 for Windows* OS C++ Sample Application Code Document Number: 326597-001 World Wide Web: http://developer.intel.com Legal Information
Introduction to IntelliJ
 Introduction to IntelliJ IntelliJ is a large software package used by professional software developers. This document will give you a brief introduction but is by no means exhaustive. If you have questions
Princeton University COS 217: Introduction to Programming Systems GDB Tutorial and Reference
 Princeton University COS 217: Introduction to Programming Systems GDB Tutorial and Reference Part 1: Tutorial This tutorial describes how to use a minimal subset of the gdb debugger. For more information
Productive Performance on the Cray XK System Using OpenACC Compilers and Tools
 Productive Performance on the Cray XK System Using OpenACC Compilers and Tools Luiz DeRose Sr. Principal Engineer Programming Environments Director Cray Inc. 1 The New Generation of Supercomputers Hybrid
Typical Bugs in parallel Programs
 Center for Information Services and High Performance Computing (ZIH) Typical Bugs in parallel Programs Parallel Programming Course, Dresden, 8.- 12. February 2016 Joachim Protze (protze@rz.rwth-aachen.de)