CORPORATE PRESENTATION 2014
|
|
|
- Branden Wood
- 5 years ago
- Views:
Transcription
1 CORPORATE PRESENTATION 2014
2 ABOUT DIGITAL GAMING


")

3 Digital gaming is everywhere Smartphones & Tablets Feature phones TVs & STBs Smartphones, tablets, smart TVs, STBs, smart watches Installed base of 2 billion smartphones and tablets at the end of 2013 Rapid growth of the installed base: 1.25 billion smartphones (+20% YoY) and 340 million tablets (+40% YoY) are expected to be sold worldwide in 2014 * Rapid growth in gaming on mobile devices * Source: IDC August


4 A fragmented industry DEVICES OS STORE Gameloft develops its games on 4500 smartphone & 350 feature phone models in 15 languages and on multiple operating systems (ios, Android, WP8, etc.) 4


5 Flood of 50$-100$ smartphones & tablets Green Farm on Yuan Dao Dual Core Android Tablet Danger Dash on Gionee Dual Core Android Smartphone Average smartphone retail price expected at 297$ in 2014 vs. 345$ in 2013* * Source: Consumer Electronic Association January
 Order &")


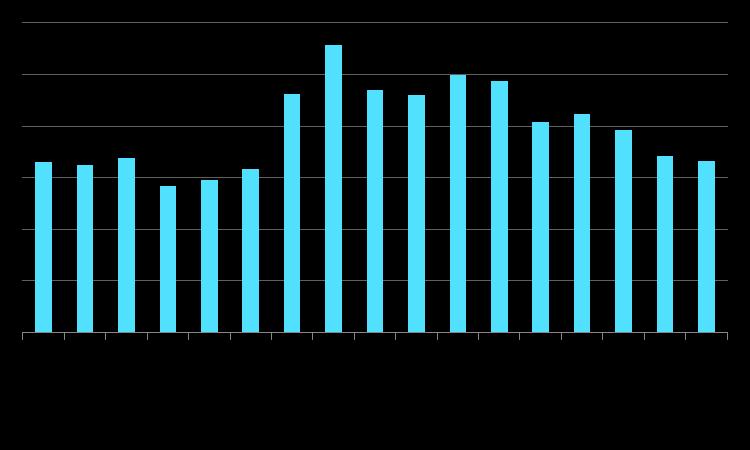
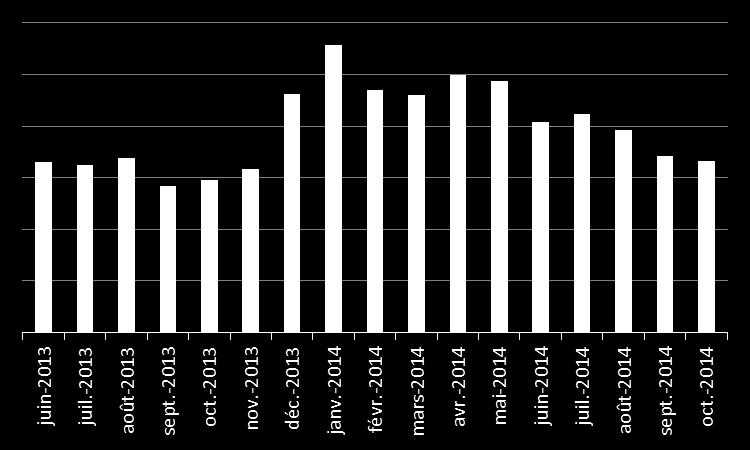
6 Game services (1/2) Order & Chaos online monthly sales since launch Uno & Friends monthly sales since launch Despicable me 2 monthly sales since launch World at Arms monthly sales since launch
 Asphalt")


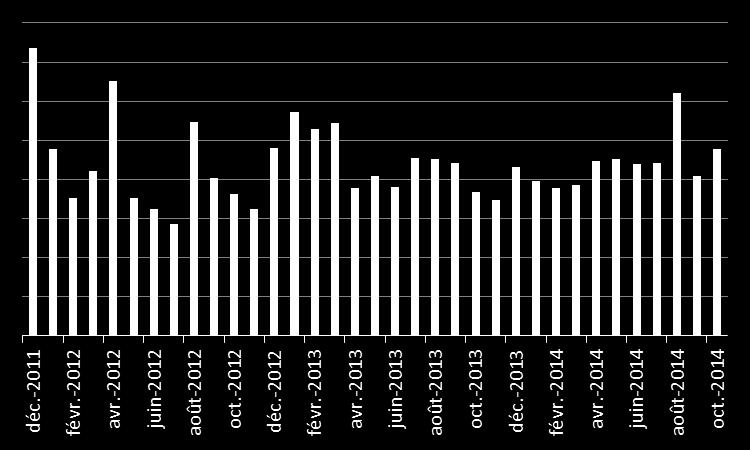
7 Game services (2/2) Asphalt 8 monthly sales since launch Six Guns monthly sales since launch Blitz Brigade monthly sales since launch Gangstar 4 monthly sales since launch 7
8 ABOUT GAMELOFT


9 Competitive advantages All Gameloft games are developed in-house. World class product development and deployment on smartphones, feature phones, tablets, smart TVs and set-top boxes. Quality comes first. Our 27 studios are spread all over the world in America, Europe and Asia, allowing Gameloft to benefit from cultural diversity and competitive development costs. Gameloft releases ~15 smartphone and tablet games every year thanks to its 5200 developers. Unique portfolio of in-house franchises and third party IPs. Unique worldwide network of sales, marketing and PR people. Partnerships with all major digital stores and social networks: App Store, Google Play, Amazon, Microsoft Market Place, etc. and direct agreements including billing agreements with over 200 carriers in more than 80 countries. 9


10 The #1 game catalogue Gameloft IPs Third party IPs 10


11 Established in-house franchises A HUGE SUCCESS ON ALL GAMING PLATFORMS OVER 183 MILLION DOWNLOADS OVER 7.5 MILLION VIEWS FOR ASPHALT VIDEOS A LICENSE PRAISED BY ALL MEDIA SINCE 2004 A HIGHLY FEATURED LICENSE ASPHALT FUN FACTS Asphalt players have made 950,000 drives around Earth $3.2 billion in speeding tickets would be given if Asphalt users took their driving to the streets 500 stadiums would be necessary to seat all the players of Asphalt 11


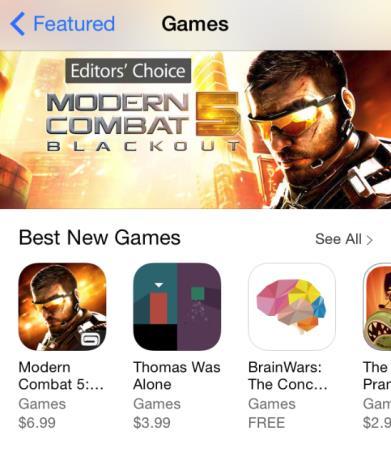
12 Top Quality Games Across All Genres 410 Million Downloads! It's a beautiful game, with popping colors and a lot of variety -Touch Arcade BAFTA Kid s Vote Award Nickelodeon Kid s Choice Award a brilliantly put together arcade racing package -Pocket Gamer #1 Top Paid #1 Top Free Asphalt 8: Airborne 5 stars from 4,306 reviews Despicable Me: Minion Rush 5 stars from 14,734 reviews 12


13 Massive audience: 1.3 billion installs 100m installs 94m installs 26m installs 410 m installs 104m installs 19m installs 11m installs 47m installs 33m installs 19m installs 21m installs real 19m installs 20m installs 33m installs 54m installs 34 m installs 13
14 The #1 partnership network OEM BRANDS APPSTORES Social Networks CARRIERS 14

15 A worldwide marketing network 15


16 Strong relationship with Apple, Google & others App Store 16
17 FINANCIALS
18 Rapid and steady organic growth Sales (m ) - CAGR = +37% 240,0 200,0 208,3 233,3 160,0 141,0 164,4 120,0 96,1 110,3 122,0 80,0 40,0 0,0 68,4 46,8 23,2 10,


19 9 months 2014 sales per region LATAM 18% EMEA 32% APAC 21% North America 29% 19
20 Key Financial Indicators EBIT (m ) Net Cash (m ) 30,0 25,0 20,0 15,0 10,0 5,0 1,2 2,4 2,3 2,5 2,9 3,3 10,4 17,1 22,0 20,4 28,4 70,0 60,0 50,0 40,0 30,0 20,0 10,0 2,5 2,5 8,8 18,7 13,9 10,7 19,7 25,1 36,9 55,6 60,3 0, , Net Profit (m ) Additional headcount 20,0 15,0 10,0 5,0 2,4 1,9 1,4 16,3 6,0 13,6 18,2 9,3 7, ,0-5,0-4,1-1, ,
21 Profit & Loss Account M H % of sales H % of sales Sales 111,3 100% 109,4 100% Cost of sales -19,7-18% -19,1-17% Gross margin 91,6 82% 90,3 83% R&D -56,1-50% -51,6-47% Sales & Marketing -20,2-18% -17,8-16% Administration -13,2-12% -9,2-8% Other expenses % -0,4 0% Current operating income 1,6 1% 11,2 10% Stock-based compensation -2,0-2% -1,7-2% Other operating revenues & expenses -0,2 0% % Operating income -0,6-1% 8,4 8% Net financial income 2,9 3% -2,7-2% Net income before tax 2,3 2% 5,7 5% Income tax -2,4-2% -3,9-4% Net income (group share) -0,1 0% 1,8 2% 21
22 Balance Sheet ASSETS (M ) 30/06/14 31/12/13 Intangible assets 8,3 8,1 Tangible assets 21,3 16,4 Non-current financial assets 6,1 6,7 Tax assets 14,0 11,2 Total non-current assets 49,7 42,5 Client receivables 58,3 62,8 Other receivables 23,8 20,6 Cash 59,0 61,8 Total current assets 141,1 145,2 TOTAL 190,7 187,7 LIABILITIES (M ) Capital 96,3 92,8 Reserves 43,2 36,0 Net profit -0,1 7,5 Shareholders equity 139,4 136,3 Non-current liabilities 6,7 4,3 Current liabilities 44,6 47,1 TOTAL 190,7 187,7 22
23 Cash Flow Statement M H H Net income -0,1 1,8 Depreciation & provisions 8,0 7,3 Stock based compensations 2,0 1,7 Deferred tax and others -2,0 0,2 Operating cash flow before working capital 7,9 11,0 Change in working capital 0,8 2,4 Operating cash flow 8,6 13,4 CAPEX -9,3-5,0 License acquisitions -3,9-3,2 Others -1,0-0,7 Free cash flow -5,6 4,5 New loan mid-term, long-term 1,4 0,0 Capital increase in relation to stock options 2,9 3,3 Share buy-back -0,5-3,7 Effects of exchange rate changes -0,0 1,0 Change in net cash -1,8 5,0 23
 Sector: Software Identification Codes ISIN:")
24 Shareholders Information Stock market Information SBF120 stock, listed on NYSE Euronext Paris Level 1 ADR traded OTC in the US Shares outstanding 85,769,399 (as of 31/10/2014) Sector: Software Identification Codes ISIN: FR Ordinary shares Mnemo: GFT ADR ticker: GLOFY Investor Contact Laure d Hauteville Deputy CFO Tel : + 33 (0) laure.dhauteville@gameloft.com 24


25 This statement may contain financial data evaluated, information on future projects and transactions and on future economic results/performance. Such valuations are provided for estimation purposes only. They are subject to market risks and uncertainties and may vary significantly with the actual results that shall be published. The financial data evaluated have been presented to the Board of Directors and have not been audited by the Auditors.
CORPORATE PRESENTATION 2014
 CORPORATE PRESENTATION 2014 ABOUT DIGITAL GAMING Digital gaming is everywhere Smartphones & Tablets Feature phones TVs & STBs Smartphones, tablets, smart TVs, STBs, smart watches Installed base of 2 billion
2016 Fourth Quarter Earnings. March 2017
 2016 Fourth Quarter Earnings March 2017 Disclaimer The information is provided for informational purposes only, and is not an offer to buy or sell or a solicitation of an offer to buy or sell any security
Revenues % % Gross operating margin % %
 Revenues 64.0 70.7 +10% 121.5 135.1 +11% Gross operating margin 34.0 34.8 +3% 63.5 69.5 +10% % of revenues 53.1% 49.3% 52.3% 51.5% Income from ordinary operations 7.8 8.7 +11% 16.1 16.7 +4% % of revenues
Forward Looking Statement
 Forward Looking Statement This presentation contains forward-looking statements which are statements that refer to expectations and plans for the future and include, without limitation, statements regarding
Consolidated Financial Results for the Second Quarter, Fiscal 2018
 Consolidated Financial Results for the Second Quarter, Fiscal 2018 Ⅰ. Consolidated Financial Results for the First Half, Fiscal 2018 Consolidated Financial Results for Fiscal 2018 Ⅱ. Supplementary Data
Company Presentation December 17, 2018
 Company Presentation December 17, 2018 MAKE LEARNING AWESOME Kahoot! is a game-based learning platform that makes it easy to create, share and play fun learning games or trivia quizzes in minutes Our vision
Sony Ericsson continues to invest for future growth
 PRESS RELEASE April 23, 2008 Sony Ericsson continues to invest for future growth Q1 Highlights: Year-on-year volume growth of 2% Income before taxes at higher end of forecast R&D investment continues to
Fingerprint Cards Q Results
 Fingerprint Cards Q4 2014 Results February 26, 2015 Q4 Summary Key numbers from Q4 2014 results Revenue Margins & profitability Market development Revenue of SEK 105 million, an increase of 59% q o q and
Lenovo Group Limited. 2007/08 Q1 Results. August 2, Lenovo
 Lenovo Group Limited 2007/08 Q1 Results August 2, 2007 2007 Lenovo Wong Wai Ming Senior Vice President & Chief Financial Officer 2007 Lenovo Lenovo Financial Summary Q1 2007/08 US$mn % Y/Y Q/Q Turnover
IDEX company presentation. January 2009
 IDEX company presentation January 2009 About IDEX ASA IDEX ASA is a public company traded on the Oslo OTC list. IDEX is headquartered near Oslo, Norway with its US office in Foster City, California. IDEX
Japan s Leading All-in Provider of Internet Services
 1 Japan s Leading All-in Provider of Internet Services Fiscal Year 2013 Third Quarter Results Presentation October 30, 2013 4 Overview Q3 FY2013 Earnings Results Revenue up JPY 15.9 billion, Profit up
Conference Call Second Quarter 2003 Financial Results. Jorma Ollila Chairman and CEO
 Conference Call Second Quarter 2003 Financial Results Jorma Ollila Chairman and CEO Olli-Pekka Kallasvuo Executive Vice President and CFO Ulla James Vice President, Investor Relations July 17, 2003 15.00
Revenue and earnings increase
 24 April 2018 Financial press release Síminn hf. Q1 2018 Revenue and earnings increase Síminn s revenue amounted to ISK 6,874 million in the first quarter (Q1) of 2018, compared to ISK 6,723 million in
kakao February 2018 Investor Relations
 kakao February 2018 Investor Relations Disclaimer Financial information contained in this document is based on consolidated K-IFRS that have not been reviewed by an independent auditor: therefore, the
2017 Q4 Earnings Conference Call
 2017 Q4 Earnings Conference Call Forward Looking Statements This presentation includes certain forward-looking statements that are made as of the date hereof and are based upon current expectations, which
kakao May 2018 Investor Relations
 kakao May 2018 Investor Relations Disclaimer Financial information contained in this document is based on consolidated K-IFRS that have not been reviewed by an independent auditor: therefore, the information
Himax Technologies (HIMX) Devin D Angelo
 Devin D Angelo") Himax Technologies (HIMX) Devin D Angelo Agenda Executive Summary Industry Thesis Company Thesis Valuation & Recommendation 2 Business Overview Revenue By Segment 2013 16% 54% 30% Large Panel Drivers Small
Himax Technologies (HIMX) Devin D Angelo Agenda Executive Summary Industry Thesis Company Thesis Valuation & Recommendation 2 Business Overview Revenue By Segment 2013 16% 54% 30% Large Panel Drivers Small
Investor Relations 2Q17 August 11, 2017
 Investor Relations 2Q17 August 11, 2017 Disclaimer All financial information contained in this IR material is based on consolidated K-IFRS that have not been reviewed by an independent auditor. NexStreaming
2Q05 Results. August 22, Allows Motorola to include Opera on all handsets across major operating systems important milestone for Opera Software
 2Q5 Results August 22, 25 Highlights Second Quarter 25 Amended contract with Motorola Allows Motorola to include Opera on all handsets across major operating systems important milestone for Opera Software
Q3 11 Earnings Release. October 27, 2011
 Q3 11 Earnings Release October 27, 2011 Results are preliminary and unaudited. Therefore, the figures in this material are subject to change during the independent auditing process. Please note that statements
F-Secure Corporation Interim report Q4 2012
 F-Secure Corporation Interim report Q4 2012 (Unaudited) President & CEO Christian Fredrikson February 1, 2013 Protecting the irreplaceable f-secure.com Contents 1. Highlights in Q4 and in 2012 2. Financial
NETWORK SOLUTIONS FOR THE INTERNET OF THINGS. First-Half 2017 Results
 NETWORK SOLUTIONS FOR THE INTERNET OF THINGS First-Half 2017 Results SPEAKERS WILLIAM GOUESBET - CO-FOUNDER EXECUTIVE OFFICER Chairman and Chief Executive Officer IT and Telecommunications Engineer (IFSIC
Doro Interim Report January March Jérôme Arnaud, President & CEO Magnus Eriksson, CFO May 3 rd 2016
 Doro Interim Report January March 2016 Jérôme Arnaud, President & CEO Magnus Eriksson, CFO May 3 rd 2016 Agenda Company overview - Our market position - Strategic objectives First quarter 2016 - Comments
Google Inc net consolidated revenues: 27.2 billion euro
 5.1. Google Presentation Google Inc. 2011 net consolidated revenues: 27.2 billion euro Advertising Google Websites 77% of net sales Fiscal year ended December 31, 2011 Advertising Network Members Websites
MD&A. Growing Subscribers with Slightly Decreasing ARPU CONTENTS
 MANAGEMENT DISCUSSION AND ANALYSIS F Y 2011 MD&A CONTENTS I EXECUTIVE SUMMARY 2011 was a significant year for dtac as we began our entire network upgrade and our 3G HSPA on 850 MHz launch which was our
F-Secure Corporation - Interim report Q2 2011
 F-Secure Corporation - Interim report Q2 2011 (Unaudited) July 27, 2011 Kimmo Alkio, President & CEO Protecting the irreplaceable f-secure.com Q2 highlights Operator channel performed strongly showing
TCL Communications (02618.HK/2618 HK)
") (218.HK/218 HK) May 9, 214 Institutional portal: http://research.kgi.com Electronics Hong Kong Outperform Resume coverage 1 Huei-chen Flannery 2 852.2878.427 3 hueichen.flannery@kgi.com 1 Richard Ko (Coordinator)
(218.HK/218 HK) May 9, 214 Institutional portal: http://research.kgi.com Electronics Hong Kong Outperform Resume coverage 1 Huei-chen Flannery 2 852.2878.427 3 hueichen.flannery@kgi.com 1 Richard Ko (Coordinator)
Consolidated Financial Highlights 17F Third Quarter February 2018
 Consolidated Financial Highlights 17F Third Quarter 6737 February 2018 Consolidated Income Statement (JPY Million) 16Q1-3 17Q1-3 YoY Amount (%) Amount (%) (%) Net Sales 57,837 100.0 61,479 100.0 106.3
Agenda Business Overview Operating Results Financial Results
 1 Agenda 2001 Business Overview 2001 Operating Results 2001 Financial Results 2 2001 Business Overview Satisfactory Operating Performance New Businesses Taking-off Increasingly Efficient Operations Promising
dtac FY January 2018 Investor Relations E: T:
 dtac FY2017 30 January 2018 Investor Relations E: ir@dtac.co.th T: +662 202 8882 FY17 highlights 22.7m total subscribers 97.7% of sub base registered under DTN 72.8% smartphone penetration 50.5% penetration
INVESTOR PRESENTATION
 INVESTOR PRESENTATION Jefferies Technology Conference May 2018 Safe Harbor 2 Safe Harbor Disclaimer This presentation may contain forward-looking information with respect to plans, projections, or future
2 nd Quarter 2015 Results. August 13, 2015 Investor Relations
 2 nd Quarter 2015 Results August 13, 2015 Investor Relations Disclaimer Financial information contained in this document is based on consolidated K-IFRS that have not been audited by an independent auditor:
Opera Software. First quarter The best Internet experience on any device
 Opera Software First quarter 2008 The best Internet experience on any device OPERA SOFTWARE ASA FIRST QUARTER 2008 Opera delivered revenues of MNOK 102.7 in 1Q08, up 57% versus 1Q07, and an EBIT of MNOK
Sony Ericsson sells over 100 million handsets in 2007
 PRESS RELEASE January 16, 2008 Sony Ericsson sells over 100 million handsets in 2007 Q4 Highlights: 2007 Highlights: 18% increase in volume year-on-year Continued market share gains and profitable growth
F-Secure Corporation Interim report 2Q July 29th, 2008 Kimmo Alkio, President and CEO
 F-Secure Corporation Interim report 2Q 2008 July 29th, 2008 Kimmo Alkio, President and CEO Q2 Highlights Solid revenue growth of 16% to 27.2m Good profitability of 4.7m, 17% of revenues Portfolio expansion:
1 st Quarter 2018 Results
 1 st Quarter 2018 Results May 10, 2018 Investor Relations Copyright Kakao Corp. Disclaimer Financial information contained in this document is based on consolidated K-IFRS that have not been reviewed by
Q Investor Presentation
 wireless living... Q3 2013 Investor Presentation Svenn-Tore Larsen, CEO Robert Giori, CFO October 17, 2013 1 Return to revenue growth in Q3 2013 2 Strong acceleration in Bluetooth Smart sales drives revenue
Solomon Systech (International) Limited 2010 Annual Results Announcement. 24 March 2011 Hong Kong
 Limited 2010 Annual Results Announcement. 24 March 2011 Hong Kong") Solomon Systech (International) Limited 2010 Annual Results Announcement 24 March 2011 Hong Kong Table of contents Summary Financial Review Business Review Outlook P. 2 Summary P. 3 Results summary Unit
Solomon Systech (International) Limited 2010 Annual Results Announcement 24 March 2011 Hong Kong Table of contents Summary Financial Review Business Review Outlook P. 2 Summary P. 3 Results summary Unit
Nokia Strategy and Financial Briefing. Timo Ihamuotila CFO February 11, 2011
 Nokia Strategy and Financial Briefing Timo Ihamuotila CFO February 11, 2011 Mobile Devices Industry and Nokia Assessment Expected Industry Trends: Revenue and Margins Approximate Revenue CAGR by Geographic
36.4% Business Overview CAGR ( ) 13,788 10,606 4, (E) 2016 (E) 2017(E)
 13,788 10,606 4, (E) 2016 (E) 2017(E)") CAGR ( 2013 2017) 36.4% 18,000 16,000 16,545 14,000 12,000 13,788 10,000 10,606 8,000 8,329 6,000 4,000 4,786 2,000-2013 2014 2015(E) 2016 (E) 2017(E) Source: Korea Onlinead Association, emarketer, FSN
CAGR ( 2013 2017) 36.4% 18,000 16,000 16,545 14,000 12,000 13,788 10,000 10,606 8,000 8,329 6,000 4,000 4,786 2,000-2013 2014 2015(E) 2016 (E) 2017(E) Source: Korea Onlinead Association, emarketer, FSN
Tech Data s Acquisition of Avnet Technology Solutions
 Tech Data s Acquisition of Avnet Technology Solutions Creating a Premier Global IT Distributor: From the Data Center to the Living Room September 19, 2016 techdata.com 1 Forward-Looking Statements Safe
TOD S S.p.A. - Another quarter of growth: further increase in sales (Tod s: +13.4%) and operating profit
 and operating profit") Milan May 10 th, 2012 TOD S S.p.A. - Another quarter of growth: further increase in sales (Tod s: +13.4%) and operating profit The Board of Directors approved Tod s Group Q1 2012 Interim Report Group s
Milan May 10 th, 2012 TOD S S.p.A. - Another quarter of growth: further increase in sales (Tod s: +13.4%) and operating profit The Board of Directors approved Tod s Group Q1 2012 Interim Report Group s
Ericsson First quarter 2018
 Ericsson First quarter 2018 April 20, 2018 Ericsson Internal 2018-02-21 Peter Nyquist Vice President Investor Relations Ericsson Internal 2018-02-21 First quarter 2018 April 20, 2018 This presentation
MANAGEMENT DISCUSSION AND ANALYSIS SECOND QUARTER 2013 MD&A
 MD&A Q213 Highlights In Q213, total revenues developed healthily at 13.5% YoY and 2.7% QoQ on the back of strong service revenues and handset sales. Service revenues, rising 10.7% YoY and 1.2% QoQ, was
Columbus delivers 52% growth in revenue
 Release no. 20, 2018 Interim Management Statement for Q3 YTD 2018 November 7th, 2018 Release no. 20/2018 Interim Management Statement Q3 YTD 2018 Columbus delivers 52% growth in revenue In the first three
O2 Czech Republic, a. s. 21 st November Quarterly Results January September 2018
 O2 Czech Republic, a. s. 21 st November 2018 Quarterly Results January September 2018 Cautionary statement Any forward-looking statements concerning future economic and financial performance of O2 Czech
Consolidated Financial Results for the First Quarter Fiscal 2015
 Consolidated Financial Results for the First Quarter Fiscal 2015 Ⅰ. Financial Results for Fiscal 2015 Financial Results for Fiscal 2015 Ⅱ. Information by Product Group Ⅲ. Supplementary Data SHARP CORPORATION
PRESS RELEASE October 17, 2008
 PRESS RELEASE October 17, 2008 Sony Ericsson reports third quarter results Q3 highlights: Break even results, excluding restructuring charges, as challenging business conditions continued C902 Cyber-shot
MANAGEMENT DISCUSSION AND ANALYSIS THIRD QUARTER 2013 MD&A. Total active subscribers (in thousand) Q212 Q312 Q412 Q113 Q213 Q313
 Q212 Q312 Q412 Q113 Q213 Q313") MD&A Q313 Highlights On 23 July 2013, we successfully launched the new 3G 2.1GHz network, together with our existing 2G and 3G 850MHz networks, enabling us to serve our customers with better customer experience
MD&A Q313 Highlights On 23 July 2013, we successfully launched the new 3G 2.1GHz network, together with our existing 2G and 3G 850MHz networks, enabling us to serve our customers with better customer experience
Opera - Simply The Best Internet Experience. 4Q05 Results. February 20, 2006
 4Q05 Results February 20, 2006 Profit and loss account 4Q05 PROFIT AND LOSS ACCOUNT (Figures in TNOK) Fourth Quarter 2004 2005 Revenues, PC/Desktop 9 757 6 396 Revenues, Internet Devices 20 078 41 669
MANAGEMENT DISCUSSION AND ANALYSIS FY 2012 MD&A
 MD&A Executive Summary Solid Results with Strong Net Additional Subscribers dtac 2012 results were strong both financially and operationally. Our total revenues grew healthily to THB 89.5 billion, increasing
2010 Annual Results 18 March 2011
 2010 Annual Results 18 March 2011 This presentation and information included herein constitute a communication of a promotional nature and not a prospectus in the sense of the Directive 2003/71/CE of the
Q1 Report,
 Q1 Report, 2015 jim.carlsson@clavister.com peter.dahlander@clavister.com anders.gottnersson@clavister.com The World of Internet IP World need to be secured Global risks were defined at the Economic Development
Bango Preliminary results
 Bango Preliminary results for 12 months to 31 st March 2011 June 2011 www.bangoinvestor.com - Highlights - Business Progress - Financials - Outlook - Supplementary June 9 th 2009 1 About Bango Bango customers
3Q Investor Presentation
 3Q 2017 Investor Presentation 1 SAFE HARBOR STATEMENT This presentation contains statements of a forward-looking nature. These statements are made under the safe harbor provisions of the U.S. Private Securities
Opera - Simply The Best Internet Experience. 1Q05 Results. April 29, 2005
 1Q05 Results April 29, 2005 Highlights first quarter 2005 New license agreement with Nokia signed New handsets announced: NTT DoCoMo M1000 Motorola A1010 ZTE e3 Home Media announcements: Archos Media Player
Results 4Q 2014 / 6 February 2015
 Results 4Q 2014 / 6 February 2015 1 Ending FY2014 with positive operational momentum STRONG CUSTOMER TRACTION +559k RGS* QoQ Strong product portfolio; #Hotlink and MaxisONEPlan Worry free propositions
T-Mobile US Q4 and Full Year 2013
 T-Mobile US Q4 and Full Year 2013 Disclaimer This presentation contains forward-looking statements within the meaning of the U.S. federal securities laws. For those statements, we claim the protection
O2 Czech Republic. Quarterly Results January March th April 2016
 O2 Czech Republic Quarterly Results January March 2016 26 th April 2016 Performance Highlights Unlimited tariff also in fixed voice investing into new growth areas & IT transformation Unlimited fixed voice
O2 Czech Republic, a. s. 27 th July Quarterly Results January June 2018
 O2 Czech Republic, a. s. 27 th July 2018 Quarterly Results January June 2018 Cautionary statement Any forward-looking statements concerning future economic and financial performance of O2 Czech Republic
Half Year Results February 2017
 Half Year Results. 2017. 27 February 2017 CEO Presentation. 3 Our Brands. For business, we are the full service provider of data, voice, mobile and colocation services. We are the telecom that does everything
O2 Czech Republic again increased its profit and intends to distribute it to its shareholders
 Interim report O2 Czech Republic again increased its profit and intends to distribute it to its shareholders 19 October 2015 In first nine months, O2 recorded history high loyalty of its customers, stabilization
MD&A. Operational Summary MANAGEMENT DISCUSSION AND ANALYSIS FIRST QUARTER 2016
 MD&A Executive Summary The competition level in Q116 heightened after the auctions in Q415 with expiration of 900 MHz concession and changes in spectrum holdings among operators. Handset subsidies on prepaid
Taiwan Mobile Co., Ltd.
 Taiwan Mobile Co., Ltd. 4Q12 Results Summary January 31, 2013 1 Disclaimer The information contained in this presentation, including all forwardlooking information, is subject to change without notice,
Financial Review Rick Simonson Chief Financial Officer
 Financial Review Rick Simonson Chief Financial Officer 1 2006 Nokia Growth - more to come 2 2006 Nokia Year on year growth rates for 2005 and 2006 (1 st 9 months of year) 40% 30% 20% 2005* 2006* 23% 20%
Samu Konttinen, CEO Q4 / 2017 CORPORATE SECURITY REVENUE GROWTH ACCELERATED TO 16%
 Samu Konttinen, CEO Q4 / 2017 CORPORATE SECURITY REVENUE GROWTH ACCELERATED TO 16% 1 AGENDA Key takeaways from Q4 Key figures Business review for 2017 Outlook 2018 Outlook for 2018-2021 Financials FAQ
1Q17 RESULTS M AY / 2017
 RESULTS M AY / 2017 Positivo Tecnologia recorded a net revenue of R$453.5 million in, an increase of 20.7% Continuous progress in the diversification of the business, with mobile phones reaching 32.6%
PRESS RELEASE January 16, 2009 Sony Ericsson reports results for fourth quarter and full year 2008
 PRESS RELEASE January 16, 2009 Sony Ericsson reports results for fourth quarter and full year 2008 Highlights: Global economic slowdown leads to contracting consumer demand Previously announced annual
Conference call February 2, :00 / Helsinki 08:00 / New York 1 Nokia Q4 and FY 2016
 Conference call February 2, 2017 15:00 / Helsinki 08:00 / New York 1 Nokia 2016 Q4 and FY 2016 Disclaimer It should be noted that Nokia and its business are exposed to various risks and uncertainties,
Interim Report on the First Half of /01/ 2017
 Interim Report on the First Half of 2017 01/01/ 2017 30/06/ 06/30/ 2 ITELLIGENCE KEY FIGURES MEUR Jan 1 June 30, 2017 Jan 1 June 30, 2016 Apr 1 June 30, 2017 Apr 1 June 30, 2016 Total revenues 416.2 357.7
18 August Hong Kong. SSIL 2015 Interim Results Announcement 18 Aug 2015 P. 1
 18 August 2015 18 Hong August Kong 2014 Hong Kong P. 1 Disclaimer This presentation does not constitute an offer or solicitation to anyone in any jurisdiction in which such offer or solicitation is not
Conference call April 26, :00 / Helsinki 08:00 / New York 1 Nokia 2016 Q1 2018
 Conference call April 26, 2018 15:00 / Helsinki 08:00 / New York 1 Nokia 2016 Q1 2018 Disclaimer It should be noted that Nokia and its business are exposed to various risks and uncertainties, and certain
Conference call July 26, :00 / Helsinki 08:00 / New York 1 Nokia 2016 Q2 2018
 Conference call July 26, 2018 15:00 / Helsinki 08:00 / New York 1 Nokia 2016 Q2 2018 Disclaimer It should be noted that Nokia and its business are exposed to various risks and uncertainties, and certain
Mobile World Congress Claudine Mangano Director, Global Communications Intel Corporation
 Mobile World Congress 2015 Claudine Mangano Director, Global Communications Intel Corporation Mobile World Congress 2015 Brian Krzanich Chief Executive Officer Intel Corporation 4.9B 2X CONNECTED CONNECTED
Earnings Results for the Three-month Period Ended June 30, 2012
 Earnings Results for the Three-month Period Ended June 30, 2012 July 31, 2012 SOFTBANK CORP. Disclaimer This material was prepared based on information available and views held at the time it was made.
February 2, Q presentation. Claus Hougesen, CEO
 February 2, 2012 Q4 2011 presentation Claus Hougesen, CEO Group Q4 2011 highlights Revenue of MNOK 6,519.2, up 12.0% in constant currency Organic growth of 5.1% in constant currency EBITDA of MNOK 374.9,
Corporate Presentation
 Stock Code: 2342.HK Corporate Presentation Interim Results 2008 Agenda Overview Financial Highlights Financial Review Customer Review Business Review Market Outlook Open Forum 2 Overview Revenue from international
O2 reports successful first half. Helped by family packages as well as TV rights for best sport matches
 Press release O2 reports successful first half. Helped by family packages as well as TV rights for best sport matches 27 July 2018 In the first half O2 Czech Republic announced an acquisition of the rights
O2 Czech Republic. Quarterly Results January June st August 2014
 O2 Czech Republic Quarterly Results January June 2014 1 st August 2014 CAUTIONARY STATEMENT Any forward-looking statements concerning future economic and financial performance of O2 Czech Republic a.s.
QUALCOMM Reports First Quarter Results Revenues $941 Million, $.65 EPS
 Contact: Julie Cunningham Vice President, Investor Relations Ph 619-658-4224 Fax 619-651-9303 E-mail: juliec@qualcomm.com QUALCOMM Reports First Quarter Results Revenues $941 Million, $.65 EPS SAN DIEGO
Sony Ericsson reports second quarter 2010 results
 PRESS RELEASE July 16, 2010 Sony Ericsson reports second quarter 2010 results Q2 Highlights: Income before taxes excl. restructuring charges increases to Euro 63 million Positive cash flow generated from
Capital Markets Day Rick Simonson Chief Financial Officer
 Capital Markets Day 2007 Rick Simonson Chief Financial Officer 1 2007 Nokia Capital Markets Day 2007 Revenue growth and strong margins 2 2007 Nokia Capital Markets Day 2007 EPS growth outpacing sales and
CFO Commentary on Second Quarter 2016 Financial Results
 CFO Commentary on Second Quarter 2016 Financial Results August 2, 2016 Related Information The commentary in this document can be referenced in the financial information found in the earnings release issued
Ericsson Second quarter 2018
 Ericsson Second quarter 2018 July 18, 2018 Telefonaktiebolaget LM Ericsson 2018 Second quarter report 2018 July 18, 2018 Page 1 Peter Nyquist Vice President Investor Relations Telefonaktiebolaget LM Ericsson
O2 compensated pressure on traditional services profitability and European roaming regulation impact by proposition of new services
 Press release O2 compensated pressure on traditional services profitability and European roaming regulation impact by proposition of new services 30 January 2018 The number of new customers of O2 Home
Acer Inc. Q1, 2009 Investor Conference April 29, 2009
 Acer Inc. Q1, 2009 Investor Conference April 29, 2009 www.acer.com Legal Disclaimer The information is provided for informational purposes only, and is not an offer to buy or sell or a solicitation of
Opera - Simply The Best Internet Experience. 3Q04 Results. November 12, 2004
 3Q4 Results November 12, 24 Status per third quarter 24 Accumulated ordinary income for the year was MNOK 69.5, up from MNOK 49.7. The turnover increased by 4% on a year-to-year basis Accumulated revenue
QUALCOMM Reports Third Fiscal Quarter Revenues of $1 Billion - Operating Earnings Per Share of $.75, Excluding Non-Recurring Charges -
 FOR IMMEDIATE RELEASE QUALCOMM Contact: Julie Cunningham Vice President, Investor Relations 1-(858) 658-4224 (ph) 1-(858) 651-9303 (fax) e-mail: juliec@qualcomm.com QUALCOMM Reports Third Fiscal Quarter
Consolidated Financial Highlights 18F First Quarter
 Consolidated Financial Highlights 18F First Quarter 6737 July 31st, 2018 Consolidated Income Statement 17Q1 18Q1 (JPY Million) Amount (%) Amount (%) (%) Net Sales 19,376 100.0 16,540 100.0 85.4 Cost of
Highlights 2014 Year of Ramp-Up
 Highlights 2014 Year of Ramp-Up Sales.. Organisational.. Financial.. Sales August NEXT Biometrics Sensors certified by Microsoft Sales August Signing of Distributor Agreement in Brazil DuoDigit Organisation
Fiscal Year 2014 Second Quarter Results Presentation
 Fiscal Year 2014 Second Quarter Results Presentation August 1, 2014 1. Overview 2. Q2 Financial Results 3. Segment Report i. Group Overview ii. Internet Infrastructure iii. Online Advertising & Media iv.
Keep Growing Interim Results Presentation. 25 July 2018
 Keep Growing 2018 Interim Results Presentation 25 July 2018 Disclaimer Potential investors and shareholders (the Potential Investors and Shareholders ) of Hutchison Telecommunications Hong Kong Holdings
GN Store Nord. DDF Company Forum 2006, May 30, CFO Jens Due Olsen
 GN Store Nord DDF Company Forum 2, May 3, 2 CFO Jens Due Olsen One company three businesses 2 Following up on The GN Agenda 2-28 Balance profit with organic growth in Hearing Instruments Revenue growth
A complete travel commerce experience EXPEDIA, INC.
 A complete travel commerce experience Forward-Looking Statements This presentation contains forward-looking statements within the meaning of the Private Securities Litigation Reform Act of 1995, including
O2 Czech Republic, a. s. 30 th January Quarterly Results January December 2017
 O2 Czech Republic, a. s. 30 th January 2018 Quarterly Results January December 2017 Cautionary statement Any forward-looking statements concerning future economic and financial performance of O2 Czech
Company Snapshot. $ million $2.46 billion 39% 52% $418.5 million
 Safe Harbor This presentation contains statements of a forward-looking nature. These statements are made under the safe harbor provisions of the U.S. Private Securities Litigation Reform Act of 1995. You
Second Quarter Results Presentation, Fiscal Year 2010
 Second Quarter Results Presentation, Fiscal Year 2010 August 5, 2010 GMO Internet, Inc. (TSE First Section: 9449) Internet for Everyone http://www.gmo.jp/en 1 About the Use of this Document This document
MD&A. Executive Summary. Operational Summary MANAGEMENT DISCUSSION AND ANALYSIS SECOND QUARTER 2016
 MD&A Executive Summary In Q216, postpaid segment continued to do well amid intense competition, adding another 191k subs during the quarter on the back of improving network, popular digital services, and
4 th Quarter and FY2014 Results Investor Relations
 4 th Quarter and FY2014 Results 2015. 2. 12 Investor Relations Disclaimer Financial information contained in this document is based on consolidated K-IFRS that have not been audited by an independent auditor:
Conference call August 4, :00 / Helsinki 08:00 / New York 1 Nokia 2016 Q2 2016
 Conference call August 4, 2016 15:00 / Helsinki 08:00 / New York 1 Nokia 2016 Q2 2016 Disclaimer It should be noted that Nokia and its business are exposed to various risks and uncertainties, and certain