Rapid Application Prototyping Environment. Currently 920+ Standard modules in the MeVisLab SDK core, modules delivered in total
|
|
|
- Lawrence Damon Davidson
- 5 years ago
- Views:
Transcription
1 1 MeVisLab

2 MIP Prototyping 2

3 MeVisLab In more than 20 years of development, MeVisLab has become one of the most powerful development platforms for medical image computing research. image processing, visualization and interaction modules can be combined to complex image processing networks using a graphical programming approach can easily be integrated using a modular, platform independent C++ class library. JavaScript or Python components can be added to implement dynamic functionality on both the network and the user interface level. based on the Qt application framework and the OpenInventor 3D visualization toolkit ITK and VTK AddOns 3
4 Rapid Application Prototyping Environment Cross-platform (Windows, Mac OS X, Linux) Free for non-commercial usage Supported file formats DICOM, TIFF, DICOM/TIFF, RAW, LUMISYS, PNM, Analyze, PNG, JPEG Currently 920+ Standard modules in the MeVisLab SDK core, modules delivered in total with 360+ ITK modules, VTK modules, and 300+ modules in the Fraunhofer MEVIS release 4
5 MeVisLab development Three levels Visual level Programming with plug and play Individual image processing, visualization and interaction modules can be combined to complex image processing networks using a graphical programming approach. Scripting level Creating macro modules and applications based on macro modules Python scripting components can be added to implement dynamic functionality on both the network and the user interface level. C++ level Programming modules New algorithms can easily be integrated using the modular, platformindependent C++ class library. 5
6 Image Processing Filters Diffusion filters, morphology filters, kernel filters, Hessian, and vesselness filters Segmentation Region growing, live wire, fuzzy connectedness, threshold, manual contours Transformations Affine transformations, distance transformations, projection and Radon transforms, manual registration Statistics Other Histograms, global image statistics, box counting dimension Unary/binary arithmetic, resampling/reformatting, dynamic data analysis, noise/test pattern generators 6
7 Modules for Visualization MeVisLab provides modules for visualizing image data and other data objects in 2D and 3D. A set of lookup table (LUT) modules allows applying basic window/level adjustment or flexible color encoding schemes. The visualization functionality in MeVisLab is based on the well-established visualization and interaction library Open Inventor. 7

8 High-quality Volume Renderer: MeVisLab Giga Voxel Renderer MeVisLab features a high-quality volume renderer that is based on OpenGL and its extensions. It supports the rendering of large volume datasets, even if they do not fit into the main memory. An optimized, multi-resolution technique based on an octree representation and 3D textures adaptively selects the best resolution depending on camera position, volume of interest, and available resources. 8

9 MeVisLab Software Development Kit (SDK) Using the MeVisLab Software Development Kit (SDK), a developer is able to implement and test own algorithms, visualization or interaction methods, or even complete processing workflows. The MeVisLab SDK offers a variety of features that support module programming, scripting, and network development. 9

10 Open Inventor An object-oriented 3D toolkit developed by Silicon Graphics (SGI) offering a comprehensive solution to interactive graphics programming problems Most of the visualization modules of MeVisLab make use of Open Inventor. 10

11 Open Inventor (OIV) Direct Open Inventor node support Open Inventor: Scene graph paradigm Object, rendering, transformation, property, nodes Based on OpenGL Extensions to support 2D image viewing/manipulation Mixed ML/Open Inventor Modules 11

12 Open Inventor Scene Graph Scene objects are represented by nodes Size and position is defined by transformation nodes A rendering node represents the root of the scene graph 12
13 Integration of Visualization, Segmentation and Registration Toolkits The Insight Segmentation and Registration Toolkit (ITK) is an extensive collection of leading-edge algorithms for registration, segmentation, and analysis of multidimensional data. It is an open-source, cross-platform software package written in C++ and supported by the US National Library of Medicine. The Visualization ToolKit (VTK) is an open source, freely available software library for 3D computer graphics, image processing, and visualization. It has become one of the most popular open source toolkits for visualization purposes and is used by thousands of researchers and developers around the world. 13

14 MeVisLab User Interface 14

15 MeVisLab Modules 15

16 Image Processing Pipeline 16

17 Connectors Connections 17

18 Network Layout 18

19 Network Quick Search 19


20 Using Groups 20

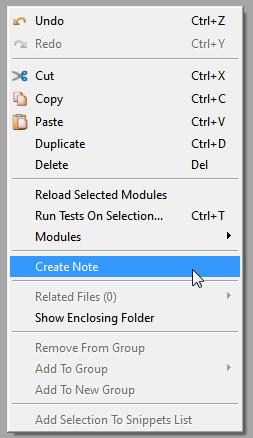
21 Using Notes 21
22 Scripting (MDL) User interfaces are created with the Module Definition Language (MDL) Abstract hierarchical GUI language Interpreted at run-time, allows rapid prototyping 22

23 Getting Started: Chapter 11. GUI Design in MeVisLab 23

24 Application Prototyping Hide network complexity Design user interfaces Scripting for dynamic components 24


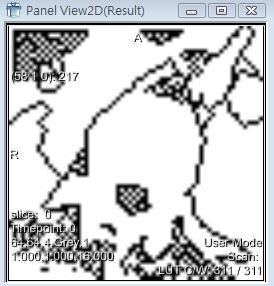
25 View2D Module 25


26 View3D Module 26

27 Implementing the Contour Filter 27

28 28


29 Creating a New Group 29


30 Parameter Connection for Synchronization 30
, that is by selecting a region of")
31 Getting Started: Chapter 5. Defining a Region of Interest a network that allows defining a 2D region of interest (ROI), that is by selecting a region of the image in the first viewer, the selected region is displayed as a subimage in a second viewer 31
 shall")
32 Getting Started: Chapter 7. Creating an Open Inventor Scene a dynamically definable applicator (needle for minimally invasive surgeries) shall be placed at a position and an angle relative to the rendering of an anatomical image 32

33 2D Viewers Modular 2D Viewer Library (SoView2D) Hardware accelerated using textures and shaders Supports interactive LUT even on large images Extension mechanism supports: Overlays Markers ROIs Contours User extensions can add drawing and event handling 33
34 Winged Edge Mesh Library (WEM) Data structure proposed by Baumgart, 1975 Mesh consists of Nodes, Edges and Faces Dense pointer structure of incident primitives Fast access to neighboring structures Pointer links in a neighborhood 34
35 WEM Modules Overview Generation: WEMIsoSurface Processing: WEMCollapseEdges WEMSmooth WEMPurge WEMClip Rendering: SoWEMRenderer Different Render Modes Optional Coloring by LUT Values 35


36 WEM Sceneshots Network with iso surface generation and polygon reduction A liver surface colored by a LUT in bone context 36

37 Winged Edge Mesh IsoSurface Four subnetworks, each showing different features of the WEMIsoSurface 37
38 Contour Segmentation Objects (CSO) CSO library provides data structures and modules for interactive or automatic generation of contours in voxel images Contours can be analyzed, maintained, grouped and converted back into a voxel image CSO consists of a number of seed points and a number of path point lists 38
39 CSO Modules Overview Generation (without interaction): CSOIsoGenerator Processing (with interaction): CSOFreehandProcessor, CSOLiveWireProcessor, CSOIsoProcessor, CSOBulgeProcessor, Rendering SoView2DCSOEditor, SoCSO3DVis Misc CSOConvertToImage, CSOConvertTo3DMask, CSOFilter, CSOManager, CSOLoad / CSOSave, 39


40 SoView2DCSOEditor Example Network 40


41 SoView2DCSOExtensibleEditor Example Network 41


42 SoCSO3DVis Example Network 42


43 3D 43


44 44
45 DICOM Support Import of 2D/3D/4D DICOM datasets MeVisLab DICOM Service runs as Windows Service or UNIX Daemon and receives data from PACS even when user is logged out Export of DICOM slices to disk DICOM-Store allows to send data to PACS 45
46 Fuzzy FuzzyCluster an implementation of the fuzzy c-means algorithm that classifies an image into different clusters depending on the gray values FuzzyConnectDistance a segmentation algorithm based on Fuzzy Connectedness extended by the possibility to use a property based on the distance of image elements to the center of the object to be segmented while calculating membership values FuzzyObjectLabeling 46


47 FCM 47


48 48
 Open Source Library for Medical Image Processing and Registration about 200 Modules for Standard Image Processing such as Image Arithmetics Kernel-based and Diffusion Filtering Levelset")
49 ITK Wrapper ITK Insight Toolkit ( Open Source Library for Medical Image Processing and Registration about 200 Modules for Standard Image Processing such as Image Arithmetics Kernel-based and Diffusion Filtering Levelset and Segmentation Filtering Warping, Resampling Filters about 90 Modules Registration-Related Algorithms Interpolators Metrics Optimizers Transformations 49

50 ITK Book Examples 50


51 ITK Watershed 51

52 Example Network of itkwatershedimagefilter 52


53 53

54 VTK Wrapper VTK Visualization Toolkit ( Visualization, Image Processing and Filtering Library for images, meshes, grids, data sets etc. about 1000 Modules for 2D/3D Image Processing Grid, Mesh, Surface, and Data Filtering Pickers Properties and Actors Mappers Renderers, Widgets, Viewers Sources, Readers and Writers Transformations 54

55 VTK Example 1: Contour Filter 55


56 VTK Example 2: VTK/OIV mix SoVTK module allows VTK rendering as part of an Open Inventor scene graph 56

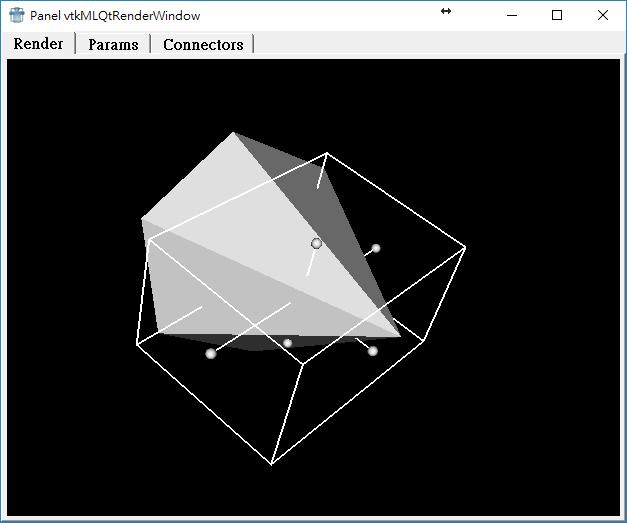
57 vtkboxwidget2 Example Network 57


58 ITK Image Registration 58

59 Skeletonization Skeletonization of a binary image by successive erosion of border voxels vessel centerline extraction in 2d and 3d 59


60 60
Visual Programming. for Prototyping of Medical Imaging Applications. Felix Ritter, MeVis Research Bremen, Germany
 Visual Programming for Prototyping of Medical Imaging Applications Felix Ritter, MeVis Research Bremen, Germany Outline Prototyping Visual Programming with MeVisLab Image Processing / Visualization Examples
METK The Medical Exploration Toolkit
 METK The Medical Exploration Toolkit Christian Tietjen 1, Konrad Mühler 1, Felix Ritter 2, Olaf Konrad 2, Milo Hindennach 2, Bernhard Preim 1 1 Institut für Simulation und Graphik, Otto-von-Guericke-Universität
Programming for Image Analysis/Processing
 Computer assisted Image Analysis VT04 Programming for Image Analysis/Processing Tools and guidelines to write your own IP/IA applications Why this lecture? Introduction To give an overview of What is needed
3D Slicer Overview. Andras Lasso, PhD PerkLab, Queen s University
 3D Slicer Overview Andras Lasso, PhD PerkLab, Queen s University Right tool for the job Technological prototype Research tool Clinical tool Can it be done? Jalopnik.com Innovative, not robust, usually
Saturn User Manual. Rubén Cárdenes. 29th January 2010 Image Processing Laboratory, University of Valladolid. Abstract
 Saturn User Manual Rubén Cárdenes 29th January 2010 Image Processing Laboratory, University of Valladolid Abstract Saturn is a software package for DTI processing and visualization, provided with a graphic
Introduction to Python and VTK
 Introduction to Python and VTK Scientific Visualization, HT 2013 Lecture 2 Johan Nysjö Centre for Image analysis Swedish University of Agricultural Sciences Uppsala University 2 About me PhD student in
Dragonfly Pro. Visual Pathway to Quantitative Answers ORS. Exclusive to ZEISS OBJECT RESEARCH SYSTEMS
 Dragonfly Pro Exclusive to ZEISS Visual Pathway to Quantitative Answers ORS OBJECT RESEARCH SYSTEMS Visualization and analysis software without bounds Dragonfly Pro by Object Research Systems (ORS) is
Arbitrary cut planes Slab control with slab thickness Projection plane adjustment Box cropping Mandible detection MPR cross-section linked views
 Provides unparalleled quality and performance no need to sacrifice one for the other Enables high fidelity viewing with interactive deep supersampling Requires no GPUs or hardware accelerators a true,
amira 5 Visualize Analyze Present
 amira 5 Visualize Analyze Present Visioneering Your Ideas Engineering Your Vision Your research is inspired by knowledge, intuition, and a powerful vision. Yet you are facing many challenges when moving
Visualization Toolkit (VTK) An Introduction
 An Introduction") Visualization Toolkit (VTK) An Introduction An open source, freely available software system for 3D computer graphics, image processing, and visualization Implemented as a C++ class library, with interpreted
Visualization Toolkit (VTK) An Introduction An open source, freely available software system for 3D computer graphics, image processing, and visualization Implemented as a C++ class library, with interpreted
CIS 4930/ SCIENTIFICVISUALIZATION
 CIS 4930/6930-902 SCIENTIFICVISUALIZATION ISOSURFACING Paul Rosen Assistant Professor University of South Florida slides credits Tricoche and Meyer ADMINISTRATIVE Read (or watch video): Kieffer et al,
Avizo D Analysis Software for Scientific and Industrial Data
 RELEASE NOTES - AVIZO 9.1.1, MAY 2016 Avizo 9.1.1 3D Analysis Software for Scientific and Industrial Data Dear Avizo User, With this document we would like to inform you about the most important new features,
Amira D Data Visualization and Analysis Software for Life Sciences
 RELEASE NOTES - AMIRA 6.0.1, JULY 2015 Amira 6.0.1 3D Data Visualization and Analysis Software for Life Sciences Dear Amira User, With this document we would like to inform you about the most important
Open Source Tools for Large Scale Visualization and Image Analysis
 Open Source Tools for Large Scale Visualization and Image Analysis OME Users Meeting Paris 2011 Julien Jomier, Kitware julien.jomier@kitware.com Kitware Founded in 1998 Support VTK (Visualization Toolkit)
Using VTK and the OpenGL Graphics Libraries on HPCx
 Using VTK and the OpenGL Graphics Libraries on HPCx Jeremy Nowell EPCC The University of Edinburgh Edinburgh EH9 3JZ Scotland, UK April 29, 2005 Abstract Some of the graphics libraries and visualisation
Modeling and preoperative planning for kidney surgery
 Modeling and preoperative planning for kidney surgery Refael Vivanti Computer Aided Surgery and Medical Image Processing Lab Hebrew University of Jerusalem, Israel Advisor: Prof. Leo Joskowicz Clinical
June 05, 2018, Version 3.0.6
 June 05, 2018, Version 3.0.6 VolViCon is an advanced application for reconstruction of computed tomography (CT), magnetic resonance (MR), ultrasound, and x-rays images. It gives features for exporting
Integrating with Slicer3. National Alliance for Medical Image Computing
 Integrating with Slicer3 NA-MIC Kit Goals Software and Methodologies for Medical Image Computing Facilitate Research Promote Interoperability Stable, Cross-Platform Run Time Environment Full Set of Core
IDL DISCOVER WHAT S IN YOUR DATA
 IDL DISCOVER WHAT S IN YOUR DATA IDL Discover What s In Your Data. A key foundation of scientific discovery is complex numerical data. If making discoveries is a fundamental part of your work, you need
Copyright 2017 Medical IP - Tutorial Medip v /2018, Revision
 Copyright 2017 Medical IP - Tutorial Medip v.1.0.0.9 01/2018, Revision 1.0.0.2 List of Contents 1. Introduction......................................................... 2 2. Overview..............................................................
SCIENTIFIC VISUALIZATION ON GPU CLUSTERS PETER MESSMER, NVIDIA
 SCIENTIFIC VISUALIZATION ON GPU CLUSTERS PETER MESSMER, NVIDIA Visualization Rendering Visualization Isosurfaces, Isovolumes Field Operators (Gradient, Curl,.. ) Coordinate transformations Feature extraction
RT_Image v0.2β User s Guide
 RT_Image v0.2β User s Guide RT_Image is a three-dimensional image display and analysis suite developed in IDL (ITT, Boulder, CO). It offers a range of flexible tools for the visualization and quantitation
PRISM Project for Integrated Earth System Modelling An Infrastructure Project for Climate Research in Europe funded by the European Commission
 PRISM Project for Integrated Earth System Modelling An Infrastructure Project for Climate Research in Europe funded by the European Commission under Contract EVR1-CT2001-40012 The VTK_Mapper Application
3D Slicer. NA-MIC National Alliance for Medical Image Computing 4 February 2011
 NA-MIC http://na-mic.org 3D Slicer 4 February 2011 Andrey Fedorov, PhD Steve Pieper, PhD Ron Kikinis, MD Surgical Planning Lab Brigham and Women's Hospital Acknowledgments Picture courtesy Kapur, Jakab,
Introduction to Scientific Visualization
 CS53000 - Spring 2018 Introduction to Scientific Visualization Introduction to January 11, 2018 The Visualization Toolkit Open source library for Visualization Computer Graphics Imaging Written in C++
UGviewer: a medical image viewer
 Appendix A UGviewer: a medical image viewer As a complement to this master s thesis, an own medical image viewer was programmed. This piece of software lets the user visualize and compare images. Designing
Albert M. Vossepoel. Center for Image Processing
 Albert M. Vossepoel www.ph.tn.tudelft.nl/~albert scene image formation sensor pre-processing image enhancement image restoration texture filtering segmentation user analysis classification CBP course:
MITK-DI. A new Diffusion Imaging Component for MITK. Klaus Fritzsche, Hans-Peter Meinzer
 MITK-DI A new Diffusion Imaging Component for MITK Klaus Fritzsche, Hans-Peter Meinzer Division of Medical and Biological Informatics, DKFZ Heidelberg k.fritzsche@dkfz-heidelberg.de Abstract. Diffusion-MRI
Introduction to scientific visualization with ParaView
 Introduction to scientific visualization with ParaView Paul Melis SURFsara Visualization group paul.melis@surfsara.nl (some slides courtesy of Robert Belleman, UvA) Outline Introduction, pipeline and data
Scalar Data. CMPT 467/767 Visualization Torsten Möller. Weiskopf/Machiraju/Möller
 Scalar Data CMPT 467/767 Visualization Torsten Möller Weiskopf/Machiraju/Möller Overview Basic strategies Function plots and height fields Isolines Color coding Volume visualization (overview) Classification
Scalar Data. Visualization Torsten Möller. Weiskopf/Machiraju/Möller
 Scalar Data Visualization Torsten Möller Weiskopf/Machiraju/Möller Overview Basic strategies Function plots and height fields Isolines Color coding Volume visualization (overview) Classification Segmentation
Introduction to scientific visualization with ParaView
 Introduction to scientific visualization with ParaView Tijs de Kler SURFsara Visualization group Tijs.dekler@surfsara.nl (some slides courtesy of Robert Belleman, UvA) Outline Pipeline and data model (10
The Advanced Neuro MR Processing & Visualization Solution
 The Advanced Neuro MR Processing & Visualization Solution Optimized Workflow Automated Processing Provides Answers Faster and More Efficiently The DynaSuite Neuro Workstation is a high performance advanced
Presentation Outline. Some RSI Customers
 Research Systems, Inc. Software Vision Presentation Outline Introducing Research Systems IDL overview ENVI - remote sensing application Visible Human - anatomical CD reference VIP RiverTools NeoSys The
VTK: The Visualiza.on Toolkit
 VTK: The Visualiza.on Toolkit Part I: Overview and Graphics Models Han- Wei Shen The Ohio State University What is VTK? An open source, freely available soiware system for 3D graphics, image processing,
Amira For FEI Systems D Data Visualization and Analysis Software for Life Sciences
 RELEASE NOTES - AMIRA FOR FEI SYSTEMS 6.3.0, DECEMBER 2016 Amira For FEI Systems 6.3.0 3D Data Visualization and Analysis Software for Life Sciences Dear Amira for FEI Systems User, With this document
NeuroQLab A Software Assistant for Neurosurgical Planning and Quantitative Image Analysis
 NeuroQLab A Software Assistant for Neurosurgical Planning and Quantitative Image Analysis Florian Weiler 1, Jan Rexilius 2, Jan Klein 1, Horst K. Hahn 1 1 Fraunhofer MEVIS, Universitätsallee 29, 28359
Image Analysis Lecture Segmentation. Idar Dyrdal
 Image Analysis Lecture 9.1 - Segmentation Idar Dyrdal Segmentation Image segmentation is the process of partitioning a digital image into multiple parts The goal is to divide the image into meaningful
Visualization ToolKit (VTK) Part I
 Part I") Visualization ToolKit (VTK) Part I Weiguang Guan RHPCS, ABB 131-G Email: guanw@mcmaster.ca Phone: 905-525-9140 x 22540 Outline Overview Installation Typical structure of a VTK application Visualization
Visualization ToolKit (VTK) Part I Weiguang Guan RHPCS, ABB 131-G Email: guanw@mcmaster.ca Phone: 905-525-9140 x 22540 Outline Overview Installation Typical structure of a VTK application Visualization
SIVIC GUI Overview. SIVIC GUI Layout Overview
 SIVIC GUI Overview SIVIC GUI Layout Overview At the top of the SIVIC GUI is a row of buttons called the Toolbar. It is a quick interface for loading datasets, controlling how the mouse manipulates the
Open Inventor Medical Edition High-performance 3D software development tools
 Open Inventor Medical Edition High-performance 3D software development tools Open Inventor Medical Edition is an object-oriented 2D and 3D software development toolkit (SDK) for developing professional
Developing Imagery Apps Using the ArcGIS API for JavaScript and WebApp Builder. Naila Khan, Chayanika Khatua
 Developing Imagery Apps Using the ArcGIS API for JavaScript and WebApp Builder Naila Khan, Chayanika Khatua What are we talking about today Custom applications Map Viewer Web AppBuilder ArcGIS API for
Introduction. Welcome to 3D Slicer! Surgical Planning Laboratory -1- Brigham and Women s Hospital
 Introduction Welcome to 3D Slicer! -1- Overview of Training What is Slicer? Uses of Slicer Getting Slicer How to Use Slicer Loading Data Viewing Data Modifying Data Saving Data -2- What is Slicer? -3-
Tutorial 19: VFX Workflows with Alembic
 Tutorial 19: VFX Workflows with Alembic Table of Contents Tutorial 19: VFX workflows with Alembic.................................... 3 2 Tutorial 19: VFX workflows with Alembic Download items Tutorial
CS450/550. Pipeline Architecture. Adapted From: Angel and Shreiner: Interactive Computer Graphics6E Addison-Wesley 2012
 CS450/550 Pipeline Architecture Adapted From: Angel and Shreiner: Interactive Computer Graphics6E Addison-Wesley 2012 0 Objectives Learn the basic components of a graphics system Introduce the OpenGL pipeline
Introduction to Python and VTK
 Introduction to Python and VTK Scientific Visualization, HT 2014 Lecture 2 Johan Nysjö Centre for Image analysis Swedish University of Agricultural Sciences Uppsala University About me PhD student in Computerized
Introduction to Scientific Visualization
 Introduction to Scientific Visualization Aaron Birkland Cornell Center for Advanced Computing Data Analysis on Ranger January 2012 A lab-intensive workshop Start off with basic concepts Data, transformations,
Scientific Visualization. Katia Oleinik:
 Scientific Visualization Katia Oleinik: koleinik@bu.edu Scientific Visualization (or SciVis) is a branch of computer science which is concerned with graphical representation of real-world objects and scientific
Visualization Systems. Ronald Peikert SciVis Visualization Systems 11-1
 Visualization Systems Ronald Peikert SciVis 2008 - Visualization Systems 11-1 Modular visualization environments Many popular visualization software are designed as socalled modular visualization environments
Comparison of Vessel Segmentations Using STAPLE
 Comparison of Vessel Segmentations Using STAPLE Julien Jomier, Vincent LeDigarcher, and Stephen R. Aylward Computer-Aided Diagnosis and Display Lab, The University of North Carolina at Chapel Hill, Department
multimodality image processing workstation Visualizing your SPECT-CT-PET-MRI images
 multimodality image processing workstation Visualizing your SPECT-CT-PET-MRI images FUSION FUSION is a new visualization and evaluation software developed by Mediso built on state of the art technology,
Introduction to Medical Image Processing
 Introduction to Medical Image Processing Δ Essential environments of a medical imaging system Subject Image Analysis Energy Imaging System Images Image Processing Feature Images Image processing may be
Visualization with ParaView
 Visualization with Before we begin Make sure you have 3.10.1 installed so you can follow along in the lab section http://paraview.org/paraview/resources/software.html http://www.paraview.org/ Background
Tools Menu (Frequently Used Features)
") Tools Menu (Frequently Used Features) Exit VoxelCalc Shop for features Show VoxelCalc User Guide (right click on oither icons shows user guide for that function) Region of Interest (ROI) tool with beam
Tools Menu (Frequently Used Features) Exit VoxelCalc Shop for features Show VoxelCalc User Guide (right click on oither icons shows user guide for that function) Region of Interest (ROI) tool with beam
Introduction to ITK. David Doria. (Funded by the US National Library of Medicine)
") Introduction to ITK David Doria (Funded by the US National Library of Medicine) Funded By: (clearly a lot of interest!) National Library of Medicine (NLM) National Institute of Dental and Craniofacial
Introduction to ITK David Doria (Funded by the US National Library of Medicine) Funded By: (clearly a lot of interest!) National Library of Medicine (NLM) National Institute of Dental and Craniofacial
Introduction to Visualization on Stampede
 Introduction to Visualization on Stampede Aaron Birkland Cornell CAC With contributions from TACC visualization training materials Parallel Computing on Stampede June 11, 2013 From data to Insight Data
JAVA DIP - OPEN SOURCE LIBRARIES
 JAVA DIP - OPEN SOURCE LIBRARIES http://www.tutorialspoint.com/java_dip/open_source_libraries.htm Copyright tutorialspoint.com In this chapter, we explore some of the free image processing libraries that
Insight VisREU Site. Agenda. Introduction to Scientific Visualization Using 6/16/2015. The purpose of visualization is insight, not pictures.
 2015 VisREU Site Introduction to Scientific Visualization Using Vetria L. Byrd, Director Advanced Visualization VisREU Site Coordinator REU Site Sponsored by NSF ACI Award 1359223 Introduction to SciVis(High
Amira for FEI Systems D Data Visualization and Analysis Software for Life Sciences
 RELEASE NOTES AMIRA FOR FEI SYSTEMS 6.1.1, MAY 2016 Amira for FEI Systems 6.1.1 3D Data Visualization and Analysis Software for Life Sciences Dear Amira User, With this document we would like to inform
INTRODUCTION TO THE ANAPHE/LHC++ SOFTWARE SUITE
 INTRODUCTION TO THE ANAPHE/LHC++ SOFTWARE SUITE Andreas Pfeiffer CERN, Geneva, Switzerland Abstract The Anaphe/LHC++ project is an ongoing effort to provide an Object-Oriented software environment for
Visualization on BioHPC
 Visualization on BioHPC [web] [email] portal.biohpc.swmed.edu biohpc-help@utsouthwestern.edu 1 Updated for 2015-09-16 Outline What is Visualization - Scientific Visualization - Work flow for Visualization
MITK-DI. A new Diffusion Imaging Component for MITK. Klaus Fritzsche, Hans-Peter Meinzer
 MITK-DI A new Diffusion Imaging Component for MITK Klaus Fritzsche, Hans-Peter Meinzer Division of Medical and Biological Informatics, DKFZ Heidelberg k.fritzsche@dkfz-heidelberg.de Abstract. Diffusion-MRI
Introduction to 3D Scientific Visualization. Training in Visualization for PRACE Summer of HPC 2013 Leon Kos, University of Ljubljana, Slovenia
 Introduction to 3D Scientific Visualization Training in Visualization for PRACE Summer of HPC 2013 Leon Kos, University of Ljubljana, Slovenia Motto Few correctly put words is worth hundreds of images.
Indirect Volume Rendering
 Indirect Volume Rendering Visualization Torsten Möller Weiskopf/Machiraju/Möller Overview Contour tracing Marching cubes Marching tetrahedra Optimization octree-based range query Weiskopf/Machiraju/Möller
CHAPTER 1 Graphics Systems and Models 3
 ?????? 1 CHAPTER 1 Graphics Systems and Models 3 1.1 Applications of Computer Graphics 4 1.1.1 Display of Information............. 4 1.1.2 Design.................... 5 1.1.3 Simulation and Animation...........
Interactive segmentation of vascular structures in CT images for liver surgery planning
 Interactive segmentation of vascular structures in CT images for liver surgery planning L. Wang¹, C. Hansen¹, S.Zidowitz¹, H. K. Hahn¹ ¹ Fraunhofer MEVIS, Institute for Medical Image Computing, Bremen,
Comparison Study of Clinical 3D MRI Brain Segmentation Evaluation
 Comparison Study of Clinical 3D MRI Brain Segmentation Evaluation Ting Song 1, Elsa D. Angelini 2, Brett D. Mensh 3, Andrew Laine 1 1 Heffner Biomedical Imaging Laboratory Department of Biomedical Engineering,
Open Inventor Medical Edition
 PROVIDE ADVANCED IMAGE ANALYSIS CAPABILITIES DEVELOP ONCE, ACCESS EVERYWHERE IMPLEMENT IMAGE COMPUTING WORKFLOWS DELIVER UNRIVALED 2D/3D VISUALIZATION Open Inventor Medical Edition 3D graphics and image
The ML Programming Guide. Programming Object-Oriented Image Processing with the MeVis Library
 The ML Programming Guide Programming Object-Oriented Image Processing with the MeVis Library 1 The ML Programming Guide The ML Programming Guide Copyright MeVis Medical Solutions Published 2018-06-26 2
Scalar Algorithms -- surfaces
 Scalar Algorithms -- surfaces Color Mapping Slicing Clipping Contouring / iso-surface 1 Sources of Scalar Data Sensors CT/MRI Surface Scanners: laser/range scans Simulations CFD/FEM Mathematical Implicit
Contour Analysis And Visualization
 Contour Analysis And Visualization Objectives : stages The objectives of Contour Analysis and Visualization can be described in the following 1. To study and analyse the contour 2. Visualize the contour
Image Processing Guideline for TMU 7T MRI
 Image Processing Guideline for TMU 7T MRI Chia Feng Lu Laboratory of NeuroImage Biomarker Analysis, Translational Imaging Research Center, TMU 08/18/2015, version 1.0 Section 1: Installation of ImageJ
Babu Madhav Institute of Information Technology Years Integrated M.Sc.(IT)(Semester - 7)
(Semester - 7)") 5 Years Integrated M.Sc.(IT)(Semester - 7) 060010707 Digital Image Processing UNIT 1 Introduction to Image Processing Q: 1 Answer in short. 1. What is digital image? 1. Define pixel or picture element?
5 Years Integrated M.Sc.(IT)(Semester - 7) 060010707 Digital Image Processing UNIT 1 Introduction to Image Processing Q: 1 Answer in short. 1. What is digital image? 1. Define pixel or picture element?
Tutorial. on SlicerRT and 3D Slicer modules
 Tutorial on SlicerRT and 3D Slicer modules Agenda Acquire and build SlicerRT (on an existing Slicer) Use python console in Slicer Create extension and module skeletons Use extension template Use scripted
Application of fuzzy set theory in image analysis. Nataša Sladoje Centre for Image Analysis
 Application of fuzzy set theory in image analysis Nataša Sladoje Centre for Image Analysis Our topics for today Crisp vs fuzzy Fuzzy sets and fuzzy membership functions Fuzzy set operators Approximate
Scalar Algorithms: Contouring
 Scalar Algorithms: Contouring Computer Animation and Visualisation Lecture tkomura@inf.ed.ac.uk Institute for Perception, Action & Behaviour School of Informatics Contouring Scaler Data Last Lecture...
Clipping. CSC 7443: Scientific Information Visualization
 Clipping Clipping to See Inside Obscuring critical information contained in a volume data Contour displays show only exterior visible surfaces Isosurfaces can hide other isosurfaces Other displays can
High Level Graphics Programming & VR System Architecture
 High Level Graphics Programming & VR System Architecture Hannes Interactive Media Systems Group (IMS) Institute of Software Technology and Interactive Systems Based on material by Dieter Schmalstieg VR
Index C, D, E, F I, J
 Index A Ambient light, 12 B Blurring algorithm, 68 Brightness thresholding algorithm float testapp::blur, 70 kinect.update(), 69 void testapp::draw(), 70 void testapp::exit(), 70 void testapp::setup(),
3D Representation and Solid Modeling
 MCS 585/480 Computer Graphics I 3D Representation and Solid Modeling Week 8, Lecture 16 William Regli and Maxim Peysakhov Geometric and Intelligent Computing Laboratory Department of Computer Science Drexel
Digital Image Processing
 Digital Image Processing Third Edition Rafael C. Gonzalez University of Tennessee Richard E. Woods MedData Interactive PEARSON Prentice Hall Pearson Education International Contents Preface xv Acknowledgments
First Steps in Hardware Two-Level Volume Rendering
 First Steps in Hardware Two-Level Volume Rendering Markus Hadwiger, Helwig Hauser Abstract We describe first steps toward implementing two-level volume rendering (abbreviated as 2lVR) on consumer PC graphics
Volume Illumination and Segmentation
 Volume Illumination and Segmentation Computer Animation and Visualisation Lecture 13 Institute for Perception, Action & Behaviour School of Informatics Overview Volume illumination Segmentation Volume
The Application Stage. The Game Loop, Resource Management and Renderer Design
 1 The Application Stage The Game Loop, Resource Management and Renderer Design Application Stage Responsibilities 2 Set up the rendering pipeline Resource Management 3D meshes Textures etc. Prepare data
A Workflow Optimized Software Platform for Multimodal Neurosurgical Planning and Monitoring
 A Workflow Optimized Software Platform for Multimodal Neurosurgical Planning and Monitoring Eine Workflow Optimierte Software Umgebung für Multimodale Neurochirurgische Planung und Verlaufskontrolle A
Color Spaces. What is Linear Workflow?
 Color Spaces What is Linear Workflow? Using LightWave s CS Settings Convert Color Space to Linear Apply Color Space Other Options Before we delve into surfacing proper, an increasingly important part of
Scalable and Distributed Visualization using ParaView
 Scalable and Distributed Visualization using ParaView Eric A. Wernert, Ph.D. Senior Manager & Scientist, Advanced Visualization Lab Pervasive Technology Institute, Indiana University Big Data for Science
ImageVis3D "Hands On"-Session
 ImageVis3D "Hands On"-Session Center for Integrative Biomedical Computing 2009 Workshop, Northeastern University 1 1. The current state of ImageVis3D Remember : 1. If you find any problems in ImageVis3D,
Scalar Visualization
 Scalar Visualization Visualizing scalar data Popular scalar visualization techniques Color mapping Contouring Height plots outline Recap of Chap 4: Visualization Pipeline 1. Data Importing 2. Data Filtering
Segmentation tools and workflows in PerGeos
 Segmentation tools and workflows in PerGeos 1. Introduction Segmentation typically consists of a complex workflow involving multiple algorithms at multiple steps. Smart denoising and morphological filters
ENHANCING PCL USABILITY: A GUI FRONT-END, INTERFACING WITH VTK, IMAGE PROCESSING ON POINT CLOUDS, AND MORE! David Doria
 ENHANCING PCL USABILITY: A GUI FRONT-END, INTERFACING WITH VTK, IMAGE PROCESSING ON POINT CLOUDS, AND MORE! David Doria GSOC PROJECTS Object Reconstruction Web-based applications Recognition module improvements
What is visualization? Why is it important?
 What is visualization? Why is it important? What does visualization do? What is the difference between scientific data and information data Visualization Pipeline Visualization Pipeline Overview Data acquisition
Many rendering scenarios, such as battle scenes or urban environments, require rendering of large numbers of autonomous characters.
 1 2 Many rendering scenarios, such as battle scenes or urban environments, require rendering of large numbers of autonomous characters. Crowd rendering in large environments presents a number of challenges,
Cindy3D Project Documentation
 Cindy3D Project Documentation Matthias Reitinger Jan Sommer March 13, 2012 2 Contents 1. Project overview 4 1.1. Cinderella & CindyScript........................... 4 1.2. Cindy3D.....................................
LASERDATA LIS build your own bundle! LIS Pro 3D LIS 3.0 NEW! BETA AVAILABLE! LIS Road Modeller. LIS Orientation. LIS Geology.
 LIS 3.0...build your own bundle! NEW! LIS Geology LIS Terrain Analysis LIS Forestry LIS Orientation BETA AVAILABLE! LIS Road Modeller LIS Editor LIS City Modeller colors visualization I / O tools arithmetic
5. Volume Visualization
 5. Volume Visualization Scalar volume data Medical Applications: CT, MRI, confocal microscopy, ultrasound, etc. 1 5. Volume Visualization 2 5. Volume Visualization 3 5. Volume Visualization Some possible
An Introduction to Geometric Modeling using Polygonal Meshes
 An Introduction to Geometric Modeling using Polygonal Meshes Joaquim Madeira Version 0.2 October 2014 U. Aveiro, October 2014 1 Main topics CG and affine areas Geometric Modeling Polygonal meshes Exact
Seg3D Lab Walkthrough
 Seg3D Lab Walkthrough Seg3D 2.1 Documentation Center for Integrative Biomedical Computing Scientific Computing & Imaging Institute University of Utah Seg3D software download: http://software.sci.utah.edu
Scene-Based Segmentation of Multiple Muscles from MRI in MITK
 Scene-Based Segmentation of Multiple Muscles from MRI in MITK Yan Geng 1, Sebastian Ullrich 2, Oliver Grottke 3, Rolf Rossaint 3, Torsten Kuhlen 2, Thomas M. Deserno 1 1 Department of Medical Informatics,
Visualisation : Lecture 1. So what is visualisation? Visualisation
 So what is visualisation? UG4 / M.Sc. Course 2006 toby.breckon@ed.ac.uk Computer Vision Lab. Institute for Perception, Action & Behaviour Introducing 1 Application of interactive 3D computer graphics to