Fitting NMR peaks for N,N DMA
|
|
|
- Tamsin Terry
- 6 years ago
- Views:
Transcription
. 1.")
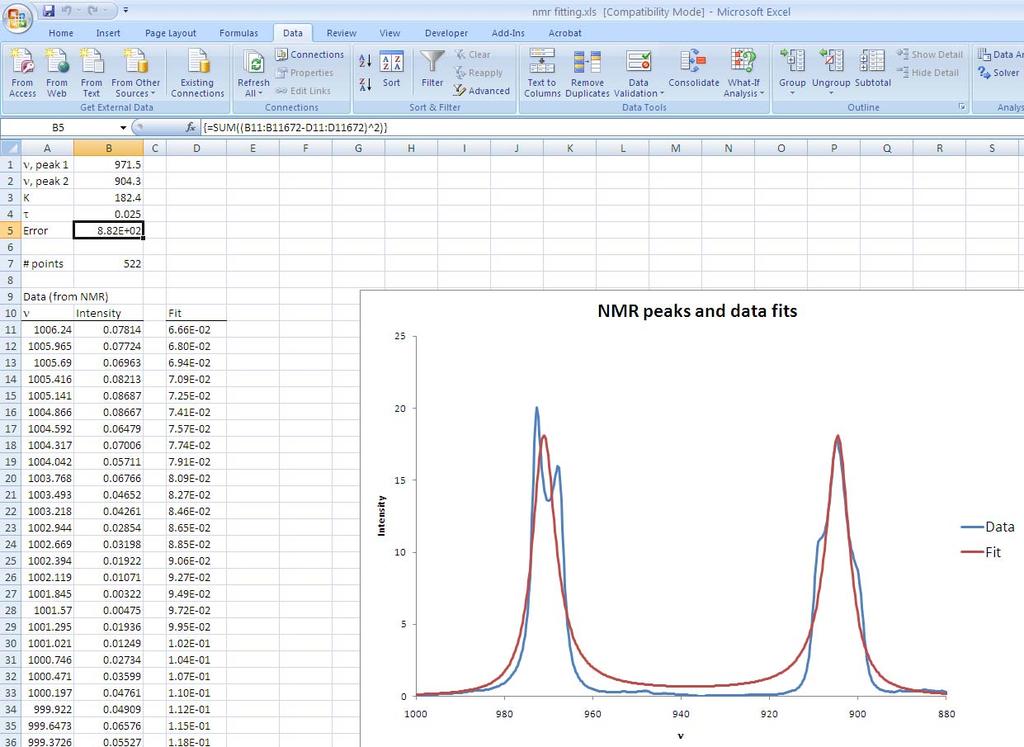
1 Fitting NMR peaks for N,N DMA Importing the FID file to your local system Any ftp program may be used to transfer the FID file from the NMR computer. The description below will take you through the process using Filezilla (a freeware ftp/sftp program). 1. Open Filezilla (if the program is not on your computer, simply Google filezilla, and you will find many download sites. Download and installation should be straightforward). 2. Under the File tab, select Site manager. A new window should appear: If you have not set up a connection to the NMR server, click new site and enter a name in the left hand pane ( nmr in the example above). Enter bloch.nobel.gac.edu for the host, ftp for the servertype and normal for the logontype (all as shown above). Enter the username and password you used when logging onto the NMR to collect the spectrum originally and click Connect. Note: if you have already done this, you can go into the site manager, select the correct site from the left hand pane, and click Connect.

2 3. The Filezilla window should now contain two separate file trees, one for the system you are on (left) and a second for the NMR computer (right): In the left hand side of the Filezilla window, browse to the folder/location on your computer you wish to move your NMR files to. Then, in the right hand side of the Filezilla window, browse to the folder on the NMR computer which contains your data. There should be three files in the folder, named fid, procpar and text. 4. Under the Transfer tab, select Transfer type > binary. Next, highlight and drag the three files (fid, procpar and text) to the selected location on the left hand side of the Filezilla screen. Once the files are successfully transferred (i.e. they are no longer listed in the Queued files area at the bottom), you may exit Filezilla.
3 Using MestRe C to generate data for fitting 1. Open MestRe C. The basic screen should look like 2. Click File > Open and browse to the location where you put the fid, procpar and text files. If necessary, set the filetype to All files. Select the fid file and click Open. A non Fourier transformed plot should appear, which should look something like
4 3. To perform a Fourier transform, click the button and click on the Apply along t1 button in the window which pops up. The result should look something like 4. Next you will need to phase the spectrum. Clicking on the autophase button should result in a spectrum which looks more or less recognizable as an NMR spectrum.
.")

5 5. Chances are that the autophase routine will not generate a good baseline (as it didn t in the figure above). If this is the case, you may use the manual phasing option by clicking on the button. This brings up the interactive phase correction box:
6 If you click (and hold) the left mouse button and move it up and down in the yellow space, the baseline will change; holding down the ctrl key will allow you to make fine adjustments. Adjust the phase (as needed) until you have an acceptable baseline. 6. You can now zoom in on the portion of the spectrum you are interested in; when you save your data later, only the portion of the spectrum being displayed will be written to the data file. First, you may want to move the spectrum up/down to occupy the window as much as possible. If you move the cursor over the baseline, you can simply click (and hold) to drag the spectrum up or down. The zoom icons (or the wheel of a wheel mouse) will allow you to zoom in/out. The magnifying glass icon will allow you to select the portion of the x axis which you would like to enlarge. Suppose you want to look at the two peaks slightly above 3 ppm in the spectrum above. Changing the baseline and zooming in might yield the spectrum below:

7 7. If the spectrum above is sufficient for fitting, you can now export the data; if it is not, you may modify it as needed. To export the data into a form usable by the data fitting spreadsheet in Excel, click File > Export file > ASCII. In the pop up window, select Export only real part, Export only current displayed data, Include header and Include units. Also select Hz in the Include units pulldown menu (since the analysis requires frequencies, not shifts in ppm). Click OK, and select a name and location for the data file. At this point, you are done with MestRe C; you may want to wait to close it until you are certain that your spectrum is adequate. When you close MestRe C, it is recommended that you do not save the changes to the FID file.

 contains the frequency data, and the second column (B) contains the intensity data; copy only the data (starting in cells A8 and B8 in the example above) and")
8 Opening the data in Excel and fitting the peaks 1. Open the Excel sheet named nmr fitting.xls ; the file should be compatible with older versions of Excel. 2. Open the ASCII file you saved in MestRe C. In the first screen of the text import wizard, select Delimited and click Next. In the next screen select Tab and click Finish. You should now have two columns of data in Excel 3. The first column (A) contains the frequency data, and the second column (B) contains the intensity data; copy only the data (starting in cells A8 and B8 in the example above) and past it into nmr fitting.xls starting in cell A11. If necessary, adjust the limits of the x axis of the plot in nmr fitting.xls so that you can see both peaks.

9 4. In nmr fitting.xls, copy and paste cell D11 down to the last row containing data in columns A and B. For example, if your last data points occur in cells A500 and B500, copy cell D11 and paste it into cells D12 through D Enter the approximate frequencies of the two peaks in the plot into cells B1 and B2. In the example above, good guesses might be 900 s 1 and 970 s 1. When you do this, a second line (red/brown) should appear on the graph. This is a plot of the fitting function; keep in mind that it has not yet been fit properly though, so it might not look very good.
10 6. Ensure that the Solver Add In function is installed. If it is not, search solver in the help function in Excel and follow the installation steps. 7. Highlight cell B5 (to the right of Error ). Open the solver dialog box and select the following: Set target cell: $B$5 (can be set by clicking the box with the red arrow and highlighting the cell) Equal to: Min By changing cells: $B$1:$B$4 8. Click the Options button and make the following changes (as necessary): Iterations: 1000 Derivatives: Central Search: Conjugate Then click OK 9. Click Solve ; it may take a little while, depending on the size of your data set. When it is done, the Solver Results box should open. If the fit is reasonable (look at the graph), select Keep solver solution and click OK. If the fit does not look good, you may select Restore original values and try again (but this is unlikely). 10. The best fit values of ν A, ν B, K and τ will now appear in cells B1 through B4, respectively.
11
Working with Spectrum Tabs, Plots, and Charts
 CHAPTER 7 Spectrum Tabs, Plots, and Charts Overview Cisco Spectrum Expert software provides two spectrum tabs, Spectrum and Spectrum (2). Each tab operates identically. The tabs allow you to create, name,
Basic 1D Processing. Opening Saved Data. Start the VnmrJ software. Click File > Open.
 Basic 1D Processing Opening Saved Data Start the VnmrJ software. Click File > Open. This will open a pop-up window. Clicking Home will take you to the data directory within your account. You can create
ADPRO FastTrace 2 USER GUIDE. Provided By:
 ADPRO FastTrace 2 USER GUIDE Provided By: View Live Video A shortcut to ADPRO FastTrace 2 has been placed on your desktop screen. Double click the icon to launch the application. FastTrace 2 A Login window
Microsoft Access 2010
 Microsoft Access 2010 Chapter 2 Querying a Database Objectives Create queries using Design view Include fields in the design grid Use text and numeric data in criteria Save a query and use the saved query
Microsoft Access 2013
 Microsoft Access 2013 Chapter 2 Querying a Database Objectives Create queries using Design view Include fields in the design grid Use text and numeric data in criteria Save a query and use the saved query
Microsoft Access 2013
 Microsoft Access 2013 Chapter 2 Querying a Database Objectives Create queries using Design view Include fields in the design grid Use text and numeric data in criteria Save a query and use the saved query
Getting to Know FlexPro in just 15 Minutes
 Getting to Know FlexPro in just 15 Minutes This tutorial provides you with a brief overview of the structure of FlexPro and the basic command methods. 3 Managing Data with FlexPro FlexPro stores all objects
San Francisco State University
 San Francisco State University Michael Bar Instructions for Excel 1. Plotting analytical function. 2 Suppose that you need to plot the graph of a function f ( x) = x on the interval [ 5,5]. Step 1: make
WinSCP. Author A.Kishore/Sachin
 WinSCP WinSCP is a freeware windows client for the SCP (secure copy protocol), a way to transfer files across the network using the ssh (secure shell) encrypted protocol. It replaces other FTP programs
Candy is Dandy Project (Project #12)
") Candy is Dandy Project (Project #12) You have been hired to conduct some market research about M&M's. First, you had your team purchase 4 large bags and the results are given for the contents of those
Candy is Dandy Project (Project #12) You have been hired to conduct some market research about M&M's. First, you had your team purchase 4 large bags and the results are given for the contents of those
FileZilla FTP Instructions. FileZilla FTP Instructions
 FileZilla FTP Instructions 1 EMS FileZilla FTP Instructions 1, FileZilla Installation 2, Opening FileZilla 3, FileZilla Settings 4, Downloading Your Website 5, Uploading Your Website 6, More Help EMS Internet
MestReC Cheat Sheet. by Monika Ivancic, July 1 st 2005
 MestReC Cheat Sheet by Monika Ivancic, July 1 st 2005 This Cheat Sheet is to be used at UW-Madison as a quick guide to processing using the MestReC NMR software. You may find more help at the MestReC homepage
Reading Worksheet Values from Plotted Data
 Lesson 5: ITC Data Handling Lesson 5: ITC Data Handling Every data plot in Origin has an associated worksheet. The worksheet contains the X, Y and, if appropriate, the error bar values for the plot. A
Completing Baseline s Site Survey Request Form
 Completing Baseline s Site Survey Request Form The first step in successfully implementing a radio network for your irrigation controllers is to identify the proposed locations for each radio. These radios
Open Excel by following the directions listed below: Click on Start, select Programs, and the click on Microsoft Excel.
 Candy is Dandy Grading Rubric You have been hired to conduct some market research about M&M's. First, you had your team purchase 4 large bags and the results are given for the contents of those bags. You
HOW TO USE THE EXPORT FEATURE IN LCL
 HOW TO USE THE EXPORT FEATURE IN LCL In LCL go to the Go To menu and select Export. Select the items that you would like to have exported to the file. To select them you will click the item in the left
GET TO KNOW FLEXPRO IN ONLY 15 MINUTES
 GET TO KNOW FLEXPRO IN ONLY 15 MINUTES Data Analysis and Presentation Software GET TO KNOW FLEXPRO IN ONLY 15 MINUTES This tutorial provides you with a brief overview of the structure of FlexPro and the
Microsoft Excel 2007 Lesson 7: Charts and Comments
 Microsoft Excel 2007 Lesson 7: Charts and Comments Open Example.xlsx if it is not already open. Click on the Example 3 tab to see the worksheet for this lesson. This is essentially the same worksheet that
Author A.Kishore/Sachin WinSCP
 WinSCP WinSCP is a freeware windows client for the SCP (secure copy protocol), a way to transfer files across the network using the ssh (secure shell) encrypted protocol. It replaces other FTP programs
Day : Date : Objects : Open MS Excel program * Open Excel application. Select : start. Choose: programs. Choose : Microsoft Office.
 Day : Date : Objects : Open MS Excel program * Open Excel application. Select : start Choose: programs Choose : Microsoft Office Select: Excel *The interface of Excel program - Menu bar. - Standard bar.
Statistics with a Hemacytometer
 Statistics with a Hemacytometer Overview This exercise incorporates several different statistical analyses. Data gathered from cell counts with a hemacytometer is used to explore frequency distributions
Ticket Mail Merge Instructions for MS Word 2007 and 2010
 Before starting the mail merge process make sure both the ticket template merge document and bidder number excel file are saved to your computer. These files are located on the volunteer resource site
Quick & Simple Imaging. User Guide
 Quick & Simple Imaging User Guide The Quick & Simple Imaging software package provides the user with a quick and simple way to search and find their documents, then view, print, add notes, or even e- mail
Day : Date : Objects : Open MS Excel program. Subject : * Open Excel application. Select : start. Choose: programs. Choose : Microsoft Office
 1 2 Day : Date : Objects : Open MS Excel program. Subject : * Open Excel application. Select : start Choose: programs Choose : Microsoft Office Select: Excel * Close the Excel program Click on the Close
Troubleshooting in Microsoft Excel 2002
 Page 1 of 8 Troubleshooting in Microsoft Excel 2002 Result: To understand how to work with the Excel software to enter data, navigate the page, and print materials. Tabs Look at the tabs at the bottom
Section 1 Microsoft Excel Overview
 Course Topics: I. MS Excel Overview II. Review of Pasting and Editing Formulas III. Formatting Worksheets and Cells IV. Creating Templates V. Moving and Navigating Worksheets VI. Protecting Sheets VII.
Service Line Export and Pivot Table Report (Windows Excel 2010)
") Service Line Export and Pivot Table Report (Windows Excel 2010) In this tutorial, we will take the Service Lines of the Active Students only and only the most recent record to take a snapshot look at approximate
Service Line Export and Pivot Table Report (Windows Excel 2010) In this tutorial, we will take the Service Lines of the Active Students only and only the most recent record to take a snapshot look at approximate
PHLI Instruction (734) Introduction. Lists.
 Introduction. Lists.") INTERMEDIATE EXCEL Introduction Microsoft Excel has many purposes. In addition to being an excellent data manger, Excel provides the means to perform complex analysis and evaluation of data. This brief
INTERMEDIATE EXCEL Introduction Microsoft Excel has many purposes. In addition to being an excellent data manger, Excel provides the means to perform complex analysis and evaluation of data. This brief
Processing data with Bruker TopSpin
 Processing data with Bruker TopSpin This exercise has three parts: a 1D 1 H spectrum to baseline correct, integrate, peak-pick, and plot; a 2D spectrum to plot with a 1 H spectrum as a projection; and
User manual. SmartPSS. Manual includes
 User manual software is used for viewing, playing back and exporting video footage from IP video surveillance systems. Manual includes Logging In Starting Live View Adding a Custom View Using Digital Zoom
University of North Dakota PeopleSoft Finance Tip Sheets. Utilizing the Query Download Feature
 There is a custom feature available in Query Viewer that allows files to be created from queries and copied to a user s PC. This feature doesn t have the same size limitations as running a query to HTML
IMSERC NMR MANUAL 02: Basic Processing of Varian 1D NMR Data
 IMSERC NMR MANUAL 02: Basic Processing of Varian 1D NMR Data Last updated: July 15, 2011 by Josh Kurutz This manual describes how to process NMR data on the offline processing computer in the IMSERC lab
1. Right-click the worksheet tab you want to rename. The worksheet menu appears. 2. Select Rename.
 Excel 2010 Worksheet Basics Introduction Page 1 Every Excel workbook contains at least one or more worksheets. If you are working with a large amount of related data, you can use worksheets to help organize
Attaching Codesoft 6 to an ODBC Database
 Attaching Codesoft 6 to an ODBC Database 1. From your Main Menu Options, go into Merge then Create ODBC query. The following Dialog Box will appear. 2. Select the button with 3 dots ( ) on it. 3. The Data
IMPORTING A STUDENT LIST FROM SYNERGY INTO A GOOGLE CONTACT LIST
 IMPORTING A STUDENT EMAIL LIST FROM SYNERGY INTO A GOOGLE CONTACT LIST In Synergy create a report for each class. 1. Log in to Synergy. 2. Open the list of available reports; select the Reports icon from
EXERCISE: GETTING STARTED WITH SAV
 Sequencing Analysis Viewer (SAV) Overview 1 EXERCISE: GETTING STARTED WITH SAV Purpose This exercise explores the following topics: How to load run data into SAV How to explore run metrics with SAV Getting
Introduction to Microsoft Excel 2007
 Introduction to Microsoft Excel 2007 Microsoft Excel is a very powerful tool for you to use for numeric computations and analysis. Excel can also function as a simple database but that is another class.
Frequency tables Create a new Frequency Table
 Frequency tables Create a new Frequency Table Contents FREQUENCY TABLES CREATE A NEW FREQUENCY TABLE... 1 Results Table... 2 Calculate Descriptive Statistics for Frequency Tables... 6 Transfer Results
For additional information, please consult the Read-Me and Help documentation or contact Electro-Voice or Dynacord technical support.
 Quick Start Guide Hello, and welcome to IRIS-Net software. We want you to get the most from your IRIS-Net projects and encourage you to explore the additional Read-Me and Help documentation provided with
OPENING A LEADS.TXT FILE IN EXCEL 2010
 From the project manager to a team of administrative, programming, and technical specialists, ATS believes in a team approach that brings together all of the necessary elements pre-conference and onsite
WaveSurfer at a glance
 WaveSurfer at a glance WaveSurfer has a simple but powerful interface. The basic document you work with is a sound. When WaveSurfer is first started, it contains an empty sound. You can load a sound file
Introduction to Microsoft Excel
 Chapter A spreadsheet is a computer program that turns the computer into a very powerful calculator. Headings and comments can be entered along with detailed formulas. The spreadsheet screen is divided
Using Spreadsheets, Selection Sets, and COGO Controls SPECTRA PRECISION SURVEY OFFICE TUTORIAL
 Using Spreadsheets, Selection Sets, and COGO Controls SPECTRA PRECISION SURVEY OFFICE TUTORIAL Corporate office: Spectra Precision 10355 Westmoor Drive Suite #100 Westminster, CO 80021 USA Phone: +1-720-587-4700
Working with PDF s. To open a recent file on the Start screen, double click on the file name.
 Working with PDF s Acrobat DC Start Screen (Home Tab) When Acrobat opens, the Acrobat Start screen (Home Tab) populates displaying a list of recently opened files. The search feature on the top of the
Using Microsoft Excel
 Using Microsoft Excel Introduction This handout briefly outlines most of the basic uses and functions of Excel that we will be using in this course. Although Excel may be used for performing statistical
Welcome to Cole On-line Help system!
 Welcome to Cole On-line Help system! Cole Online is an Internet based information directory that allows fast and efficient access to demographic information about residences and businesses. You can search
IP4 - Running reports
 To assist with tracking and monitoring HRIS recruitment and personnel, reports can be run from Discoverer Plus. This guide covers the following process steps: Logging in... 2 What s changed? Changed reference
Introduction to Excel
 Office Button, Tabs and Ribbons Office Button The File menu selection located in the upper left corner in previous versions of Excel has been replaced with the Office Button in Excel 2007. Clicking on
Flow Sim. Chapter 12. F1 Car. A. Enable Flow Simulation. Step 1. If necessary, open your ASSEMBLY file.
 Chapter 12 F1 Car Flow Sim A. Enable Flow Simulation. Step 1. If necessary, open your ASSEMBLY file. Step 2. If necessary, turn on Flow Simulation, click the flyout of Options on the Standard toolbar and
MS Office 2016 Excel Pivot Tables - notes
 Introduction Why You Should Use a Pivot Table: Organize your data by aggregating the rows into interesting and useful views. Calculate and sum data quickly. Great for finding typos. Create a Pivot Table
EXCEL BASICS: MICROSOFT OFFICE 2007
 EXCEL BASICS: MICROSOFT OFFICE 2007 GETTING STARTED PAGE 02 Prerequisites What You Will Learn USING MICROSOFT EXCEL PAGE 03 Opening Microsoft Excel Microsoft Excel Features Keyboard Review Pointer Shapes
Microsoft Access 2013
 Microsoft Access 2013 Chapter 1 Databases and Database Objects: An Introduction Objectives Describe the features of the Access window Create a database Create tables in Datasheet and Design views Add records
Open Microsoft Word: click the Start button, click Programs> Microsoft Office> Microsoft Office Word 2007.
 Microsoft Word 2007 Mail Merge Letter The information below is devoted to using Mail Merge to create a letter in Microsoft Word. Please note this is an advanced Word function, you should be comfortable
INTRODUCTION... 1 UNDERSTANDING CELLS... 2 CELL CONTENT... 4
 Introduction to Microsoft Excel 2016 INTRODUCTION... 1 The Excel 2016 Environment... 1 Worksheet Views... 2 UNDERSTANDING CELLS... 2 Select a Cell Range... 3 CELL CONTENT... 4 Enter and Edit Data... 4
Simulation of Laminar Pipe Flows
 Simulation of Laminar Pipe Flows 57:020 Mechanics of Fluids and Transport Processes CFD PRELAB 1 By Timur Dogan, Michael Conger, Maysam Mousaviraad, Tao Xing and Fred Stern IIHR-Hydroscience & Engineering
Microsoft Excel 2007
 Learning computers is Show ezy Microsoft Excel 2007 301 Excel screen, toolbars, views, sheets, and uses for Excel 2005-8 Steve Slisar 2005-8 COPYRIGHT: The copyright for this publication is owned by Steve
Microsoft Excel 2010
 Microsoft Excel 2010 omar 2013-2014 First Semester 1. Exploring and Setting Up Your Excel Environment Microsoft Excel 2010 2013-2014 The Ribbon contains multiple tabs, each with several groups of commands.
The Dreamweaver Interface
 The Dreamweaver Interface Let s take a moment to discuss the different areas of the Dreamweaver screen. The Document Window The Document Window shows you the current document. This is where you are going
Manual. User Reference Guide. Analysis Application (EMG) Electromyography Analysis
 Electromyography Analysis") Phone: (888) 765-9735 WWW.MINDWARETECH.COM User Reference Guide Manual Analysis Application Electromyography Analysis (EMG) Copyright 2014 by MindWare Technologies LTD. All Rights Reserved. 1 Phone: (614)
Phone: (888) 765-9735 WWW.MINDWARETECH.COM User Reference Guide Manual Analysis Application Electromyography Analysis (EMG) Copyright 2014 by MindWare Technologies LTD. All Rights Reserved. 1 Phone: (614)
Protein Deconvolution Quick Start Guide
 Protein Deconvolution Quick Start Guide The electrospray ionization (ESI) of intact peptides and proteins produces mass spectra containing a series of multiply charged ions with associated mass-to-charge
Visual Analytics User s Guide
 Visual Analytics User s Guide Question Page How do I log on to the system? 2 How do I navigate the reports? 3 How do I view an object that does not fit on the screen? 3 How do I change the column width
Unit 12. Electronic Spreadsheets - Microsoft Excel. Desired Outcomes
 Unit 12 Electronic Spreadsheets - Microsoft Excel Desired Outcomes Student understands Excel workbooks and worksheets Student can navigate in an Excel workbook and worksheet Student can use toolbars and
Blackboard Learn: Basics
 Blackboard Learn: Basics This document includes the following topics: 1. Log in Page 2 2. Find Your Courses Page 2 3. View Course Content Page 3 4. Add a Folder Page 3 5. Add a File Page 5 6. Add a Web
Geographical mapping of data
 BioNumerics Tutorial: Geographical mapping of data 1 Aim In many research projects, especially epidemiological, biological data is closely linked to geographical data. Geographical information provided
Exploring extreme weather with Excel - The basics
 Exploring extreme weather with Excel - The basics These activities will help to develop your data skills using Excel and explore extreme weather in the UK. This activity introduces the basics of using
Microsoft Excel 2010 Basic
 Microsoft Excel 2010 Basic Introduction to MS Excel 2010 Microsoft Excel 2010 is a spreadsheet software in the new Microsoft 2010 Office Suite. Excel allows you to store, manipulate and analyze data in
Data Should Not be a Four Letter Word Microsoft Excel QUICK TOUR
 Toolbar Tour AutoSum + more functions Chart Wizard Currency, Percent, Comma Style Increase-Decrease Decimal Name Box Chart Wizard QUICK TOUR Name Box AutoSum Numeric Style Chart Wizard Formula Bar Active
EXCEL BASICS: MICROSOFT OFFICE 2010
 EXCEL BASICS: MICROSOFT OFFICE 2010 GETTING STARTED PAGE 02 Prerequisites What You Will Learn USING MICROSOFT EXCEL PAGE 03 Opening Microsoft Excel Microsoft Excel Features Keyboard Review Pointer Shapes
Separate Text Across Cells The Convert Text to Columns Wizard can help you to divide the text into columns separated with specific symbols.
 Chapter 7 Highlights 7.1 The Use of Formulas and Functions 7.2 Creating Charts 7.3 Using Chart Toolbar 7.4 Changing Source Data of a Chart Separate Text Across Cells The Convert Text to Columns Wizard
MiBody 360 Personal Scale Instruction Manual
 MiBody 360 Personal Scale Instruction Manual 360SC- 1 DOWNLOAD AND INSTALLATION: TO DOWNLOAD AND INSTALL MIBODY 360 TRACKING SOFTWARE PLEASE VISIT: www.mibody360.com Please select your country/language
MindWare Electromyography (EMG) Analysis User Reference Guide Version Copyright 2011 by MindWare Technologies LTD. All Rights Reserved.
 Analysis User Reference Guide Version Copyright 2011 by MindWare Technologies LTD. All Rights Reserved.") MindWare Electromyography (EMG) Analysis User Reference Guide Version 3.0.12 Copyright 2011 by MindWare Technologies LTD. All Rights Reserved. MindWare EMG 3.0.12 User Guide Internet Support E-mail: sales@mindwaretech.com
MindWare Electromyography (EMG) Analysis User Reference Guide Version 3.0.12 Copyright 2011 by MindWare Technologies LTD. All Rights Reserved. MindWare EMG 3.0.12 User Guide Internet Support E-mail: sales@mindwaretech.com
Excel 2013 Charts and Graphs
 Excel 2013 Charts and Graphs Copyright 2016 Faculty and Staff Training, West Chester University. A member of the Pennsylvania State System of Higher Education. No portion of this document may be reproduced
Chapter 4. Microsoft Excel
 Chapter 4 Microsoft Excel Topic Introduction Spreadsheet Basic Screen Layout Modifying a Worksheet Formatting Cells Formulas and Functions Sorting and Filling Borders and Shading Charts Introduction A
Office365 at Triton College
 Office365 at Triton College Logging in to Office365 The new log in page for Triton email is http://outlook.com/triton.edu At that page, enter your username in this format: firstnamelastname@triton.edu
FLIR Tools+ and Report Studio
 Creating and Processing Word Templates http://www.infraredtraining.com 09-20-2017 2017, Infrared Training Center. 1 FLIR Report Studio Overview Report Studio is a Microsoft Word Reporting module that is
Status Bar: Right click on the Status Bar to add or remove features.
 Excel 2013 Quick Start Guide The Excel Window File Tab: Click to access actions like Print, Save As, etc. Also to set Excel options. Ribbon: Logically organizes actions onto Tabs, Groups, and Buttons to
MICROSOFT OFFICE. Courseware: Exam: Sample Only EXCEL 2016 CORE. Certification Guide
 MICROSOFT OFFICE Courseware: 3263 2 Exam: 77 727 EXCEL 2016 CORE Certification Guide Microsoft Office Specialist 2016 Series Microsoft Excel 2016 Core Certification Guide Lesson 1: Introducing Excel Lesson
Lesson 15: Using Text Files to Add or Modify Design Properties
 Lesson 15: Using Text Files to Add or Modify Design Properties Lesson Objectives After completing this lesson, you will be able to: Use the Export/Import commands Create a Custom Bill-of-Materials Using
For a walkthrough on how to install this ToolPak, please follow the link below.
 Using histograms to display turntable data On the explore page there is an option to produce a histogram using the data your students gather as they work their way through each of the different sources
Microsoft PowerPoint Lesson 2
 Microsoft PowerPoint 2010 Lesson 2 On completion of this lesson, students will be able to do the following: Create a new presentation from a theme Create a new slide Delete a slide Enter text in the Outline
PST for Outlook Admin Guide
 PST for Outlook 2013 Admin Guide Document Revision Date: Sept. 25, 2015 PST Admin for Outlook 2013 1 Populating Your Exchange Mailbox/Importing and Exporting.PST Files Use this guide to import data (Emails,
Quick Start Guide. Microinvest Barcode Printer Pro
 Quick Start Guide Microinvest Barcode Printer Pro 2016 Microinvest Barcode Printer Pro provides barcode printing functionality specifically designed to account for new orders and existing entries in the
PowerView for the EnergyPro
 Data Analysis Software User's Guide PowerView User's Guide Copyright 2005 CANDURA INSTRUMENTS. All Rights Reserved. The information in this document is subject to change without notice. CANDURA INSTRUMENTS
ADVANCED INQUIRIES IN ALBEDO: PART 2 EXCEL DATA PROCESSING INSTRUCTIONS
 ADVANCED INQUIRIES IN ALBEDO: PART 2 EXCEL DATA PROCESSING INSTRUCTIONS Once you have downloaded a MODIS subset, there are a few steps you must take before you begin analyzing the data. Directions for
North Carolina State University Department of Chemistry Varian NMR Training Manual
 North Carolina State University Department of Chemistry Varian NMR Training Manual by J.B. Clark IV & Dr. S. Sankar 1 st Edition 05/15/2009 Section 1: Essential Operations for Basic 1D Spectra Preparing
Contents. Group 2 Excel Handouts 2010
 Contents Styles... 2 Conditional Formatting... 2 Create a New Rule... 4 Format as Table... 5 Create your own New Table Style... 8 Cell Styles... 9 New Cell Style... 10 Merge Styles... 10 Sparklines...
Non-linear regression tutorial
 Non-linear regression tutorial The following table shows the raw data for performing nonlinear regression using Polymath (refer Table E7-4.1, Elements of chemical reaction engineering, 5 th edition) Pco
Astra Scheduling Grids
 Astra Scheduling Grids To access the grids, click on the Scheduling Grids option from the Calendars tab. A default grid will be displayed as defined by the calendar permission within your role. Choosing
Pre-Lab Excel Problem
 Pre-Lab Excel Problem Read and follow the instructions carefully! Below you are given a problem which you are to solve using Excel. If you have not used the Excel spreadsheet a limited tutorial is given
Getting Started with DADiSP
 Section 1: Welcome to DADiSP Getting Started with DADiSP This guide is designed to introduce you to the DADiSP environment. It gives you the opportunity to build and manipulate your own sample Worksheets
Excel. Spreadsheet functions
 Excel Spreadsheet functions Objectives Week 1 By the end of this session you will be able to :- Move around workbooks and worksheets Insert and delete rows and columns Calculate with the Auto Sum function
I. Downloading Grades from the Grade Center
 I. Downloading Grades from the Grade Center If you use the Blackboard Grade Center for grading, it is recommended that you download the data from the Grade Center into Excel to keep a backup copy for yourself.
TABLE OF CONTENTS INTRODUCTION...2
 WINGARD PE 6.0 August 2010 TABLE OF CONTENTS TABLE OF CONTENTS...1 1. INTRODUCTION...2 2. PROGRAM OVERVIEW...3 2.1. PROGRAM MENUS... 4 2.2. MAIN TOOLBAR... 5 2.3. ANALYSIS... 7 2.4. OUTPUT... 10 2.5. DISPLAY
Functions in Excel. Structure of a function: Basic Mathematical Functions. Arithmetic operators: Comparison Operators:
 Page1 Functions in Excel Formulas (functions) are equations that perform calculations on values in your spreadsheet. A formula always starts with an equal sign (=). Example: =5+2*7 This formula multiples
EXCEL 2007 TIP SHEET. Dialog Box Launcher these allow you to access additional features associated with a specific Group of buttons within a Ribbon.
 EXCEL 2007 TIP SHEET GLOSSARY AutoSum a function in Excel that adds the contents of a specified range of Cells; the AutoSum button appears on the Home ribbon as a. Dialog Box Launcher these allow you to
Overlap Checker & ENC Coverage User Manual
 Overlap Checker & ENC Coverage User Manual Document date: 01.01.2015 Contents Introduction... 3 Access to the VPN Check Overlap Candidates... 3 Coverage... 7 Copyright 2015 ECC AS Page 2 Introduction Overlap
DATA ARCHIVING SOFTWARE V.
 Interscan Corporation. ARC-MAX III - DATA ARCHIVING SOFTWARE V. 2.1.0.9 OPERATION MANUAL 1 Contents 1 Opening the program.... 3 2 Login Window... 3 2 Menu & Toolbar... 4 2.1 Current Data Display... 5 2.2
How to Transfer Your Contact Information Into Microsoft Outlook 2010
 How to Transfer Your Contact Information Into Microsoft Outlook 2010 Your Contacts Exported To an Excel Spreadsheet (CSV Format ) Now Located on a Device or Computer Then To Outlook 2010 on an L&F Computer
Introduction to Microsoft Access 2016
 Introduction to Microsoft Access 2016 A database is a collection of information that is related. Access allows you to manage your information in one database file. Within Access there are four major objects:
Intermediate Excel 2003
 Intermediate Excel 2003 Introduction The aim of this document is to introduce some techniques for manipulating data within Excel, including sorting, filtering and how to customise the charts you create.