SCO Debugger Tips and Tricks. Ron Record John Wolfe
|
|
|
- Aron Byron Cross
- 6 years ago
- Views:
Transcription
1 SCO Debugger Tips and Tricks Ron Record John Wolfe 1
2 Agenda Truss trace system calls & signals Debug Command line interface Graphical user interface Memtool catching dynamic memory errors SVR5 MALLOC_CHECKS 2
3 Debugging truss 3
4 Truss trace system calls & signals One or many processes Optionally follow forked process(es) Optionally indicate LWP id of threaded process(es) Asserts control (monitors) process through /proc file system Supports both SVR5 and OSR5 ABI processes Selectively display or suppress: System Calls, Signals, Machine Faults Complete I/O by file descriptor Display system call arguments 4
5 Truss command format truss [-flcaein] [-[tvx] [!] syscall...] [-s [!] signal...] [-m [!] fault...] [-[rw] [!] fd...] [-o outfile] command -p pid -f : follow child processes -l : display LWP on threaded programs -a : display string arguments to exec -e : display the ENVIRONMENT passed to exec Defaults -tall -v!all -x!all -sall -mall -m!fltpage - r!all -w!all 5
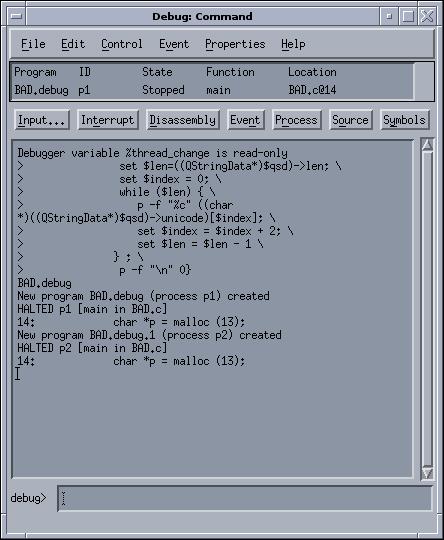
6 Debugging with debug 6
7 OpenServer 6 Debugger - debug Graphical user interface user configurable screen layouts command aliases Command line interface powerful, shell-like command language command history, command aliases Strong C and C++ symbolic debugging step through inline functions, header code, exceptions Controls multi-process, multi-threaded apps follow forks in both parent and children processes Understands ELF/COFF, DWARF I/II executables 7
8 debug - How to get started debug man page help command in the debugger help lists available commands and topics help <cmd-topic> - format and details about specific command or topic Use the on-line/locally installed debugger doc. Debugging and analyzing C & C++ Programs Command line and GUI Tutorials, explanations, and tips 8
9 debug - Command Format 1. debug [com_opts] [[-p] [-f all none procs] \ [-r] [-l start_loc] cmd_line] 2. debug [com_opts] [-p] [-m path] -c core_file \ [object] debug [com_opts] [-p] [-m path] core_file com_opts: [-V] [-i c x] [-X opt] [-d defaults] [-s path] [-Y[a g],dir] 9
10 debug - Concepts Debugger variables Begins with '%' Execution state %program %proc %thread %log %func %file %line %frame %db_lang %lastevent and %thisevent %lang - C %eh_object or C++ cpu_registers %follow %list_file control %list_line following of child processes all or procs versus none Debugger attributes %mode current line editing mode vi or emacs Initial setting by VISUAL or EDITOR environment setting 10
11 debug - Concepts continued Debugger attributes continued %num_lines default lines printed for list and dis commands %num_bytes default number of bytes displayed by dump %wait - synchronous or asynchronous command execution Synch. - "foreground", 1 or "yes" Asynch. - "background", 0 or "no" %thread_change - control behavior on state changes stop announce ignore %global_path - debugger's global search path Supplemental source search path 11
12 debug - Concepts continued User defined, debugger maintained variables Begin with a dollar sign - '$' Imports shell environment variables at start up Create with set command type is string Converted to integer as needed - strtol() 12
13 debug - Concepts continued proclist comma-separated list of procnames procnames all - all controlled processes and threads user / debugger generated program name debugger process id - p<n> debugger thread id - p<n>.<n> system process id - integer current %program, %process or %thread user debugger variable with integer process id 13
14 debug - Concepts continued Location [thread_id@][object@]address[+-constant] [thread_id@][object@][source_file@][header_file@]line [thread_id@][object@][source_file@][header_file@] function[+-constant] Qualified identifier [thread_id@][source_file@][function@][line_number@] identifier [thread_id@][source_file@][header_file@]identifier [thread_id@]frame_number@identifier [thread_id@]object_name@[source_file@][header_file@] identifier 14
15 debug - Concepts continued Expression Combination of: Variables (program, debugger, user debugger) Functions Qualified names Syntax of current language Enclose in parens, square brackets or curly braces Begins with '-' Contains: >, >>,,, &&, #, comma, semi-colon, newline 15
16 debug - Command Line Interface Creating a debug session create command create new process(es) create [-dpr] [-f all none procs] [-l start_loc] [cmd_line] grab command grab a running process or corefile grab [-f all none procs] [-l load_file] process_spec grab [-p] [-m path] -c corefile [objectfile] grab [-p] [-m path] corefile 16
17 debug - CLI: Process Execution Process Execution run [-p proclist] [ -bfr ] [ -u location ] step [-p proclist] [ -iobfq ] [ -c count ] next predefined alias for step -o release [-s] [-p proclist] halt [-p proclist] 17
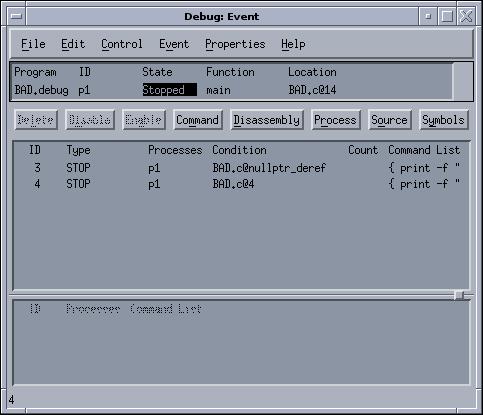
18 debug - Events Stop events Break points function, statement, instruction address Watch point value in memory changes *lvalue Expression logical expression is true- (expr) Signals - default: monitors every signal C++ exceptions - default: every throw and catch System calls On Stop event 18
19 debug - Creating/Managing Events Creating stop events stop [-p proc_list] [-c count] stop_expr [command] stop [-p proc_list] aliased as b Managing C++ exception events exception -d [-i] {throw catch} set default action henceforth exception [-p proclist] [-iq] {throw catch} [type] [command]] %eh_object current exception object 19
20 debug - Creating/Managing Events Managing signal actions signal -d [-i] [signal...] set default action henceforth signal [-p proclist] [-iq] [signal... [command]] signal [-p proclist] -m displays signal mask cancel [-p proclist] [signal...] cancel delivery of pending signal(s) to designated proclist kill [-p proclist] [signal] send signal to designated proclist 20
21 debug - Creating/Managing Events Tracing of system calls syscall [-p proclist] [[-eqx] [-c count] call... [command]] use system call name or number help sysnames -e on entry -x on exit On Stop Events onstop [-p proclist] [command] NOTE: single stepping constitutes a stop 21
22 debug - Creating/Managing Events events [-p proclist] [event_num...] lists all or the designated events {delete disable enable} event_num... delete, disable or enable the specified events enable -a [-p proclist] [event_type] delete, disable or enable ALL events of the specified event type change event_num [-p proclist] [-evqx] [-c count] [throw catch] [stop_expr call... signal... exception_type] [{commands}] 22
23 debug - Displaying Data & Process Information ps [-p proclist] list status of controlled threads and processes * marks current thread or process stack [-p proclist] [-f frame] [-c count] [-a address ] [ -s stack ] display function call backtrace * marks the current frame Aliased as t map [-p proclist] display virtual address map 23
24 debug - Displaying Data & Process Information List source lines list [-p proclist] [-c count] list from current location list next set of lines if repeated list [-p proclist] [-c count] qualified_src_location function name or source file and line number list [-p proclist] [-c count] /regexp/ list from the next line which matches the regexp list [-p proclist] [-c count]?regexp? Search backwards for the line that matches the regexp 24
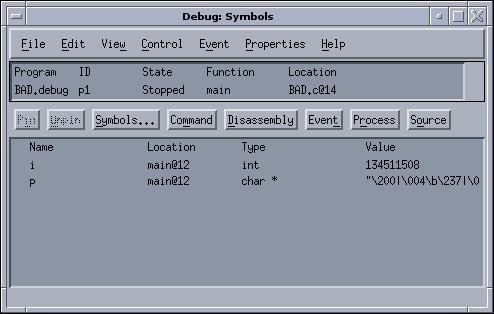
25 debug - Displaying Data & Process Information Display symbol names, values and types symbols [-p proclist] [-o object] [-n filename] [- dfgltuv] [pattern] Print value of an expression print [-p proclist] [-f format] [-v] expr,... expr evaluated in current language C or C++ format is format string acceptable to C printf() Display the type of an expression whatis [-p proclist] expr 25
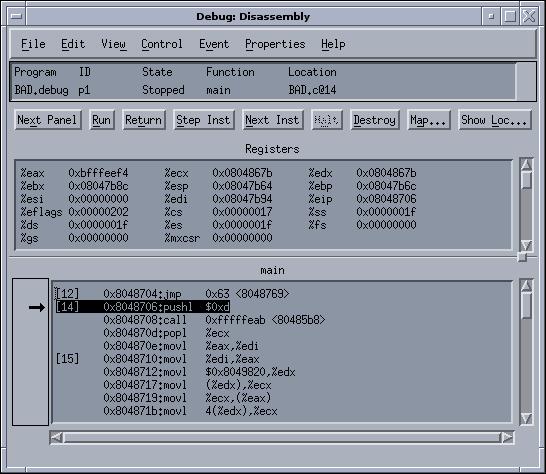
26 debug - Displaying Data & Process Information Display contents of memory dump [-p proclist] [-c byte_count] [-b] expression Disassemble machine instructions dis [-p proclist] [-c instr_count] [-ns] [location] [end_location] Display machine registers general, FP and MMX regs [-p proclist] 26
27 debug - Personal Configuration alias command define alternate / abbreviated commands use to establish dbx-like or gdb-like commands build complex, repetitive, conditional command sequences $HOME/.debugrc startup debug command script establish my_former_debugger-like configuration debug d <alt_startup> uses specific alternate startup script instead of default 27
28 debug - logon / logoff / script logon <log_file> logs debug commands entered and output to a file generated output appears as comments capture complete history capture repetitive command sequence logoff Terminate logging script <file> reads debug commands from <file> 28
29 debug - For dbx or gdb users dbx users Section 3 of the Porting Guide A Guide to debug for dbx Users gdb users command comparisons from May/June 2000 SCO World article Summary is in the on-line handout 29

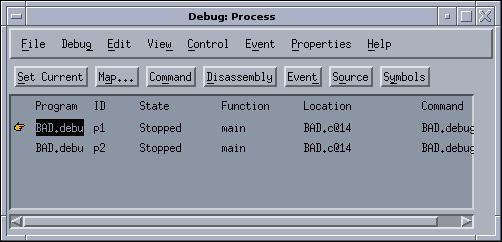
30 Debug GUI default layout 30
31 Debugging: Dynamic Memory memtool 31
32 memtool - Catching Dynamic Memory Errors [SVR5/UDK ABI only] Diagnose dynamic memory allocation errors writing beyond a block of memory using deallocated blocks memory leaks bad arguments passed to C malloc() or C++ new() Does not catch general pointer misuses or writing outside local or global arrays Runs the application under the hidden control of the debugger and the dynamic C library malloc runtime checking 32
33 memtool Under the covers diagnostic internal (two-way) output command-line communication memtool debug process control basic diagnostic information dynamic C library application process user interaction 33
34 memtool (cont'd) Diagnostics include one to three stack traces when detected when (de)allocated previous use (for realloc() or free()) Erroneously modified block diagnostics include an annotated memory dump snapshot for the block Each diagnostic comes with an explanation short, medium, or long (user selectable) Application need not be rebuilt or relinked debugging (-g flag) provides much better info 34
35 Debugging: Dynamic Memory SVR5 - MALLOC_CHECKS 35
36 MALLOC_CHECKS - SVR5 Environment variable activated memory checking in the SVR5 C runtime No recompilation needed - dynamic libc.so.1 MALLOC_CHECKS=<number> 1 = basic-fill mode 3 = safe-copy mode - duplicate arena block hdrs. 5 = added-space mode allocation padded mallinfo() - check arena integrity 2, 4, 6 = above with arena check on all malloc calls -1, -5 = high memory edge with electric fence -3, -7 = low memory edge with electric fence 36
37 Guidance / Assistance 37
38 OpenServer 6 Support Resources Porting Guide: rting/osr6portingtoc.html Upgrade Guide: grade/index.html Online Documentation and Late News 38
39 OpenServer 6 Support Resources Support Download Page for OpenServer 6: /product.php?pfid=12&prid=20 Tricks on getting OpenServer 5, UnixWare, SCO Unix and SCO Xenix applications running on SCO OpenServer 6 Forum eakout/140_boland_j_tips-tricks.ppt 39
40 OpenServer 6 Support Resources SCO Legend Mailing List: Public Legend-subscribe@list.sco.com legend@sco.com Porting/Migration Alias: osr5to6@sco.com Knowledge base: 40
Debug for GDB Users. Action Description Debug GDB $debug <program> <args> >create <program> <args>
 Page 1 of 5 Debug for GDB Users Basic Control To be useful, a debugger must be capable of basic process control. This functionally allows the user to create a debugging session and instruct the process
CSC209 Review. Yeah! We made it!
 CSC209 Review Yeah! We made it! 1 CSC209: Software tools Unix files and directories permissions utilities/commands Shell programming quoting wild cards files 2 ... and C programming... C basic syntax functions
CSC209: Software tools. Unix files and directories permissions utilities/commands Shell programming quoting wild cards files
 CSC209 Review CSC209: Software tools Unix files and directories permissions utilities/commands Shell programming quoting wild cards files ... and systems programming C basic syntax functions arrays structs
CSC209: Software tools. Unix files and directories permissions utilities/commands Shell programming quoting wild cards files. Compiler vs.
 CSC209 Review CSC209: Software tools Unix files and directories permissions utilities/commands Shell programming quoting wild cards files... and systems programming C basic syntax functions arrays structs
SGI Altix Getting Correct Code Reiner Vogelsang SGI GmbH
 SGI Altix Getting Correct Code Reiner Vogelsang SGI GmbH reiner@sgi.com Module Objectives After completing the module, you will able to Find caveats and hidden errors in application codes Handle debuggers
GDB QUICK REFERENCE GDB Version 4
 GDB QUICK REFERENCE GDB Version 4 Essential Commands gdb program [core] debug program [using coredump core] b [file:]function run [arglist] bt p expr c n s set breakpoint at function [in file] start your
Princeton University COS 217: Introduction to Programming Systems GDB Tutorial and Reference
 Princeton University COS 217: Introduction to Programming Systems GDB Tutorial and Reference Part 1: Tutorial This tutorial describes how to use a minimal subset of the gdb debugger. For more information
Using the Command-Line Interface
 CHAPTER 1 The command-line interface (CLI) is a line-oriented user interface that has a set of commands for configuring, managing, and monitoring the CSS. To help you use these commands, this chapter provides
gdbtui - Linux Command
 tui tui - Linux Command -batch -cd= dir -f -b bps -tty= dev -s sym -e prog -se prog -c core cmds -d dir prog core procid]] SYNOPSIS -help-nx-q DESCRIPTION The purpose of a debugger such as GDB is to allow
OS lpr. www. nfsd gcc emacs ls 1/27/09. Process Management. CS 537 Lecture 3: Processes. Example OS in operation. Why Processes? Simplicity + Speed
 Process Management CS 537 Lecture 3: Processes Michael Swift This lecture begins a series of topics on processes, threads, and synchronization Today: processes and process management what are the OS units
Problem Set 1: Unix Commands 1
 Problem Set 1: Unix Commands 1 WARNING: IF YOU DO NOT FIND THIS PROBLEM SET TRIVIAL, I WOULD NOT RECOMMEND YOU TAKE THIS OFFERING OF 300 AS YOU DO NOT POSSESS THE REQUISITE BACKGROUND TO PASS THE COURSE.
OS lpr. www. nfsd gcc emacs ls 9/18/11. Process Management. CS 537 Lecture 4: Processes. The Process. Why Processes? Simplicity + Speed
 Process Management CS 537 Lecture 4: Processes Today: processes and process management what are the OS units of execution? how are they represented inside the OS? how is the CPU scheduled across processes?
12. Debugging. Overview. COMP1917: Computing 1. Developing Programs. The Programming Cycle. Programming cycle. Do-it-yourself debugging
 COMP1917 12s2 Debugging 1 COMP1917: Computing 1 12. Debugging Overview Programming cycle Do-it-yourself debugging Debugging withgdb Nastier bugs Memory leaks COMP1917 12s2 Debugging 2 Developing Programs
Announcements Processes: Part II. Operating Systems. Autumn CS4023
 Operating Systems Autumn 2018-2019 Outline Announcements 1 Announcements 2 Announcements Week04 lab: handin -m cs4023 -p w04 ICT session: Introduction to C programming Outline Announcements 1 Announcements
PROCESSES. Jo, Heeseung
 PROCESSES Jo, Heeseung TODAY'S TOPICS What is the process? How to implement processes? Inter-Process Communication (IPC) 2 WHAT IS THE PROCESS? Program? vs. Process? vs. Processor? 3 PROCESS CONCEPT (1)
Processes. Jo, Heeseung
 Processes Jo, Heeseung Today's Topics What is the process? How to implement processes? Inter-Process Communication (IPC) 2 What Is The Process? Program? vs. Process? vs. Processor? 3 Process Concept (1)
Program Design: Using the Debugger
 rogram Design, February 2, 2004 1 Program Design: Using the Debugger A debugger is an alternative to putting print (printf in C) statements in your program, recompiling and trying to find out what values
Processes. Johan Montelius KTH
 Processes Johan Montelius KTH 2017 1 / 47 A process What is a process?... a computation a program i.e. a sequence of operations a set of data structures a set of registers means to interact with other
A process. the stack
 A process Processes Johan Montelius What is a process?... a computation KTH 2017 a program i.e. a sequence of operations a set of data structures a set of registers means to interact with other processes
CSE 374 Programming Concepts & Tools. Brandon Myers Winter 2015 Lecture 11 gdb and Debugging (Thanks to Hal Perkins)
") CSE 374 Programming Concepts & Tools Brandon Myers Winter 2015 Lecture 11 gdb and Debugging (Thanks to Hal Perkins) Hacker tool of the week (tags) Problem: I want to find the definition of a function or
CSE 374 Programming Concepts & Tools Brandon Myers Winter 2015 Lecture 11 gdb and Debugging (Thanks to Hal Perkins) Hacker tool of the week (tags) Problem: I want to find the definition of a function or
Princeton University COS 217: Introduction to Programming Systems GDB Tutorial and Reference for x86-64 Assembly Language
 Princeton University COS 217: Introduction to Programming Systems GDB Tutorial and Reference for x86-64 Assembly Language Part 1: Tutorial Motivation Suppose you're developing the power.s program. Further
Process Concepts. CSC400 - Operating Systems. 3. Process Concepts. J. Sumey
 CSC400 - Operating Systems 3. Process Concepts J. Sumey Overview Concurrency Processes & Process States Process Accounting Interrupts & Interrupt Processing Interprocess Communication CSC400 - Process
Using the Debugger. Michael Jantz Dr. Prasad Kulkarni
 Using the Debugger Michael Jantz Dr. Prasad Kulkarni 1 Debugger What is it a powerful tool that supports examination of your program during execution. Idea behind debugging programs. Creates additional
www nfsd emacs lpr Process Management CS 537 Lecture 4: Processes Example OS in operation Why Processes? Simplicity + Speed
 Process Management CS 537 Lecture 4: Processes Michael Swift This lecture begins a series of topics on processes, threads, and synchronization Today: processes and process management what are the OS units
TotalView. Debugging Tool Presentation. Josip Jakić
 TotalView Debugging Tool Presentation Josip Jakić josipjakic@ipb.ac.rs Agenda Introduction Getting started with TotalView Primary windows Basic functions Further functions Debugging parallel programs Topics
Recitation: Cache Lab & C
 15-213 Recitation: Cache Lab & C Jack Biggs 16 Feb 2015 Agenda Buffer Lab! C Exercises! C Conventions! C Debugging! Version Control! Compilation! Buffer Lab... Is due soon. So maybe do it soon Agenda Buffer
ECE 471 Embedded Systems Lecture 4
 ECE 471 Embedded Systems Lecture 4 Vince Weaver http://www.eece.maine.edu/ vweaver vincent.weaver@maine.edu 12 September 2013 Announcements HW#1 will be posted later today For next class, at least skim
Debugging. John Lockman Texas Advanced Computing Center
 Debugging John Lockman Texas Advanced Computing Center Debugging Outline GDB Basic use Attaching to a running job DDT Identify MPI problems using Message Queues Catch memory errors PTP For the extremely
Project #1: Tracing, System Calls, and Processes
 Project #1: Tracing, System Calls, and Processes Objectives In this project, you will learn about system calls, process control and several different techniques for tracing and instrumenting process behaviors.
ALD Assembly Language Debugger Copyright (C) Patrick Alken
 Patrick Alken") ALD Assembly Language Debugger 0.1.7 Copyright (C) 2000-2004 Patrick Alken To run type ald help Commands may be abbreviated. If a blank command is entered, the last command is repeated. Type `help '
ALD Assembly Language Debugger 0.1.7 Copyright (C) 2000-2004 Patrick Alken To run type ald help Commands may be abbreviated. If a blank command is entered, the last command is repeated. Type `help '
Lecture 07 Debugging Programs with GDB
 Lecture 07 Debugging Programs with GDB In this lecture What is debugging Most Common Type of errors Process of debugging Examples Further readings Exercises What is Debugging Debugging is the process of
Windows architecture. user. mode. Env. subsystems. Executive. Device drivers Kernel. kernel. mode HAL. Hardware. Process B. Process C.
 Structure Unix architecture users Functions of the System tools (shell, editors, compilers, ) standard library System call Standard library (printf, fork, ) OS kernel: processes, memory management, file
Reviewing gcc, make, gdb, and Linux Editors 1
 Reviewing gcc, make, gdb, and Linux Editors 1 Colin Gordon csgordon@cs.washington.edu University of Washington CSE333 Section 1, 3/31/11 1 Lots of material borrowed from 351/303 slides Colin Gordon (University
CS2: Debugging in Java
 CS2: Debugging in Java 1. General Advice Jon Cook (LFCS) April 2003 Debugging is not always easy. Some bugs can take a long time to find. Debugging concurrent code can be particularly difficult and time
bash, part 3 Chris GauthierDickey
 bash, part 3 Chris GauthierDickey More redirection As you know, by default we have 3 standard streams: input, output, error How do we redirect more than one stream? This requires an introduction to file
GDB Tutorial. Young W. Lim Thr. Young W. Lim GDB Tutorial Thr 1 / 24
 GDB Tutorial Young W. Lim 2016-09-29 Thr Young W. Lim GDB Tutorial 2016-09-29 Thr 1 / 24 Outline 1 Introduction Young W. Lim GDB Tutorial 2016-09-29 Thr 2 / 24 Based on "Self-service Linux: Mastering the
Unix Processes. What is a Process?
 Unix Processes Process -- program in execution shell spawns a process for each command and terminates it when the command completes Many processes all multiplexed to a single processor (or a small number
CSE 374 Programming Concepts & Tools
 CSE 374 Programming Concepts & Tools Hal Perkins Fall 2017 Lecture 11 gdb and Debugging 1 Administrivia HW4 out now, due next Thursday, Oct. 26, 11 pm: C code and libraries. Some tools: gdb (debugger)
Using gdb to find the point of failure
 gdb gdb is the GNU debugger on our CS machines. gdb is most effective when it is debugging a program that has debugging symbols linked in to it. With gcc and g++, this is accomplished using the -g option,
GDB Tutorial. Young W. Lim Tue. Young W. Lim GDB Tutorial Tue 1 / 32
 GDB Tutorial Young W. Lim 2017-02-14 Tue Young W. Lim GDB Tutorial 2017-02-14 Tue 1 / 32 Outline 1 Introduction Young W. Lim GDB Tutorial 2017-02-14 Tue 2 / 32 Based on "Self-service Linux: Mastering the
Design Overview of the FreeBSD Kernel CIS 657
 Design Overview of the FreeBSD Kernel CIS 657 Organization of the Kernel Machine-independent 86% of the kernel (80% in 4.4BSD) C code Machine-dependent 14% of kernel Only 0.6% of kernel in assembler (2%
Section 2: Processes
 September 7, 2016 Contents 1 Warmup 2 1.1 Hello World............................................ 2 2 Vocabulary 2 3 Problems 3 3.1 Forks................................................ 3 3.2 Stack Allocation.........................................
Review of Fundamentals
 Review of Fundamentals 1 The shell vi General shell review 2 http://teaching.idallen.com/cst8207/14f/notes/120_shell_basics.html The shell is a program that is executed for us automatically when we log
Design Overview of the FreeBSD Kernel. Organization of the Kernel. What Code is Machine Independent?
 Design Overview of the FreeBSD Kernel CIS 657 Organization of the Kernel Machine-independent 86% of the kernel (80% in 4.4BSD) C C code Machine-dependent 14% of kernel Only 0.6% of kernel in assembler
Debugging with GDB and DDT
 Debugging with GDB and DDT Ramses van Zon SciNet HPC Consortium University of Toronto June 28, 2012 1/41 Ontario HPC Summerschool 2012 Central Edition: Toronto Outline Debugging Basics Debugging with the
PROCESS CONTROL BLOCK TWO-STATE MODEL (CONT D)
") MANAGEMENT OF APPLICATION EXECUTION PROCESS CONTROL BLOCK Resources (processor, I/O devices, etc.) are made available to multiple applications The processor in particular is switched among multiple applications
MANAGEMENT OF APPLICATION EXECUTION PROCESS CONTROL BLOCK Resources (processor, I/O devices, etc.) are made available to multiple applications The processor in particular is switched among multiple applications
CPSC 341 OS & Networks. Processes. Dr. Yingwu Zhu
 CPSC 341 OS & Networks Processes Dr. Yingwu Zhu Process Concept Process a program in execution What is not a process? -- program on a disk A process is an active object, but a program is just a file It
Operating System Structure
 Operating System Structure CSCI 4061 Introduction to Operating Systems Applications Instructor: Abhishek Chandra Operating System Hardware 2 Questions Operating System Structure How does the OS manage
CNIT 127: Exploit Development. Ch 3: Shellcode. Updated
 CNIT 127: Exploit Development Ch 3: Shellcode Updated 1-30-17 Topics Protection rings Syscalls Shellcode nasm Assembler ld GNU Linker objdump to see contents of object files strace System Call Tracer Removing
SOFTWARE ARCHITECTURE 3. SHELL
 1 SOFTWARE ARCHITECTURE 3. SHELL Tatsuya Hagino hagino@sfc.keio.ac.jp slides URL https://vu5.sfc.keio.ac.jp/sa/login.php 2 Software Layer Application Shell Library MIddleware Shell Operating System Hardware
Signals: Management and Implementation. Sanjiv K. Bhatia Univ. of Missouri St. Louis
 Signals: Management and Implementation Sanjiv K. Bhatia Univ. of Missouri St. Louis sanjiv@aryabhat.umsl.edu http://www.cs.umsl.edu/~sanjiv Signals Mechanism to notify processes of asynchronous events
GDB Tutorial. Young W. Lim Fri. Young W. Lim GDB Tutorial Fri 1 / 24
 GDB Tutorial Young W. Lim 2016-02-19 Fri Young W. Lim GDB Tutorial 2016-02-19 Fri 1 / 24 Outline 1 Introduction Young W. Lim GDB Tutorial 2016-02-19 Fri 2 / 24 Based on Self-service Linux: Mastering the
Reading Assignment 4. n Chapter 4 Threads, due 2/7. 1/31/13 CSE325 - Processes 1
 Reading Assignment 4 Chapter 4 Threads, due 2/7 1/31/13 CSE325 - Processes 1 What s Next? 1. Process Concept 2. Process Manager Responsibilities 3. Operations on Processes 4. Process Scheduling 5. Cooperating
PROCESS CONTROL: PROCESS CREATION: UNIT-VI PROCESS CONTROL III-II R
 PROCESS CONTROL: This will describe the use and implementation of the system calls that control the process context. The fork system call creates a new process, the exit call terminates process execution,
ECE 598 Advanced Operating Systems Lecture 10
 ECE 598 Advanced Operating Systems Lecture 10 Vince Weaver http://web.eece.maine.edu/~vweaver vincent.weaver@maine.edu 22 February 2018 Announcements Homework #5 will be posted 1 Blocking vs Nonblocking
Tcl/Tk lecture. What is the Wish Interpreter? CIS 410/510 User Interface Programming
 Tcl/Tk lecture CIS 410/510 User Interface Programming Tool Command Language TCL Scripting language for developing & using GUIs Allows generic programming variables, loops, procedures Embeddable into an
Processes. Operating System CS 217. Supports virtual machines. Provides services: User Process. User Process. OS Kernel. Hardware
 es CS 217 Operating System Supports virtual machines Promises each process the illusion of having whole machine to itself Provides services: Protection Scheduling Memory management File systems Synchronization
628 Lecture Notes Week 4
 628 Lecture Notes Week 4 (February 3, 2016) 1/8 628 Lecture Notes Week 4 1 Topics I/O Redirection Notes on Lab 4 Introduction to Threads Review Memory spaces #include #include int
LAB #8. GDB can do four main kinds of things (plus other things in support of these) to help you catch bugs in the act:
 to help you catch bugs in the act:") LAB #8 Each lab will begin with a brief demonstration by the TAs for the core concepts examined in this lab. As such, this document will not serve to tell you everything the TAs will in the demo. It is
LAB #8 Each lab will begin with a brief demonstration by the TAs for the core concepts examined in this lab. As such, this document will not serve to tell you everything the TAs will in the demo. It is
Debugging with GDB and DDT
 Debugging with GDB and DDT Ramses van Zon SciNet HPC Consortium University of Toronto June 13, 2014 1/41 Ontario HPC Summerschool 2014 Central Edition: Toronto Outline Debugging Basics Debugging with the
Most of the work is done in the context of the process rather than handled separately by the kernel
 Process Control Process Abstraction for a running program Manages program s use of memory, cpu time, and i/o resources Most of the work is done in the context of the process rather than handled separately
ECS 153 Discussion Section. April 6, 2015
 ECS 153 Discussion Section April 6, 2015 1 What We ll Cover Goal: To discuss buffer overflows in detail Stack- based buffer overflows Smashing the stack : execution from the stack ARC (or return- to- libc)
Source level debugging. October 18, 2016
 Source level debugging October 18, 2016 Source level debugging Source debugging is a nice tool for debugging execution problems; it can be particularly useful when working with crashed programs that leave
Migrating from Inspect to Native Inspect
 Revised for H06.08 Seth Hawthorne NonStop Enterprise Division Hewlett-Packard Company Introduction Native Inspect is the standard command-line debugger for debugging natively compiled programs on HP Integrity
PROCESS MANAGEMENT. Operating Systems 2015 Spring by Euiseong Seo
 PROCESS MANAGEMENT Operating Systems 2015 Spring by Euiseong Seo Today s Topics Process Concept Process Scheduling Operations on Processes Interprocess Communication Examples of IPC Systems Communication
Introduction to debugging. Martin Čuma Center for High Performance Computing University of Utah
 Introduction to debugging Martin Čuma Center for High Performance Computing University of Utah m.cuma@utah.edu Overview Program errors Simple debugging Graphical debugging DDT and Totalview Intel tools
Process a program in execution; process execution must progress in sequential fashion. Operating Systems
 Process Concept An operating system executes a variety of programs: Batch system jobs Time-shared systems user programs or tasks 1 Textbook uses the terms job and process almost interchangeably Process
Shell Execution of Programs. Process Groups, Session and Signals 1
 Shell Execution of Programs Process Groups, Session and Signals 1 Signal Concepts Signals are a way for a process to be notified of asynchronous events (software interrupts). Some examples: a timer you
CSci 4061 Introduction to Operating Systems. Programs in C/Unix
 CSci 4061 Introduction to Operating Systems Programs in C/Unix Today Basic C programming Follow on to recitation Structure of a C program A C program consists of a collection of C functions, structs, arrays,
Systems/DBG Debugger Version 2.20
 Systems/DBG Debugger Version 2.20 Copyright c 2018, Dignus, LLC Systems/DBG Debugger Version 2.20 i Copyright c 2018 Dignus LLC, 8378 Six Forks Road Suite 203, Raleigh NC, 27615. World rights reserved.
CSE 351. GDB Introduction
 CSE 351 GDB Introduction Lab 2 Out either tonight or tomorrow Due April 27 th (you have ~12 days) Reading and understanding x86_64 assembly Debugging and disassembling programs Today: General debugging
Processes and Exceptions
 Princeton University Computer Science 217: Introduction to Programming Systems Processes and Exceptions Much of the material for this lecture is drawn from Computer Systems: A Programmer s Perspective
Lecture Topics. Announcements. Today: Threads (Stallings, chapter , 4.6) Next: Concurrency (Stallings, chapter , 5.
 Next: Concurrency (Stallings, chapter , 5.") Lecture Topics Today: Threads (Stallings, chapter 4.1-4.3, 4.6) Next: Concurrency (Stallings, chapter 5.1-5.4, 5.7) 1 Announcements Make tutorial Self-Study Exercise #4 Project #2 (due 9/20) Project #3
Lecture Topics Today: Threads (Stallings, chapter 4.1-4.3, 4.6) Next: Concurrency (Stallings, chapter 5.1-5.4, 5.7) 1 Announcements Make tutorial Self-Study Exercise #4 Project #2 (due 9/20) Project #3
Language Translation. Compilation vs. interpretation. Compilation diagram. Step 1: compile. Step 2: run. compiler. Compiled program. program.
 Language Translation Compilation vs. interpretation Compilation diagram Step 1: compile program compiler Compiled program Step 2: run input Compiled program output Language Translation compilation is translation
GDB-UPC for GCC-UPC SMP runtime. GDB-UPC features. GDB features. Multiprocessing support in GDB. GDB UPC for SMP runtime Intrepid Technology, Inc.
 GDB-UPC for GCC-UPC SMP runtime Author: Nenad Vukicevic nenad@intrepid.com The goal of the GDB-UPC project is to enable debugging of programs that use GCC-UPC s SMP based runtime running on a single computing
Memory Leak Detection in Embedded Systems
 Memory Leak Detection in Embedded Systems Cal discusses mtrace, dmalloc and memwatch--three easy-to-use tools that find common memory handling errors. by Cal Erickson One of the problems with developing
CSCI0330 Intro Computer Systems Doeppner. Project Shell 2. Due: November 8, 2017 at 11:59pm. 1 Introduction 2
 CSCI0330 Intro Computer Systems Doeppner Project Shell 2 Due: November 8, 2017 at 11:59pm 1 Introduction 2 2 Assignment 2 2.1 Stencil 2 2.2 Jobs vs. Processes 2 2.3 Foreground vs. Background 3 2.4 Specification
ECE 550D Fundamentals of Computer Systems and Engineering. Fall 2017
 ECE 550D Fundamentals of Computer Systems and Engineering Fall 2017 The Operating System (OS) Prof. John Board Duke University Slides are derived from work by Profs. Tyler Bletsch and Andrew Hilton (Duke)
dbx90: Fortran debugger March 9, 2009
 dbx90: Fortran debugger March 9, 2009 1 Name dbx90 a Fortran 90/95 debugger for use with the NAG Fortran compiler. 2 Usage dbx90 [option]... executable-file 3 Description dbx90 is a Fortran 90/95 debugger
NYU SCPS X Section 1 Unix Tools. Fall 2004 Handout 5
 Fall 2004 Handout 5 Time a program: pp. 69, 92 1 /* This program is looper.c. It takes a long time to do nothing. */ 2 #include 3 #include 4 5 void f(void); 6 void g(void); 7 8 int
Exceptions and Processes
 Exceptions and Processes Much of the material for this lecture is drawn from Computer Systems: A Programmer s Perspective (Bryant & O Hallaron) Chapter 8 1 Goals of this Lecture Help you learn about: Exceptions
Operating Systems CMPSC 473. Process Management January 29, Lecture 4 Instructor: Trent Jaeger
 Operating Systems CMPSC 473 Process Management January 29, 2008 - Lecture 4 Instructor: Trent Jaeger Last class: Operating system structure and basics Today: Process Management Why Processes? We have programs,
(MCQZ-CS604 Operating Systems)
") command to resume the execution of a suspended job in the foreground fg (Page 68) bg jobs kill commands in Linux is used to copy file is cp (Page 30) mv mkdir The process id returned to the child process
command to resume the execution of a suspended job in the foreground fg (Page 68) bg jobs kill commands in Linux is used to copy file is cp (Page 30) mv mkdir The process id returned to the child process
Creating a Shell or Command Interperter Program CSCI411 Lab
 Creating a Shell or Command Interperter Program CSCI411 Lab Adapted from Linux Kernel Projects by Gary Nutt and Operating Systems by Tannenbaum Exercise Goal: You will learn how to write a LINUX shell
21. This is a screenshot of the Android Studio Debugger. It shows the current thread and the object tree for a certain variable.
 4. Logging is an important part of debugging, which is hard to achieve on mobile devices, where application development and execution take place on different systems. Android includes a framework that
Process. Heechul Yun. Disclaimer: some slides are adopted from the book authors slides with permission 1
 Process Heechul Yun Disclaimer: some slides are adopted from the book authors slides with permission 1 Recap OS services Resource (CPU, memory) allocation, filesystem, communication, protection, security,
Quiz Start Time: 09:34 PM Time Left 82 sec(s)
") Quiz Start Time: 09:34 PM Time Left 82 sec(s) Question # 1 of 10 ( Start time: 09:34:54 PM ) Total Marks: 1 While developing a program; should we think about the user interface? //handouts main reusability
Quiz Start Time: 09:34 PM Time Left 82 sec(s) Question # 1 of 10 ( Start time: 09:34:54 PM ) Total Marks: 1 While developing a program; should we think about the user interface? //handouts main reusability
Packaging Tools for OpenServer & UnixWare. Ron Record John Wolfe
 Packaging Tools for OpenServer & UnixWare Ron Record John Wolfe rr@sco.com jlw@sco.com 1 Why Package? Single software administration tool Ease of installation, update, and removal Support for multiply
Project 2: User Programs
 Project 2: User Programs CS140 - Winter 2010 Slides by Andrew He, adapted from previous CS140 offerings Overview Project 2 is due Thursday, February 4 This project requires an understanding of: How user
CS201 Latest Solved MCQs
 Quiz Start Time: 09:34 PM Time Left 82 sec(s) Question # 1 of 10 ( Start time: 09:34:54 PM ) Total Marks: 1 While developing a program; should we think about the user interface? //handouts main reusability
ECE 498 Linux Assembly Language Lecture 1
 ECE 498 Linux Assembly Language Lecture 1 Vince Weaver http://www.eece.maine.edu/ vweaver vincent.weaver@maine.edu 13 November 2012 Assembly Language: What s it good for? Understanding at a low-level what
Shell Programming (ch 10)
") Vim Commands vim filename Shell Programming (ch 10) IT244 - Introduction to Linux / Unix Instructor: Bo Sheng Add contents: i/a Back to command mode: ESC Save the file: :w Delete: x Quit: :q 1 2 The order
Vim Commands vim filename Shell Programming (ch 10) IT244 - Introduction to Linux / Unix Instructor: Bo Sheng Add contents: i/a Back to command mode: ESC Save the file: :w Delete: x Quit: :q 1 2 The order
IMPLEMENTATION OF SIGNAL HANDLING. CS124 Operating Systems Fall , Lecture 15
 IMPLEMENTATION OF SIGNAL HANDLING CS124 Operating Systems Fall 2017-2018, Lecture 15 2 Signal Handling UNIX operating systems allow es to register for and handle signals Provides exceptional control flow
Lecture 03 Bits, Bytes and Data Types
 Lecture 03 Bits, Bytes and Data Types Computer Languages A computer language is a language that is used to communicate with a machine. Like all languages, computer languages have syntax (form) and semantics
Exercise Session 6 Computer Architecture and Systems Programming
 Systems Group Department of Computer Science ETH Zürich Exercise Session 6 Computer Architecture and Systems Programming Herbstsemester 2016 Agenda GDB Outlook on assignment 6 GDB The GNU Debugger 3 Debugging..
Recitation: Bomb Lab. September 17 th 2018
 15-213 Recitation: Bomb Lab September 17 th 2018 Agenda Logistics - Bomb Lab Overview - Introduction to GDB - GDB and Assembly Tips What is Bomb Lab? An exercise in reading x86-64 assembly code. A chance
UNIX Shell Programming
 $!... 5:13 $$ and $!... 5:13.profile File... 7:4 /etc/bashrc... 10:13 /etc/profile... 10:12 /etc/profile File... 7:5 ~/.bash_login... 10:15 ~/.bash_logout... 10:18 ~/.bash_profile... 10:14 ~/.bashrc...
Review of Fundamentals. Todd Kelley CST8207 Todd Kelley 1
 Review of Fundamentals Todd Kelley kelleyt@algonquincollege.com CST8207 Todd Kelley 1 GPL the shell SSH (secure shell) the Course Linux Server RTFM vi general shell review 2 These notes are available on
User Programs. Computer Systems Laboratory Sungkyunkwan University
 Project 2: User Programs Jin-Soo Kim (jinsookim@skku.edu) Computer Systems Laboratory Sungkyunkwan University http://csl.skku.edu Supporting User Programs What should be done to run user programs? 1. Provide
System Assertions. Andreas Zeller
 System Assertions Andreas Zeller System Invariants Some properties of a program must hold over the entire run: must not access data of other processes must handle mathematical exceptions must not exceed