You will learn: The structure of the Stata interface How to open files in Stata How to modify variable and value labels How to manipulate variables
|
|
|
- Marjory Underwood
- 5 years ago
- Views:
Transcription

1 Jennie Murack
2 You will learn: The structure of the Stata interface How to open files in Stata How to modify variable and value labels How to manipulate variables How to conduct basic descriptive statistics Resources to use for future help
3
4 Stata can be accessed on any Athena machine. Some departments may have licenses for windows machines. By default, Stata looks for data in your Home directory. To change to another folder in that directory, you only need to type the folder name, not the full pathname. Ex. cd data vs. cd c://murack/home/data The Stata toolbar menu displays at the top of the Athena window, not at the top of the Stata window. Sometimes the Data drop down list does not appear. Close Stata and open it again to fix this.
5 Results Command Review Variable Do-file (must be opened separately)

6
 You can open more than one at once.")
7 Do files let you save commands for future use or sharing. Commands can be run from the do-file. Open a do-file using the dropdown menu or the icon ( ) You can open more than one at once. Make sure you save all your final/correct commands in the do-file for future reference.
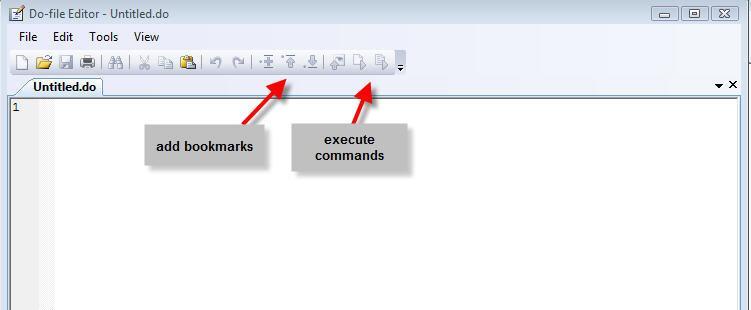
8 Do-file

9 Stata can copy everything that is sent to the Results window into a Log File. Start a log file using: File > Log > Begin.smcl file type will only open in Stata, select.log, which is a simple text file Records commands and output Does not include graphic output (such as histograms) The command proceeds each result.

10 File>Log>View to see.log file. You can hit the refresh button if you run more commands. File>log>Suspend/Resume to pause if you are testing out a command
11
12 All commands are lower case. Press enter to execute a command. Use the Search or Help commands to learn more. Procedures can be conducted using the windows or by entering a command. Use the windows if you are unsure of a command and then copy the command for future use.


13
14 Command variable(s), options Example: summarize sex marriage, detail If you don t specify a variable, Stata will often perform the command on the entire dataset. You can find command-specific syntax in the help files (help commandname)
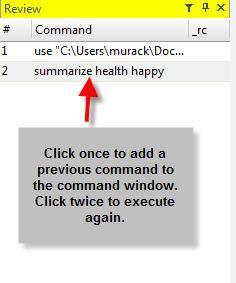
15 Use the Page Up button to recall the last command you wrote in the command window. A limited amount of data will be displayed in the results window. You can press any key in the command window to make the data scroll down.

16
17 Set your working directory (File > Change working directory or Command: cd directory path ) The working directory is where Stata will look for a file or save a file unless you specify the full path to a different directory.
18 To retrieve your data file: File > Open Command: use datasetname.dta Saving your data file: File > Save Command: save newdatasetname.dta This command should be followed by, replace if you are writing over an existing file: Example: save censusdata.dta, replace

19 Datasets in a variety of formats can be imported. Use,clear after a command when importing/ opening data.

20 File > Import > Text data (delimited, *.csv, ) Command: import delimited filename.csv, clear SAS transport files File > Import > SAS XPORT Command: import sasxport filename.xpt
21 SPSS/PASW will allow you to save your data as a Stata file Go to: File > Save as > Stata (use the most recent version available) Then you can open it in Stata. Can also use the program StatTransfer

 firstrow clear After you paste, you")
22 Can use File > Import> Excel spreadsheet or copy and paste your excel file directly into the data editor Command: import excel filename.xlsx, sheet( sheetname") firstrow clear After you paste, you will see this prompt: Select Treat first row as variable names


23 Command for exporting to.csv: export delimited using newfilename.csv, replace
24
25 Describe what the file does at the top Add commands for the following: opening a log file opening data Specify the entire directory if the file is not in the working directory. saving data under a new name (if making changes to the dataset)
26 /*DESCRIPTION OF FILE*/ cd ~/StataIntro log using logname (specify.log if you are not using.smcl) use datasetname.dta, clear save newdata.dta
27 * at the beginning of a line marks a text comment, you can also use /* and */ before and after. Use,clear after opening a dataset to clear old data. Enter denotes commands. /// at the end of a line tells Stata that the next line is a continuation of the previous one. Use the copy button from dialog boxes to get commands. Remember to save the do-file. You can highlight/copy/paste into Word, but you may need to do some formatting.

28
29 Keep all your files and your do-file in the same directory. They will be easy to locate and you only need to change the Stata working directory once. Give files names that make sense to you. You might want to include dates, locations, etc. Copy all commands into a do-file. Write text comments in your do-file that will help you or a colleague understand the data in the future. These might includes things such as where the data came from, why you ran a certain procedure, etc.

30
31 Data Editor Commands such as: List Describe Codebook
32 To open the data editor: Data>Data Editor> Data Editor (edit) Command: edit To look at data, but not change it: Data > Data Editor > Data editor (browse) Command: browse Or use icons:


33
34 Data > Describe data > List data Command: list variable Lists all responses for a specified variable. For long data files, you should specify a subset of ids to list: example: list sex if id in 1/50
35 Data > Describe data > Describe data in memory or in a file Command: describe Describe lists the variable names, value labels, and variable labels.


36 Data > Describe data > Describe data contents (codebook) Command: codebook variable1 All variables will be displayed if you do not specify some. Examines the variable names, labels, and data (range, frequency, missing values).
37
38 Variable Labels are the names of each variable. Value labels are the labels that you assign the values of each variable. Example: 1 = Poor, 2 = Fair, 3 = Good, etc. You can access these using the Variables Manager ( ).

39 Variable Labels Type in a variable label or use these commands: Command: rename variablename newvariablename Example: rename v1 marital Command: label variable variablename newvariablelabel Example: label variable var2 income


40 Click on Manage next to Value labels and the Manage Value Labels box appears. To create a new label, click Create label Enter a label name, a value, and a label for that value. Command: label define sex 0 "Female" 1 "Male"

41 Value Labels -Your new value label will appear in the Manage Value Labels window. -After you close the window, you can choose the value label from the drop down box in the variable manager. Command: label values var1 sex
42
43 Code missing variables: Up to 27 missing values for each variable, represented as letters Data>Create or change data>other variable transformation commands>change numeric values to missing Command: Mvdecode _all, mv (-5=.a\-4=.b)
44 Duplicating variables: o o o o Keeps missing values coded the same way as in the old variable. Keeps the same value labels Data > Create or change data > Other variable-creation commands > Clone existing variable Command: clonevar newname = oldname Generate: Does not transfer value labels, but does transfer codes for missing variables. Can use basic arithmetic with this command Data>Create or change data>create new variable Command: generate newvar =exp [if] [in] Use generate newvariable =. to create a new, blank column.


45 Command: generate newvar =exp [if] [in]
46 Recode changes the values of numeric variables according to the rules specified. Data> Create or change data> Other variable-transformation commands> Recode categorical variable Command: recode varlist (rule) [(rule)...] [, generate(newvar)]
 (1=3) Enter new names in the")

47 Choose variables and enter recode numbers in parentheses (0=4) (1=3) Enter new names in the options tab, separated by a space. You can add r to the new names to remember they are reverse coded.

48 Used to replace the contents of an existing variable. Useful for creating new categories from numeric variables or performing calculations to create new variables. Make sure to duplicate your data to a new column first or create a new, blank column, so you don t overwrite data. Data > Create or change data > Change contents of variable Command: replace highincome = 1 if inc>15 & inc<26
49 In the variable manager, select variable(s) to drop or keep and right click. Command: drop variable or keep variable Drop if or keep if to select certain records: Data > Create or change data > Drop or keep observations Command: drop if exp or keep if exp Examples: drop if age < 12, drop if age > 17 & gender == 1 o == means is
50 == is / means to example: keep in 1/500! = or ~= is not or is not equal to > is greater than >= is greater than or equal to < is less than <= is less than or equal to
51
52 Describe List Codebook Summarize Tabulate
53 Statistics > Summaries, tables and tests > Summary and descriptive Statistics > Summary statistics Command: summarize variable1 variable2 Add,details at the end of the command to see more summary statistics, including the median (displayed at 50 th %) If you do not specify variables, it will summarize all. It includes the number of observations, mean, standard deviation, minimum, and maximum.

54 Creates a basic table of descriptive statistics for each variable. Most useful for categorical variables. Statistics > Summaries, tables and tests > Frequency tables > One-way table Command: tabulate variable1
55 Produces a table for each variable listed. Statistics > Summaries, tables and tests > Frequency tables > Multiple oneway tables Command: tab1 variable1 variable2
56 Tabulate followed by two variables produces a 2-way table of frequency counts for the combinations of values of those variables. Statistics > Summaries, tables and tests > Frequency tables > Two-way table with measures of association Command: tabulate variable1 variable2
57 Tab2 takes a list of variable names and issues the tabulate command separately for each possible pair of variable names. Statistics > Summaries, tables and tests > Frequency tables > All possible two-way tables Command: tab2 variable1 variable2 variable3


58 Tabstat allows you to make customized tables with more statistics. Statistics > Summaries, tables and tests > Other tables > Compact table of summary statistics

59

60 Use the graphs menu to make various charts


61 Graphics > Histogram Command: histogram variable, options Choose your variable of interest Select whether they are discrete or continuous Select Bar properties to edit the color, outline, bar width and bar gap.


62 -Use the By tab to select a grouping variable. -Use the Y axis and X axis tabs -To add normal curve, check add normal-density plot under density plots tab -Use the Y axis and X axis tabs to add titles, alter the scale, and value labels.
 xlabel(, valuelabel)")
63 Command: histogram marital, discrete xtitle(marrital Status) xlabel(, valuelabel) (start=1, width=1)


64 Right click on graph to start the graph editor Use Plot region to change individual colors, explode, etc Click on the T on left side to add text You can start the graph recorder. Name the recording. Run it with different data and the same changes will be made to future graphs.


65 Graphics > Pie Chart Command: graph pie, over(marital)


66 Graphics > Box plot Command: graph box variable
 Type db to bring up a window to see the available")
67 libguides.mit.edu/stat Help commands in Stata: Help command (help summarize) Type db to bring up a window to see the available options for a command (db summarize) Search command (search regression) Help > Search Help > PDF Documentation
Introduction to STATA
 Introduction to STATA Duah Dwomoh, MPhil School of Public Health, University of Ghana, Accra July 2016 International Workshop on Impact Evaluation of Population, Health and Nutrition Programs Learning
Stata: A Brief Introduction Biostatistics
 Stata: A Brief Introduction Biostatistics 140.621 2005-2006 1. Statistical Packages There are many statistical packages (Stata, SPSS, SAS, Splus, etc.) Statistical packages can be used for Analysis Data
STATA 13 INTRODUCTION
 STATA 13 INTRODUCTION Catherine McGowan & Elaine Williamson LONDON SCHOOL OF HYGIENE & TROPICAL MEDICINE DECEMBER 2013 0 CONTENTS INTRODUCTION... 1 Versions of STATA... 1 OPENING STATA... 1 THE STATA
An Introduction to Stata Part I: Data Management
 An Introduction to Stata Part I: Data Management Kerry L. Papps 1. Overview These two classes aim to give you the necessary skills to get started using Stata for empirical research. The first class will
Revision of Stata basics in STATA 11:
 Revision of Stata basics in STATA 11: April, 2016 Dr. Selim Raihan Executive Director, SANEM Professor, Department of Economics, University of Dhaka Contents a) Resources b) Stata 11 Interface c) Datasets
Opening a Data File in SPSS. Defining Variables in SPSS
 Opening a Data File in SPSS To open an existing SPSS file: 1. Click File Open Data. Go to the appropriate directory and find the name of the appropriate file. SPSS defaults to opening SPSS data files with
An Introduction to Stata Exercise 1
 An Introduction to Stata Exercise 1 Anna Folke Larsen, September 2016 1 Table of Contents 1 Introduction... 1 2 Initial options... 3 3 Reading a data set from a spreadsheet... 5 4 Descriptive statistics...
Getting started with Stata 2017: Cheat-sheet
 Getting started with Stata 2017: Cheat-sheet 4. september 2017 1 Get started Graphical user interface (GUI). Clickable. Simple. Commands. Allows for use of do-le. Easy to keep track. Command window: Write
1. Basic Steps for Data Analysis Data Editor. 2.4.To create a new SPSS file
 1 SPSS Guide 2009 Content 1. Basic Steps for Data Analysis. 3 2. Data Editor. 2.4.To create a new SPSS file 3 4 3. Data Analysis/ Frequencies. 5 4. Recoding the variable into classes.. 5 5. Data Analysis/
Econ Stata Tutorial I: Reading, Organizing and Describing Data. Sanjaya DeSilva
 Econ 329 - Stata Tutorial I: Reading, Organizing and Describing Data Sanjaya DeSilva September 8, 2008 1 Basics When you open Stata, you will see four windows. 1. The Results window list all the commands
A Short Guide to Stata 10 for Windows
 A Short Guide to Stata 10 for Windows 1. Introduction 2 2. The Stata Environment 2 3. Where to get help 2 4. Opening and Saving Data 3 5. Importing Data 4 6. Data Manipulation 5 7. Descriptive Statistics
For many people, learning any new computer software can be an anxietyproducing
 1 Getting to Know Stata 12 For many people, learning any new computer software can be an anxietyproducing task. When that computer program involves statistics, the stress level generally increases exponentially.
Department of Economics Spring 2018 University of California Economics 154 Professor Martha Olney Stata Lesson Thursday February 15, 2018
 University of California Economics 154 Berkeley Professor Martha Olney Stata Lesson Thursday February 15, 2018 [1] Where to find the data sets http://www.econ.berkeley.edu/~olney/spring18/econ154 There
2. create the workbook file
 2. create the workbook file Excel documents are called workbook files. A workbook can include multiple sheets of information. Excel supports two kinds of sheets for working with data: Worksheets, which
Department of Economics Spring 2016 University of California Economics 154 Professor Martha Olney Stata Lesson Wednesday February 17, 2016
 University of Califnia Economics 154 Berkeley Profess Martha Olney Stata Lesson Wednesday February 17, 2016 [1] Where to find the data sets http://www.econ.berkeley.edu/~olney/spring16/econ154 There are
A Quick Guide to Stata 8 for Windows
 Université de Lausanne, HEC Applied Econometrics II Kurt Schmidheiny October 22, 2003 A Quick Guide to Stata 8 for Windows 2 1 Introduction A Quick Guide to Stata 8 for Windows This guide introduces the
Creating a data file and entering data
 4 Creating a data file and entering data There are a number of stages in the process of setting up a data file and analysing the data. The flow chart shown on the next page outlines the main steps that
Introduction to Stata. Written by Yi-Chi Chen
 Introduction to Stata Written by Yi-Chi Chen Center for Social Science Computation & Research 145 Savery Hall University of Washington Seattle, WA 98195 U.S.A (206)543-8110 September 2002 http://julius.csscr.washington.edu/pdf/stata.pdf
Introduction to Stata Toy Program #1 Basic Descriptives
 Introduction to Stata 2018-19 Toy Program #1 Basic Descriptives Summary The goal of this toy program is to get you in and out of a Stata session and, along the way, produce some descriptive statistics.
INTRODUCTORY SPSS. Dr Feroz Mahomed Swalaha x2689
 INTRODUCTORY SPSS Dr Feroz Mahomed Swalaha fswalaha@dut.ac.za x2689 1 Statistics (the systematic collection and display of numerical data) is the most abused area of numeracy. 97% of statistics are made
Stata v 12 Illustration. First Session
 Launch Stata PC Users Stata v 12 Illustration Mac Users START > ALL PROGRAMS > Stata; or Double click on the Stata icon on your desktop APPLICATIONS > STATA folder > Stata; or Double click on the Stata
Stata version 13. First Session. January I- Launching and Exiting Stata Launching Stata Exiting Stata..
 Stata version 13 January 2015 I- Launching and Exiting Stata... 1. Launching Stata... 2. Exiting Stata.. II - Toolbar, Menu bar and Windows.. 1. Toolbar Key.. 2. Menu bar Key..... 3. Windows..... III -...
International Graduate School of Genetic and Molecular Epidemiology (GAME) Computing Notes and Introduction to Stata
 Computing Notes and Introduction to Stata") International Graduate School of Genetic and Molecular Epidemiology (GAME) Computing Notes and Introduction to Stata Paul Dickman September 2003 1 A brief introduction to Stata Starting the Stata program
International Graduate School of Genetic and Molecular Epidemiology (GAME) Computing Notes and Introduction to Stata Paul Dickman September 2003 1 A brief introduction to Stata Starting the Stata program
I Launching and Exiting Stata. Stata will ask you if you would like to check for updates. Update now or later, your choice.
 I Launching and Exiting Stata 1. Launching Stata Stata can be launched in either of two ways: 1) in the stata program, click on the stata application; or 2) double click on the short cut that you have
Introduction to Stata
 Introduction to Stata Introduction In introductory biostatistics courses, you will use the Stata software to apply statistical concepts and practice analyses. Most of the commands you will need are available
Dr Wan Nor Arifin Unit of Biostatistics and Research Methodology, Universiti Sains Malaysia.
 Introduction to SPSS Dr Wan Nor Arifin Unit of Biostatistics and Research Methodology, Universiti Sains Malaysia. wnarifin@usm.my Outlines Introduction Data Editor Data View Variable View Menus Shortcut
Introduction to Stata: An In-class Tutorial
 Introduction to Stata: An I. The Basics - Stata is a command-driven statistical software program. In other words, you type in a command, and Stata executes it. You can use the drop-down menus to avoid
Mr. Kongmany Chaleunvong. GFMER - WHO - UNFPA - LAO PDR Training Course in Reproductive Health Research Vientiane, 22 October 2009
 Mr. Kongmany Chaleunvong GFMER - WHO - UNFPA - LAO PDR Training Course in Reproductive Health Research Vientiane, 22 October 2009 1 Object of the Course Introduction to SPSS The basics of managing data
ECO375 Tutorial 1 Introduction to Stata
 ECO375 Tutorial 1 Introduction to Stata Matt Tudball University of Toronto Mississauga September 14, 2017 Matt Tudball (University of Toronto) ECO375H5 September 14, 2017 1 / 25 What Is Stata? Stata is
TYPES OF VARIABLES, STRUCTURE OF DATASETS, AND BASIC STATA LAYOUT
 PRIMER FOR ACS OUTCOMES RESEARCH COURSE: TYPES OF VARIABLES, STRUCTURE OF DATASETS, AND BASIC STATA LAYOUT STEP 1: Install STATA statistical software. STEP 2: Read through this primer and complete the
User Services Spring 2008 OBJECTIVES Introduction Getting Help Instructors
 User Services Spring 2008 OBJECTIVES Use the Data Editor of SPSS 15.0 to to import data. Recode existing variables and compute new variables Use SPSS utilities and options Conduct basic statistical tests.
Workshop for empirical trade analysis. December 2015 Bangkok, Thailand
 Workshop for empirical trade analysis December 2015 Bangkok, Thailand Cosimo Beverelli (WTO) Rainer Lanz (WTO) Content a. Resources b. Stata windows c. Organization of the Bangkok_Dec_2015\Stata folder
Reading data in SAS and Descriptive Statistics
 P8130 Recitation 1: Reading data in SAS and Descriptive Statistics Zilan Chai Sep. 18 th /20 th 2017 Outline Intro to SAS (windows, basic rules) Getting Data into SAS Descriptive Statistics SAS Windows
IBMSPSSSTATL1P: IBM SPSS Statistics Level 1
 SPSS IBMSPSSSTATL1P IBMSPSSSTATL1P: IBM SPSS Statistics Level 1 Version: 4.4 QUESTION NO: 1 Which statement concerning IBM SPSS Statistics application windows is correct? A. At least one Data Editor window
Introduction to Stata First Session. I- Launching and Exiting Stata Launching Stata Exiting Stata..
 Introduction to Stata 2016-17 01. First Session I- Launching and Exiting Stata... 1. Launching Stata... 2. Exiting Stata.. II - Toolbar, Menu bar and Windows.. 1. Toolbar Key.. 2. Menu bar Key..... 3.
ICSSR Data Service. Stata: User Guide. Indian Council of Social Science Research. Indian Social Science Data Repository
 http://www.icssrdataservice.in/ ICSSR Data Service Indian Social Science Data Repository Stata: User Guide Indian Council of Social Science Research ICSSR Data Service Contents: 1. Introduction 1 2. Opening
Introduction to Minitab 1
 Introduction to Minitab 1 We begin by first starting Minitab. You may choose to either 1. click on the Minitab icon in the corner of your screen 2. go to the lower left and hit Start, then from All Programs,
Select Cases. Select Cases GRAPHS. The Select Cases command excludes from further. selection criteria. Select Use filter variables
 Select Cases GRAPHS The Select Cases command excludes from further analysis all those cases that do not meet specified selection criteria. Select Cases For a subset of the datafile, use Select Cases. In
SAS Training Spring 2006
 SAS Training Spring 2006 Coxe/Maner/Aiken Introduction to SAS: This is what SAS looks like when you first open it: There is a Log window on top; this will let you know what SAS is doing and if SAS encountered
GETTING DATA INTO THE PROGRAM
 GETTING DATA INTO THE PROGRAM 1. Have a Stata dta dataset. Go to File then Open. OR Type use pathname in the command line. 2. Using a SAS or SPSS dataset. Use Stat Transfer. (Note: do not become dependent
Introduction to gretl
 Introduction to gretl Applied Economics Department of Economics Universidad Carlos III de Madrid Outline 1 What is gretl? 2 gretl Basics 3 Importing Data 4 Saving as gretl File 5 Running a Script 6 First
General Guidelines: SAS Analyst
 General Guidelines: SAS Analyst The Analyst application is a data analysis tool in SAS for Windows (version 7 and later) that provides easy access to basic statistical analyses using a point-and-click
BIOSTATISTICS LABORATORY PART 1: INTRODUCTION TO DATA ANALYIS WITH STATA: EXPLORING AND SUMMARIZING DATA
 BIOSTATISTICS LABORATORY PART 1: INTRODUCTION TO DATA ANALYIS WITH STATA: EXPLORING AND SUMMARIZING DATA Learning objectives: Getting data ready for analysis: 1) Learn several methods of exploring the
Intro to Stata for Political Scientists
 Intro to Stata for Political Scientists Andrew S. Rosenberg Junior PRISM Fellow Department of Political Science Workshop Description This is an Introduction to Stata I will assume little/no prior knowledge
After opening Stata for the first time: set scheme s1mono, permanently
 Stata 13 HELP Getting help Type help command (e.g., help regress). If you don't know the command name, type lookup topic (e.g., lookup regression). Email: tech-support@stata.com. Put your Stata serial
Ninth ARTNeT Capacity Building Workshop for Trade Research "Trade Flows and Trade Policy Analysis"
 Ninth ARTNeT Capacity Building Workshop for Trade Research "Trade Flows and Trade Policy Analysis" June 2013 Bangkok, Thailand Cosimo Beverelli and Rainer Lanz (World Trade Organization) 1 Introduction
An Introduction to Minitab Statistics 529
 An Introduction to Minitab Statistics 529 1 Introduction MINITAB is a computing package for performing simple statistical analyses. The current version on the PC is 15. MINITAB is no longer made for the
IBM SPSS Statistics 22 Brief Guide
 IBM SPSS Statistics 22 Brief Guide Note Before using this information and the product it supports, read the information in Notices on page 77. Product Information This edition applies to version 22, release
Stata version 14 Also works for versions 13 & 12. Lab Session 1 February Preliminary: How to Screen Capture..
 Stata version 14 Also works for versions 13 & 12 Lab Session 1 February 2016 1. Preliminary: How to Screen Capture.. 2. Preliminary: How to Keep a Log of Your Stata Session.. 3. Preliminary: How to Save
UNIT 4. Research Methods in Business
 UNIT 4 Preparing Data for Analysis:- After data are obtained through questionnaires, interviews, observation or through secondary sources, they need to be edited. The blank responses, if any have to be
Week 1: Introduction to Stata
 Week 1: Introduction to Stata Marcelo Coca Perraillon University of Colorado Anschutz Medical Campus Health Services Research Methods I HSMP 7607 2017 c 2017 PERRAILLON ALL RIGHTS RESERVED 1 Outline Log
Math 227 EXCEL / MEGASTAT Guide
 Math 227 EXCEL / MEGASTAT Guide Introduction Introduction: Ch2: Frequency Distributions and Graphs Construct Frequency Distributions and various types of graphs: Histograms, Polygons, Pie Charts, Stem-and-Leaf
Homework 1 Excel Basics
 Homework 1 Excel Basics Excel is a software program that is used to organize information, perform calculations, and create visual displays of the information. When you start up Excel, you will see the
Introduction (SPSS) Opening SPSS Start All Programs SPSS Inc SPSS 21. SPSS Menus
 Opening SPSS Start All Programs SPSS Inc SPSS 21. SPSS Menus") Introduction (SPSS) SPSS is the acronym of Statistical Package for the Social Sciences. SPSS is one of the most popular statistical packages which can perform highly complex data manipulation and analysis
Introduction (SPSS) SPSS is the acronym of Statistical Package for the Social Sciences. SPSS is one of the most popular statistical packages which can perform highly complex data manipulation and analysis
INTRODUCTION to. Program in Statistics and Methodology (PRISM) Daniel Blake & Benjamin Jones January 15, 2010
 Daniel Blake & Benjamin Jones January 15, 2010") INTRODUCTION to Program in Statistics and Methodology (PRISM) Daniel Blake & Benjamin Jones January 15, 2010 While we are waiting Everyone who wishes to work along with the presentation should log onto
INTRODUCTION to Program in Statistics and Methodology (PRISM) Daniel Blake & Benjamin Jones January 15, 2010 While we are waiting Everyone who wishes to work along with the presentation should log onto
Instructions for Using the Databases
 Appendix D Instructions for Using the Databases Two sets of databases have been created for you if you choose to use the Documenting Our Work forms. One set is in Access and one set is in Excel. They are
Dr. Barbara Morgan Quantitative Methods
 Dr. Barbara Morgan Quantitative Methods 195.650 Basic Stata This is a brief guide to using the most basic operations in Stata. Stata also has an on-line tutorial. At the initial prompt type tutorial. In
STATA Version 9 10/05/2012 1
 INTRODUCTION TO STATA PART I... 2 INTRODUCTION... 2 Background... 2 Starting STATA... 3 Window Orientation... 4 Command Structure... 4 The Help Menu... 4 Selecting a Subset of the Data... 5 Inputting Data...
Biology 345: Biometry Fall 2005 SONOMA STATE UNIVERSITY Lab Exercise 2 Working with data in Excel and exporting to JMP Introduction
 Biology 345: Biometry Fall 2005 SONOMA STATE UNIVERSITY Lab Exercise 2 Working with data in Excel and exporting to JMP Introduction In this exercise, we will learn how to reorganize and reformat a data
Instructions for Using the Databases
 Appendix D Instructions for Using the Databases Two sets of databases have been created for you if you choose to use the Documenting Our Work forms. One set is in Access and one set is in Excel. They are
Applied Regression Modeling: A Business Approach
 i Applied Regression Modeling: A Business Approach Computer software help: SAS SAS (originally Statistical Analysis Software ) is a commercial statistical software package based on a powerful programming
Introductions Overview of SPSS
 Introductions Overview of SPSS Welcome to our SPSS tutorials. This first tutorial will provide a basic overview of the SPSS environment. We will be using SPSS version 22 for these tutorials, however, versions
Basic Stata Tutorial
 Basic Stata Tutorial By Brandon Heck Downloading Stata To obtain Stata, select your country of residence and click Go. Then, assuming you are a student, click New Educational then click Students. The capacity
Brief Guide on Using SPSS 10.0
 Brief Guide on Using SPSS 10.0 (Use student data, 22 cases, studentp.dat in Dr. Chang s Data Directory Page) (Page address: http://www.cis.ysu.edu/~chang/stat/) I. Processing File and Data To open a new
Getting Our Feet Wet with Stata SESSION TWO Fall, 2018
 Getting Our Feet Wet with Stata SESSION TWO Fall, 2018 Instructor: Cathy Zimmer 962-0516, cathy_zimmer@unc.edu 1) REMINDER BRING FLASH DRIVES! 2) QUESTIONS ON EXERCISES? 3) WHAT IS Stata SYNTAX? a) A set
SPSS for Survey Analysis
 STC: SPSS for Survey Analysis 1 SPSS for Survey Analysis STC: SPSS for Survey Analysis 2 SPSS for Surveys: Contents Background Information... 4 Opening and creating new documents... 5 Starting SPSS...
Make sure to keep all graphs in same excel file as your measures.
 Project Part 2 Graphs. I. Use Excel to make bar graph for questions 1, and 5. II. Use Excel to make histograms for questions 2, and 3. III. Use Excel to make pie graphs for questions 4, and 6. IV. Use
Summarising Data. Mark Lunt 09/10/2018. Arthritis Research UK Epidemiology Unit University of Manchester
 Summarising Data Mark Lunt Arthritis Research UK Epidemiology Unit University of Manchester 09/10/2018 Summarising Data Today we will consider Different types of data Appropriate ways to summarise these
Empirical trade analysis
 Empirical trade analysis Introduction to Stata Cosimo Beverelli World Trade Organization Cosimo Beverelli Stata introduction Bangkok, 18-21 Dec 2017 1 / 23 Outline 1 Resources 2 How Stata looks like 3
Introduction to Stata. Getting Started. This is the simple command syntax in Stata and more conditions can be added as shown in the examples.
 Getting Started Command Syntax command varlist, option This is the simple command syntax in Stata and more conditions can be added as shown in the examples. Preamble mkdir tutorial /* to create a new directory,
Excel Primer CH141 Fall, 2017
 Excel Primer CH141 Fall, 2017 To Start Excel : Click on the Excel icon found in the lower menu dock. Once Excel Workbook Gallery opens double click on Excel Workbook. A blank workbook page should appear
WINCROSS EXECUTIVE Getting Started
 WINCROSS EXECUTIVE Getting Started The Analytical Group, Inc. WinCross Executive 1 Getting Started 2 Version 1 Copyright 2018, The Analytical Group, Inc. Editor: Pete Hilmers All rights reserved. No part
Statistical Analysis Using Minitab
 Statistical Analysis Using Minitab Part (1): Introduction to Using Minitab You can download Minitab from www.minitab.com. Detailed help is available here: https://www.minitab.com/uploadedfiles/documents/getting-started/minitab17_gettingstarted-en.pdf
StatLab Workshops 2008
 Stata Workshop Fall 2008 Adrian de la Garza and Nancy Hite Using STATA at the Statlab 1. The Different Windows in STATA Automatically displayed windows o Command Window: executes STATA commands; type in
TerraStation II v7 Training
 WORKED EXAMPLE Loading and using Core Analysis Data Core Analysis Data is frequently not available at exact well increments. In order to retain the exact depth at which this data is sampled, it needs to
Excel 2010 with XLSTAT
 Excel 2010 with XLSTAT J E N N I F E R LE W I S PR I E S T L E Y, PH.D. Introduction to Excel 2010 with XLSTAT The layout for Excel 2010 is slightly different from the layout for Excel 2007. However, with
Introduction to Stata - Session 2
 Introduction to Stata - Session 2 Siv-Elisabeth Skjelbred ECON 3150/4150, UiO January 26, 2016 1 / 29 Before we start Download auto.dta, auto.csv from course home page and save to your stata course folder.
PHPM 672/677 Lab #2: Variables & Conditionals Due date: Submit by 11:59pm Monday 2/5 with Assignment 2
 PHPM 672/677 Lab #2: Variables & Conditionals Due date: Submit by 11:59pm Monday 2/5 with Assignment 2 Overview Most assignments will have a companion lab to help you learn the task and should cover similar
Data Should Not be a Four Letter Word Microsoft Excel QUICK TOUR
 Toolbar Tour AutoSum + more functions Chart Wizard Currency, Percent, Comma Style Increase-Decrease Decimal Name Box Chart Wizard QUICK TOUR Name Box AutoSum Numeric Style Chart Wizard Formula Bar Active
ARM : Features Added After Version Gylling Data Management, Inc. * = key features. October 2015
 ARM 2015.6: Features Added After Version 2015.1 Gylling Data Management, Inc. October 2015 * = key features 1 Simpler Assessment Data Column Properties Removed less useful values, reduced height on screen
Introduction to Nesstar
 Introduction to Nesstar Nesstar is a software system for online data analysis. It is available for use with many of the large UK surveys on the UK Data Service website. You will know whether you can use
Subject index. ASCII data, reading comma-separated fixed column multiple lines per observation
 Subject index Symbols %fmt... 106 110 * abbreviation character... 374 377 * comment indicator...346 + combining strings... 124 125 - abbreviation character... 374 377.,.a,.b,...,.z missing values.. 130
FlowJo Software Lecture Outline:
 FlowJo Software Lecture Outline: Workspace Basics: 3 major components 1) The Ribbons (toolbar) The availability of buttons here can be customized. *One of the best assets of FlowJo is the help feature*
The Stata Bible 2.0. Table of Contents. by Dawn L. Teele 1
 The Stata Bible 2.0 by Dawn L. Teele 1 Welcome to what I hope is a very useful research resource for Stata programmers of all levels. The content of this tutorial has been developed while I was writing
Select a report and click this to view it. Select a report and click this to change it.
 Quick Videos: A tutorial on creating reports. Shows reports you have created.s Not used by the county Reports pre-made by the county Reports pre-made by 4-H Online Shows reports and folders you have deleted.
Let s use Technology Use Data from Cycle 14 of the General Social Survey with Fathom for a data analysis project
 Let s use Technology Use Data from Cycle 14 of the General Social Survey with Fathom for a data analysis project Data Content: Example: Who chats on-line most frequently? This Technology Use dataset in
IENG484 Quality Engineering Lab 1 RESEARCH ASSISTANT SHADI BOLOUKIFAR
 IENG484 Quality Engineering Lab 1 RESEARCH ASSISTANT SHADI BOLOUKIFAR SPSS (Statistical package for social science) Originally is acronym of Statistical Package for the Social Science but, now it stands
Introduction to Stata Getting Data into Stata. 1. Enter Data: Create a New Data Set in Stata...
 Introduction to Stata 2016-17 02. Getting Data into Stata 1. Enter Data: Create a New Data Set in Stata.... 2. Enter Data: How to Import an Excel Data Set.... 3. Import a Stata Data Set Directly from the
There are 3 main windows, and 3 main types of files, in SPSS: Data, Syntax, and Output.
 U6310 Quantitative Techniques Lab - September 2001 Intro to SPSS SPSS works like this: You have a data set (either you create one or use an existing file such as the GSS). You choose analysis techniques
SPSS Instructions and Guidelines PSCI 2300 Intro to Political Science Research Dr. Paul Hensel Last updated 10 March 2018
 SPSS Instructions and Guidelines PSCI 2300 Intro to Political Science Research Dr. Paul Hensel Last updated 10 March 2018 Table of Contents Introduction... 1 Accessing SPSS... 2 Possible Alternative: PSPP...
STATA WORKSHOP 2. ERL Workshop for Sociology Fall 2014
 STATA WORKSHOP 2 ERL Workshop for Sociology Fall 2014 NITTY GRITTY DATA SAVVY STEPS TO SUCCESS Write your codebook By doing this first you take care of all the decision making, so you don t have to go
Introduction. About this Document. What is SPSS. ohow to get SPSS. oopening Data
 Introduction About this Document This manual was written by members of the Statistical Consulting Program as an introduction to SPSS 12.0. It is designed to assist new users in familiarizing themselves
Chapter 2 Assignment (due Thursday, April 19)
") (due Thursday, April 19) Introduction: The purpose of this assignment is to analyze data sets by creating histograms and scatterplots. You will use the STATDISK program for both. Therefore, you should
(due Thursday, April 19) Introduction: The purpose of this assignment is to analyze data sets by creating histograms and scatterplots. You will use the STATDISK program for both. Therefore, you should
MicroStrategy Desktop
 MicroStrategy Desktop Quick Start Guide MicroStrategy Desktop is designed to enable business professionals like you to explore data, simply and without needing direct support from IT. 1 Import data from
A QUICK INTRODUCTION TO STATA
 A QUICK INTRODUCTION TO STATA This module provides a quick introduction to STATA. After completing this module you will be able to input data, save data, transform data, create basic tables, create basic
Lastly, in case you don t already know this, and don t have Excel on your computers, you can get it for free through IT s website under software.
 Welcome to Basic Excel, presented by STEM Gateway as part of the Essential Academic Skills Enhancement, or EASE, workshop series. Before we begin, I want to make sure we are clear that this is by no means
OVERVIEW OF WINDOWS IN STATA
 OBJECTIVES OF STATA This course is the series of statistical analysis using Stata. It is designed to acquire basic skill on Stata and produce a technical reports in the statistical views. After completion
Getting started with Minitab 14 for Windows
 INFORMATION SYSTEMS SERVICES Getting started with Minitab 14 for Windows This document provides an introduction to the Minitab (Version 14) statistical package. AUTHOR: Information Systems Services, University
An Introduction to STATA ECON 330 Econometrics Prof. Lemke
 An Introduction to STATA ECON 330 Econometrics Prof. Lemke 1. GETTING STARTED A requirement of this class is that you become very comfortable with STATA, a leading statistical software package. You were
Office 2016 Excel Basics 25 Video/Class Project #37 Excel Basics 25: Power Query (Get & Transform Data) to Convert Bad Data into Proper Data Set
 to Convert Bad Data into Proper Data Set") Office 2016 Excel Basics 25 Video/Class Project #37 Excel Basics 25: Power Query (Get & Transform Data) to Convert Bad Data into Proper Data Set Goal in video # 25: Learn about how to use the Get & Transform
Office 2016 Excel Basics 25 Video/Class Project #37 Excel Basics 25: Power Query (Get & Transform Data) to Convert Bad Data into Proper Data Set Goal in video # 25: Learn about how to use the Get & Transform