Statistical Package for the Social Sciences INTRODUCTION TO SPSS SPSS for Windows Version 16.0: Its first version in 1968 In 1975.
|
|
|
- Florence Henderson
- 5 years ago
- Views:
Transcription
1 Statistical Package for the Social Sciences INTRODUCTION TO SPSS SPSS for Windows Version 16.0: Its first version in 1968 In SPSS Statistics were designed
2 INTRODUCTION TO SPSS
3 Objective About the four-windows in SPSS The basics of managing data files The basic analysis in SPSS
4 Introduction: What is SPSS? Originally it is an acronym of Statistical Package for the Social Science but now it stands for Statistical Product and Service Solutions One of the most popular statistical packages which can perform data manipulation and analysis with simple instructions
5 Statistical Package for the Social Sciences INTRODUCTION TO SPSS SPSS for Windows Version 16.0: Its first version in 1968 In SPSS Statistics were designed
6 Data Classification Level of Measurement Statistics Test 1.Categorical Categories data Gender: Male (M), Female (F) Religion/Nationality 1. Nominal Level Categories data: Gender, Name of City, Political Party * There is no distance property Qualitative Analysis (Non-parametric test) 2.Rank Ranking or Ordering data Income Level: 1= Very Low Income 2= Low Income 3= Medium Income 4= High Income 5= Very High Income Education Level: 1= Primary 2= Secondary 3= Height School 4= Collage 5= University 1. Ordinal Level Ranking data/ Opinion/Attitude data: 1= Very Disagree 2= Disagree 3= Neutral 4= Agree 5= Very Agree Median Chi-square test (χ 2 test) Spearman Rank Correlation etc. Bar Chart Pie Chart
7 3. Metric Certain unit of Measurement: Income =$ 215, Expenditure=$234, Agri. Productivity=245 X kg./unit, Speed = km./hr. etc. 3. Interval Level Fixed and equal units Distances between Categories Zero point is not available Metric data: G.P.A.= 3.52 Thermometer: 40 o F, 0 o C etc. Quantitative Analysis (Parametric test), S.D. t-test (two set of data) ANOVA (F-test), (more than two groups of data) 4. Ratio Level Defined Zero point Metric data: Real Number : Age, Income,, Expenditure, Area, Product, Height, Weight, Volume etc. Pearson s Correlation Multiple Regression Factor Analysis Correlation Matrix Index Number etc. Histograms Chart


8 Open Spss Windows Click Click

9 SPSS Windows
10 The Four Windows: 1-Data editor 2-Output viewer 3-Syntax editor 4-Script window
11 First Windows: Data Editor Data Editor Spreadsheet-like system for defining, entering, editing, and displaying data. Extension of the saved file will be *.sav

12 Second Windows: Output Viewer Output Viewer Displays output and errors. Extension of the saved file will be *.spv

13 Third Windows: Syntax editor Syntax Editor Text editor for syntax composition. Extension of the saved file will be *.sps

14 Fourth Windows: Script Window Script Window Provides the opportunity to write full-blown programs, in a BASIC-like language. Text editor for syntax composition. Extension of the saved file will be.*sbs
15 The basics of managing data files
16 Opening SPSS The default window will have the data editor There are two sheets in the window: 1. Data view 2. Variable view

17 Data View window The Data View window This sheet is visible when you first open the Data Editor and this sheet contains the data Click on the tab labeled Variable View Click
18 Types of Variables What are variables you would consider in buying a second hand bike? Brand (Trek, Raleigh) Type (road, mountain, racer) Components (Shimano, no name) Age Condition (Excellent, good, poor) Price Frame size Number of gears

19 Variable View window This sheet contains information about the data set that is stored with the dataset Name The first character of the variable name must be alphabetic Variable names must be unique, and have to be less than 64 characters. Spaces are NOT allowed.

20 Variable View window: Type Type Click on the type box. The two basic types of variables that you will use are numeric and string. This column enables you to specify the type of variable.
21 Variable View window: Width Width Width allows you to determine the number of characters SPSS will allow to be entered for the variable
22 Variable View window: Decimals Decimals Number of decimals It has to be less than or equal to

23 Variable View window: Label Label You can specify the details of the variable You can write characters with spaces up to 256 characters
24 Variable View window: Values Values This is used and to suggest which numbers represent which categories when the variable represents a category

25 Defining the value labels Click the cell in the values column as shown below For the value, and the label, you can put up to 60 characters. After defining the values click add and then click OK. Click
26 Practice 1 How would you put the following information into SPSS? Name Gender Height JAUNITA SALLY DONNA SABRINA JOHN MARK 1 6 ERIC BRUCE Value = 1 represents Male and Value = 2 represents Female

27 Practice 1 (Solution Sample) Click

28 Click


29 Saving the data To save the data file you created simply click file and click save as. You can save the file in different forms by clicking Save as type. Click Click Click
30 Import Files In SPSS Three types of Data 1. SPSS Files or SPSS Data 2. Excel files or Excel Data 3. Text files or Text data


31 1.SPSS Files or SPSS Data 1-Click 2-Click 3-Click 4-Click 5-Click 6-Click
32 Resulting Windows
33 2. Opening Excel Files 1-Click 2-Click 3-Click


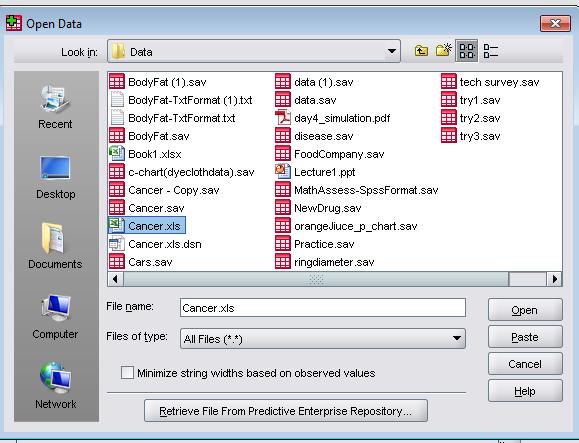
34 1-Click 3-Click 2-Click 4-Click 5-Click


35 1-Click 2-Click 3-Click 4-Click
")
36 Selection Of 1or More Then 1 Variable 1-Click 2-Click (change variable) 3-Click

37 Click


38 1-Click Open window 2-Click

39 3.Opening Text Files 1 st Step


40 2 nd Step


41 3 rd Step

42 4 th Step

43 Sorting the data Click Data and then click Sort Cases
 Double Click")

44 Sorting the data (cont d) Double Click Name of the students. Then click ok. Click Click
45 Practice How would you sort the data by the Height of students in descending order? Answer Click data, sort cases, double click height of students, click descending, and finally click ok.

46 Transforming data Click Transform and then click Compute Variable
 in the Numeric Expression box.")
47 Transforming data (cont d) Example: Adding a new variable named lnheight which is the natural log of height Type in lnheight in the Target Variable box. Then type in ln(height) in the Numeric Expression box. Click OK Click
48 Transforming data (cont d) A new variable lnheight is added to the table
49 Practice Create a new variable named sqrtheight which is the square root of height. Answer
50 The basic analysis
51 The basic analysis of SPSS Frequencies This analysis produces frequency tables showing frequency counts and percentages of the values of individual variables. Descriptives This analysis shows the maximum, minimum, mean, and standard deviation of the variables Linear regression analysis Linear Regression estimates the coefficients of the linear equation
52 Frequency distributions and graphing Levels of Measurement Frequency distributions Graphing data
53 Stages in scientific investigation Obtain your data: Usually get data from a sample, taken from a population. Descriptive statistics: Statistical Information of data. Inferential statistics: Use data from a sample to reveal characteristics of the population from which the sample data were selected.
54 Levels (scales) of measurement Nominal Scale: Consists of a set of categories that have different names. Measurements on a nominal scale label and categorize observations, but do not make any quantitative distinctions between observations. Example: Eye color: blue, green, brown, hazel

55 Levels of measurement Ordinal Scale: Consists of a set of categories that are organized in an ordered sequence. Measurements on an ordinal scale rank observations in terms of size or magnitude. Example: T-shirt size: Small, Med, Lrg, XL, XXL
56 Levels of measurement Interval Scale: Consists of ordered categories where all of the categories are intervals of exactly the same size. With an interval scale, equal differences between numbers on the scale reflect equal differences in magnitude. Ratios of magnitudes are not meaningful. Example: Fahrenheit temperature scale 40º Not Twice as hot 20º
57 Levels of measurement Ratio scale: An interval scale with the additional feature of an absolute zero point. With a ratio scale, ratios of numbers DO reflect ratios of magnitude. SPSS doesn t distinguish between these, collapses them into scale measurements
58 Distributions The data that we have entered into our SPSS files form distributions. Each column of information in the data view corresponds to the scores of a variable for the individuals in our sample.
59 Levels of measurement 1. Nominal (categorical or frequency data): When numbers are used as names. e.g. street numbers, footballers' numbers. We can do with nominal data is count how often each number occurs (i.e. get frequencies of categories). 2. Ordinal When numbers are used as ranks. e.g. order of finishing in a race: the first three finishers are "1", "2" and "3", but the difference between "1" and "2" is unlikely to be the same as between "2" and "3".
60 3. Interval When measurements are made on a scale with equal intervals between points on the scale e.g. temperature on Celsius scale 4. Ratio When measurements are made on a scale with equal intervals between points on the scale, and the scale has a true zero point. e.g. height, weight, time, distance.


61 Nominal data masquerading as scale measurements SPSS uses numbers as codes for nominal data. Here 1 = male and 2 = female. These are names, not numbers
62 Frequency distributions 50 scores on a statistics exam
63 Raw (ungrouped) Frequency Distribution Score Freq Score Freq Score Freq Score Freq
64 Grouped Frequency Distributions Class interval width = 3 Score Frequency Class interval width = 5 Score Frequency
65 Raw Frequency Raw Frequency Grouped Frequency Distributions Raw Frequency of Scores (Class Interval = 3): Raw Frequency of Scores (Class Interval = 5): Score Score
66 Cumulative Frequency Distributions Score Raw Freq. (=total in each cell) Cumulative freq. (=each cell total + all preceding cell totals) ( = ) 12 ( = ) 7 ( = 5+0+2) 2 ( = 0+2) 2 ( = 2) Cumulative freq. (= cum. freq. as % of total) ( = (14/50)*100 ) 24 ( = (12/50)*100 ) 14 ( = (7/50)*100 ) 4 ( = (2/50)*100 ) 4 ( = (2/50)*100 )
67 Frequency (% total) Cumulative frequency graph Score
68 Group A: N = 50 Relative Frequency Distributions Useful for comparing groups with different totals. Group B: N = 80 Score Raw Freq. Rel. Freq. Score Raw Freq. Rel. Freq % % % % % % % % % % % % % % % % Total: % Total: % Relative frequency = (cell total/overall total) x 100
69 Raw frequency Raw Frequency and Relative Frequency Distributions Only the scale of the graph changes - not the pattern of frequencies Raw Frequencies of Scores (N = 50) Score
70 Relative frequency (%) Relative Frequencies of Scores (N = 50) Score
71 No. of accidents per year Effects of aspect ratio and scale on graph appearance (a) A graph aimed at giving an accurate impression... Frequency of accidents volvo mini porsche Type of car driven
72 No. of accidents per year (b) A tall thin graph exaggerates apparent differences... Frequency of accidents volvo mini porsche Type of car driven
73 No. of accidents per year (c) A low wide graph minimises apparent differences... Frequency of accidents volvo mini porsche Type of car driven
74 No. of accidents per year (d) Starting the scale at a value other than zero can also exaggerate apparent differences. Frequency of accidents volvo mini porsche Type of car driven
75 Mean annual insurance premium (+/- 1 S.D.) Graphing averages If plotting averages, always include a measure of how scores are spread out around the average porsche drivers Type of driver skoda drivers

76 Opening the sample data Open Employee data.sav from the SPSS Go to File, Open, and Click Data


77 Opening the sample data Go to Program Files, SPSSInc, SPSS17, and Samples folder. Open Employee Data.sav file

78 Frequencies Click Analyze, Descriptive statistics, then click Frequencies

79 Frequencies Click gender and put it into the variable box. Click Charts. Then click Bar charts and click Continue. Click Click
80 Frequencies Finally Click OK in the Frequencies box. Click


81
 box. Then click Charts, Bar charts, and click Continue.")
82 Using the Syntax editor Click Analyze, Descriptive statistics, then click Frequencies. Put Gender in the Variable(s) box. Then click Charts, Bar charts, and click Continue. Click Paste. Click


83 Using the Syntax editor Highlight the commands in the Syntax editor and then click the run icon. You can do the same thing by right clicking the highlighted area and then by clicking Run Current Click Right Click!
84 Practice Do a frequency analysis on the variable minority Create pie charts for it Do the same analysis using the syntax editor


85


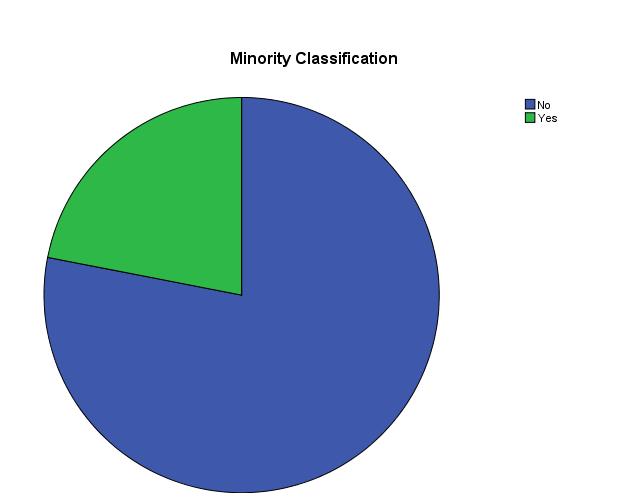
86 Answer Click

87 Descriptives Click Analyze, Descriptive statistics, then click Descriptives Click Educational level and Beginning Salary, and put it into the variable box. Click Options Click

88 Descriptives The options allows you to analyze other descriptive statistics besides the mean and Std. Click variance and kurtosis Finally click Continue Click Click

89 Descriptives Finally Click OK in the Descriptives box. You will be able to see the result of the analysis.

90 Regression Analysis Click Analyze, Regression, then click Linear from the main menu.

")
91 Regression Analysis For example let s analyze the model salbegin 0 1edu Put Beginning Salary as Dependent and Educational Level as Independent. (SPSS 16 but SPSS 17 has a different Window) Click Click
92 Regression Analysis Clicking OK gives the result
93 Plotting the regression line Click Graphs, Legacy Dialogs, Interactive, and Scatterplot from the main menu.


94 Plotting the regression line Drag Current Salary into the vertical axis box and Beginning Salary in the horizontal axis box. Click Fit bar. Make sure the Method is regression in the Fit box. Then click OK.(SPSS 16 but SPSS 17 has a different Window) Click Set this to Regression!

95
96 Practice Find out whether or not the previous experience of workers has any affect on their beginning salary? Take the variable salbegin, and prevexp as dependent and independent variables respectively. Plot the regression line for the above analysis using the scatter plot menu.

97 Answer Click
98
99 Click on the fit tab to make sure the method is regression

100
INTRODUCTION TO SPSS OUTLINE 6/17/2013. Assoc. Prof. Dr. Md. Mujibur Rahman Room No. BN Phone:
 INTRODUCTION TO SPSS Assoc. Prof. Dr. Md. Mujibur Rahman Room No. BN-0-024 Phone: 89287269 E-mail: mujibur@uniten.edu.my OUTLINE About the four-windows in SPSS The basics of managing data files The basic
Data Analysis using SPSS
 Data Analysis using SPSS 2073/03/05 03/07 Bijay Lal Pradhan, Ph.D. Ground Rule Mobile Penalty Participation Involvement Introduction to SPSS Day 1 2073/03/05 Session I Bijay Lal Pradhan, Ph.D. Object of
Research Data Analysis using SPSS. By Dr.Anura Karunarathne Senior Lecturer, Department of Accountancy University of Kelaniya
 Research Data Analysis using SPSS By Dr.Anura Karunarathne Senior Lecturer, Department of Accountancy University of Kelaniya MBA 61013- Business Statistics and Research Methodology Learning outcomes At
1. Basic Steps for Data Analysis Data Editor. 2.4.To create a new SPSS file
 1 SPSS Guide 2009 Content 1. Basic Steps for Data Analysis. 3 2. Data Editor. 2.4.To create a new SPSS file 3 4 3. Data Analysis/ Frequencies. 5 4. Recoding the variable into classes.. 5 5. Data Analysis/
IENG484 Quality Engineering Lab 1 RESEARCH ASSISTANT SHADI BOLOUKIFAR
 IENG484 Quality Engineering Lab 1 RESEARCH ASSISTANT SHADI BOLOUKIFAR SPSS (Statistical package for social science) Originally is acronym of Statistical Package for the Social Science but, now it stands
Data Mining. ❷Chapter 2 Basic Statistics. Asso.Prof.Dr. Xiao-dong Zhu. Business School, University of Shanghai for Science & Technology
 ❷Chapter 2 Basic Statistics Business School, University of Shanghai for Science & Technology 2016-2017 2nd Semester, Spring2017 Contents of chapter 1 1 recording data using computers 2 3 4 5 6 some famous
Mr. Kongmany Chaleunvong. GFMER - WHO - UNFPA - LAO PDR Training Course in Reproductive Health Research Vientiane, 22 October 2009
 Mr. Kongmany Chaleunvong GFMER - WHO - UNFPA - LAO PDR Training Course in Reproductive Health Research Vientiane, 22 October 2009 1 Object of the Course Introduction to SPSS The basics of managing data
Introduction (SPSS) Opening SPSS Start All Programs SPSS Inc SPSS 21. SPSS Menus
 Opening SPSS Start All Programs SPSS Inc SPSS 21. SPSS Menus") Introduction (SPSS) SPSS is the acronym of Statistical Package for the Social Sciences. SPSS is one of the most popular statistical packages which can perform highly complex data manipulation and analysis
Introduction (SPSS) SPSS is the acronym of Statistical Package for the Social Sciences. SPSS is one of the most popular statistical packages which can perform highly complex data manipulation and analysis
Introduction to SPSS Faiez Mossa 2 nd Class
 Introduction to SPSS 16.0 Faiez Mossa 2 nd Class 1 Outline Review of Concepts (stats and scales) Data entry (the workspace and labels) By hand Import Excel Running an analysis- frequency, central tendency,
Basic concepts and terms
 CHAPTER ONE Basic concepts and terms I. Key concepts Test usefulness Reliability Construct validity Authenticity Interactiveness Impact Practicality Assessment Measurement Test Evaluation Grading/marking
UNIT 4. Research Methods in Business
 UNIT 4 Preparing Data for Analysis:- After data are obtained through questionnaires, interviews, observation or through secondary sources, they need to be edited. The blank responses, if any have to be
SPSS for Survey Analysis
 STC: SPSS for Survey Analysis 1 SPSS for Survey Analysis STC: SPSS for Survey Analysis 2 SPSS for Surveys: Contents Background Information... 4 Opening and creating new documents... 5 Starting SPSS...
User Services Spring 2008 OBJECTIVES Introduction Getting Help Instructors
 User Services Spring 2008 OBJECTIVES Use the Data Editor of SPSS 15.0 to to import data. Recode existing variables and compute new variables Use SPSS utilities and options Conduct basic statistical tests.
Excel 2010 with XLSTAT
 Excel 2010 with XLSTAT J E N N I F E R LE W I S PR I E S T L E Y, PH.D. Introduction to Excel 2010 with XLSTAT The layout for Excel 2010 is slightly different from the layout for Excel 2007. However, with
Research Methods for Business and Management. Session 8a- Analyzing Quantitative Data- using SPSS 16 Andre Samuel
 Research Methods for Business and Management Session 8a- Analyzing Quantitative Data- using SPSS 16 Andre Samuel A Simple Example- Gym Purpose of Questionnaire- to determine the participants involvement
INTRODUCTORY SPSS. Dr Feroz Mahomed Swalaha x2689
 INTRODUCTORY SPSS Dr Feroz Mahomed Swalaha fswalaha@dut.ac.za x2689 1 Statistics (the systematic collection and display of numerical data) is the most abused area of numeracy. 97% of statistics are made
Nuts and Bolts Research Methods Symposium
 Organizing Your Data Jenny Holcombe, PhD UT College of Medicine Nuts & Bolts Conference August 16, 3013 Topics to Discuss: Types of Variables Constructing a Variable Code Book Developing Excel Spreadsheets
Applied Regression Modeling: A Business Approach
 i Applied Regression Modeling: A Business Approach Computer software help: SPSS SPSS (originally Statistical Package for the Social Sciences ) is a commercial statistical software package with an easy-to-use
SPSS. (Statistical Packages for the Social Sciences)
") Inger Persson SPSS (Statistical Packages for the Social Sciences) SHORT INSTRUCTIONS This presentation contains only relatively short instructions on how to perform basic statistical calculations in SPSS.
Inger Persson SPSS (Statistical Packages for the Social Sciences) SHORT INSTRUCTIONS This presentation contains only relatively short instructions on how to perform basic statistical calculations in SPSS.
Organizing Your Data. Jenny Holcombe, PhD UT College of Medicine Nuts & Bolts Conference August 16, 3013
 Organizing Your Data Jenny Holcombe, PhD UT College of Medicine Nuts & Bolts Conference August 16, 3013 Learning Objectives Identify Different Types of Variables Appropriately Naming Variables Constructing
A Simple Guide to Using SPSS (Statistical Package for the. Introduction. Steps for Analyzing Data. Social Sciences) for Windows
 for Windows") A Simple Guide to Using SPSS (Statistical Package for the Social Sciences) for Windows Introduction ٢ Steps for Analyzing Data Enter the data Select the procedure and options Select the variables Run the
A Simple Guide to Using SPSS (Statistical Package for the Social Sciences) for Windows Introduction ٢ Steps for Analyzing Data Enter the data Select the procedure and options Select the variables Run the
Creating a data file and entering data
 4 Creating a data file and entering data There are a number of stages in the process of setting up a data file and analysing the data. The flow chart shown on the next page outlines the main steps that
Data analysis using Microsoft Excel
 Introduction to Statistics Statistics may be defined as the science of collection, organization presentation analysis and interpretation of numerical data from the logical analysis. 1.Collection of Data
An introduction to SPSS
 An introduction to SPSS To open the SPSS software using U of Iowa Virtual Desktop... Go to https://virtualdesktop.uiowa.edu and choose SPSS 24. Contents NOTE: Save data files in a drive that is accessible
Brief Guide on Using SPSS 10.0
 Brief Guide on Using SPSS 10.0 (Use student data, 22 cases, studentp.dat in Dr. Chang s Data Directory Page) (Page address: http://www.cis.ysu.edu/~chang/stat/) I. Processing File and Data To open a new
Select Cases. Select Cases GRAPHS. The Select Cases command excludes from further. selection criteria. Select Use filter variables
 Select Cases GRAPHS The Select Cases command excludes from further analysis all those cases that do not meet specified selection criteria. Select Cases For a subset of the datafile, use Select Cases. In
Bluman & Mayer, Elementary Statistics, A Step by Step Approach, Canadian Edition
 Bluman & Mayer, Elementary Statistics, A Step by Step Approach, Canadian Edition Online Learning Centre Technology Step-by-Step - Minitab Minitab is a statistical software application originally created
Dr Wan Nor Arifin Unit of Biostatistics and Research Methodology, Universiti Sains Malaysia.
 Introduction to SPSS Dr Wan Nor Arifin Unit of Biostatistics and Research Methodology, Universiti Sains Malaysia. wnarifin@usm.my Outlines Introduction Data Editor Data View Variable View Menus Shortcut
NOTES TO CONSIDER BEFORE ATTEMPTING EX 1A TYPES OF DATA
 NOTES TO CONSIDER BEFORE ATTEMPTING EX 1A TYPES OF DATA Statistics is concerned with scientific methods of collecting, recording, organising, summarising, presenting and analysing data from which future
MATH 117 Statistical Methods for Management I Chapter Two
 Jubail University College MATH 117 Statistical Methods for Management I Chapter Two There are a wide variety of ways to summarize, organize, and present data: I. Tables 1. Distribution Table (Categorical
Opening a Data File in SPSS. Defining Variables in SPSS
 Opening a Data File in SPSS To open an existing SPSS file: 1. Click File Open Data. Go to the appropriate directory and find the name of the appropriate file. SPSS defaults to opening SPSS data files with
LAB 1 INSTRUCTIONS DESCRIBING AND DISPLAYING DATA
 LAB 1 INSTRUCTIONS DESCRIBING AND DISPLAYING DATA This lab will assist you in learning how to summarize and display categorical and quantitative data in StatCrunch. In particular, you will learn how to
Math 227 EXCEL / MEGASTAT Guide
 Math 227 EXCEL / MEGASTAT Guide Introduction Introduction: Ch2: Frequency Distributions and Graphs Construct Frequency Distributions and various types of graphs: Histograms, Polygons, Pie Charts, Stem-and-Leaf
Frequency Distributions
 Displaying Data Frequency Distributions After collecting data, the first task for a researcher is to organize and summarize the data so that it is possible to get a general overview of the results. Remember,
Introduction. About this Document. What is SPSS. ohow to get SPSS. oopening Data
 Introduction About this Document This manual was written by members of the Statistical Consulting Program as an introduction to SPSS 12.0. It is designed to assist new users in familiarizing themselves
Tabular & Graphical Presentation of data
 Tabular & Graphical Presentation of data bjectives: To know how to make frequency distributions and its importance To know different terminology in frequency distribution table To learn different graphs/diagrams
IBM SPSS Statistics 22 Brief Guide
 IBM SPSS Statistics 22 Brief Guide Note Before using this information and the product it supports, read the information in Notices on page 77. Product Information This edition applies to version 22, release
SAMLab Tip Sheet #4 Creating a Histogram
 Creating a Histogram Another great feature of Excel is its ability to visually display data. This Tip Sheet demonstrates how to create a histogram and provides a general overview of how to create graphs,
SPSS QM II. SPSS Manual Quantitative methods II (7.5hp) SHORT INSTRUCTIONS BE CAREFUL
 SHORT INSTRUCTIONS BE CAREFUL") SPSS QM II SHORT INSTRUCTIONS This presentation contains only relatively short instructions on how to perform some statistical analyses in SPSS. Details around a certain function/analysis method not covered
SPSS QM II SHORT INSTRUCTIONS This presentation contains only relatively short instructions on how to perform some statistical analyses in SPSS. Details around a certain function/analysis method not covered
STATA 13 INTRODUCTION
 STATA 13 INTRODUCTION Catherine McGowan & Elaine Williamson LONDON SCHOOL OF HYGIENE & TROPICAL MEDICINE DECEMBER 2013 0 CONTENTS INTRODUCTION... 1 Versions of STATA... 1 OPENING STATA... 1 THE STATA
This chapter will show how to organize data and then construct appropriate graphs to represent the data in a concise, easy-to-understand form.
 CHAPTER 2 Frequency Distributions and Graphs Objectives Organize data using frequency distributions. Represent data in frequency distributions graphically using histograms, frequency polygons, and ogives.
Math 121 Project 4: Graphs
 Math 121 Project 4: Graphs Purpose: To review the types of graphs, and use MS Excel to create them from a dataset. Outline: You will be provided with several datasets and will use MS Excel to create graphs.
Data can be in the form of numbers, words, measurements, observations or even just descriptions of things.
 + What is Data? Data is a collection of facts. Data can be in the form of numbers, words, measurements, observations or even just descriptions of things. In most cases, data needs to be interpreted and
8. MINITAB COMMANDS WEEK-BY-WEEK
 8. MINITAB COMMANDS WEEK-BY-WEEK In this section of the Study Guide, we give brief information about the Minitab commands that are needed to apply the statistical methods in each week s study. They are
Data Analysis and Solver Plugins for KSpread USER S MANUAL. Tomasz Maliszewski
 Data Analysis and Solver Plugins for KSpread USER S MANUAL Tomasz Maliszewski tmaliszewski@wp.pl Table of Content CHAPTER 1: INTRODUCTION... 3 1.1. ABOUT DATA ANALYSIS PLUGIN... 3 1.3. ABOUT SOLVER PLUGIN...
After opening Stata for the first time: set scheme s1mono, permanently
 Stata 13 HELP Getting help Type help command (e.g., help regress). If you don't know the command name, type lookup topic (e.g., lookup regression). Email: tech-support@stata.com. Put your Stata serial
Example how not to do it: JMP in a nutshell 1 HR, 17 Apr Subject Gender Condition Turn Reactiontime. A1 male filler
 JMP in a nutshell 1 HR, 17 Apr 2018 The software JMP Pro 14 is installed on the Macs of the Phonetics Institute. Private versions can be bought from
There are 3 main windows, and 3 main types of files, in SPSS: Data, Syntax, and Output.
 U6310 Quantitative Techniques Lab - September 2001 Intro to SPSS SPSS works like this: You have a data set (either you create one or use an existing file such as the GSS). You choose analysis techniques
DEPARTMENT OF HEALTH AND HUMAN SCIENCES HS900 RESEARCH METHODS
 DEPARTMENT OF HEALTH AND HUMAN SCIENCES HS900 RESEARCH METHODS Using SPSS Topics addressed today: 1. Accessing data from CMR 2. Starting SPSS 3. Getting familiar with SPSS 4. Entering data 5. Saving data
The basic arrangement of numeric data is called an ARRAY. Array is the derived data from fundamental data Example :- To store marks of 50 student
 Organizing data Learning Outcome 1. make an array 2. divide the array into class intervals 3. describe the characteristics of a table 4. construct a frequency distribution table 5. constructing a composite
Slides by. John Loucks. St. Edward s University. Slide South-Western, a part of Cengage Learning
 Slides by John Loucks St. Edward s University Slide 1 Chapter 2, Part B Descriptive Statistics: Tabular and Graphical Presentations Exploratory Data Analysis: Stem-and-Leaf Display Crosstabulations and
Course Code: SPSS19 Introduction to IBM SPSS Statistics
 Centre for Learning and Academic Development (CLAD) Technology Skills Development Team Course Code: SPSS19 Introduction to IBM SPSS Statistics www.intranet.birmingham.ac.uk/itskills An Introduction to
Project 11 Graphs (Using MS Excel Version )
") Project 11 Graphs (Using MS Excel Version 2007-10) Purpose: To review the types of graphs, and use MS Excel 2010 to create them from a dataset. Outline: You will be provided with several datasets and will
Project 11 Graphs (Using MS Excel Version 2007-10) Purpose: To review the types of graphs, and use MS Excel 2010 to create them from a dataset. Outline: You will be provided with several datasets and will
Introduction to SPSS Edward A. Greenberg, PhD
 Introduction to SPSS Edward A. Greenberg, PhD ASU HEALTH SOLUTIONS DATA LAB JANUARY 7, 2013 Files for this workshop Files can be downloaded from: http://www.public.asu.edu/~eagle/spss or (with less typing):
How to Use a Statistical Package
 APPENDIX D How to Use a Statistical Package Candace M. Evans, Lisa M. Gilman, Jeffrey Xavier, Joan Saxton Weber Computers and statistical software such as the Statistical Package for the Social Sciences
LSP 121. LSP 121 Math and Tech Literacy II. Topics. Quartiles. Intro to Statistics. More Descriptive Statistics
 Greg Brewster, DePaul University Page 1 LSP 121 Math and Tech Literacy II More Descriptive Statistics Greg Brewster DePaul University Topics More Descriptive Statistics Quartiles Percentiles Categorical
Digital literacy training
 Digital literacy training SPSS Introduction 2018 ANU Library anulib.anu.edu.au/training digital.literacy@anu.edu.au Table of Contents To start SPSS... 1 Import Excel files... 1 The Data View window...
ECLT 5810 Data Preprocessing. Prof. Wai Lam
 ECLT 5810 Data Preprocessing Prof. Wai Lam Why Data Preprocessing? Data in the real world is imperfect incomplete: lacking attribute values, lacking certain attributes of interest, or containing only aggregate
Activity Graphical Analysis with Excel and Logger Pro
 Activity Graphical Analysis with Excel and Logger Pro Purpose Vernier s Logger Pro is a graphical analysis software that will allow you to collect, graph and manipulate data. Microsoft s Excel is a spreadsheet
Table of Contents (As covered from textbook)
") Table of Contents (As covered from textbook) Ch 1 Data and Decisions Ch 2 Displaying and Describing Categorical Data Ch 3 Displaying and Describing Quantitative Data Ch 4 Correlation and Linear Regression
Table of Contents (As covered from textbook) Ch 1 Data and Decisions Ch 2 Displaying and Describing Categorical Data Ch 3 Displaying and Describing Quantitative Data Ch 4 Correlation and Linear Regression
1.1 Purpose and Intent of Graphs «
 1 Introduction Graphical Presentation of Data 1.1 Purpose and Intent of Graphs «The principal purpose of a graph is to answer questions about data. Answers to the questions may then provide direction for
To make sense of data, you can start by answering the following questions:
 Taken from the Introductory Biology 1, 181 lab manual, Biological Sciences, Copyright NCSU (with appreciation to Dr. Miriam Ferzli--author of this appendix of the lab manual). Appendix : Understanding
Chapter 2 Assignment (due Thursday, April 19)
") (due Thursday, April 19) Introduction: The purpose of this assignment is to analyze data sets by creating histograms and scatterplots. You will use the STATDISK program for both. Therefore, you should
(due Thursday, April 19) Introduction: The purpose of this assignment is to analyze data sets by creating histograms and scatterplots. You will use the STATDISK program for both. Therefore, you should
SPREADSHEET (Excel 2007)
") SPREADSHEET (Excel 2007) 1 U N I T 0 4 BY I F T I K H A R H U S S A I N B A B U R Spreadsheet Microsoft Office Excel 2007 (or Excel) is a computer program used to enter, analyze, and present quantitative
SPREADSHEET (Excel 2007) 1 U N I T 0 4 BY I F T I K H A R H U S S A I N B A B U R Spreadsheet Microsoft Office Excel 2007 (or Excel) is a computer program used to enter, analyze, and present quantitative
17 - VARIABLES... 1 DOCUMENT AND CODE VARIABLES IN MAXQDA Document Variables Code Variables... 1
 17 - Variables Contents 17 - VARIABLES... 1 DOCUMENT AND CODE VARIABLES IN MAXQDA... 1 Document Variables... 1 Code Variables... 1 The List of document variables and the List of code variables... 1 Managing
THE BASICS OF USING SPSS OCTOBER 22, 2008
 Faculty Research Center College of Education http://frc.coe.nau.edu/ OCTOBER 22, 2008 PRESENTED BY: Robert A. Horn, Ph.D. Assistant Professor, Educational Psychology 928-523-0545 Robert.Horn@nau.edu PRESENTATION
Homework 1 Excel Basics
 Homework 1 Excel Basics Excel is a software program that is used to organize information, perform calculations, and create visual displays of the information. When you start up Excel, you will see the
Creating a Histogram Creating a Histogram
 Creating a Histogram Another great feature of Excel is its ability to visually display data. This Tip Sheet demonstrates how to create a histogram and provides a general overview of how to create graphs,
Elementary Statistics
 1 Elementary Statistics Introduction Statistics is the collection of methods for planning experiments, obtaining data, and then organizing, summarizing, presenting, analyzing, interpreting, and drawing
Part I, Chapters 4 & 5. Data Tables and Data Analysis Statistics and Figures
 Part I, Chapters 4 & 5 Data Tables and Data Analysis Statistics and Figures Descriptive Statistics 1 Are data points clumped? (order variable / exp. variable) Concentrated around one value? Concentrated
ICT & MATHS. Excel 2003 in Mathematics Teaching
 ICT & MATHS Excel 2003 in Mathematics Teaching Published by The National Centre for Technology in Education in association with the Project Maths Development Team. Permission granted to reproduce for educational
In this tutorial, we show how to implement this approach and how to interpret the results with Tanagra.
 Subject Implementing the Principal Component Analysis (PCA) with TANAGRA. The PCA belongs to the factor analysis approaches. It is used to discover the underlying structure of a set of variables. It reduces
Your Name: Section: INTRODUCTION TO STATISTICAL REASONING Computer Lab #4 Scatterplots and Regression
 Your Name: Section: 36-201 INTRODUCTION TO STATISTICAL REASONING Computer Lab #4 Scatterplots and Regression Objectives: 1. To learn how to interpret scatterplots. Specifically you will investigate, using
Statistical Methods. Instructor: Lingsong Zhang. Any questions, ask me during the office hour, or me, I will answer promptly.
 Statistical Methods Instructor: Lingsong Zhang 1 Issues before Class Statistical Methods Lingsong Zhang Office: Math 544 Email: lingsong@purdue.edu Phone: 765-494-7913 Office Hour: Monday 1:00 pm - 2:00
Section 2-2 Frequency Distributions. Copyright 2010, 2007, 2004 Pearson Education, Inc
 Section 2-2 Frequency Distributions Copyright 2010, 2007, 2004 Pearson Education, Inc. 2.1-1 Frequency Distribution Frequency Distribution (or Frequency Table) It shows how a data set is partitioned among
Applied Regression Modeling: A Business Approach
 i Applied Regression Modeling: A Business Approach Computer software help: SAS SAS (originally Statistical Analysis Software ) is a commercial statistical software package based on a powerful programming
Frequency Tables. Chapter 500. Introduction. Frequency Tables. Types of Categorical Variables. Data Structure. Missing Values
 Chapter 500 Introduction This procedure produces tables of frequency counts and percentages for categorical and continuous variables. This procedure serves as a summary reporting tool and is often used
Chapter 2 - Frequency Distributions and Graphs
 1. Which of the following does not need to be done when constructing a frequency distribution? A) select the number of classes desired B) find the range C) make the class width an even number D) use classes
SAS Visual Analytics 8.2: Working with Report Content
 SAS Visual Analytics 8.2: Working with Report Content About Objects After selecting your data source and data items, add one or more objects to display the results. SAS Visual Analytics provides objects
1. Data Analysis Yields Numbers & Visualizations. 2. Why Visualize Data? 3. What do Visualizations do? 4. Research on Visualizations
 Data Analysis & Business Intelligence Made Easy with Excel Power Tools Excel Data Analysis Basics = E-DAB Notes for Video: E-DAB-05- Visualizations: Table, Charts, Conditional Formatting & Dashboards Outcomes
Subject. Creating a diagram. Dataset. Importing the data file. Descriptive statistics with TANAGRA.
 Subject Descriptive statistics with TANAGRA. The aim of descriptive statistics is to describe the main features of a collection of data in quantitative terms 1. The visualization of the whole data table
Excel 2007 for Teaching Statistics
 ICT & MATHS Modules 4 & 5 Excel 2007 for Teaching Statistics 1 Published by The National Centre for Technology in Education in association with the Project Maths Development Team. Permission granted to
Install RStudio from - use the standard installation.
 Session 1: Reading in Data Before you begin: Install RStudio from http://www.rstudio.com/ide/download/ - use the standard installation. Go to the course website; http://faculty.washington.edu/kenrice/rintro/
Right-click on whatever it is you are trying to change Get help about the screen you are on Help Help Get help interpreting a table
 Q Cheat Sheets What to do when you cannot figure out how to use Q What to do when the data looks wrong Right-click on whatever it is you are trying to change Get help about the screen you are on Help Help
Data Management Project Using Software to Carry Out Data Analysis Tasks
 Data Management Project Using Software to Carry Out Data Analysis Tasks This activity involves two parts: Part A deals with finding values for: Mean, Median, Mode, Range, Standard Deviation, Max and Min
AcaStat User Manual. Version 8.3 for Mac and Windows. Copyright 2014, AcaStat Software. All rights Reserved.
 AcaStat User Manual Version 8.3 for Mac and Windows Copyright 2014, AcaStat Software. All rights Reserved. http://www.acastat.com Table of Contents INTRODUCTION... 5 GETTING HELP... 5 INSTALLATION... 5
22/10/16. Data Coding in SPSS. Data Coding in SPSS. Data Coding in SPSS. Data Coding in SPSS
 DATA CODING IN SPSS STAFF TRAINING WORKSHOP March 28, 2017 Delivered by Dr. Director of Applied Economics Unit African Heritage Institution Enugu Nigeria To code data in SPSS, Lunch the SPSS The Data Editor
1 Introduction to Using Excel Spreadsheets
 Survey of Math: Excel Spreadsheet Guide (for Excel 2007) Page 1 of 6 1 Introduction to Using Excel Spreadsheets This section of the guide is based on the file (a faux grade sheet created for messing with)
Introduction to Minitab 1
 Introduction to Minitab 1 We begin by first starting Minitab. You may choose to either 1. click on the Minitab icon in the corner of your screen 2. go to the lower left and hit Start, then from All Programs,
Survey of Math: Excel Spreadsheet Guide (for Excel 2016) Page 1 of 9
 Page 1 of 9") Survey of Math: Excel Spreadsheet Guide (for Excel 2016) Page 1 of 9 Contents 1 Introduction to Using Excel Spreadsheets 2 1.1 A Serious Note About Data Security.................................... 2 1.2
Survey of Math: Excel Spreadsheet Guide (for Excel 2016) Page 1 of 9 Contents 1 Introduction to Using Excel Spreadsheets 2 1.1 A Serious Note About Data Security.................................... 2 1.2
Excel 2010 Worksheet 3. Table of Contents
 Table of Contents Graphs and Charts... 1 Chart Elements... 1 Column Charts:... 2 Pie Charts:... 6 Line graph 1:... 8 Line Graph 2:... 10 Scatter Charts... 12 Functions... 13 Calculate Averages (Mean):...
IBMSPSSSTATL1P: IBM SPSS Statistics Level 1
 SPSS IBMSPSSSTATL1P IBMSPSSSTATL1P: IBM SPSS Statistics Level 1 Version: 4.4 QUESTION NO: 1 Which statement concerning IBM SPSS Statistics application windows is correct? A. At least one Data Editor window
Lecture Slides. Elementary Statistics Twelfth Edition. by Mario F. Triola. and the Triola Statistics Series. Section 2.1- #
 Lecture Slides Elementary Statistics Twelfth Edition and the Triola Statistics Series by Mario F. Triola Chapter 2 Summarizing and Graphing Data 2-1 Review and Preview 2-2 Frequency Distributions 2-3 Histograms
How to Use a Statistical Package
 APPENDIX F How to Use a Statistical Package With the assistance of Lisa M. Gilman and Jeffrey Xavier and with contributions by Joan Saxton Weber Computers and statistical software such as the Statistical
4. Descriptive Statistics: Measures of Variability and Central Tendency
 4. Descriptive Statistics: Measures of Variability and Central Tendency Objectives Calculate descriptive for continuous and categorical data Edit output tables Although measures of central tendency and
Minitab 17 commands Prepared by Jeffrey S. Simonoff
 Minitab 17 commands Prepared by Jeffrey S. Simonoff Data entry and manipulation To enter data by hand, click on the Worksheet window, and enter the values in as you would in any spreadsheet. To then save
Bar Charts and Frequency Distributions
 Bar Charts and Frequency Distributions Use to display the distribution of categorical (nominal or ordinal) variables. For the continuous (numeric) variables, see the page Histograms, Descriptive Stats
Excel 2013 Charts and Graphs
 Excel 2013 Charts and Graphs Copyright 2016 Faculty and Staff Training, West Chester University. A member of the Pennsylvania State System of Higher Education. No portion of this document may be reproduced
Chapter Two: Descriptive Methods 1/50
 Chapter Two: Descriptive Methods 1/50 2.1 Introduction 2/50 2.1 Introduction We previously said that descriptive statistics is made up of various techniques used to summarize the information contained
Frequency Distributions and Descriptive Statistics in SPS
 230 Combs Building 859.622.3050 studentcomputing.eku.edu studentcomputing@eku.edu Frequency Distributions and Descriptive Statistics in SPSS In this tutorial, we re going to work through a sample problem