Part I, Chapters 4 & 5. Data Tables and Data Analysis Statistics and Figures
|
|
|
- Lesley Rogers
- 5 years ago
- Views:
Transcription
1 Part I, Chapters 4 & 5 Data Tables and Data Analysis Statistics and Figures
2 Descriptive Statistics 1 Are data points clumped? (order variable / exp. variable) Concentrated around one value? Concentrated in several areas? Do data point pairs show a pattern? (exp. variable #1 / exp. variable #2) Straight line? Parabola? Sin function?

3 Scatter Graphs A scatterplot is a useful summary of a set of bivariante data (two variables), usually drawn before working out a linear correlation coefficient or fitting a regression line. Each unit contributes one point to the scatterplot, on which points are plotted but not joined. The resulting pattern indicates the type and strength of the relationship between the two variables. Gives a good visual picture of the relationship between the variables Aids the interpretation of the correlation coefficient or regression model

4 Bar and Column Graphs A bar / column graph is a way of summarising a set of categorical data. It is often used in exploratory data analysis to illustrate the major features of the distribution of the data in a convenient form. It displays the data using a number of rectangles, of the same width, each of which represents a particular category. The length (and hence area) of each rectangle is proportional to the number of cases in the category it represents, for example, age group, religious affiliation. Summarize nominal or ordinal data Displayed horizontally (bars) or vertically (column) Drawn with a gap between the bars (rectangles)

5 Frequency Analysis: Histograms A histogram is a way of summarizing data that are measured on an interval scale (either discrete or continuous). It is often used in exploratory data analysis to illustrate the major features of the distribution of the data in a convenient form. It divides up the range of possible values in a data set into classes or groups. For each group, a rectangle is constructed with a base length equal to the range of values in that specific group, and an area proportional to the number of observations falling into that group. This means that the rectangles might be drawn of non-uniform height. Variables are numerical Variables are measured on an interval scale Used with large data sets (>100 observations) Detect unusual observations (outliers, gaps)
6 Descriptive Statistics 2 Does the Study Matter? Size Total number of Data Points, N -- Number of reactions performed -- Numbers of points measured (i.e., for a spectrum) Does the Parameter Matter? Range Distance between smallest and largest data value -- Min., Max., and Range = Max. Min. -- Average ± Difference/2 How Does the Parameter Matter? Middle There are many types of averages -- Average = Mean = Arithmetic Mean: Sum(Data) / N -- Geometric Mean: [ Product(Data) ] 1/N -- Mode: Most frequent data value -- Median: N/2 data are below and above. How Frequent Are Deviations? Spread Frequency of Significant Deviation -- Standard Deviation -- Central 50%

7 Create a Bar Graph 1

8 Create a Bar Graph 2

9 Create a Bar Graph 3

10 Create a Column Graph 1

11 Create a Column Graph 2
12 Create a Scatter Graph 1

13 Create a Scatter Graph 2
14 Stats 1
15 Stats 2
16 Standard Deviation
17 Standard Deviation Real Work Sample: Data Histogram Mathematical World: Inferential statistics maps the data by a formula that describes the population.
18 Histogram: Load Analysis 1

19 Histogram: Load Analysis 2

20 Histogram: Load Analysis 3

21 Histogram: Load Analysis 4

22 Histogram: Load Analysis 5

23 Histogram: Load Analysis 6

24
25
26
27


28 Normal Distribution Gaussian Distribution Bell Curve A normal distribution in a variante x with mean a and variance 2 is a statistic distribution with probability density function f (x) 1 2 exp x a If Gaussian, then: Mean = Median = Mode Mean and Standard Deviation determine the distribution

29 Normal Distribution, 1D-Gaussian

30 Scatter Graph In Electronics Research
31 Histogram In Solid State Research

32 Histogram In Polymer Research


33 Gaussian Dist. In Polymer Research


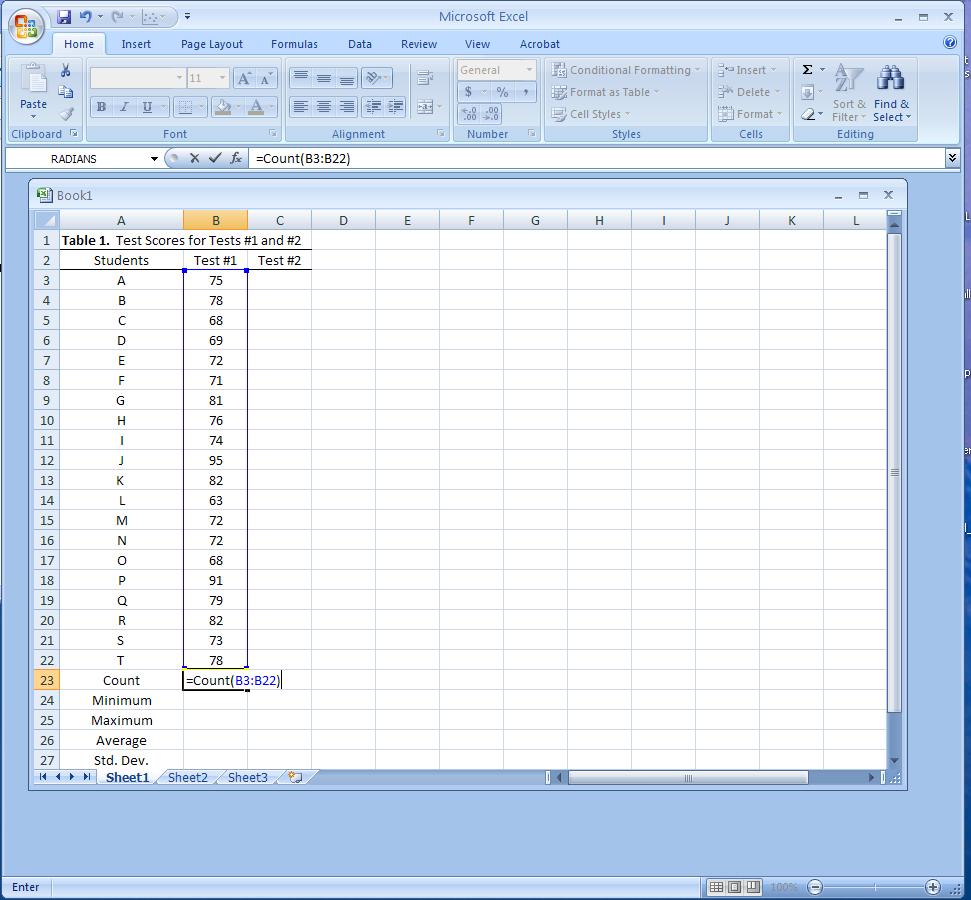
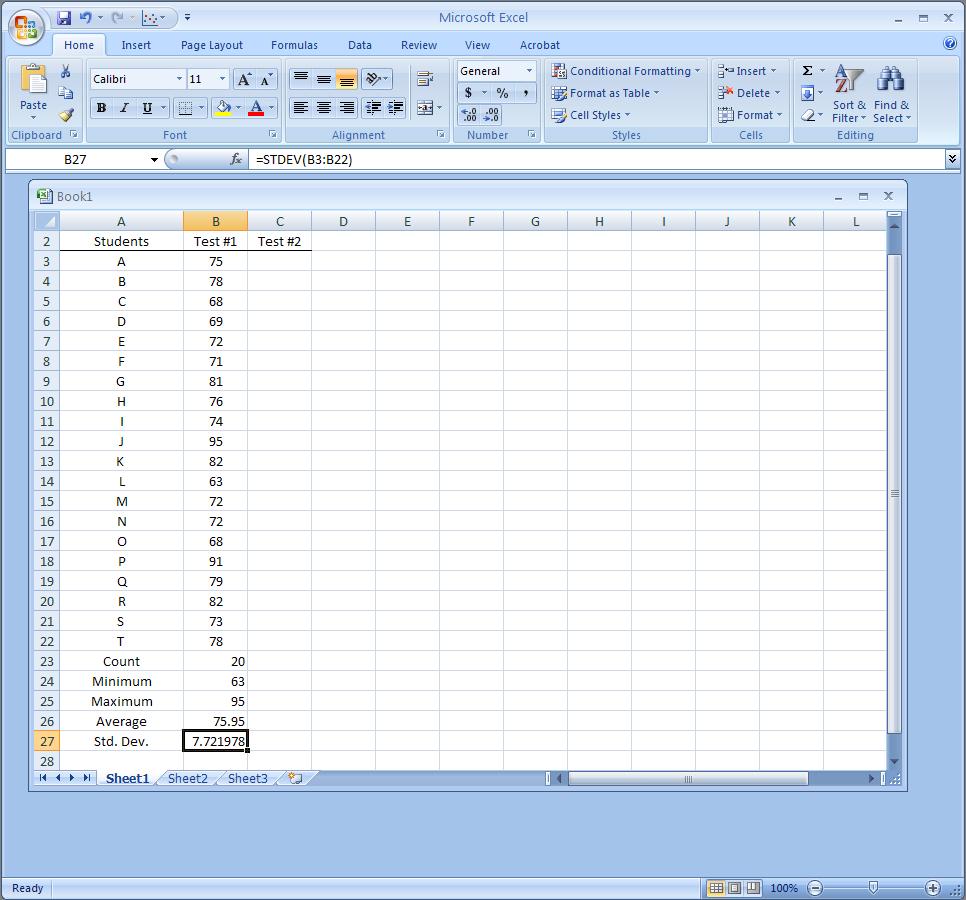
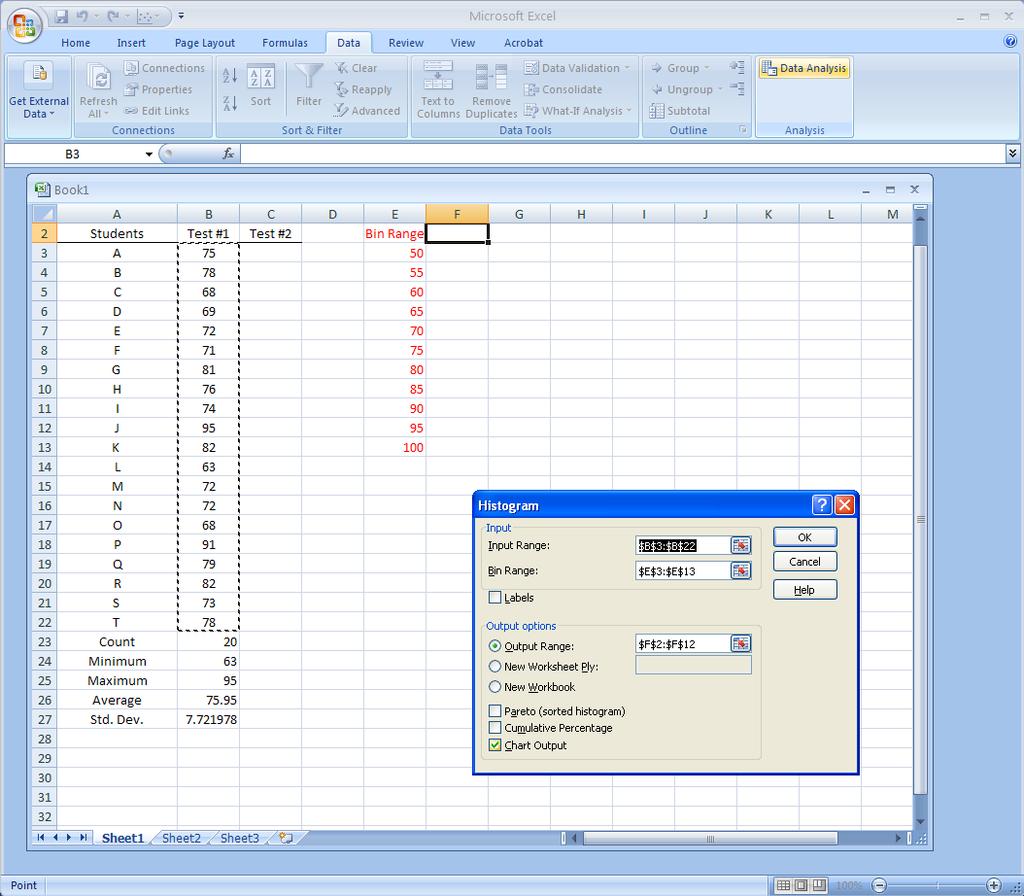
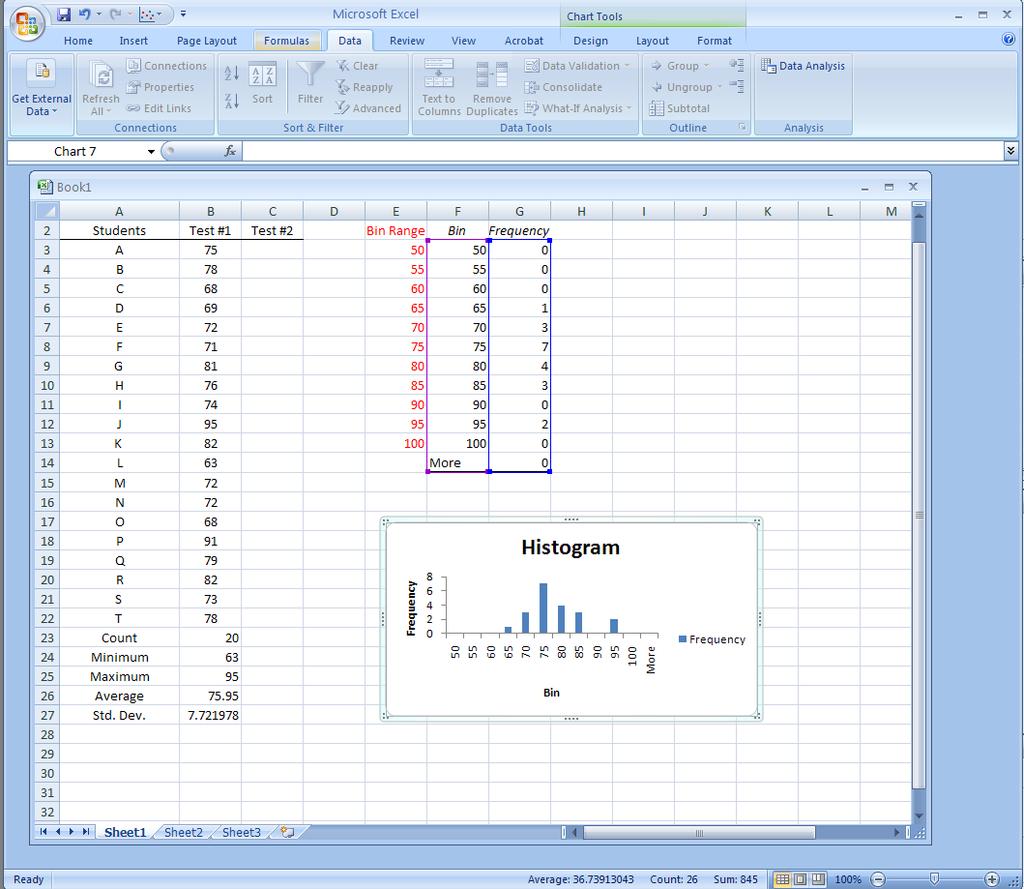
34 How to Compute Descriptive Statistics, Present Scatter Graphs & Histograms, and Plot Functions using Excel Example: Test Scores Assign. #3: Handout & online.
Chapter 1. Looking at Data-Distribution
 Chapter 1. Looking at Data-Distribution Statistics is the scientific discipline that provides methods to draw right conclusions: 1)Collecting the data 2)Describing the data 3)Drawing the conclusions Raw
Chapter 2 Describing, Exploring, and Comparing Data
 Slide 1 Chapter 2 Describing, Exploring, and Comparing Data Slide 2 2-1 Overview 2-2 Frequency Distributions 2-3 Visualizing Data 2-4 Measures of Center 2-5 Measures of Variation 2-6 Measures of Relative
Chapter 2. Frequency distribution. Summarizing and Graphing Data
 Frequency distribution Chapter 2 Summarizing and Graphing Data Shows how data are partitioned among several categories (or classes) by listing the categories along with the number (frequency) of data values
Data can be in the form of numbers, words, measurements, observations or even just descriptions of things.
 + What is Data? Data is a collection of facts. Data can be in the form of numbers, words, measurements, observations or even just descriptions of things. In most cases, data needs to be interpreted and
Data Statistics Population. Census Sample Correlation... Statistical & Practical Significance. Qualitative Data Discrete Data Continuous Data
 Data Statistics Population Census Sample Correlation... Voluntary Response Sample Statistical & Practical Significance Quantitative Data Qualitative Data Discrete Data Continuous Data Fewer vs Less Ratio
CHAPTER 1. Introduction. Statistics: Statistics is the science of collecting, organizing, analyzing, presenting and interpreting data.
 1 CHAPTER 1 Introduction Statistics: Statistics is the science of collecting, organizing, analyzing, presenting and interpreting data. Variable: Any characteristic of a person or thing that can be expressed
Chapter 5snow year.notebook March 15, 2018
 Chapter 5: Statistical Reasoning Section 5.1 Exploring Data Measures of central tendency (Mean, Median and Mode) attempt to describe a set of data by identifying the central position within a set of data
3. Data Analysis and Statistics
 3. Data Analysis and Statistics 3.1 Visual Analysis of Data 3.2.1 Basic Statistics Examples 3.2.2 Basic Statistical Theory 3.3 Normal Distributions 3.4 Bivariate Data 3.1 Visual Analysis of Data Visual
The first few questions on this worksheet will deal with measures of central tendency. These data types tell us where the center of the data set lies.
 Instructions: You are given the following data below these instructions. Your client (Courtney) wants you to statistically analyze the data to help her reach conclusions about how well she is teaching.
Further Maths Notes. Common Mistakes. Read the bold words in the exam! Always check data entry. Write equations in terms of variables
 Further Maths Notes Common Mistakes Read the bold words in the exam! Always check data entry Remember to interpret data with the multipliers specified (e.g. in thousands) Write equations in terms of variables
Frequency Distributions
 Displaying Data Frequency Distributions After collecting data, the first task for a researcher is to organize and summarize the data so that it is possible to get a general overview of the results. Remember,
Math 120 Introduction to Statistics Mr. Toner s Lecture Notes 3.1 Measures of Central Tendency
 Math 1 Introduction to Statistics Mr. Toner s Lecture Notes 3.1 Measures of Central Tendency lowest value + highest value midrange The word average: is very ambiguous and can actually refer to the mean,
Downloaded from
 UNIT 2 WHAT IS STATISTICS? Researchers deal with a large amount of data and have to draw dependable conclusions on the basis of data collected for the purpose. Statistics help the researchers in making
Summarising Data. Mark Lunt 09/10/2018. Arthritis Research UK Epidemiology Unit University of Manchester
 Summarising Data Mark Lunt Arthritis Research UK Epidemiology Unit University of Manchester 09/10/2018 Summarising Data Today we will consider Different types of data Appropriate ways to summarise these
Name Date Types of Graphs and Creating Graphs Notes
 Name Date Types of Graphs and Creating Graphs Notes Graphs are helpful visual representations of data. Different graphs display data in different ways. Some graphs show individual data, but many do not.
BIOL Gradation of a histogram (a) into the normal curve (b)
 into the normal curve (b)") (التوزيع الطبيعي ( Distribution Normal (Gaussian) One of the most important distributions in statistics is a continuous distribution called the normal distribution or Gaussian distribution. Consider the
(التوزيع الطبيعي ( Distribution Normal (Gaussian) One of the most important distributions in statistics is a continuous distribution called the normal distribution or Gaussian distribution. Consider the
Prepare a stem-and-leaf graph for the following data. In your final display, you should arrange the leaves for each stem in increasing order.
 Chapter 2 2.1 Descriptive Statistics A stem-and-leaf graph, also called a stemplot, allows for a nice overview of quantitative data without losing information on individual observations. It can be a good
Stat 528 (Autumn 2008) Density Curves and the Normal Distribution. Measures of center and spread. Features of the normal distribution
 Density Curves and the Normal Distribution. Measures of center and spread. Features of the normal distribution") Stat 528 (Autumn 2008) Density Curves and the Normal Distribution Reading: Section 1.3 Density curves An example: GRE scores Measures of center and spread The normal distribution Features of the normal
Stat 528 (Autumn 2008) Density Curves and the Normal Distribution Reading: Section 1.3 Density curves An example: GRE scores Measures of center and spread The normal distribution Features of the normal
Introduction to Geospatial Analysis
 Introduction to Geospatial Analysis Introduction to Geospatial Analysis 1 Descriptive Statistics Descriptive statistics. 2 What and Why? Descriptive Statistics Quantitative description of data Why? Allow
Density Curve (p52) Density curve is a curve that - is always on or above the horizontal axis.
 Density curve is a curve that - is always on or above the horizontal axis.") 1.3 Density curves p50 Some times the overall pattern of a large number of observations is so regular that we can describe it by a smooth curve. It is easier to work with a smooth curve, because the histogram
1.3 Density curves p50 Some times the overall pattern of a large number of observations is so regular that we can describe it by a smooth curve. It is easier to work with a smooth curve, because the histogram
Applied Statistics for the Behavioral Sciences
 Applied Statistics for the Behavioral Sciences Chapter 2 Frequency Distributions and Graphs Chapter 2 Outline Organization of Data Simple Frequency Distributions Grouped Frequency Distributions Graphs
Table of Contents (As covered from textbook)
") Table of Contents (As covered from textbook) Ch 1 Data and Decisions Ch 2 Displaying and Describing Categorical Data Ch 3 Displaying and Describing Quantitative Data Ch 4 Correlation and Linear Regression
Table of Contents (As covered from textbook) Ch 1 Data and Decisions Ch 2 Displaying and Describing Categorical Data Ch 3 Displaying and Describing Quantitative Data Ch 4 Correlation and Linear Regression
1.3 Graphical Summaries of Data
 Arkansas Tech University MATH 3513: Applied Statistics I Dr. Marcel B. Finan 1.3 Graphical Summaries of Data In the previous section we discussed numerical summaries of either a sample or a data. In this
CHAPTER 2: SAMPLING AND DATA
 CHAPTER 2: SAMPLING AND DATA This presentation is based on material and graphs from Open Stax and is copyrighted by Open Stax and Georgia Highlands College. OUTLINE 2.1 Stem-and-Leaf Graphs (Stemplots),
Overview. Frequency Distributions. Chapter 2 Summarizing & Graphing Data. Descriptive Statistics. Inferential Statistics. Frequency Distribution
 Chapter 2 Summarizing & Graphing Data Slide 1 Overview Descriptive Statistics Slide 2 A) Overview B) Frequency Distributions C) Visualizing Data summarize or describe the important characteristics of a
Chapter 2: Descriptive Statistics
 Chapter 2: Descriptive Statistics Student Learning Outcomes By the end of this chapter, you should be able to: Display data graphically and interpret graphs: stemplots, histograms and boxplots. Recognize,
Measures of Dispersion
 Lesson 7.6 Objectives Find the variance of a set of data. Calculate standard deviation for a set of data. Read data from a normal curve. Estimate the area under a curve. Variance Measures of Dispersion
Basic Statistical Terms and Definitions
 I. Basics Basic Statistical Terms and Definitions Statistics is a collection of methods for planning experiments, and obtaining data. The data is then organized and summarized so that professionals can
Raw Data is data before it has been arranged in a useful manner or analyzed using statistical techniques.
 Section 2.1 - Introduction Graphs are commonly used to organize, summarize, and analyze collections of data. Using a graph to visually present a data set makes it easy to comprehend and to describe the
NOTES TO CONSIDER BEFORE ATTEMPTING EX 1A TYPES OF DATA
 NOTES TO CONSIDER BEFORE ATTEMPTING EX 1A TYPES OF DATA Statistics is concerned with scientific methods of collecting, recording, organising, summarising, presenting and analysing data from which future
Learner Expectations UNIT 1: GRAPICAL AND NUMERIC REPRESENTATIONS OF DATA. Sept. Fathom Lab: Distributions and Best Methods of Display
 CURRICULUM MAP TEMPLATE Priority Standards = Approximately 70% Supporting Standards = Approximately 20% Additional Standards = Approximately 10% HONORS PROBABILITY AND STATISTICS Essential Questions &
Averages and Variation
 Averages and Variation 3 Copyright Cengage Learning. All rights reserved. 3.1-1 Section 3.1 Measures of Central Tendency: Mode, Median, and Mean Copyright Cengage Learning. All rights reserved. 3.1-2 Focus
STA Rev. F Learning Objectives. Learning Objectives (Cont.) Module 3 Descriptive Measures
 Module 3 Descriptive Measures") STA 2023 Module 3 Descriptive Measures Learning Objectives Upon completing this module, you should be able to: 1. Explain the purpose of a measure of center. 2. Obtain and interpret the mean, median, and
STA 2023 Module 3 Descriptive Measures Learning Objectives Upon completing this module, you should be able to: 1. Explain the purpose of a measure of center. 2. Obtain and interpret the mean, median, and
Making Science Graphs and Interpreting Data
 Making Science Graphs and Interpreting Data Eye Opener: 5 mins What do you see? What do you think? Look up terms you don t know What do Graphs Tell You? A graph is a way of expressing a relationship between
Statistical Methods. Instructor: Lingsong Zhang. Any questions, ask me during the office hour, or me, I will answer promptly.
 Statistical Methods Instructor: Lingsong Zhang 1 Issues before Class Statistical Methods Lingsong Zhang Office: Math 544 Email: lingsong@purdue.edu Phone: 765-494-7913 Office Hour: Monday 1:00 pm - 2:00
STA 570 Spring Lecture 5 Tuesday, Feb 1
 STA 570 Spring 2011 Lecture 5 Tuesday, Feb 1 Descriptive Statistics Summarizing Univariate Data o Standard Deviation, Empirical Rule, IQR o Boxplots Summarizing Bivariate Data o Contingency Tables o Row
Use of GeoGebra in teaching about central tendency and spread variability
 CREAT. MATH. INFORM. 21 (2012), No. 1, 57-64 Online version at http://creative-mathematics.ubm.ro/ Print Edition: ISSN 1584-286X Online Edition: ISSN 1843-441X Use of GeoGebra in teaching about central
How individual data points are positioned within a data set.
 Section 3.4 Measures of Position Percentiles How individual data points are positioned within a data set. P k is the value such that k% of a data set is less than or equal to P k. For example if we said
LAB 1 INSTRUCTIONS DESCRIBING AND DISPLAYING DATA
 LAB 1 INSTRUCTIONS DESCRIBING AND DISPLAYING DATA This lab will assist you in learning how to summarize and display categorical and quantitative data in StatCrunch. In particular, you will learn how to
Unit 7 Statistics. AFM Mrs. Valentine. 7.1 Samples and Surveys
 Unit 7 Statistics AFM Mrs. Valentine 7.1 Samples and Surveys v Obj.: I will understand the different methods of sampling and studying data. I will be able to determine the type used in an example, and
Things you ll know (or know better to watch out for!) when you leave in December: 1. What you can and cannot infer from graphs.
 when you leave in December: 1. What you can and cannot infer from graphs.") 1 2 Things you ll know (or know better to watch out for!) when you leave in December: 1. What you can and cannot infer from graphs. 2. How to construct (in your head!) and interpret confidence intervals.
1 2 Things you ll know (or know better to watch out for!) when you leave in December: 1. What you can and cannot infer from graphs. 2. How to construct (in your head!) and interpret confidence intervals.
MATH& 146 Lesson 10. Section 1.6 Graphing Numerical Data
 MATH& 146 Lesson 10 Section 1.6 Graphing Numerical Data 1 Graphs of Numerical Data One major reason for constructing a graph of numerical data is to display its distribution, or the pattern of variability
Data Mining Chapter 3: Visualizing and Exploring Data Fall 2011 Ming Li Department of Computer Science and Technology Nanjing University
 Data Mining Chapter 3: Visualizing and Exploring Data Fall 2011 Ming Li Department of Computer Science and Technology Nanjing University Exploratory data analysis tasks Examine the data, in search of structures
Lecture Slides. Elementary Statistics Twelfth Edition. by Mario F. Triola. and the Triola Statistics Series. Section 2.1- #
 Lecture Slides Elementary Statistics Twelfth Edition and the Triola Statistics Series by Mario F. Triola Chapter 2 Summarizing and Graphing Data 2-1 Review and Preview 2-2 Frequency Distributions 2-3 Histograms
Data Preprocessing. S1 Teknik Informatika Fakultas Teknologi Informasi Universitas Kristen Maranatha
 Data Preprocessing S1 Teknik Informatika Fakultas Teknologi Informasi Universitas Kristen Maranatha 1 Why Data Preprocessing? Data in the real world is dirty incomplete: lacking attribute values, lacking
Section 2-2 Frequency Distributions. Copyright 2010, 2007, 2004 Pearson Education, Inc
 Section 2-2 Frequency Distributions Copyright 2010, 2007, 2004 Pearson Education, Inc. 2.1-1 Frequency Distribution Frequency Distribution (or Frequency Table) It shows how a data set is partitioned among
Learning Log Title: CHAPTER 7: PROPORTIONS AND PERCENTS. Date: Lesson: Chapter 7: Proportions and Percents
 Chapter 7: Proportions and Percents CHAPTER 7: PROPORTIONS AND PERCENTS Date: Lesson: Learning Log Title: Date: Lesson: Learning Log Title: Chapter 7: Proportions and Percents Date: Lesson: Learning Log
Acquisition Description Exploration Examination Understanding what data is collected. Characterizing properties of data.
 Summary Statistics Acquisition Description Exploration Examination what data is collected Characterizing properties of data. Exploring the data distribution(s). Identifying data quality problems. Selecting
Univariate Statistics Summary
 Further Maths Univariate Statistics Summary Types of Data Data can be classified as categorical or numerical. Categorical data are observations or records that are arranged according to category. For example:
STA Module 4 The Normal Distribution
 STA 2023 Module 4 The Normal Distribution Learning Objectives Upon completing this module, you should be able to 1. Explain what it means for a variable to be normally distributed or approximately normally
STA /25/12. Module 4 The Normal Distribution. Learning Objectives. Let s Look at Some Examples of Normal Curves
 STA 2023 Module 4 The Normal Distribution Learning Objectives Upon completing this module, you should be able to 1. Explain what it means for a variable to be normally distributed or approximately normally
Lecture 6: Chapter 6 Summary
 1 Lecture 6: Chapter 6 Summary Z-score: Is the distance of each data value from the mean in standard deviation Standardizes data values Standardization changes the mean and the standard deviation: o Z
Measures of Position
 Measures of Position In this section, we will learn to use fractiles. Fractiles are numbers that partition, or divide, an ordered data set into equal parts (each part has the same number of data entries).
Chapter 2. Descriptive Statistics: Organizing, Displaying and Summarizing Data
 Chapter 2 Descriptive Statistics: Organizing, Displaying and Summarizing Data Objectives Student should be able to Organize data Tabulate data into frequency/relative frequency tables Display data graphically
The basic arrangement of numeric data is called an ARRAY. Array is the derived data from fundamental data Example :- To store marks of 50 student
 Organizing data Learning Outcome 1. make an array 2. divide the array into class intervals 3. describe the characteristics of a table 4. construct a frequency distribution table 5. constructing a composite
SLStats.notebook. January 12, Statistics:
 Statistics: 1 2 3 Ways to display data: 4 generic arithmetic mean sample 14A: Opener, #3,4 (Vocabulary, histograms, frequency tables, stem and leaf) 14B.1: #3,5,8,9,11,12,14,15,16 (Mean, median, mode,
Integrated Mathematics I Performance Level Descriptors
 Limited A student performing at the Limited Level demonstrates a minimal command of Ohio s Learning Standards for Integrated Mathematics I. A student at this level has an emerging ability to demonstrate
Chapter 2: The Normal Distribution
 Chapter 2: The Normal Distribution 2.1 Density Curves and the Normal Distributions 2.2 Standard Normal Calculations 1 2 Histogram for Strength of Yarn Bobbins 15.60 16.10 16.60 17.10 17.60 18.10 18.60
/4 Directions: Graph the functions, then answer the following question.
 1.) Graph y = x. Label the graph. Standard: F-BF.3 Identify the effect on the graph of replacing f(x) by f(x) +k, k f(x), f(kx), and f(x+k), for specific values of k; find the value of k given the graphs.
Learning Objectives. Continuous Random Variables & The Normal Probability Distribution. Continuous Random Variable
 Learning Objectives Continuous Random Variables & The Normal Probability Distribution 1. Understand characteristics about continuous random variables and probability distributions 2. Understand the uniform
Minitab 17 commands Prepared by Jeffrey S. Simonoff
 Minitab 17 commands Prepared by Jeffrey S. Simonoff Data entry and manipulation To enter data by hand, click on the Worksheet window, and enter the values in as you would in any spreadsheet. To then save
MATH 1070 Introductory Statistics Lecture notes Descriptive Statistics and Graphical Representation
 MATH 1070 Introductory Statistics Lecture notes Descriptive Statistics and Graphical Representation Objectives: 1. Learn the meaning of descriptive versus inferential statistics 2. Identify bar graphs,
This chapter will show how to organize data and then construct appropriate graphs to represent the data in a concise, easy-to-understand form.
 CHAPTER 2 Frequency Distributions and Graphs Objectives Organize data using frequency distributions. Represent data in frequency distributions graphically using histograms, frequency polygons, and ogives.
UNIT 15 GRAPHICAL PRESENTATION OF DATA-I
 UNIT 15 GRAPHICAL PRESENTATION OF DATA-I Graphical Presentation of Data-I Structure 15.1 Introduction Objectives 15.2 Graphical Presentation 15.3 Types of Graphs Histogram Frequency Polygon Frequency Curve
IT 403 Practice Problems (1-2) Answers
 Answers") IT 403 Practice Problems (1-2) Answers #1. Using Tukey's Hinges method ('Inclusionary'), what is Q3 for this dataset? 2 3 5 7 11 13 17 a. 7 b. 11 c. 12 d. 15 c (12) #2. How do quartiles and percentiles
IT 403 Practice Problems (1-2) Answers #1. Using Tukey's Hinges method ('Inclusionary'), what is Q3 for this dataset? 2 3 5 7 11 13 17 a. 7 b. 11 c. 12 d. 15 c (12) #2. How do quartiles and percentiles
Chapter 3 - Displaying and Summarizing Quantitative Data
 Chapter 3 - Displaying and Summarizing Quantitative Data 3.1 Graphs for Quantitative Data (LABEL GRAPHS) August 25, 2014 Histogram (p. 44) - Graph that uses bars to represent different frequencies or relative
Chapter 2 - Graphical Summaries of Data
 Chapter 2 - Graphical Summaries of Data Data recorded in the sequence in which they are collected and before they are processed or ranked are called raw data. Raw data is often difficult to make sense
Chapter 2: Modeling Distributions of Data
 Chapter 2: Modeling Distributions of Data Section 2.2 The Practice of Statistics, 4 th edition - For AP* STARNES, YATES, MOORE Chapter 2 Modeling Distributions of Data 2.1 Describing Location in a Distribution
Name: Date: Period: Chapter 2. Section 1: Describing Location in a Distribution
 Name: Date: Period: Chapter 2 Section 1: Describing Location in a Distribution Suppose you earned an 86 on a statistics quiz. The question is: should you be satisfied with this score? What if it is the
Lesson 18-1 Lesson Lesson 18-1 Lesson Lesson 18-2 Lesson 18-2
 Topic 18 Set A Words survey data Topic 18 Set A Words Lesson 18-1 Lesson 18-1 sample line plot Lesson 18-1 Lesson 18-1 frequency table bar graph Lesson 18-2 Lesson 18-2 Instead of making 2-sided copies
ECLT 5810 Data Preprocessing. Prof. Wai Lam
 ECLT 5810 Data Preprocessing Prof. Wai Lam Why Data Preprocessing? Data in the real world is imperfect incomplete: lacking attribute values, lacking certain attributes of interest, or containing only aggregate
CHAPTER 2 Modeling Distributions of Data
 CHAPTER 2 Modeling Distributions of Data 2.2 Density Curves and Normal Distributions The Practice of Statistics, 5th Edition Starnes, Tabor, Yates, Moore Bedford Freeman Worth Publishers Density Curves
CHAPTER-13. Mining Class Comparisons: Discrimination between DifferentClasses: 13.4 Class Description: Presentation of Both Characterization and
 CHAPTER-13 Mining Class Comparisons: Discrimination between DifferentClasses: 13.1 Introduction 13.2 Class Comparison Methods and Implementation 13.3 Presentation of Class Comparison Descriptions 13.4
Middle Years Data Analysis Display Methods
 Middle Years Data Analysis Display Methods Double Bar Graph A double bar graph is an extension of a single bar graph. Any bar graph involves categories and counts of the number of people or things (frequency)
CHAPTER 3: Data Description
 CHAPTER 3: Data Description You ve tabulated and made pretty pictures. Now what numbers do you use to summarize your data? Ch3: Data Description Santorico Page 68 You ll find a link on our website to a
Chapter2 Description of samples and populations. 2.1 Introduction.
 Chapter2 Description of samples and populations. 2.1 Introduction. Statistics=science of analyzing data. Information collected (data) is gathered in terms of variables (characteristics of a subject that
Chapter 6: DESCRIPTIVE STATISTICS
 Chapter 6: DESCRIPTIVE STATISTICS Random Sampling Numerical Summaries Stem-n-Leaf plots Histograms, and Box plots Time Sequence Plots Normal Probability Plots Sections 6-1 to 6-5, and 6-7 Random Sampling
Courtesy :
 STATISTICS The Nature of Statistics Introduction Statistics is the science of data Statistics is the science of conducting studies to collect, organize, summarize, analyze, and draw conclusions from data.
Lecture 3 Questions that we should be able to answer by the end of this lecture:
 Lecture 3 Questions that we should be able to answer by the end of this lecture: Which is the better exam score? 67 on an exam with mean 50 and SD 10 or 62 on an exam with mean 40 and SD 12 Is it fair
1.2. Pictorial and Tabular Methods in Descriptive Statistics
 1.2. Pictorial and Tabular Methods in Descriptive Statistics Section Objectives. 1. Stem-and-Leaf displays. 2. Dotplots. 3. Histogram. Types of histogram shapes. Common notation. Sample size n : the number
10.4 Measures of Central Tendency and Variation
 10.4 Measures of Central Tendency and Variation Mode-->The number that occurs most frequently; there can be more than one mode ; if each number appears equally often, then there is no mode at all. (mode
10.4 Measures of Central Tendency and Variation
 10.4 Measures of Central Tendency and Variation Mode-->The number that occurs most frequently; there can be more than one mode ; if each number appears equally often, then there is no mode at all. (mode
Chapter 2: Looking at Multivariate Data
 Chapter 2: Looking at Multivariate Data Multivariate data could be presented in tables, but graphical presentations are more effective at displaying patterns. We can see the patterns in one variable at
Lecture 3 Questions that we should be able to answer by the end of this lecture:
 Lecture 3 Questions that we should be able to answer by the end of this lecture: Which is the better exam score? 67 on an exam with mean 50 and SD 10 or 62 on an exam with mean 40 and SD 12 Is it fair
WELCOME! Lecture 3 Thommy Perlinger
 Quantitative Methods II WELCOME! Lecture 3 Thommy Perlinger Program Lecture 3 Cleaning and transforming data Graphical examination of the data Missing Values Graphical examination of the data It is important
Measures of Dispersion
 Measures of Dispersion 6-3 I Will... Find measures of dispersion of sets of data. Find standard deviation and analyze normal distribution. Day 1: Dispersion Vocabulary Measures of Variation (Dispersion
Frequency distribution
 Frequency distribution In order to describe situations, draw conclusions, or make inferences about events, the researcher must organize the data in some meaningful way. The most convenient method of organizing
MATH11400 Statistics Homepage
 MATH11400 Statistics 1 2010 11 Homepage http://www.stats.bris.ac.uk/%7emapjg/teach/stats1/ 1.1 A Framework for Statistical Problems Many statistical problems can be described by a simple framework in which
STA Module 2B Organizing Data and Comparing Distributions (Part II)
") STA 2023 Module 2B Organizing Data and Comparing Distributions (Part II) Learning Objectives Upon completing this module, you should be able to 1 Explain the purpose of a measure of center 2 Obtain and
STA 2023 Module 2B Organizing Data and Comparing Distributions (Part II) Learning Objectives Upon completing this module, you should be able to 1 Explain the purpose of a measure of center 2 Obtain and
STA Learning Objectives. Learning Objectives (cont.) Module 2B Organizing Data and Comparing Distributions (Part II)
 Module 2B Organizing Data and Comparing Distributions (Part II)") STA 2023 Module 2B Organizing Data and Comparing Distributions (Part II) Learning Objectives Upon completing this module, you should be able to 1 Explain the purpose of a measure of center 2 Obtain and
STA 2023 Module 2B Organizing Data and Comparing Distributions (Part II) Learning Objectives Upon completing this module, you should be able to 1 Explain the purpose of a measure of center 2 Obtain and
Fathom Dynamic Data TM Version 2 Specifications
 Data Sources Fathom Dynamic Data TM Version 2 Specifications Use data from one of the many sample documents that come with Fathom. Enter your own data by typing into a case table. Paste data from other
2.1: Frequency Distributions and Their Graphs
 2.1: Frequency Distributions and Their Graphs Frequency Distribution - way to display data that has many entries - table that shows classes or intervals of data entries and the number of entries in each
BUSINESS DECISION MAKING. Topic 1 Introduction to Statistical Thinking and Business Decision Making Process; Data Collection and Presentation
 BUSINESS DECISION MAKING Topic 1 Introduction to Statistical Thinking and Business Decision Making Process; Data Collection and Presentation (Chap 1 The Nature of Probability and Statistics) (Chap 2 Frequency
Lecture Slides. Elementary Statistics Tenth Edition. by Mario F. Triola. and the Triola Statistics Series. Slide 1
 Lecture Slides Elementary Statistics Tenth Edition and the Triola Statistics Series by Mario F. Triola Slide 1 Chapter 2 Summarizing and Graphing Data 2-1 Overview 2-2 Frequency Distributions 2-3 Histograms
Probability and Statistics. Copyright Cengage Learning. All rights reserved.
 Probability and Statistics Copyright Cengage Learning. All rights reserved. 14.6 Descriptive Statistics (Graphical) Copyright Cengage Learning. All rights reserved. Objectives Data in Categories Histograms
Chapter 2 Modeling Distributions of Data
 Chapter 2 Modeling Distributions of Data Section 2.1 Describing Location in a Distribution Describing Location in a Distribution Learning Objectives After this section, you should be able to: FIND and
Chapter 5: The standard deviation as a ruler and the normal model p131
 Chapter 5: The standard deviation as a ruler and the normal model p131 Which is the better exam score? 67 on an exam with mean 50 and SD 10 62 on an exam with mean 40 and SD 12? Is it fair to say: 67 is
Slide Copyright 2005 Pearson Education, Inc. SEVENTH EDITION and EXPANDED SEVENTH EDITION. Chapter 13. Statistics Sampling Techniques
 SEVENTH EDITION and EXPANDED SEVENTH EDITION Slide - Chapter Statistics. Sampling Techniques Statistics Statistics is the art and science of gathering, analyzing, and making inferences from numerical information
Descriptive Statistics
 Chapter 2 Descriptive Statistics 2.1 Descriptive Statistics 1 2.1.1 Student Learning Objectives By the end of this chapter, the student should be able to: Display data graphically and interpret graphs:
Your Name: Section: INTRODUCTION TO STATISTICAL REASONING Computer Lab #4 Scatterplots and Regression
 Your Name: Section: 36-201 INTRODUCTION TO STATISTICAL REASONING Computer Lab #4 Scatterplots and Regression Objectives: 1. To learn how to interpret scatterplots. Specifically you will investigate, using